 Wei Li
 Jianni Yi1
 Yutie Jiao
95% of researchers rate our articles as excellent or good
Learn more about the work of our research integrity team to safeguard the quality of each article we publish.
Find out more
METHODS article
Front. Earth Sci. , 28 August 2023
Sec. Hydrosphere
Volume 11 - 2023 | https://doi.org/10.3389/feart.2023.1238394
This article is part of the Research Topic Risk Assessment and Management of Water Conservancy Projects View all 16 articles
Dam failure risk standards are the foundation of risk decision-making for dam managers. However, as an important component of dam failure risk standards, there are currently no unified environmental risk standards. Drawing on research ideas of ecological economics on ecosystem service values and equivalent factor methods, this study quantified environmental values and effectively connected environmental standards with existing standards using the ALARP principle and the F-N curve. Considering the differences in environmental and economic conditions in different regions, a risk preference matrix was constructed to determine the risk preference of each region and formulate the dam failure environmental risk standards for China. This study presents a preliminary exploration of the formulation of dam failure environmental risk standards, providing new methods and ideas for subsequent research.
Recently, owing to frequent extreme weather events and the increasing occurrence of flood events exceeding standards, and problems such as design defects, poor construction quality, and inadequate operation and management of many reservoir dams in China, dam collapses occur occasionally (Chen Junfei et al., 2020; Xu et al., 2022). With continuous social and economic development, people are paying attention to the quality of their living environments (Tu et al., 2023). Environmental standards for dam collapse form the basis for environmental risk assessments and decision-making. Developing reasonable ecological environment risk standards is conducive to helping decision makers fully understand the risk level of dams to ensure scientific risk decisions, and has important significance for improving the evaluation system for the consequences of dam collapse risks and the theoretical management of dam risks (He et al., 2020).
Currently, there is no unified environmental standard for dam collapses (Li et al., 2019; Ge Wei. et al., 2020). This is primarily because the environmental scope of a dam collapse is wide, and there are many influencing factors. Furthermore, there is no unified dimensionality, making it difficult to quantify environmental values. Compared with the loss of life and economic losses caused by dam collapse, little attention has been paid to the environmental impact of dam collapse in previous studies. Therefore, most current research focuses on the construction of dam collapse indicator systems and mathematical method analysis. For example, Wang et al. (2006) believed that common environmental impacts refer to changes in environmental conditions caused by developmental activities or the formation of new environmental conditions. The environmental impacts of dam collapses mainly include those on river morphology, loss of habitats for organisms and their growth, destruction of human landscapes, and industrial impacts that are susceptible to or cause considerable environmental effects or pollution, and define an impact index to evaluate risk size. He et al. (2008) believed that environmental impact refers to changes in environmental conditions in the area near the reservoir caused by dam collapses, which are specifically reflected in the impact on water, soil, ecology, and human habitats; they applied the Analytic Hierarchy Process and fuzzy mathematics to evaluate risk size. Francisco and Gallardo Izquierdo (2008) believed that environmental risk is primarily related to the erosion of the underlying surface of the dam, seepage, and pollution load, and defined the environmental safety index of the dam to calculate environmental risk. Cheng and Zhou (2013) believed that environmental impact refers to the effects of human activities, including economic and social activities, on the environment, and the resulting changes in the environment. Seven factors–river morphology, water environment, soil environment, vegetation cover, biodiversity, human environment, and pollution industry–were selected for analyzing the environmental impact of dam collapses, and the fuzzy mathematics theory was applied for environmental risk assessment. Xu et al. (2013) analyzed the environmental impact based on factors such as land-carrying capacity, water quality, reservoir siltation, downstream riverbed erosion, and earthquake geological hazards. These studies determined the factors of environmental impact and provide an important research basis for environmental assessment.
The above mentioned methods can be effectively used to rank the severity of environmental impacts caused by dam failures. However, they cannot provide specific representations of the consequences (typically categorized into 3–5 levels of severity), and are therefore semi-quantitative evaluations that may not be universally applicable. To achieve a quantitative representation of the environmental value of dam failures, the energy footprint method was introduced for the risk assessment of the environmental impacts of dam failure. This method is commonly used in ecological impact assessments (Binod et al., 2019; Chen Shurui et al., 2020; Yang et al., 2020). However, the scientific validity and accuracy of the energy conversion rate and energy conversion coefficients still require improvement. Meanwhile, the quantification of Ecosystem Service Value (ESV) based on the equivalent factor method is intuitive, widely used, and requires little data, making it suitable for regional- or global-scale environmental value assessments (Chen et al., 2023; Yang et al., 2023; Zhang et al., 2023).
The essence of the environmental impact is the change in the natural environment and ecological conditions of areas near the reservoir, caused by dam failure. Natural and ecological environments are composed of two parts, biotic and abiotic. Natural ecosystems provide various raw materials or products directly for survival (food, water, oxygen, wood, fibers, etc.) and regulate the climate, purify pollution, retain water sources, maintain soil and water, prevent wind and sand, reduce disasters, and protect biodiversity on a large scale (Enes and Ibrahim, 2022). Through its functions, the natural ecosystem continuously provides environmental conditions and material foundations for humans, creating service value (similar to the GDP created by human labor) (Langill Jennifer et al., 2022). Therefore, from the human perspective, the concept of environmental impact caused by dam failures can be defined as the destruction of the natural ecosystem service supply, resulting in a reduction in the output of ecosystem service value.
Based on the equivalent factor method for quantifying environmental values, this study explored the preliminary construction of China’s regional dam break environmental risk standards using the ALARP principle, F-N curve method, and risk matrix, providing a new approach and method for subsequent research.
No system carries risks that cannot be eliminated completely through preventive measures. Although the lower the risk of a system the higher the level of security, it is increasingly difficult and costly to further reduce the risk level. Given China’s economic and social development level and the public’s willingness to accept risks, a trade-off can be made between the risk level and the cost of a system. Therefore, the ALARP principle was selected to establish risk standards in China.
This principle stands divides risks into three zones: intolerable, ALARP, and broadly acceptable (Langdalen et al., 2020). If the risk falls into an intolerable zone, measures must be taken to reduce the risk. If it falls into the ALARP zone, taking risk control measures depends on whether risk reduction is feasible and whether the benefits outweigh the costs. If a risk falls into the broadly acceptable zone, no risk-control measures are required. This principle is illustrated in Figure 1.
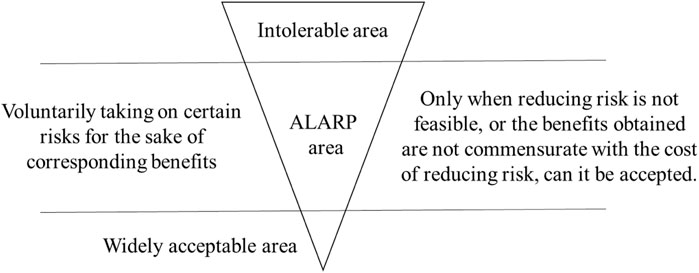
FIGURE 1. ALARP guidelines.
In 1967, Farmer proposed a limit curve for the acceptable risk of various accident types using probability theory, known as the famous F-N curve (Pei et al., 2018). The F-N curve is a limiting curve based on probability theory that allows various accidents to occur. It is based on probabilistic analysis and expected benefits, and takes into account the current state of risk in which it is located as well as people’s aversion to risk, and it is highly scientific and versatile. It was first used for risk assessment in nuclear power plants and was later widely applied in the construction of social life risk standards for dam engineering. The expression for this curve is as follows:
where FN(x) is the distribution function of the annual mortality rate, representing the probability of x deaths; 1−FN(x) is the probability of ≤N deaths; C is a constant that determines the position of the risk control line; and n is the slope that represents the degree of aversion to risk, with a larger slope indicating greater ecosystem to risk and less acceptability.
According to the Chinese State Council’s “Regulations on Reporting and Investigating Production Safety Accidents,” one death is equivalent to a direct economic loss of 3.3–5 million RMB (Li et al., 2015). Therefore, it is suggested to construct China’s economic risk standards for reservoir dams based on a ratio of 4 million RMB per person. Although measuring human life values in economic terms is often considered inhumane and has gained strong criticism and opposition, it is reasonable to use life risk standards as a basis for constructing economic risk standards under the premise of controlling life risks at socially acceptable levels.
Constructing the environmental risk criteria for dam failure on the basis of the life and economic risk criteria avoids over-complicating the criteria on the one hand, and on the other hand allows for a strong correlation between the different criteria. Therefore, it is proposed to analyze the economic perspective by simplifying the environmental loss to the money needed to compensate the environmental risk, then the relationship between the loss of environmental value and its exceeding probability is as follows:
where
The Equivalent Factor Method is quantitative and based on expert knowledge. It is used to estimate the Ecosystem Service Value (ESV) (Zhang et al., 2022). One standard ecological value equivalent factor is defined as the economic value of natural food production per hectare of farmland with a national average yield (Cao et al., 2021). This reflects the potential contribution of ecosystems to ecological services. Food production reflects the value of the agricultural ecosystem, and the economic value of food production is primarily calculated based on three major grain crops: rice, wheat, and maize. The formula is as follows:
Where D represents the environmental value of one standard equivalent factor (in yuan per hectare); Sr, Sw, and Sm represent the percentage of the planting area of rice, wheat, and maize, respectively, in the total planting area of the three crops; and Fr, Fw, and Fm represent the average net profit per hectare of rice, wheat, and maize, respectively, in China. The basic equivalent factor was determined to be 1482.67 yuan based on the data from China Statistical Yearbook 2017, 2018, and 2019 (National Bureau of statistics of the people’s Republic of China, 2019), and the Compilation of National Agricultural Cost and Benefit Data (National Development Planning Commission, 2019).
Based on previous research results and expert experience, we constructed basic equivalent factors for different types of ecosystems and different types of environmental values, as shown in Table 1. Land-use remote sensing data were used to correspond farmland ecosystems to agricultural land types and wetland ecosystems to swamp land types. The average equivalent factors for forest, grassland, water, and desert ecosystems in the second level of classification were used as the calculation factors for the forest, grassland, water, and unused land (excluding swamp land) types in the remote sensing data. Based on Table 1, the ESV for each region in China in 2020 were calculated as shown in Figure 2.
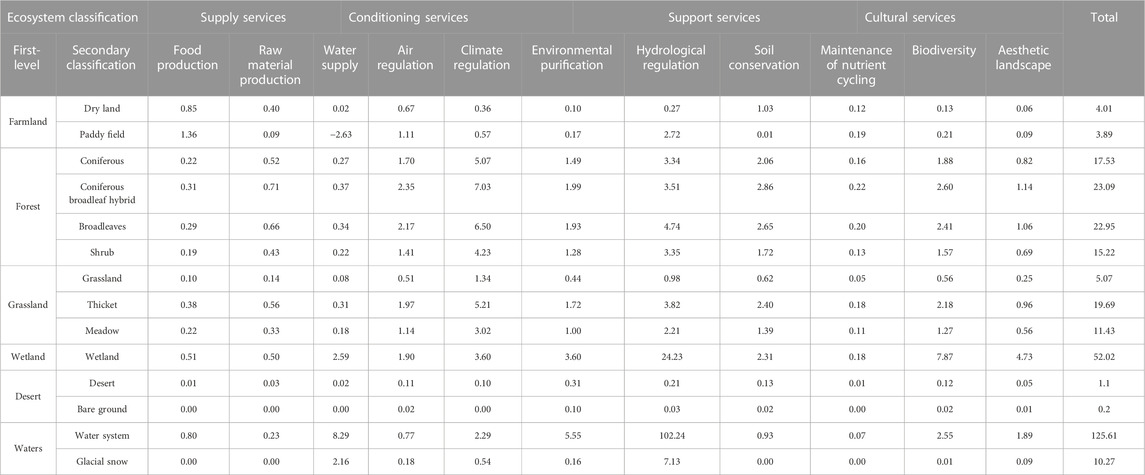
TABLE 1. Equivalent value of ecosystem services per unit area.
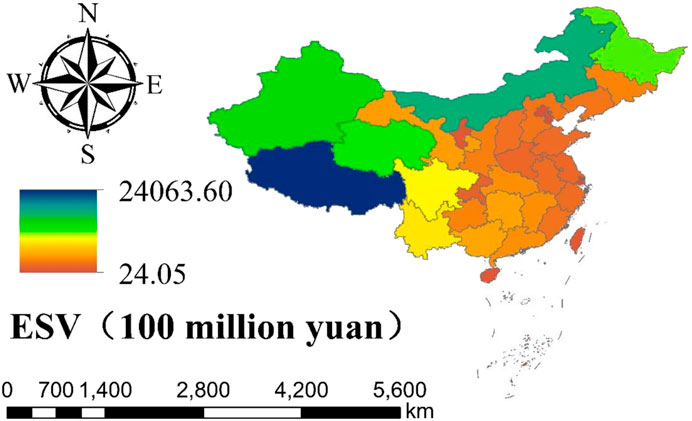
FIGURE 2. Distribution of ESV in each province.
Owing to substantial differences in politics, economics, culture, and other aspects among different countries (Li et al., 2018; Ge et al., 2020b), foreign risk standards cannot be directly applied to China (Ge et al., 2017; Ge et al., 2020c). Based on relevant domestic and foreign achievements and China’s national conditions, the following principles were used to construct risk standards for dams:
(1) Compliance with the safety status of Chinese dams. Several of China’s active reservoir dams were built from the 1950s to the 1970s. They were limited by economic and technological levels at that time, and several have hidden safety hazards. If standards are too strict, more reservoirs will be classified as “dangerous or sick.” In the current situation, where funding is relatively tight, several reservoirs will not be able to receive timely reinforcement against risks and will be forced to change operating conditions or stop operating, which will degrade the local economic development environment. It is also not conducive to effectively distinguish the degree of danger between “dangerous and sick” reservoirs.
(2) Compliance with the latest public acceptance of risks. With the increasing need for a better life for people, risk awareness is continuously increasing; in the event of equally serious accidents, the concern of the public will grow. Therefore, when formulating risk standards, both the engineering and the public’s acceptance of risks should be considered.
C is a constant that determines the starting position of the standard line. The acceptable risk C values adopted by some countries and institutions are listed in Table 2. As seen from table, the value of C is primarily 10−3/year. The values of C in Table 2 include various application categories such as nuclear power plants, hazardous chemicals, factories, all types of buildings (hospitals, schools, and residential buildings), slopes, and dams. Considering that accidents involving hazardous chemicals, factories, and buildings during new construction, reconstruction, expansion, and in-service production and storage processes are primarily caused by human factors, natural factors beyond human control are also important components of uncertainty during the construction and operation of reservoir dams. Therefore, according to the suggestion of Li et al. (2015), the standard for dam safety can be appropriately lowered to C = 10−2. The acceptable risk standard can be one order of magnitude smaller than this; thus C = 10−3.
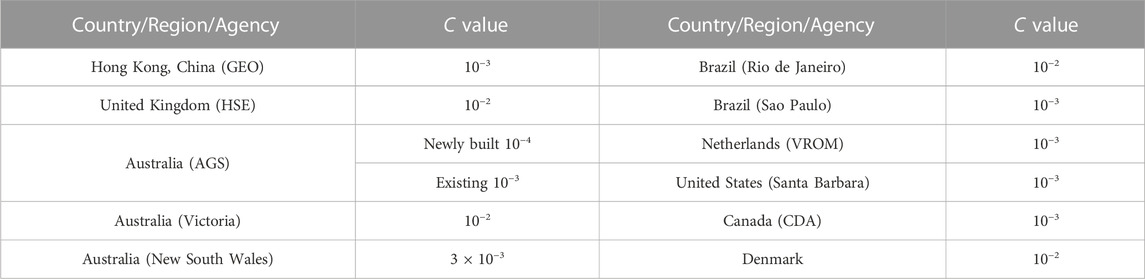
TABLE 2. Values of C adopted by some countries or institutions.
The value of n represents the degree of risk preference. Considering the vast territory of China, there may be considerable differences in economic development, ecological environment quality, and social and cultural backgrounds among the different regions. Therefore, the degree of risk preference varies across the regions; thus, a risk matrix was introduced. This method was proposed by the US Air Force Electronic Systems Center in the mid-to-late 1990s, and has been widely used in US military weapon system development projects as a structural method for identifying the importance of project risks. It can evaluate the potential risks of projects and is currently widely used in research fields, such as project risk assessment and safety risk rating (Koulinas Georgios et al., 2021).
The higher the per capita GDP in a region, the higher the demand for quality of life; and the more emphasis it places on the surrounding ecological environment, the more averse it is to risk (Francis et al., 2022). The higher the quality of the ecological environment, the higher the losses caused by disasters, and the more averse they are to risk. The per-unit area average ESV and the per capita ecological environment value reflect the ecological environment quality of a region from different perspectives. The higher the per capita ESV, the stronger sustainable development capability of the region. However, this does not necessarily mean that the ecological damage caused by disasters is more severe. For example, in areas with poor land quality, floods may not cause considerable ecological damage; however, the per capita ESV may still be relatively high because of low population density (Peter et al., 2022). Therefore, the average ESV per unit area is a better indicator of the importance of a region’s ecological environment. The higher the average ESV per unit area, the greater are the losses caused by floods. Therefore, per capita GDP and per unit area average ESV were selected to construct a risk preference matrix. Based on statistical data released by the National Bureau of Statistics in 2020 (National Bureau of statistics of the people’s Republic of China, 2020), the per capita GDP and per unit area average ESV of each province are shown in Table 3.
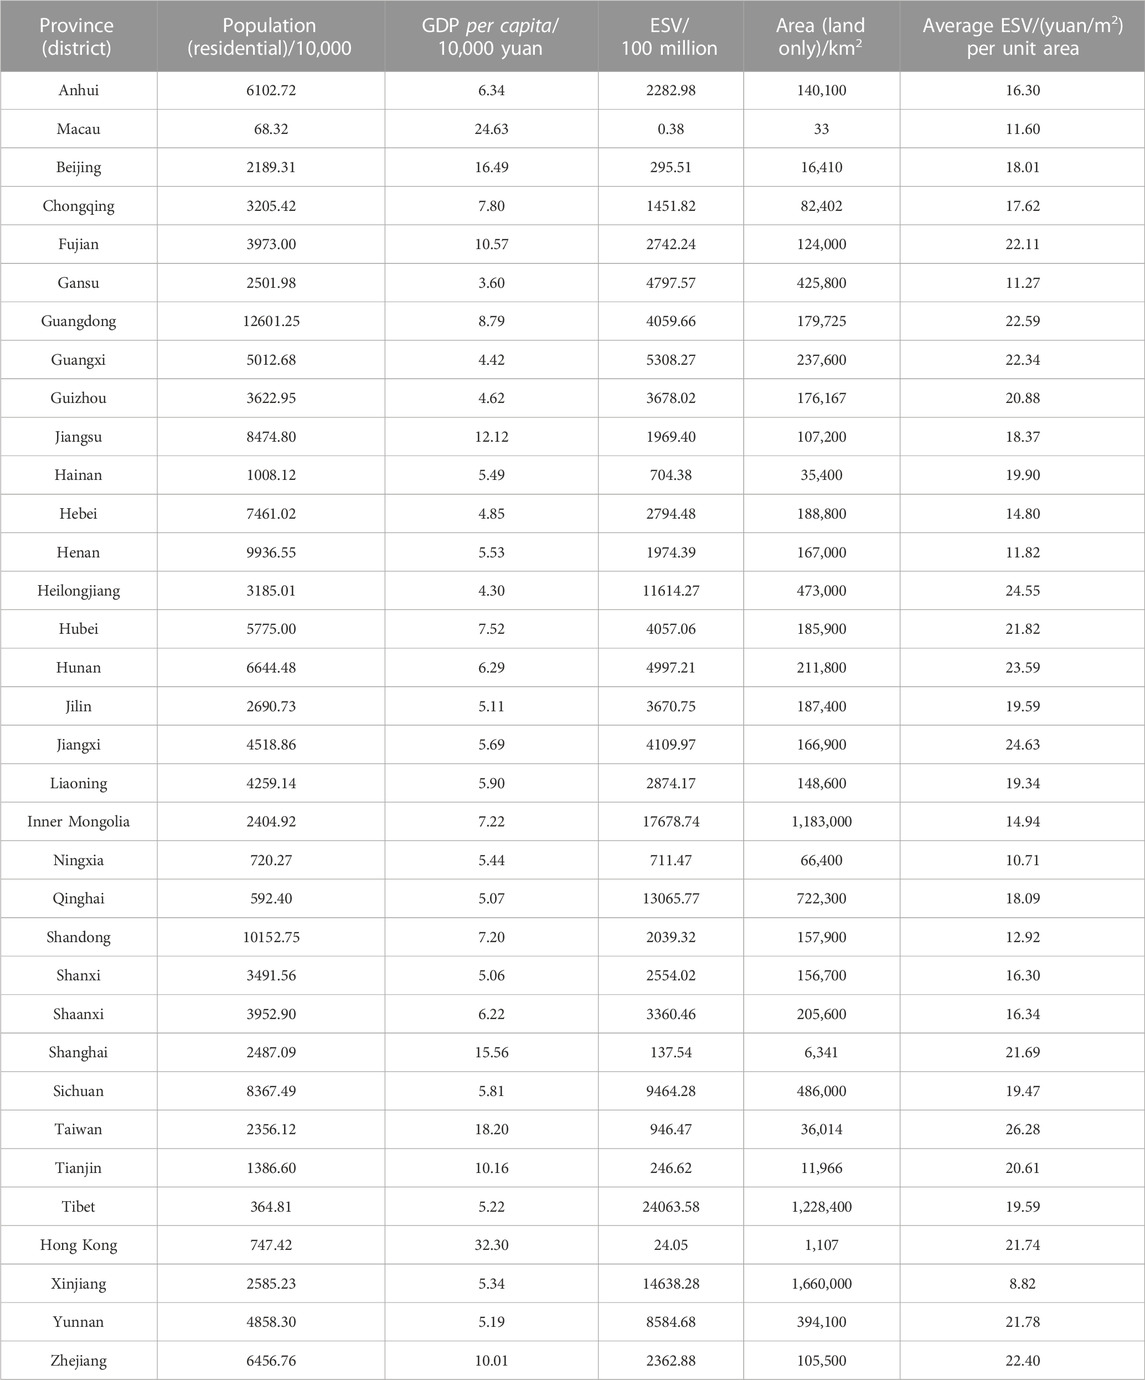
TABLE 3. Average ESV per capita GDP and unit area of each province in 2020.
According to the 2020 income classification standard of the World Bank, most provinces in China have an annual per capita income in the middle-to high-income range, whereas the remaining provinces have a per capita income in the high-income range (Shah et al., 2022). To differentiate the per capita GDP income of each province more precisely, the middle-to high-income range was evenly divided into three categories: 2.58–5.29, 5.29–8, and >8 yuan per capita GDP. The average ecological service value per unit area (ESV) for each province was determined by setting the highest and lowest values as the upper and lower limits of the range and equally dividing the range into three categories: 8–14, 14–21, and 21–28 yuan per unit area. The resulting risk-preference matrices are presented in Table 4.
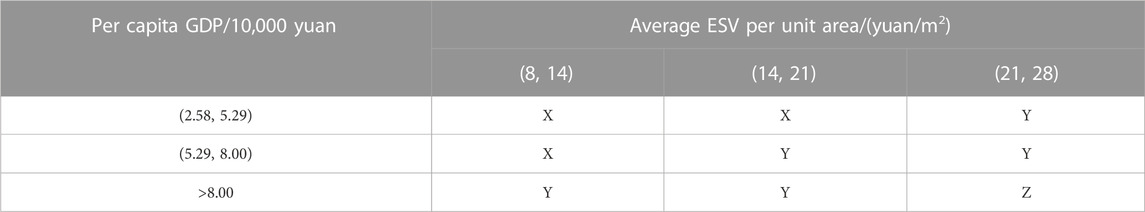
TABLE 4. Risk appetite matrix.
When falling into zone Z, n = 2 is assigned, indicating risk aversion; when falling into zone Y, n = 1.5 is assigned, indicating slight risk aversion; and when falling into zone X, n = 1 is assigned, indicating risk neutrality. Based on the per capita GDP and average ESV per unit area of each province in 2020, the risk preference of each province was determined using a risk matrix, as shown in Figure 3.
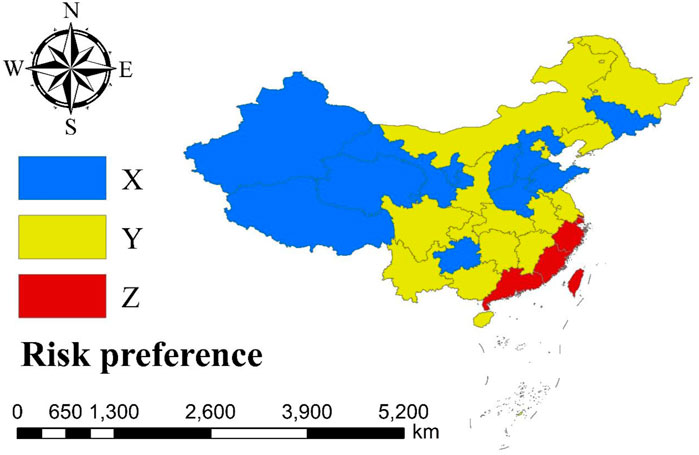
FIGURE 3. Risk appetite of each province.
As shown in Figure 3, the regions with risk preference X primarily include some western and central provinces of China and Jilin Province. Western regions, such as Xinjiang, Tibet, Qinghai, Gansu, and Ningxia, have relatively underdeveloped economies. People in these areas tend to focus more on economic development than on the ecological environment, resulting in a risk preference of X. In central provinces, such as Hebei, Henan, Shanxi, and Shandong, although the total economic output is large, the population is large, and the per capita GDP is relatively small, resulting in a risk preference of X. Among the three northeastern provinces, only Jilin Province has a risk preference of X. Upon comparison, although Jilin’s per capita GDP is higher than that of Heilongjiang, Heilongjiang has important ecological protection areas, such as the Greater and Lesser Khingan Mountains, with higher ecological value and lower risk tolerance. Therefore, among the three northeastern provinces, only Jilin Province has a risk preference of X.
The risk preference of most provinces in China is Y, where some areas have high ecological environment quality despite being economically underdeveloped, whereas others have moderate ecological environment quality despite being economically developed (i.e., Beijing). Additionally, some regions, such as Hunan, have good overall economic development and ecological environment quality; however, a large population means that their per capita GDP has not reached the high-income range, resulting in a Y risk preference.
Only Shanghai, Hong Kong, Guangdong, Fujian, Zhejiang, and Taiwan have a Z-risk preference and are concentrated in the southeastern coastal region of China. These areas are economically developed and have a high ecological environment quality, resulting in a lower tolerance for risk.
Most countries or regions have set extreme value lines for the risk standards of the two types. First, the probability extreme value line set by Australia indicates that there is no need to consider the consequences of an accident if its probability is below a certain value (ANCOLD Australia National Committee on Large Dams, 2003). The other, such as the loss extreme value line set by Hong Kong, indicates that if the accident loss exceeds a certain value, then the risk is intolerable. Considering the safety status of Chinese dams, management levels, and levels of economic and social development, it is currently not feasible to set extreme accident value lines (Li et al., 2015). Therefore, the following two points should be considered when setting the accident probability extreme value line:
(1) Probability of dam accidents in China. According to (Li et al., 2015; Fan and Jiang, 2005), the annual average probability of dam failure can be considered as 10% for the tolerable risk extreme value line and 1% for the acceptable risk extreme value line. From 1954 to 2018, 3,541 dam failures occurred in China, with an annual failure rate of 6.29 × 10⁻⁴. Therefore, the tolerable and acceptable extreme value lines were 6.29 × 10⁻⁵ and 6.29 × 10⁻⁶, respectively.
(2) Reliability standards in China. Reference (China Planning Press, 2013) stipulates the values of reliability indicators in China: 4.2 for large (I) reservoirs, 3.7 for large (II) and medium-sized reservoirs, and 3.2 for small reservoirs. According to the reliability theory, reliability indicators can evaluate or measure the level of structural reliability, as a quantitative basis for expressed symbolically, its relationship with failure probability Pf is as follows:
Where
Assuming that the reliability function is a random variable following a normal distribution (Wilde and Johansson, 2013; Li S. et al., 2015; Ge et al., 2017). The current reliability standards in China are relatively consistent with the dam safety situation, so 10% of Pf can also be used as the tolerable risk extreme line and 1% as the acceptable risk extreme line.
As people’s concern for the ecological losses caused by dam failures is significantly lower than that for the loss of life and economic losses, these requirements can be appropriately reduced. Moreover, the funding guarantees and management levels of large reservoirs were better than those of medium and small reservoirs. Among the 84 dam failures from 2000 to 2018, there were no failures in large reservoirs, 7 in medium-sized reservoirs, and the remainder in small reservoirs (Li H. et al., 2021). Therefore, to avoid excessive complexity in standards, large (I) reservoirs can adopt the same standards as large (II) and medium reservoirs. Thus, for large- and medium-sized reservoirs, the tolerable and acceptable risk probability extreme value lines are 1.08 × 10⁻⁵ and 1.08 × 10⁻⁶, respectively, whereas for small reservoirs, the tolerable and acceptable risk probability extreme value lines are 7 × 10⁻⁵ and 6.29 × 10⁻⁶, respectively.
To simultaneously meet the extreme value lines determined according to the safety level of the dam and current reliability standards, a smaller value was considered as the risk standard. Finally, the tolerable and acceptable risk probability extreme value lines for medium-sized reservoirs are 1.08 × 10⁻⁵ and 1.08 × 10⁻⁶, respectively, whereas the tolerable and acceptable risk probability extreme value lines for small reservoirs are 6.29 × 10⁻⁵ and 6.29 × 10⁻⁶, respectively.
Based on the determination of the C value, n value, and limit line, environmental risk standards for Chinese reservoir dams were established, as shown in Figures 4, 5.
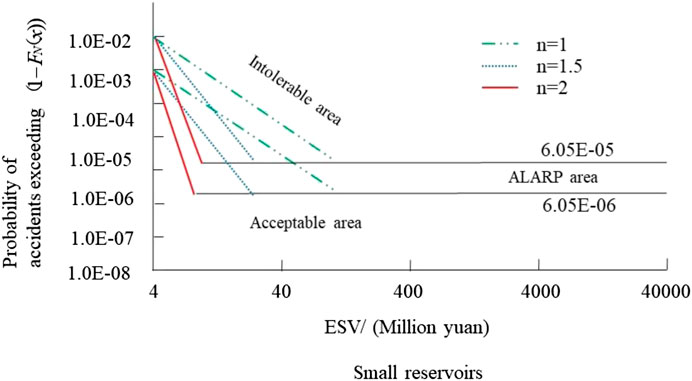
FIGURE 4. Risk standards for environmental losses caused by dam failure in large- and medium-sized reservoirs.
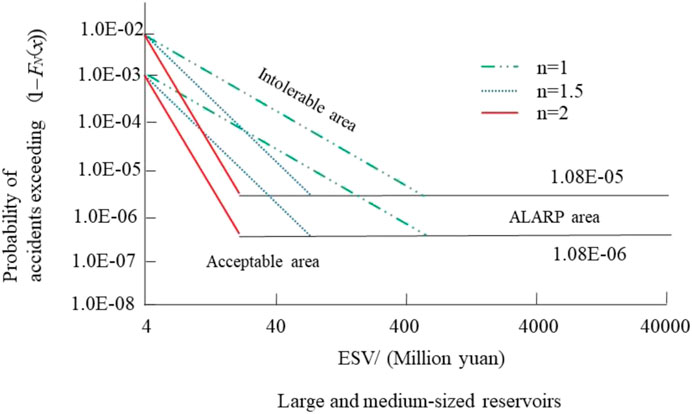
FIGURE 5. Risk criteria for environmental losses caused by dam failure in small reservoirs.
Reasonable dam-failure risk standards form the foundation for accurate risk assessment and management. There are difficult to define issues regarding the environment and its impacts, this study introduced ESV as a practical and operational method for determining environmental standards. The different provinces in China were divided into regions with distinctive characteristics, and the risk matrix method was used to determine the risk standards for these regions and established more targeted risk standards. This study determined the tolerable and acceptable standard values C of China’s environmental impact risk standards, respectively. According to the GDP and environmental conditions of different provinces in China, a risk matrix is introduced to determine the risk appetite of each province. Finally, after the extreme value line has been determined, environmental loss risk criteria for reservoir dams of different sizes have been developed. These results were consistent with reality. The results can effectively help decision makers fully understand the level of dam risk management, promote further development of environmental risk research, and provide references and guidance for subsequent studies on environmental risks of dam failure.
The datasets presented in this study can be found in online repositories. The names of the repository/repositories and accession number(s) can be found in the article/Supplementary Material.
Conceptualization, WL and JY; methodology, JL and JY; validation WL and HZ; formal analysis, WL and HZ; investigation, WL and JL; writing—original draft preparation, WL; writing—review and editing, WL and YJ; supervision, WL; funding acquisition, WL. All authors contributed to the article and approved the submitted version.
This work was supported by the National Natural Science Foundation of China (Grant Nos. 52179144, 52079127, and U2243244), Henan Science and Technology Research Project (Grant Nos. 202102310316 and 202102310394).
The authors declare that the research was conducted in the absence of any commercial or financial relationships that could be construed as a potential conflict of interest.
All claims expressed in this article are solely those of the authors and do not necessarily represent those of their affiliated organizations, or those of the publisher, the editors and the reviewers. Any product that may be evaluated in this article, or claim that may be made by its manufacturer, is not guaranteed or endorsed by the publisher.
ANCOLD (Australia National Committee on Large Dams) (2003). Guideline on risk assessment. Hobart, Tasmania: ANCOLD.
Binod, Baniya, Tang, Qiuhong, Yadu, Pokhrel, and Xu, X. (2019). Vegetation dynamics and ecosystem service values changes at national and provincial scales in Nepal from 2000 to 2017. Environ. Dev. 32, 100464. doi:10.1016/j.envdev.2019.100464
Cao, Gang, Liu, Yanzhong, Song, Xiangxiang, Chen, Y., Zhang, Z., and Wu, D. (2021). Study on the response mechanism of ecosystem services to urban land expansion by dynamic equivalent factor method: A case of wuhan, China. IOP Conf. Ser. Earth Environ. Sci. 651, 042039. doi:10.1088/1755-1315/651/4/042039
Chen, Junfei, Chen, Mengchen, and Zhou, Pei (2020a). Using multiple index comprehensive method to assess urban rainstorm disaster risk in jiangsu province, China. Math. Problems Eng. 2020, 1–10. doi:10.1155/2020/8973025
Chen, Shulin, Liu, Xiaotong, Yang, Li, and Zhu, Z. (2023). Variations in ecosystem service value and its driving factors in the nanjing metropolitan area of China. Forests 14 (1), 113. doi:10.3390/f14010113
Chen, Shurui, Yongjiu, Feng, and Tong, Xiaohua, (2020b). Modeling ESV losses caused by urban expansion using cellular automata and geographically weighted regression. Sci. Total Environ. 712, 13609. doi:10.1016/j.scitotenv.2020.136509
Cheng, Li, and Zhou, Jing (2013). Environmental impact analysis of dam failure based on fuzzy mathematical theory. Value Eng. 32 (15), 290–292. doi:10.14018/j.cnki.cn13-1085/n.2013.15.011
China Planning Press, (2013). Unified standard for reliability design of water conservancy and hydropower engineering structures:GB 50199—2013. Beijing, China: China Planning Press.
Enes, Yildirim, and Ibrahim, Demir (2022). Agricultural flood vulnerability assessment and risk quantification in Iowa. Sci. Total Environ. 826, 154165. doi:10.1016/j.scitotenv.2022.154165
Fan, ziwu, and Jiang, shuhai (2005). Application of tolerance risk analysis method in decision-making of flood prevention. J. Hydraulic Eng. 36 (5). doi:10.13243/j.cnki.slxb.200505019
Francis, Duhamel, Daniel, Germain, and Guillaume, Fortin (2022). Flood risk quantification and mapping: an integrated vulnerability-based approach at the local scale in new brunswick, canada. Int. J. Disaster Risk Reduct. 83, 103403. doi:10.1016/j.ijdrr.2022.103403
Francisco, J., and Gallardo Izquierdo, A. (2008). Environmental risk index: A tool to assess the safety of dams for leachate. J. Hazard. Mater. 162 (1), 1–9. doi:10.1016/j.jhazmat.2008.05.018
Ge, Wei, Li, Zongkun, Liang Robert, Y., and Cai, Y. (2017). Methodology for establishing risk criteria for dams in developing countries, case study of China. Water Resour. Manag. 31 (13), 4063–4074. doi:10.1007/s11269-017-1728-0
Ge, Wei, Qin, Yupan, Li, Zongkun, Zhang, H., Gao, W., Guo, X., et al. (2020c). An innovative methodology for establishing societal life risk criteria for dams: A case study to reservoir dam failure events in China. Int. J. Disaster Risk Reduct. 49, 101663. doi:10.1016/j.ijdrr.2020.101663
Ge, Wei, Sun, Heqiang, Zhang, Hexiang, Li, Z., Guo, X., Wang, X., et al. (2020b). Economic risk criteria for dams considering the relative level of economy and industrial economic contribution. Sci. Total Environ. 725, 138139. doi:10.1016/j.scitotenv.2020.138139
Ge, Wei., Li, Zongkun, Li, Wei, Wu, M., Li, J., and Pan, Y. (2020a). Risk evaluation of dam-break environmental impacts based on the set pair analysis and cloud model. Nat. Hazards 104, 1641–1653. doi:10.1007/s11069-020-04237-9
He, Guanjie, Chai, Junrui, Qin, Yuan, Xu, Z., and Li, S. (2020). Coupled model of variable fuzzy sets and the analytic hierarchy process and its application to the social and environmental impact evaluation of dam breaks. Water Resour. Manag. 34, 2677–2697. doi:10.1007/s11269-020-02556-x
He, Xiaoyan, Sun, Dandan, and Huang, Jinchi (2008). Assessment on social and environmental impacts of dam break. Chin. J. Geotechnical Eng. 30 (11), 1752–1757.
Koulinas Georgios, K., Demesouka Olympia, E., Sidas Konstantinos, A., and Koulouriotis, D. E. (2021). A topsis—risk matrix and Monte Carlo expert system for risk assessment in engineering projects. Sustainability 13 (20), 11277. doi:10.3390/su132011277
Langdalen, Henrik, Abrahamsen, Eirik Bjorheim, and Selvik, Jon Tømmerås (2020). On the importance of systems thinking when using the ALARP principle for risk management. Reliab. Eng. Syst. Saf. 204, 107222. doi:10.1016/j.ress.2020.107222
Langill Jennifer, C., Christian, Abizaid, Yoshito, Takasaki, and Coomes, O. T. (2022). Integrated multi-scalar analysis of vulnerability to environmental hazards: assessing extreme flooding in western amazonia. Glob. Environ. Change 76, 102585. doi:10.1016/j.gloenvcha.2022.102585
Li, H., Ma, G., Wang, F., Rong, W., and He, Y. (2021). Analysis of dam failure trend of China from 2000 to 2018 and improvement suggestions. Hydro-science Eng. 2021 (5), 101–111. doi:10.12170/20201119001
Li, S., Zhou, X., Wang, Y., Zhou, J., Du, X., and Chen, Z. (2015a). Study of risk acceptance criteria for dams. Sci. China Technol. Sc. 58 (7), 1263–1271. doi:10.1007/s11431-015-5864-6
Li, Zongkun, Ge, Wei, and Wang, Juan, (2015). Risk criteria and application on reservoir dams in China. J. Hydraulic Eng. 46 (05), 567573+583. doi:10.13243/j.cnki.slxb.20141359
Li, Zongkun, Li, Wei, and Ge, Wei, (2019). Dam breach environmental impact evaluation based on set pair analysis-variable fuzzy set coupling model. J. Tianjin Univ. Sci. Technol. 52 (3), 269–276. doi:10.11784/tdxbz201807030
Li, Zonkun, Li, Wei, and Ge, Wei (2018). Weight analysis of influencing factors of dam break risk consequences. Nat. Hazards Earth Syst. Sci. 18 (12), 3355–3362. doi:10.5194/nhess-18-3355-2018
National Bureau of statistics of the people's Republic of China, (2019). China statistical Yearbook. Beijing, China: China Statistics Press.
National Bureau of statistics of the people's Republic of China, (2020). China statistical Yearbook. Beijing, China: China Statistics Press.
National Development Planning Commission (2019). Compilation of national agricultural product cost-benefit data. Beijing, China: China price Publishing House.
Pei, Jingjing, Wang, Guantao, Luo, Sida, and Luo, Y. (2018). Societal risk acceptance criteria for pressure pipelines in China. Saf. Sci. 109, 20–26. doi:10.1016/j.ssci.2018.05.006
Peter, Oyedele, Edinam, Kola, Felix, Olorunfemi, and Walz, Y. (2022). Understanding flood vulnerability in local communities of kogi state, Nigeria, using an index-based approach. Water 14 (17), 2746. doi:10.3390/w14172746
Shah, Muhammad. I., Muhammad Shehu, Shuaibu, AbdulKareem Hauwah, K. K., Khan, Z., and Abbas, S. (2022). Inequality consequences of natural resources, environmental vulnerability, and monetary-fiscal stability: A global evidence. Environ. Sci. Pollut. Res. Int. 30 (4), 10329–10345. doi:10.1007/s11356-022-22788-1
Tu, Yan., Shi, Han., Zhou, Xiaoyang, Liu, L., and Lev, B. (2023). Flood risk assessment of metro stations based on the SMAA-2-FFS-H method: A case study of the “7$$\cdot$$20” rainstorm in zhengzhou, China. Stoch. Environ. Res. Risk Assess. 37, 2849–2868. doi:10.1007/s00477-023-02422-3
Wang, Renzhong, Lei, Li, and Sheng, Jinbao (2006). On criterion of social and environmental risk of reservoir dams. J. Saf. Environ. (6), 8–11. doi:10.3969/j.issn.1009-6094.2006.01.003
Wilde, M., and Johansson, F. (2013). System reliability of concrete dams with respect to foundation stability: application to a spillway. J. Geotech. Geoenviron. 139 (2), 308–319. doi:10.1061/(ASCE)GT.1943-5606.0000761
Xu, Wu, Shen, Xiaojing, and Li, Jianshe (2022). Flood risk assessment model combining hierarchy process and variable fuzzy set theory: A case study in Zhejiang province, China. Arabian J. Geosciences 15, 188. doi:10.1007/s12517-022-09440-5
Xu, Xibao., Tan, Yan, and Yang, Guishan (2013). Environmental impact assessments of the three gorges project in China: issues and interventions. Earth-science Rev. 124, 115–125. doi:10.1016/j.earscirev.2013.05.007
Yang, Haijiang, Gou, Xiaohua, Xue, Bing, Ma, W., Kuang, W., Tu, Z., et al. (2023). Research on the change of alpine ecosystem service value and its sustainable development path. Ecol. Indic. 146, 109893. doi:10.1016/j.ecolind.2023.109893
Yang, Yijia, Song, Ge, and Lu, Shuai (2020). Study on the ecological protection redline (epr) demarcation process and the ecosystem service value (ESV) of the epr zone: A case study on the city of qiqihaer in China. Ecol. Indic. 109, 105754. doi:10.1016/j.ecolind.2019.105754
Zhang, Shuai, Wang, Yin, Wang, Yang, Li, Z., and Hou, Y. (2023). Spatiotemporal evolution and influencing mechanisms of ecosystem service value in the tarim river basin, northwest China. Remote Sens. 15 (3), 591. doi:10.3390/rs15030591
Keywords: dam failure, environmental risk standards, equivalent factor method, risk preference, ecosystem service (ES) values
Citation: Li W, Yi J, Liu J, Zhang H and Jiao Y (2023) Dam failure environmental standards in China based on ecosystem service value. Front. Earth Sci. 11:1238394. doi: 10.3389/feart.2023.1238394
Received: 11 June 2023; Accepted: 08 August 2023;
Published: 28 August 2023.
Edited by:
Xihui Gu, China University of Geosciences Wuhan, ChinaReviewed by:
Yanhui Pan, Huanghuai University, ChinaCopyright © 2023 Li, Yi, Liu, Zhang and Jiao. This is an open-access article distributed under the terms of the Creative Commons Attribution License (CC BY). The use, distribution or reproduction in other forums is permitted, provided the original author(s) and the copyright owner(s) are credited and that the original publication in this journal is cited, in accordance with accepted academic practice. No use, distribution or reproduction is permitted which does not comply with these terms.
*Correspondence: Wei Li, bGl3ZWlAenpydnRjLmVkdS5jbg==
Disclaimer: All claims expressed in this article are solely those of the authors and do not necessarily represent those of their affiliated organizations, or those of the publisher, the editors and the reviewers. Any product that may be evaluated in this article or claim that may be made by its manufacturer is not guaranteed or endorsed by the publisher.
Research integrity at Frontiers
Learn more about the work of our research integrity team to safeguard the quality of each article we publish.