 Zhen-Chao Teng
 Ya-Dong Zhou
 Yun-Chao Teng
 Xiao-Yan Liu
 Jia-Lin Liu
 Bo Li
Bo Li- Heilongjiang Key Laboratory of Disaster Prevention, Mitigation and Protection Engineering, Northeast Petroleum University, Daqing, China
Engineering construction in cold regions cannot be separated from permafrost research. This study aimed to determine the mechanical properties and changing laws of artificially frozen clay through triaxial tests. Two models have been established: a physical model based on the tradi-tional phenomenological constitutive theory and a deep learning model based on the data-driven constitutive theory, taking into account the softening phenomenon. The accuracy and applica-bility of the models were verified, followed by a comparative analysis. The results of the analysis are as follows. The Duncan-Chang model can describe the characteristics of the hardening-type deviatoric stress-strain curve, but it cannot describe the characteristics of the softening-type de-viatoric stress-strain curve. The Modified Duncan-Chang (MDC) model fails to accurately de-scribe the characteristics of a smooth deviatoric stress-strain curve. The Strain-Damage Modified Duncan-Chang (SD-MDC) model exhibits a good fit in both the ascending and descending seg-ments of the curve, but it lacks effectiveness in the convergence segment of the S-shaped sof-tening curve. For this reason, this paper has chosen the arctangent function to establish a Strain-Damage Modified arctangent constitutive model (SD-MAM). This model accurately re-flects the stress evolution process of different types of frozen soils. Additionally, the Informer time series prediction algorithm was utilized to develop the Informer permafrost deviatoric stress prediction model which achieved an R2 value above 99%. In comparison to the SD-MAM model, the Informer model demonstrates higher precision, does not rely on assumptions, is cost-effective, and has a wide range of applications. However, it lacks physical meaning, and interpretability, and requires further discussion regarding the reliability of the results. This study offers valuable insights into the development and application of constitutive models for frozen soils.
1 Introduction
In seasonally frozen soil areas, changes in the subgrade’s seasonal temperature can cause frost heaving and thaw settlement (Lu et al., 2018; Derk and Unold, 2022; Liu et al., 2022). Soil strength in cold regions is critical for the service life and structural safety of the high-speed railway and energy infrastructure projects and residential construction (Teng et al., 2021). The constitutive theory for frozen soil describes the relationship between force and deformation in this material. A widely applicable and accurate constitutive model for frozen soil (Liu and Lai, 2020; Li J. et al., 2022; Zhao et al., 2022) is essential for providing important theoretical guidance for engineering construction in cold regions. Investigation of the constitutive model for artificially frozen silty clay is a significant area of research (Song et al., 2021).
Soil mechanics calculations and analyses should consider not only force balance and displacement coordination equations but also the mechanical constitutive equations of soil. Constitutive theories of soil include elastic theory, elastoplastic theory, plasticity inner time theory, damage constitutive theory, and structural constitutive theory. The viscoelastic-plastic model (Islam and Gnanendran, 2020) accurately represents soil deformation characteristics, internal mechanisms, and properties such as hardening, softening, and shear dilation. The elastoplastic model shows promise for development and is second in accuracy only to the viscoelastic-plastic model. The nonlinear elastic model does not account for the effects of plastic deformation, stress paths, and second principal stresses. The model is practical for solving formulas and suitable for engineering calculations and analysis (Liu et al., 2019).
The DC model is a nonlinear elastic model (Zhao G. F. et al., 2020). It can be directly obtained from triaxial tests. However, this model fails to explain the strain-softening phenomenon of frozen soil. Consequently, Shen et al. (2019) introduced the modified Duncan-Chang model (MDC) - the single peak curve model - to address this limitation. The MDC model cannot describe stress-strain changes following a smooth deviatoric stress variation. Lai et al. (2008); Lai et al. (2009) introduced the statistical damage constitutive model of frozen soil using the Mohr-Coulomb criterion, probability theory, and damage mechanics theory. Using these theories, Li et al. (2019) enhanced the MDC model and presented a statistical damage model (SD-MDC), which is capable of explaining the strain-softening effect of frozen soil (Vignjevic et al., 2018; Shen et al., 2019; Li et al., 2016). Notably, this model’s variables consist of the confining pressure, temperature, and initial water content but do not encompass the freeze-thaw effect. The constitutive curves of frozen soil with different initial water contents, confining pressures, and freeze-thaw effects may be mainly categorized into one of the following three types: strain-hardening, strain stability, or strain-softening. It is important to note that most models are only designed to explain one. Accordingly, this paper presents a statistical-damage, modified arctangent constitutive model (SD-MAM) that accurately represents the stress evolution of different types of frozen soil.
Based on previous research summaries, the phenomenological assumption-based soil constitutive analysis model is a commonly used research method for constitutive problems. Nevertheless, a unified constitutive model based on this method remains challenging, with discrepancies between theoretical and experimental values. According to (Zhang F. et al., 2021), the physical-driven soil constitutive model has four major limitations: reliance on set assumptions, limited applicability, inability to predict experimental data under various stress paths, and difficulty in engineering applications. To achieve a more precise and unified model, several scholars have attempted to use data-driven training constitutive models based on machine learning methods (Linka et al., 2021; Park and Cho, 2021; Fuhg and Bouklas, 2022). The accuracy of prediction using this machine learning technology will improve every increase in data size, resulting in more precise theoretical solutions under any condition. Thus, this study uses the Informer algorithm to establish a model for predicting frozen soil constitutive behavior with high precision and fast computation time. Compared with previous models, this technique proves to be user-friendly while having high prediction accuracy and fast computation times, thereby providing a basis for engineering design applications.
2 Frozen soil research based on triaxial testing
2.1 Soil material
The object of this experiment is artificially frozen powdery clay (Niu et al., 2022; Yu et al., 2010; Ma et al., 2019), and the sampling site is shown in Figure 1 of the Daqing section of the China-Russia Mohe Pipeline.
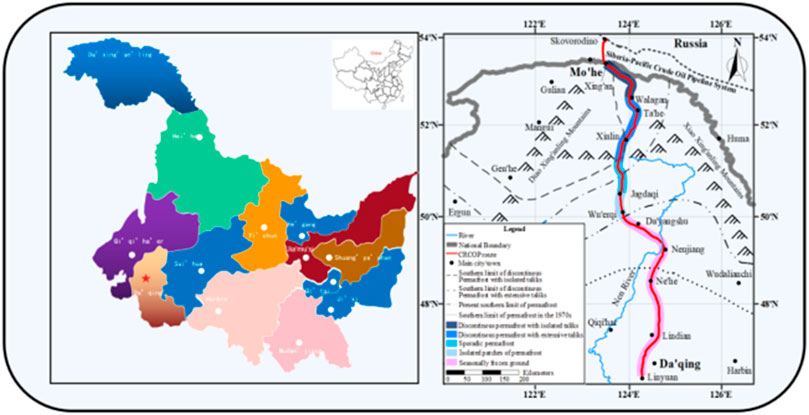
FIGURE 1. Roadmap of the Daqing section of the Sino-Russian Desert pipeline.
The dry density of the test soil sample was determined using the compaction test method. The liquid limit of the test soil sample was determined using the liquid limit combined test method. The relevant physical characteristics of the test soil samples are given in Table 1, and the particle size distribution of the powdery clay is shown in Figure 2.
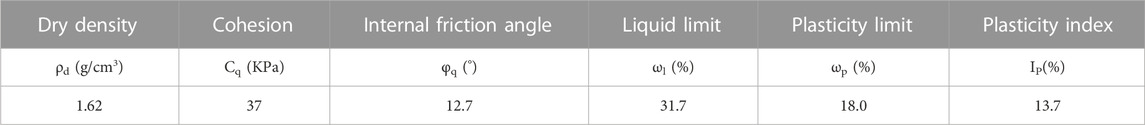
TABLE 1. Basic physical properties of natural silty clay.
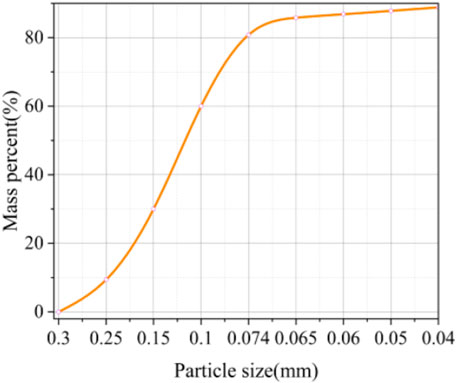
FIGURE 2. The size distribution of frozen powdery clay particles.
2.2 Triaxial compression test process
Figure 3 illustrates the operational process for the three-axis compression test (Li Q. et al., 2022; Bai et al., 2022; Zheng et al., 2022). 1) To configure soil particles, dry the sample in an electric hot-air drying oven at 125 °C for 20 h, crush the soil using a crusher, and select the particle size with a 1 mm sieve. 2) To configure moisture content, calculate the water weight needed, add it to the prepared soil, and seal it with plastic wrap for 12 h 3) For sample size preparation, use a soil sample with a diameter of 61.8 mm and a height of 125 mm. 4) For the freeze-thaw cycle, the temperature was set between −35°C and 35 °C based on meteorological and geographical data in the study area. The cycle frequency was varied for each 8-h cycle.
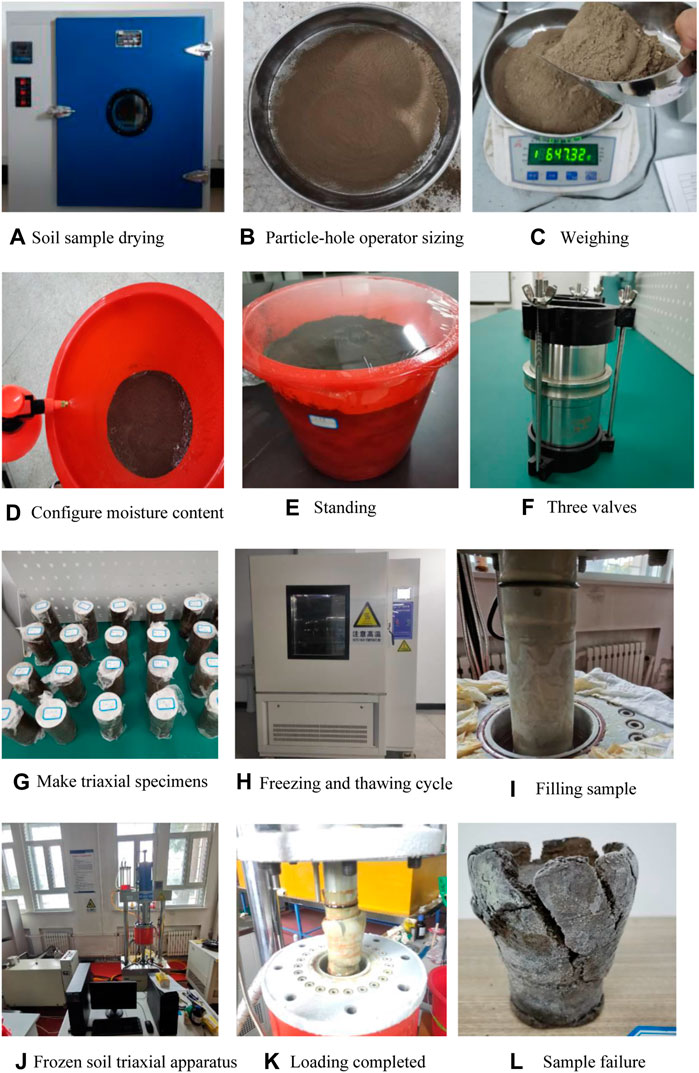
FIGURE 3. Triaxial compression test process. (A) Soil sample drying (B) Particle-hole operator sizing (C) Weighing. (D) Configure moisture content (E) Standing (F) Three valves. (G) Make triaxial specimens (H) Freezing and thawing cycle (I) Filling sample. (J) Frozen soil triaxial apparatus (K) Loading completed (L) Sample failure.
Based on the similarity theory model (Teng et al., 2021), one freeze-thaw cycle in this experiment is equivalent to the variation process of 1 year of the actual freeze-thaw cycle. The soil freezing depth in Daqing is 1.7–2.3 m each year, so the confining pressure of the soil samples in this experiment is 0.1–0.3 MPa. The operating condition parameters related to the triaxial compression test in this experiment are shown in Table 2.

TABLE 2. Description of test condition parameters design.
2.3 Analysis of test results on artificial frozen silty clay
2.3.1 Characteristic analysis of the deviatoric stress-strain curve
The data obtained from the soil samples tested under a confining pressure of 0.1 MPa is presented in Figure 4. The deviatoric stress-strain curves for the conditions with a confining pressure of 0.2MPa and 0.3 MPa exhibit similar characteristics and these will be briefly discussed in the following section. IMC represents the initial moisture content, and FTC and CP represent the freeze-thaw cycles and confining pressure.
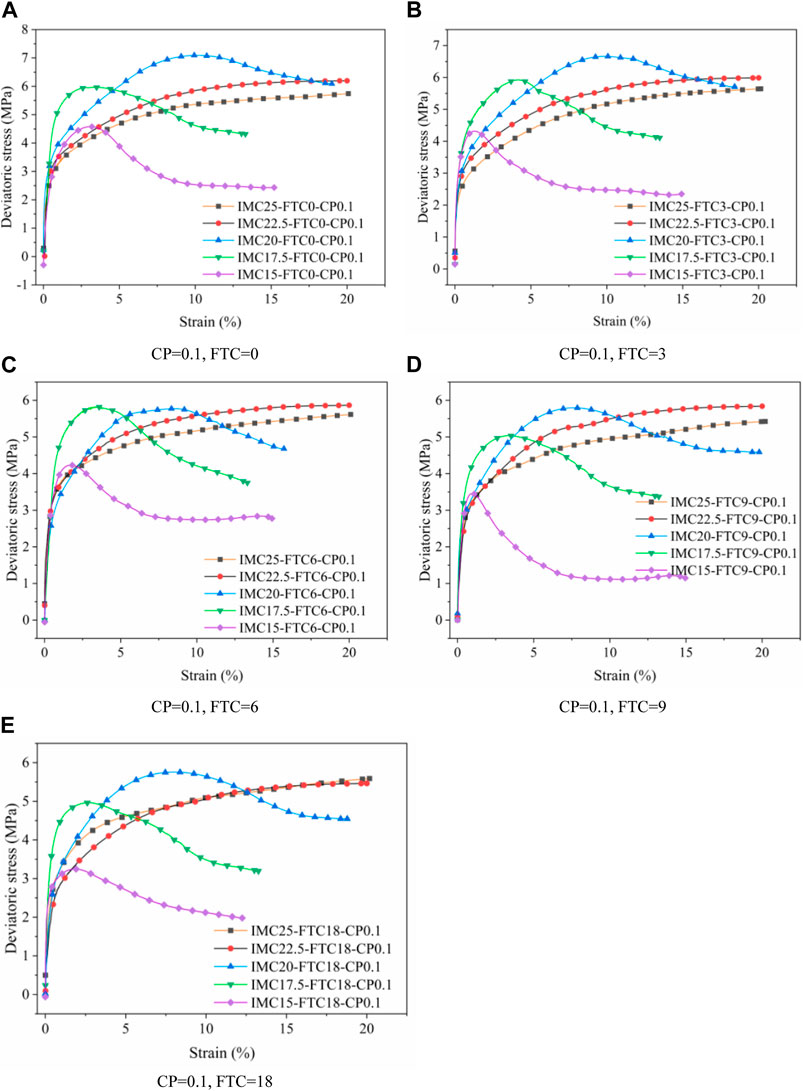
FIGURE 4. The deviatoric stress-strain curves of different water contents. (A) CP=0.1, FTC=0. (B) CP=0.1, FTC=3. (C) CP=0.1, FTC=6 (D) CP=0.1, FTC=9. (E) CP=0.1, FTC=18.
Figure 4 illustrates the constitutive curve of the tested soil sample, which can be divided into four main stages: compaction, initial linear elastic, plastic deformation, and failure (Zhang et al., 2016). During the compaction stage, the strain increases gradually with the deviatoric stress during the initial loading phase. In the subsequent initial elastic phase, the deviatoric stress-strain relationship demonstrates linear elasticity (Cen et al., 2020). As the axial load persists, the stress growth rate decelerates in the plastic deformation stage, indicating plastic deformation of the specimen (Fan et al., 2018; Zhang and Liu, 2019; Wang et al., 2020). Finally, in the failure stage, the strain continues to develop and the curve’s slope gradually decreases or becomes negative.
Figure 4 demonstrates that the highest strength of permafrost is observed at an initial moisture content of 20%. Among factors such as confining pressure and the number of freeze-thaw cycles, different initial water contents have the most significant impact on the deviatoric stress-strain curve during the failure stage. On one hand, the phenomena of strain softening and strain hardening can be attributed to the initial water content. On the other hand, an increase in the initial moisture content delays the failure strain. The strength of frozen soil stabilizes after undergoing nine thawing cycles. Additionally, the deviatoric stress of frozen silty clay decreases as the number of freeze-thaw cycles increases. This can be attributed to the expansion and resulting pressure of water molecules during freezing, which leads to the deterioration of the silty clay’s microstructure. However, this deterioration effect becomes insignificant after nine freeze-thaw cycles. Under identical working conditions, different confining pressures do not alter the evolution pattern of the deviatoric stress.
2.3.2 Strength and parameter analysis of artificially frozen silty clay
The number of freeze-thaw cycles, confining pressure, and initial water content are important factors affecting the strength of frozen soil, which significantly impact the mechanical properties of frozen soil. The regularity of frozen soil strength changing with the experimental variables is shown in Figure 5.
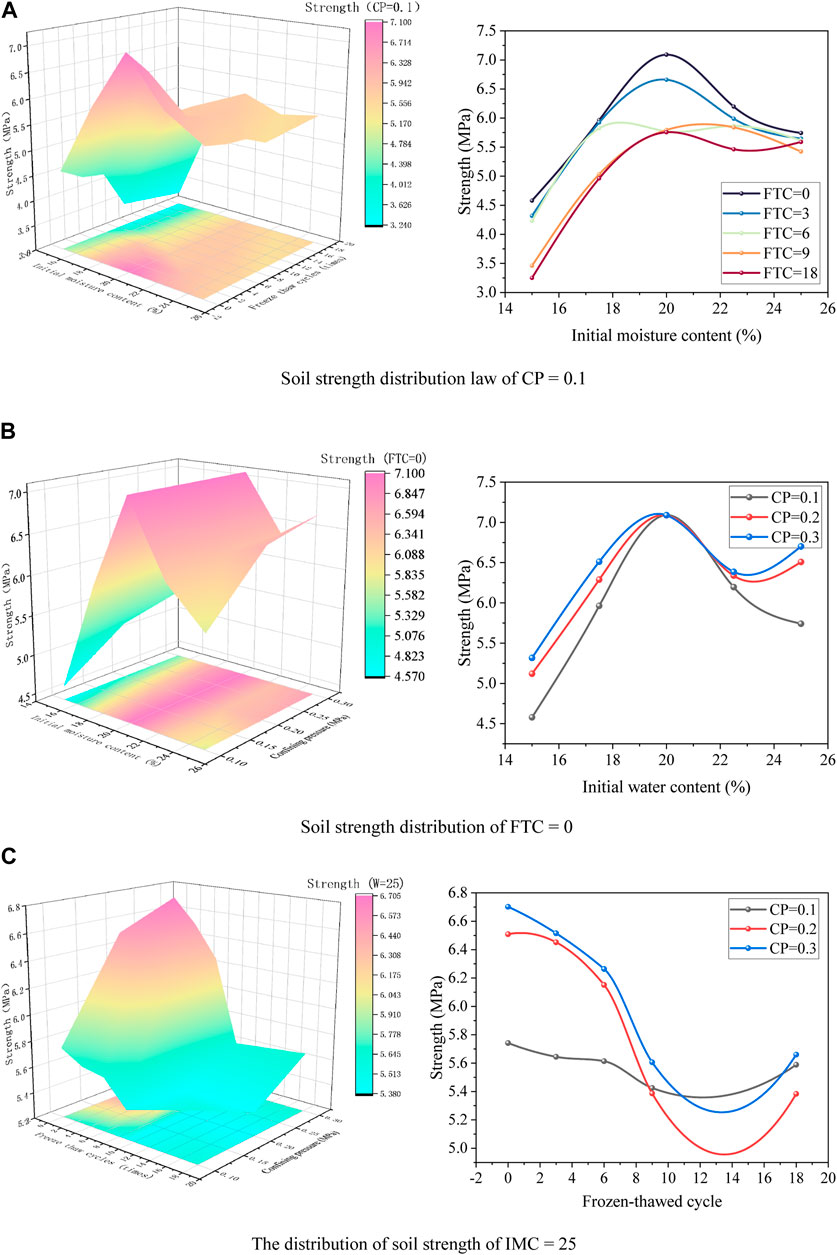
FIGURE 5. Soil strength distribution. (A) Soil strength distribution law of CP = 0.1. (B) Soil strength distribution of FTC = 0. (C) The distribution of soil strength of IMC = 25.
According to Figure 5A, under the same confining pressure conditions, the strength of the soil increases with increasing water content between 15% and 20% and decreases with increasing water content between 20% and 25%. This is because the structure is loose when the water content is lower than complete saturation. The strength of the silty clay reaches the highest value when the saturation point of 20% is reached. The deformation and damage resistance increase with increasing ice content in the soil samples. However, when the soil is completely saturated or oversaturated, the strength of the frozen soil tends to be the same as that of the ice.
According to Figure 5B, under the same initial water content, the strength of the soil sample increases with increasing confining pressure. This is because the confining pressure increases the sliding friction of soil particles and rearrangement of soil particles, restricts and reduces the formation of cracks and pores in frozen soil, and increases the soil sample’s deformation and failure resistance. The strength of the soil decreases first and then tends to be stable with the increase in the number of freeze-thaw cycles due to the degradation effect of freeze-thaw cycles, which has been specifically elaborated on above and will not be repeated here.
According to Figure 5C, when the initial water content is between 15% and 20%, the strength of the soil sample increases with increasing water content. In comparison, when the initial water content is between 20% and 25%, the strength of the soil sample decreases with increasing water content. The confining pressure has little effect on the strength change of the soil sample initially saturated with water. This indicates that the initial water content has a more significant impact on the soil sample’s strength than the confining pressure. On the other hand, increasing the confining pressure will make the structure of the soil sample transition from loose to tight, and the shear strength of the soil will increase accordingly.
The cohesion and internal friction angle of frozen silty clay can be determined under various working conditions using Mohr’s circle method, as illustrated in Figure 6.
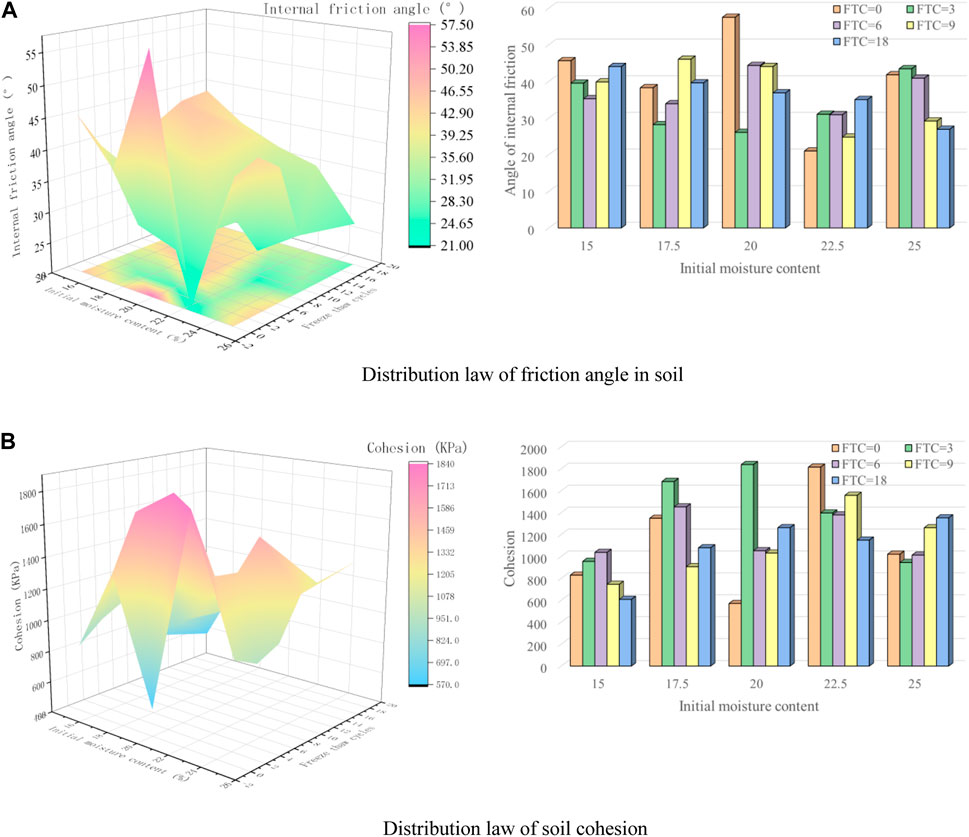
FIGURE 6. Distribution of internal friction angle and cohesion of soil. (A) Distribution law of friction angle in soil. (B) Distribution law of soil cohesion.
`Figure 6A illustrates that the internal friction angle of the soil initially increases and then decreases as the water content increases, following the same pattern as the strength. This is because, at lower load levels, the cohesion of soil particles and cemented elements primarily bear the load on the soil sample. At lower load levels, the cemented elements bear a greater portion of the load, whereas, at higher load levels, the internal friction angle bears a larger load. The highest internal friction angle occurs at an initial water content of 20% with no freeze-thaw cycles. The number of freeze-thaw cycles affects the change in the internal friction angle. This indicates that the number of freeze-thaw cycles alters the microstructure of the soil, possibly as a result of the interaction between the formation of cementation elements and the soil structure. Figure 6B demonstrates that the cohesion of the soil initially increases and then decreases as the water content increases. The highest cohesion occurs at a moisture content of 20% with 3 cycles of freezing and thawing. With an increase in the number of freeze-thaw cycles, the cohesion initially increases and subsequently stabilizes. As the negative impact of freeze-thaw cycles intensifies, the cohesion does not continue to increase and reaches a stable state.
3 Constitutive study of frozen soil based on physical drivers
3.1 Derivation of the modified arctangent model and unimodal curve model
The Duncan-Chang (DC) model is widely used in theoretical calculations and engineering guidance models (Zhao G. F. et al., 2020), and its formula is:
where
The model’s tangent modulus Et is derived as follows:
where Et is the elastic modulus.
Since Et cannot be negative, the DC model does not have a descending branch and cannot effectively describe strain-softening. Regarding research on the DC model coefficients, some scholars have proposed adding parameter c to obtain the modified Duncan-Chang model (MDC) as follows:
where c is test parameters.
It has been found through experimentation that the MDC model can only describe some of the unique softening properties of permafrost. Still, it cannot accurately describe the stress-strain curves where stress softening is not apparent. Regarding derivative research on the DC model, some scholars have proposed the arctangent model (AM) by neglecting the 2bƐ in the denominator of the Et integral adjustment in Eq. 2. The equation for this model is shown in Eq. 4.
where b is test parameters.
A modified arctangent model is obtained by adding a parameter c to make bƐ become bƐ+c and then subtracting a times the arctangent of c. The formula for this model is shown in Equation 5.
where
As the arctangent function is an S-shaped odd function, the modified arctangent model (MAM) can reflect the characteristics of S-shaped stress-strain curves.
3.2 Establishment of the damage correction arctangent model
To overcome further problems in the above models, some scholars have proposed applying damage theory to constitutive soil models and established damage models with failure strain as a random variable. In research on the probability distribution of failure strain in frozen soil, the normal distribution, log-normal distribution, and Weibull distribution are the mainstream fitting methods, and some scholars have proposed that the Weibull distribution has better fitting effects. The equation for this distribution (Zhu et al., 2021) is shown in Eq. 6.
where m and F0 are Weibull parameters.
Based on the above Weibull distribution theory, the typical representative of the established damage model is the SD-MDC model, and its formula is shown in Eq. 7.
where
The model can effectively describe the hardening and softening curves, but it still cannot accurately describe the S-shaped stress softening curves. Therefore, based on the Weibull distribution, this paper proposes a statistical damage arctangent modified constitutive model, the formula of which is shown in Equation 8.
where
According to the physical and mechanical meanings of model parameters m and F0 (Chen et al., 2018), the parameter m is a shape parameter reflecting the material’s brittleness and ductility characteristics. The larger the value of m is, the more obvious the brittleness characteristics of the material and the smaller the peak strain. The parameter F0 is a size parameter reflecting the material’s strength characteristics. The larger the value of F0, the greater the strength of the material and the stronger the ability to resist failure.
3.3 Physically driven constitutive model validation
To verify the accuracy and applicability of the above model, the deviatoric stress-strain curves obtained from different water contents in this experiment were compared with the deviatoric stress-strain curves predicted by the constitutive models, as shown in Figure 7. DC represents the Duncan-Chang model, MDC represents the unimodal curve model, SD-MDC represents the statistical damage unimodal curve model, and SD-MAM represents the statistical damage modified arctangent model.
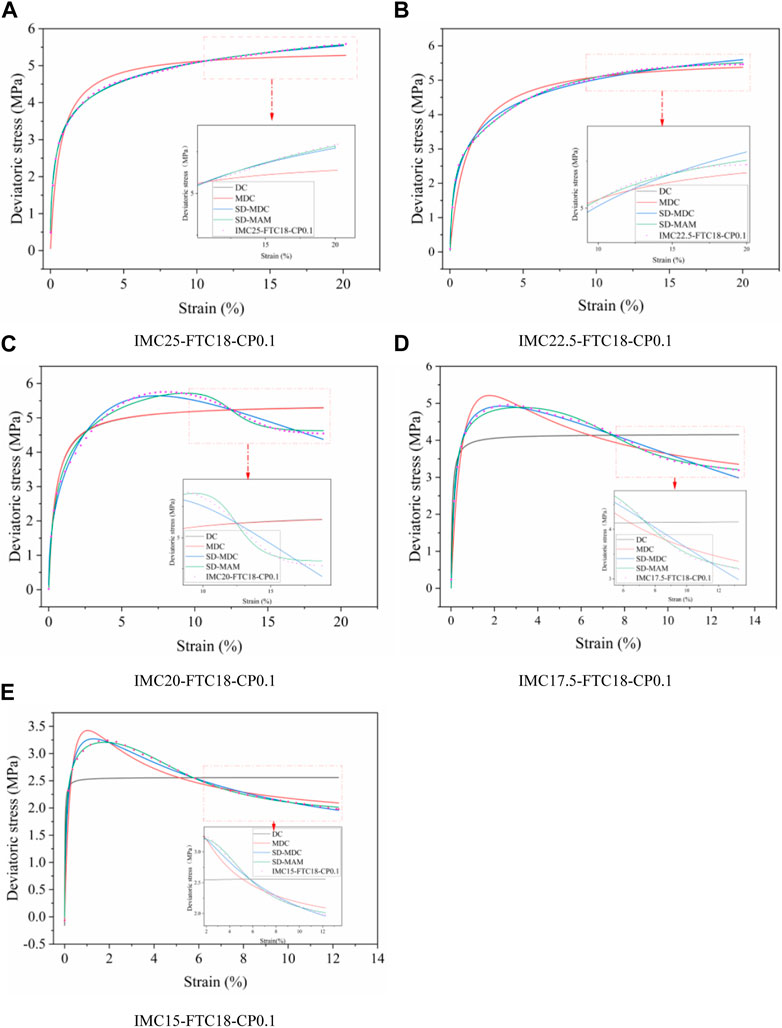
FIGURE 7. Physically driven constitutive model validation by various constitutive relations. (A) IMC25-FTC18-CP0.1. (B) IMC22.5-FTC18-CP0.1. (C) IMC20-FTC18-CP0.1. (D) IMC17.5-FTC18-CP0.1. (E) IMC15-FTC18-CP0.1.
Figure 7 shows that the description of the elastic stage is relatively optimal for each model. However, there are significant differences in the predictive ability of the models for the plastic deformation and failure stages. As displayed in Figures 7A,B, the DC and MDC models show better goodness of fit when the strain is below 1.14%. However, as the strain increases, the effectiveness of the MDC model in describing the curve decreases, and the predicted value deviates significantly from the experimental value. In the softening region of the curve, the SD-MAM model performs better than the other models. The DC, MDC, and SD-MDC models inadequately predict the behavior of the strain-softening S-curve, as there is an inflection point after the peak. In contrast, the SD-MAM model accurately captures the deformational behavior during the softening region. Moreover, while the DC model cannot reflect the change process of frozen soil strain-softening, the MDC and SD-MDC models can capture the stress softening single-peak curve trend. However, the MDC model exhibits a large deviation in the predicted peak stress magnitude. In contrast, the SD-MAM model more accurately predicts the behavior of the curve toward the end of the softening region. In summary, the SD-AMM model accurately captures the deformational behavior during the softening region and better expresses the characteristics of the strain-softening curve.
To compare the accuracy of the models mentioned above, the R2 and RMSE graphs of each model and the R2 graphs of different models under different water contents were plotted, as shown in Figure 8. The R2 and RMSE values of each model are also provided in Table 3, and the parameter values of the SD-MAM model are given in Table 4.
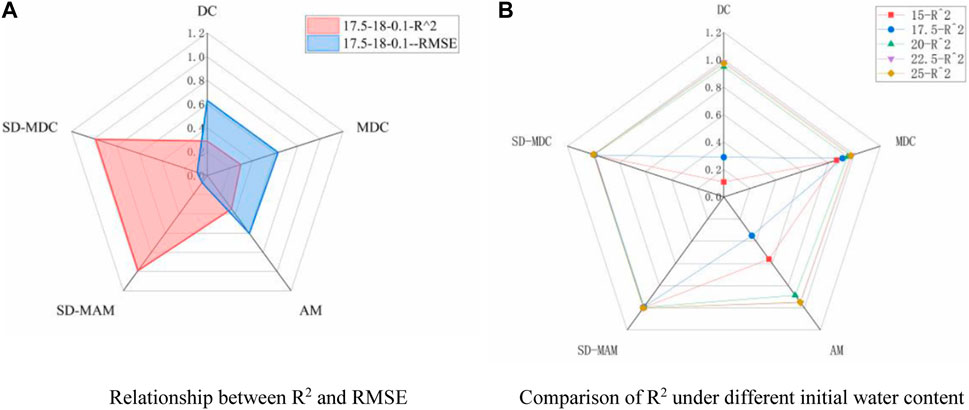
FIGURE 8. Accuracy of the physically driven constitutive model. (A) Relationship between R2 and RMSE (B) Comparison of R2 under different initial water content.
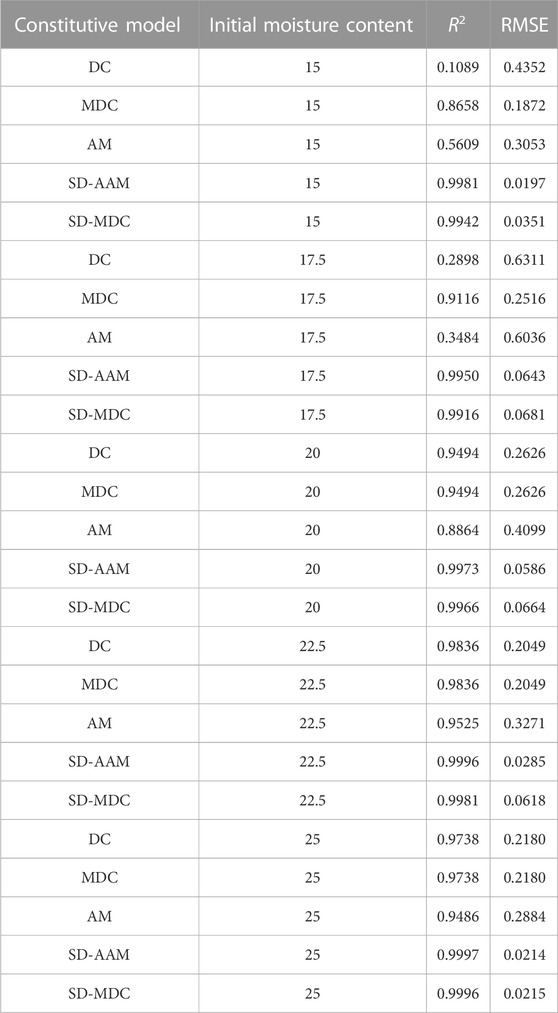
TABLE 3. R2 and RMSE values.
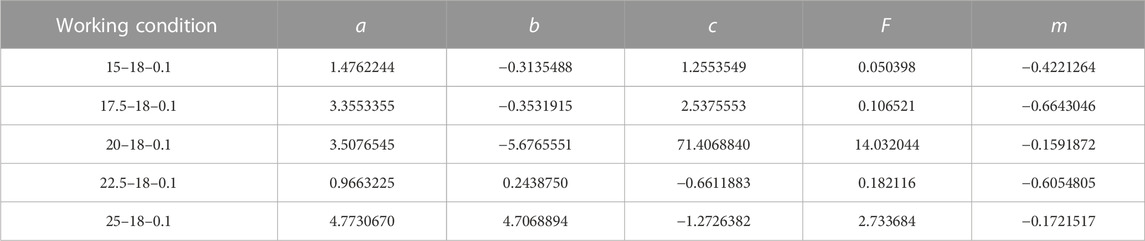
TABLE 4. SD-MAM model parameter values.
Figure 8 shows that the damage model has a larger R2 value and smaller RMSE value than the DC, MDC, and AM models. This indicates that the damage model can better describe the constitutive relationship of artificially frozen clay due to the more comprehensive expression of the damage model based on the Weibull distribution for the failure stage of the stress-strain curve. The R2 value of the SD-MAM model is the largest under various conditions and is greater than 0.99. Hence, the proposed SD-MAM model can be used as the optimal constitutive model for artificially frozen clay.
4 Data-driven constitutive study of frozen soil
4.1 ML-based soil constitutive model
Machine learning (ML) is a method of developing constitutive soil models with pure data technology skills (Zhang F. et al., 2021; Logarzo et al., 2021; Linka et al., 2021). Its advantages are: 1) ML can directly learn the deviatoric stress-strain relationship from the original data without making assumptions. 2) Machine learning can establish a unified model to simulate the behavior of various soils as long as the experiments of these soils are included in the database. 3) With the increase in the number of data sets, the ML model’s prediction accuracy and application range can be improved. 4) The ML-based model is data-driven. Once the ML configuration is determined, no parameter calibration is needed.
At present, the algorithms used to construct ML soil constitutive models include genetic programming (GP) (Cabalar and Cevik, 2011), evolutionary polynomial regression (EPR) (Javadi et al., 2012; Cuisinier et al., 2013; Ahangar Asr et al., 2018), support vector machine (SVM) (Zhao et al., 2014; Kohestani and Hassanlourad, 2016), back propagation neural network (BPNN) (Rashidian and Hassanlourad, 2014; Stefanos and Gyan, 2015; Lin et al., 2019), radial basis function (RBF) neural network (Peng et al., 2008; Xiangdong et al., 2008), recurrent neural network (RNN) (Romo et al., 2001), long short-term memory (LSTM) neural network (Zhang et al., 2019) and gate recurrent unit (GRU) neural network (Wang and Sun, 2019). The proportions of these algorithms are shown in Table 5.

TABLE 5. The proportions of algorithms.
The GP, EPR, SVM, BPNN, and RBF algorithms lack sequence prediction ability, while the RNN algorithm suffers from gradient explosion or disappearance. LSTM and GRU algorithms, despite having sequence prediction ability (Teng et al., 2023), come with many weights and biases. After extensive research, it has been found that LSTM and GRU algorithms are more suitable for developing constitutive relationships, mainly because soil mechanics behavior has the characteristic of deformation history correlation. Considering that this study adopted more than 120,000 data points for model training and the test set size is approximately 2,000, the sequence learning method of deep learning is a better choice.
4.2 Soil constitutive model based on informer
Informer (Gong et al., 2022; Wu et al., 2022; Yang et al., 2022) is an improved model based on Transformer designed for LSTF (long time series prediction) to solve some serious problems when Transformer (Geneva and Zabaras, 2022) is applied to LSTF. Examples include secondary time complexity, high memory usage, and inherent limitations of the codec structure. The Informer has three significant advantages: using ProbSparse Self-attention to filter out the most important queries and reduce the computational complexity; self-attention Distilling is proposed to reduce the dimension and network parameters. All prediction results are obtained in one step using the generative style decoder. The overall structure of the Informer model is shown in Figure 9.
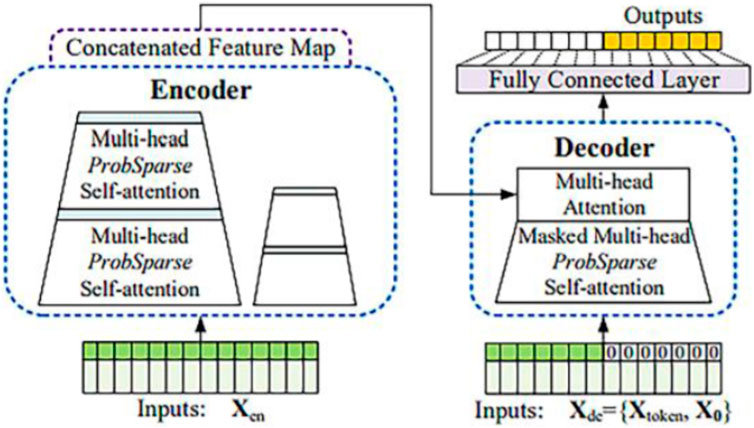
FIGURE 9. Informer algorithm framework.
In the aspect of model data input, for the time series prediction problem, the order relationship between data is very important. To ensure that the position relationship (order structure) is not lost after the sequence data are input into the model, the Informer encodes the position information of each input data (position embedding), and the specific operation formula is as shown in Eq. 9, Eq. 10:
where pos is the position (order sequence). The index j =1, 2, · · ·, dmodel/2, represents the dimension. dmodel represents the dimensional characteristics of the input, and L is the input sequence.
The encoder is stacked by the Multi-head ProbSparse Self-attention module and Distilling mechanism module. The distillation layer improves the network’s robustness and reduces the network’s memory usage through the distillation mechanism. The probabilistic sparse self-attention mechanism is expressed as follows:
In the formula, Q, K, and V are three matrices of the same size obtained by a linear transformation of input characteristic variables; it has the same size as qi but only contains qi under sparse evaluation; that is, the computational complexity is reduced from zero to zero; softmax is the activation function.
Inside the decoder, the input data are first subjected to a multi-head probabilistic sparse self-attention operation with a mask (masked). Then a multi-head self-attention operation is performed with the intermediate result of the encoder output. Finally, the data output dimension is adjusted through the fully connected layer to obtain the prediction result. The output prediction results are used to calculate the loss function and perform reverse gradient propagation to optimize the model continuously.
Regarding model data output, the decoder can output all the predicted results simultaneously. The traditional internal decoders are RNN, LSTM, etc., which are time-dependent, and the mask operation in the self-attention calculation in the decoder takes this dependence into account. Therefore, it is no longer necessary to rely on the previous sequence. Limitations, thus one-time output.
To assess the model’s performance and optimize the hyperparameters, the experiment involves a total of 75 data sets, with 70 of them used for training the model, and the remaining 5 sets designated as test sets. Table 6 presents the distribution of the datasets.
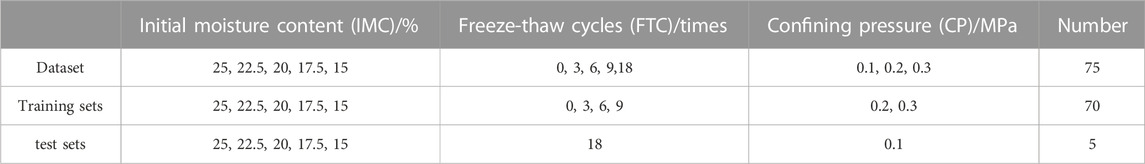
TABLE 6. The distribution of the datasets.
To enhance the training effectiveness and generalization ability of the Informer model, the balance between underfitting and overfitting is carefully maintained. The hyperparameters of the Informer model were adjusted, and recommendations for hyperparameter optimization were provided. The following suggestions for tuning hyperparameters were given: 1) Initial search range: During parameter tuning, it is recommended to start with a broad search range and progressively narrow it down for a more precise search. 2) Utilize the validation set: To prevent overfitting on the test set, it is crucial to utilize the validation set for model evaluation during the tuning process. 3) Focus on learning rate tuning: The learning rate is a critical hyperparameter that significantly impacts the model’s training performance and should be prioritized for tuning. 4) Combined tuning: To achieve improved performance, it is advisable to consider simultaneous tuning of multiple hyperparameters. The hyperparameters of the model are shown in Table 7.

TABLE 7. The hyperparameters of the model.
4.3 Data-driven validation of the soil constitutive model
To verify the Informer algorithm’s accuracy and range of applicability in establishing a constitutive soil model, various moisture content deviatoric stress-strain curves obtained from this experiment were compared with those resulting from the aforementioned constitutive predictions. This is illustrated in Figure 10.
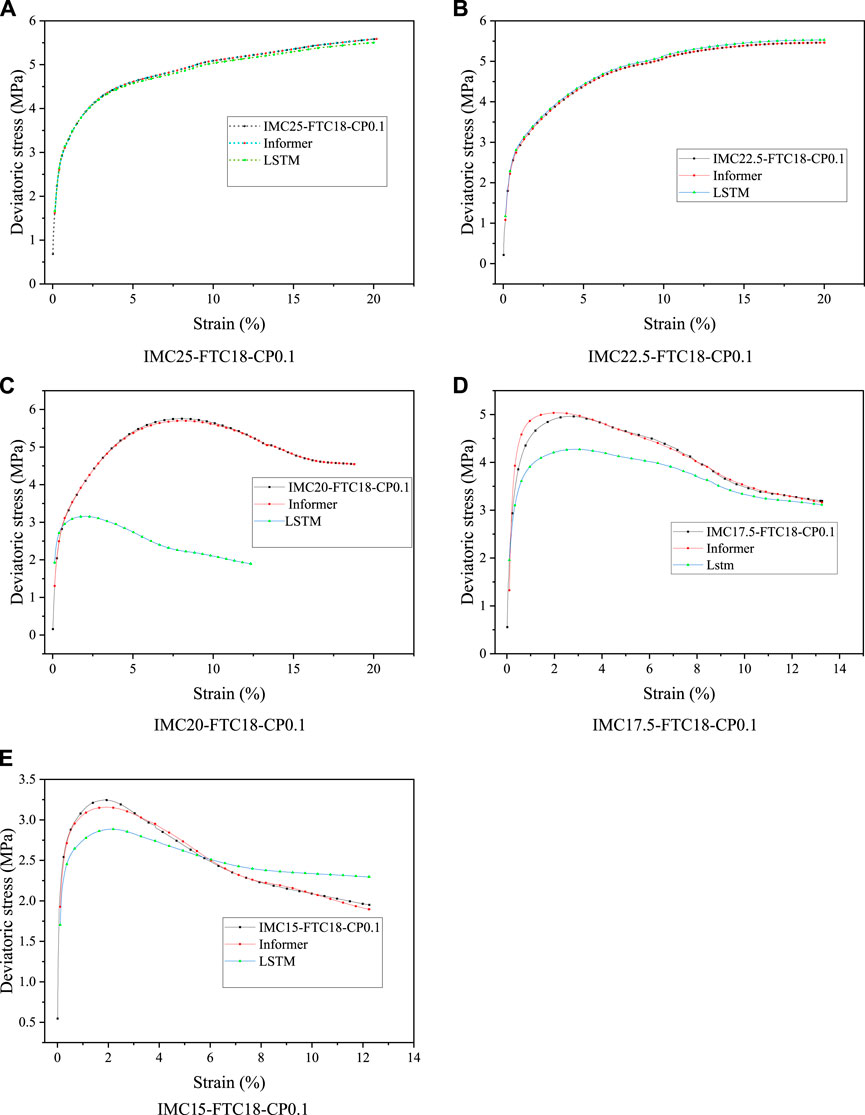
FIGURE 10. Verification of data-driven constitutive models by various constitutive relations.(A) IMC25-FTC18-CP0.1. (B) IMC22.5-FTC18-CP0.1. (C) IMC20-FTC18-CP0.1. (D) IMC17.5-FTC18-CP0.1. (E) IMC15-FTC18-CP0.1.
From Figure 10, it can be seen that LSTM can describe the development trend of the stress-strain relationship well (Malakar et al., 2022), but the prediction accuracy is poor. For the two working conditions with high water content, the prediction effect of the strain-hardening curve is good, but it cannot capture the characteristics of the strain-softening curve well. The cutting-edge Informer can accurately describe the development trend of the stress-strain relationship with high prediction accuracy and fast operation speed and can accurately capture the biased stress-strain response of each working condition. Compared with the LSTM model, the Informer model has more accurate prediction values closer to the true values in the elastic stage, plastic deformation stage, and failure stage, with higher prediction accuracy. In contrast, the LSTM model has a larger deviation between predicted and true values. The Informer can still achieve high-accuracy prediction in the plastic deformation and failure stages as the strain develops. In contrast, the LSTM’s prediction results greatly differ from the true values. Analysis shows that because Informer is based on attention mechanism modeling, it can take advantage of the attention mechanism and includes a distillation mechanism in the encoding process, improving the robustness of the network and thus achieving high-precision prediction. LSTM will still suffer from gradient disappearance when predicting long-time series. When introducing the attention mechanism, the Informer can also improve the disadvantage of gradient disappearance and fully explore the deep features of biased stress to obtain better prediction results.
On the other hand, in the prediction process of frozen soil constitutive models, LSTM is relatively slower and less effective than Informer. This is because the soil mechanics behavior has the characteristic of deformation history dependence, and the deformation of the soil will show complex nonlinear mechanical behavior and time dependence. The soil deformation depends on the output of the previous moment (t-1) at time t in time series prediction. As the time series gets longer, the speed will get slower, making converging more difficult. Both LSTM and RNN use a backpropagation algorithm to calculate the loss function for optimization, and the longer the sequence is, the more difficult it is to calculate gradients, making it more difficult to converge and leading to worse results. However, the Informer model can allocate greater weights to important features, reduce the algorithm’s time complexity, and improve the prediction speed of the model, solving the problem of long-term dependence on time series data. The Informer model can fully explore the correlation between biased stress and strain data, solve the problem of memory degradation caused by the long time series of traditional methods, and improve the accuracy of predicting constitutive soil stress while improving prediction accuracy.
The R2, MSE, RMSE, and MAE evaluation indicators of the Informer and LSTM models are shown in Figure 11.
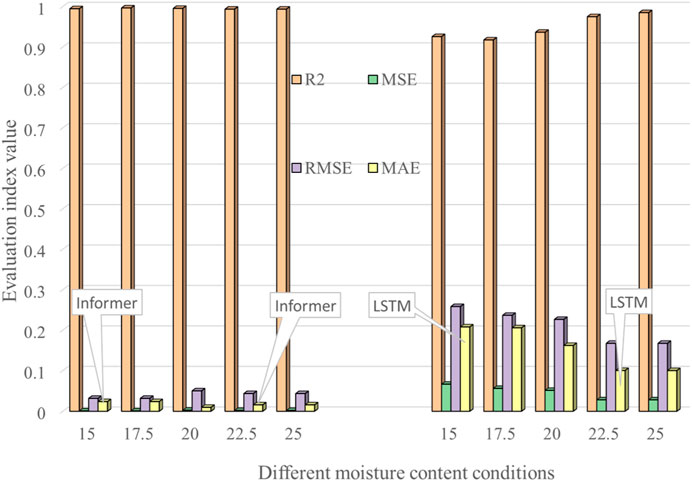
FIGURE 11. Data-driven constitutive model validation.
It can be seen from the figure that the evaluation indicators of the Informer model R2, MSE, RMSE, and MAE are better than those of the LSTM prediction model under different water content conditions (Ma et al., 2022); that is, the prediction error is smaller, which further proves the superiority of the Informer model sex.
5 Comparative analysis of the physical model and data model
Soil is a complex material with nonlinear mechanical behavior, including state dependency, stress-induced expansion, anisotropy, failure, stress-path dependency, time dependency, and noncoaxial behavior (Jiang et al., 2020). This paper presents the SD-MAM and Informer models, established using traditional phenomenological and data-driven constitutive theories, respectively. Figure 12 shows the prediction and experimental results used to validate the models.
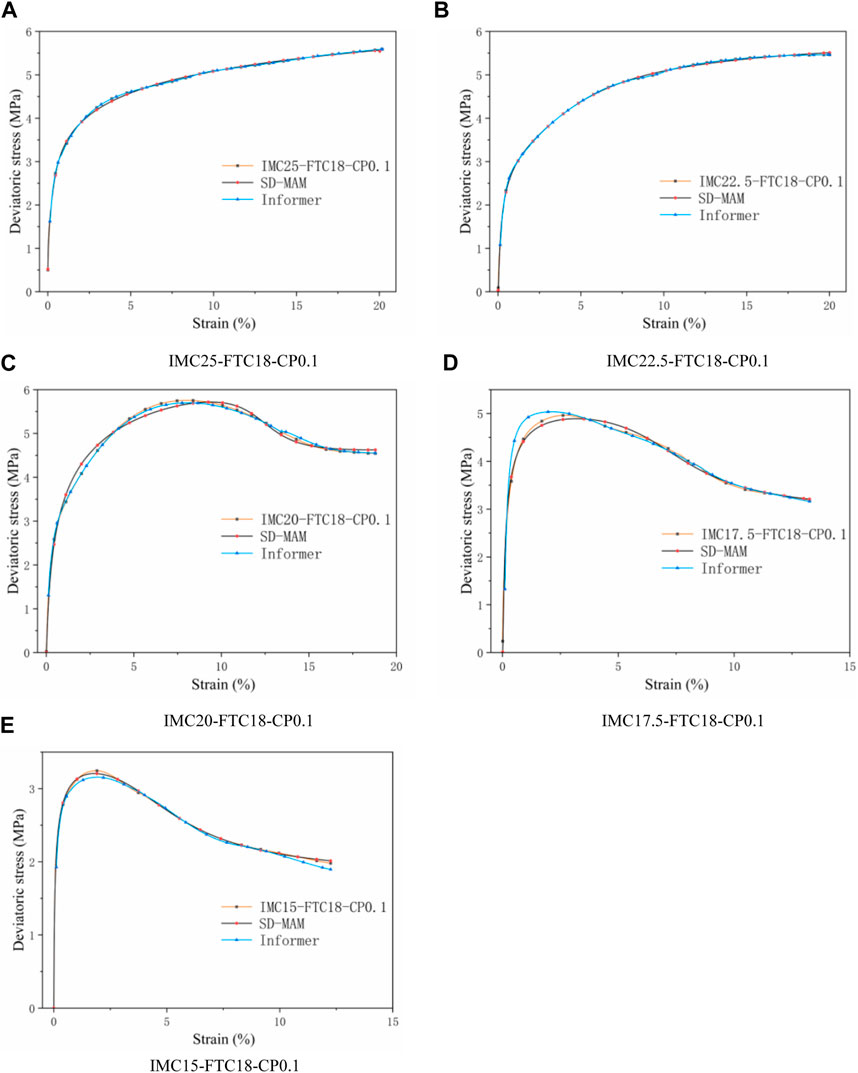
FIGURE 12. Comparative analysis of the physical model and data model. (A) IMC25-FTC18-CP0.1. (B) IMC22.5-FTC18-CP0.1. (C) IMC20-FTC18-CP0.1. (D) IMC17.5-FTC18-CP0.1. (E) IMC15-FTC18-CP0.1.
According to the figures, the two models proposed in this paper can be applied to the deformation of frozen soil under various working conditions and accurately represent the changes and features of the stress-strain curve. The data-driven constitutive model has higher accuracy and a wider range of applications because it can learn directly from the raw data without any assumptions, unlike the physically based constitutive model, which is limited by its inherent assumptions. However, the parameters in the data-driven model have no clear physical meaning or interpretability. Although the data-driven model appears more accurate, it has limitations in explaining the mechanism of frozen soil deformation. Thus, the follow-up study envisages establishing a machine-learning model incorporating physical information.
6 Conclusion and prospect
6.1 Conclusion
This paper investigates the mechanical properties and deformation characteristics of artificially frozen clay using triaxial testing. The SD-MAM model and the Informer deep learning model were established which considers the softening phenomenon. The accuracy and applicability of the models were evaluated, and a comparative analysis was performed. The study draws the following conclusions.
(1) The highest strength of frozen soil is observed when the initial water content reaches 20% in triaxial compression tests. Among the factors considered, the deviated stress-strain curve during the failure stage is most affected by the initial water content, compared to the confining pressure and the number of freeze-thaw cycles. The initial water content induces both strain softening and strain hardening phenomena, while also leading to a delay in the occurrence of failure strain with higher initial moisture content. The strength of frozen soil exhibits stability after undergoing nine thawing cycles. In identical working conditions, varying confining pressures do not alter the evolution law of deviatoric stress.
(2) Regarding physically based constitutive theory, this paper established a statistical damage-modified inverse tangent constitutive model by modifying the DC model, in order to mitigate the available SD-MDC model limitations in predicting the strain-softening of the S-shaped curve (namely, a turning point after the peak). Compared to the DC, MDC, and AM models, the proposed SD-MAM model had a higher R2 value and smaller RMSE value. Thus, it more accurately predicted changes in the failure stage from strain-softening to strain stability, followed by strain-hardening. It more fully expressed the curve characteristics in the failure stage, reflecting the stress-strain curve patterns under different working conditions.
(3) The Informer prediction model achieves an R2 value exceeding 99% in the context of data-driven constitutive theory. The model effectively leverages the correlation between deviatoric stress and strain data, addresses the issue of memory degradation in traditional methods caused by long time series, accurately captures the patterns and characteristics of stress-strain curves, and exhibits adaptability to different working conditions when developing the constitutive behavior of soils. By combining experimental data, theoretical insights, and deep learning techniques, the model demonstrates superior generalization and robustness, thereby enhancing the possibilities within data-driven soil constitutive theory.
(4) A data-driven constitutive model offers higher accuracy and broader applicability due to its ability to learn directly from raw data without making any assumptions. In contrast, physical constitutive models are constrained by their inherent assumptions. However, a drawback of data-driven models is that the parameters they use lack clear physical meaning or interpretability. Despite its apparent accuracy, the data-driven model faces limitations in explaining the deformation mechanism of permafrost. When comparing the Informer model to the SD-MAM model, the former demonstrates higher precision, does not rely on assumptions, is cost-effective, and has a wide range of applications. However, it lacks physical meaning, exhibits poor interpretability, and requires a discussion on the reliability of its results. Consequently, future research should aim to develop a machine-learning model that incorporates physical information.
6.2 Prospect
The machine learning (ML) model developed using synthetic data is insufficient for performance and mechanism compared to the physical-driven constitutive model used for data generation. The limitations of purely data-driven models stem from the chaotic nature of physical phenomena, such as bifurcation. As a result, the output results hold statistical significance but lack physical significance, making them incongruent with physical reality. To enhance the credibility and practicality of this model, this study results strongly suggest further developing physics-informed machine learning (PIML) models. With data-driven machine learning models, these models fuse prior physics knowledge, such as abstract natural phenomena and past human behaviors. This fusion will effectively mitigate training data insufficiencies, enhance the model’s generalization ability, and ensure the physical validity of the results.
Data availability statement
The datasets presented in this study can be found in online repositories. The names of the repository/repositories and accession number(s) can be found in the article/supplementary material.
Author contributions
Y-DZ: Experiment, Algorithm, Data Processing, Writing; Z-CT: writing, translation; Y-CT: Experiment; X-YL: Writing; J-LL: Experiment; BL: Experiment. All authors contributed to the article and approved the submitted version.
Acknowledgments
The authors gratefully acknowledge the financial support of this study by the National Natural Science Foundation of China (Grant No. 52076036).
Conflict of interest
The authors declare that the research was conducted in the absence of any commercial or financial relationships that could be construed as a potential conflict of interest.
Publisher’s note
All claims expressed in this article are solely those of the authors and do not necessarily represent those of their affiliated organizations, or those of the publisher, the editors and the reviewers. Any product that may be evaluated in this article, or claim that may be made by its manufacturer, is not guaranteed or endorsed by the publisher.
References
Ahangar Asr, A., Faramarzi, A., and Javadi, A. A. (2018). An evolutionary modelling approach to predicting stress-strain behaviour of saturated granular soils. Eng. Comput. 35 (8), 2931–2952. doi:10.1108/ec-01-2018-0025
Bai, J., Diao, Y., Jia, C., Liu, C., Zhang, M., and Wang, C. (2022). A review of advances in triaxial tests: Instruments, test techniques and prospects. KSCE J. Civ. Eng. 26, 3325–3341. doi:10.1007/s12205-022-1345-1
Cabalar, A. F., and Cevik, A. (2011). Triaxial behavior of sand–mica mixtures using genetic programming. Expert Syst. Appl. 38 (8), 10358–10367. doi:10.1016/j.eswa.2011.02.051
Cen, D., Huang, D., Song, Y., and Jiang, Q. (2020). Direct tensile behavior of limestone and sandstone with bedding planes at different strain rates. Rock Mech. Rock Eng. 53 (6), 2643–2651. doi:10.1007/s00603-020-02070-x
Chen, S., Qiao, C., Ye, Q., and Khan, M. U. (2018). Comparative study on three-dimensional statistical damage constitutive modified model of rock based on power function and Weibull distribution. Environ. earth Sci. 77 (3), 108. doi:10.1007/s12665-018-7297-6
Cuisinier, O., Javadi, A. A., Ahangar-Asr, A., and Masrouri, F. (2013). Identification of coupling parameters between shear strength behaviour of compacted soils and chemical’s effects with an evolutionary-based data mining technique. Comput. Geotechnics 48, 107–116. doi:10.1016/j.compgeo.2012.10.005
Derk, L., and Unold, F. (2022). Effect of temperature gradients on water migration, frost heave and thaw-settlement of a clay during freezing-thaw process. Exp. Heat. Transf. 36, 585–596. doi:10.1080/08916152.2022.2062069
Fan, W., Deng, L., and Yuan, W. (2018). Double parameter binary-medium model of fissured loess. Eng. Geol. 236, 22–28. doi:10.1016/j.enggeo.2017.09.014
Fuhg, J. N., and Bouklas, N. (2022). On physics-informed data-driven isotropic and anisotropic constitutive models through probabilistic machine learning and space-filling sampling. Comput. Methods Appl. Mech. Eng. 394, 114915. doi:10.1016/j.cma.2022.114915
Geneva, N., and Zabaras, N. (2022). Transformers for modeling physical systems. J. Neural Netw. 146, 272–289. doi:10.1016/j.neunet.2021.11.022
Gong, M., Zhao, Y., Sun, J., Han, C., Sun, G., and Yan, B. (2022). Load forecasting of district heating system based on Informer. Energy 253, 124179. doi:10.1016/j.energy.2022.124179
Islam, M., and Gnanendran, C. (2020). Non-associated flow rule-based elasto-viscoplastic model for clay. Geosciences 10 (6), 227. doi:10.3390/geosciences10060227
Javadi, A. A., Faramarzi, A., and Ahangar-Asr, A. (2012). Analysis of behaviour of soils under cyclic loading using EPR-based finite element method. Finite Elem. analysis Des. 58, 53–65. doi:10.1016/j.finel.2012.04.005
Jiang, M., Zhang, A., and Shen, Z. (2020). Granular soils: From DEM simulation to constitutive modeling. Acta Geotech. 15 (7), 1723–1744. doi:10.1007/s11440-020-00951-7
Kohestani, V. R., and Hassanlourad, M. (2016). Modeling the mechanical behavior of carbonate sands using artificial neural networks and support vector machines. Int. J. Geomechanics 16 (1), 04015038. doi:10.1061/(asce)gm.1943-5622.0000509
Lai, Y., Jin, L., and Chang, X. (2009). Yield criterion and elasto-plastic damage constitutive model for frozen sandy soil. Int. J. Plasticity 25 (6), 1177–1205. doi:10.1016/j.ijplas.2008.06.010
Lai, Y., Li, S., Qi, J., Gao, Z., and Chang, X. (2008). Strength distributions of warm frozen clay and its stochastic damage constitutive model. Cold Regions Sci. Technol. 53 (2), 200–215. doi:10.1016/j.coldregions.2007.11.001
Li, J., Duan, K., Meng, H., Wang, J., Zhang, Q., and Wang, L. (2022). On the mechanical properties and failure mechanism of conglomerate specimens subjected to triaxial compression tests. Rock Mech. Rock Eng. 56, 973–995. doi:10.1007/s00603-022-03110-4
Li, P., Wu, Y. F., and Gravina, R. (2016). Cyclic response of FRP-confined concrete with post-peak strain softening behavior. Constr. Build. Mater. 123, 814–828. doi:10.1016/j.conbuildmat.2016.07.065
Li, Q., Jin, S., Liu, F., Zhang, H., and Duan, Z. j. (2022). Stress-strain analysis and safety evaluation of concrete-faced rockfill dams. Mech. Adv. Mater. Struct., 1–18. doi:10.1080/15376494.2022.2144972
Li, Z., Chen, J., and Mao, C. (2019). Experimental and theoretical investigations of the constitutive relations of artificial frozen silty clay. Materials 12 (19), 3159. doi:10.3390/ma12193159
Lin, P., Ratnam, R., Sankari, H., and Garg, A. (2019). Mechanism of microstructural variation under cyclic shearing of shantou marine clay: Experimental investigation and model development. Geotechnical Geol. Eng. 37, 4163–4210. doi:10.1007/s10706-019-00900-6
Linka, K., Hillgärtner, M., Abdolazizi, K. P., Aydin, R. C., Itskov, M., and Cyron, C. J. (2021). Constitutive artificial neural networks: A fast and general approach to predictive data-driven constitutive modeling by deep learning. J. Comput. Phys. 429, 110010. doi:10.1016/j.jcp.2020.110010
Liu, E., and Lai, Y. (2020). Thermo-poromechanics-based viscoplastic damage constitutive model for saturated frozen soil. Int. J. Plasticity 128, 102683. doi:10.1016/j.ijplas.2020.102683
Liu, J., Yang, P., and Yang, Z. (2022). Experimental study on deformation characteristics of chloride silty clay during freeze-thaw in an open system. Cold Regions Sci. Technol. 197, 103518. doi:10.1016/j.coldregions.2022.103518
Liu, X., Liu, J., Tian, Y., Chang, D., and Hu, T. f. (2019). Influence of the freeze-thaw effect on the Duncan-Chang model parameter for lean clay. Transp. Geotech. 21, 100273. doi:10.1016/j.trgeo.2019.100273
Logarzo, H. J., Capuano, G., and Rimoli, J. J. (2021). Smart constitutive laws: Inelastic homogenization through machine learning. Comput. methods Appl. Mech. Eng. 373, 113482. doi:10.1016/j.cma.2020.113482
Lu, J., Zhang, M., Zhang, X., Pei, W., and Bi, J. (2018). Experimental study on the freezing–thawing deformation of a silty clay. Cold Regions Sci. Technol. 151, 19–27. doi:10.1016/j.coldregions.2018.01.007
Ma, D., Ma, Q., Yao, Z., Yuan, P., and Zhang, R. R. (2019). Dynamic mechanical properties and failure mode of artificial frozen silty clay subject to one-dimensional coupled static and dynamic loads. Adv. Civ. Eng. 2019, 1–9. doi:10.1155/2019/4160804
Ma, T., Xiang, G., Shi, Y., and Liu, Y. (2022). Horizontal in situ stresses prediction using a CNN-BiLSTM-attention hybrid neural network. Geomechanics Geophys. Geo-Energy Geo-Resources 8 (5), 152. doi:10.1007/s40948-022-00467-2
Malakar, P., Thakur, M. S. H., Nahid, S. M., and Islam, M. M. (2022). Data-driven machine learning to predict mechanical properties of monolayer transition-metal dichalcogenides for applications in flexible electronics. ACS Appl. Nano Mater. 5 (11), 16489–16499. doi:10.1021/acsanm.2c03564
Niu, Y., Wang, X., Liao, M., and Chang, D. (2022). Strength criterion for frozen silty clay considering the effect of initial water content. Cold Regions Sci. Technol. 196, 103521. doi:10.1016/j.coldregions.2022.103521
Park, H., and Cho, M. (2021). Multiscale constitutive model using data–driven yield function. Compos. Part B Eng. 216, 108831. doi:10.1016/j.compositesb.2021.108831
Peng, X., Wang, Z., Luo, T., Yu, M., and Luo, Y. s. (2008). An elasto-plastic constitutive model of moderate sandy clay based on BC-RBFNN. J. Central South Univ. Technol. 15 (1), 47–50. doi:10.1007/s11771-008-0312-4
Rashidian, V., and Hassanlourad, M. (2014). Application of an artificial neural network for modeling the mechanical behavior of carbonate soils. Int. J. Geomechanics 14 (1), 142–150. doi:10.1061/(asce)gm.1943-5622.0000299
Romo, M. P., García, S. R., Mendoza, M. J., and Taboada-Urtuzuástegui, V. (2001). Recurrent and constructive-algorithm networks for sand behavior modeling. Int. J. Geomechanics 1 (4), 371–387. doi:10.1061/(asce)1532-3641(2001)1:4(371)
Shen, P., Tang, H., Ning, Y., and Xia, D. (2019). A damage mechanics based on the constitutive model for strain-softening rocks. Eng. Fract. Mech. 216, 106521. doi:10.1016/j.engfracmech.2019.106521
Song, B., Liu, E., Shi, Z., Wang, P., and Yu, Q. h. (2021). Creep characteristics and constitutive model for frozen mixed soils. J. Mt. Sci. 18 (7), 1966–1976. doi:10.1007/s11629-020-6463-y
Stefanos, D., and Gyan, P. (2015). On neural network constitutive models for geomaterials. J. Civ. Eng. Res. 5 (5), 106–113. doi:10.5923/j.jce.20150505.02
Teng, Z. C., Liu, X. Y., Liu, Y., Zhao, Y. X., Liu, K. Q., and Teng, Y. C. (2021). Stress–strain assessments for buried oil pipelines under freeze-thaw cyclic conditions. J. Press. Vessel Technol. 143 (4), 143. doi:10.1115/1.4049712
Teng, Z. C., Teng, Y., Liu, J., Zhou, Y. D., Liu, X. Y., Li, Z. W., et al. (2023). Study on triaxial test and constitutive prediction model of frozen silty clay. Front. Earth Sci. 2280, 1069182. doi:10.3389/feart.2022.1069182
Vignjevic, R., Djordjevic, N., De Vuyst, T., and Gemkow, S. (2018). Modelling of strain softening materials based on equivalent damage force. Comput. Methods Appl. Mech. Eng. 335, 52–68. doi:10.1016/j.cma.2018.01.049
Wang, K., and Sun, W. C. (2019). Meta-modeling game for deriving theory-consistent, microstructure-based traction–separation laws via deep reinforcement learning. Comput. Methods Appl. Mech. Eng. 346, 216–241. doi:10.1016/j.cma.2018.11.026
Wang, P., Liu, E., Zhang, D., Liu, X., Zhang, G., and Song, B. (2020). An elastoplastic binary medium constitutive model for saturated frozen soils. Cold Regions Sci. Technol. 174, 103055. doi:10.1016/j.coldregions.2020.103055
Wu, Z., Pan, F., Li, D., He, H., Zhang, T., and Yang, S. (2022). Prediction of photovoltaic power by the informer model based on convolutional neural network. Sustainability 14 (20), 13022. doi:10.3390/su142013022
Xiangdong, L., Guangyong, Z., and Pingfang, X. (2008). Normalization characteristic of sands under triaxial compression and numerical modeling method[J]. Chin. J. Rock Mech. Eng. 27 (1), 3082–3087.
Yang, Z., Liu, L., Li, N., and Tian, J. (2022). Time series forecasting of motor bearing vibration based on informer. Sensors 22 (15), 5858. doi:10.3390/s22155858
Yu, L., Xu, X., and Ma, C. (2010). Combination effect of seasonal freezing and artificial freezing on frost heave of silty clay. J. Central South Univ. Technol. 17 (1), 163–168. doi:10.1007/s11771-010-0026-2
Zhang, D., and Liu, E. (2019). Binary-medium-based constitutive model of frozen soils subjected to triaxial loading. Results Phys. 12, 1999–2008. doi:10.1016/j.rinp.2019.02.029
Zhang, F., Shi, S., Feng, D., and Cai, L. z. (2021). Investigation on creep behavior of warm frozen silty sand under thermo-mechanical coupling loads. J. Mt. Sci. 18 (7), 1951–1965. doi:10.1007/s11629-020-6411-x
Zhang, N., Shen, S. L., Zhou, A., and Xu, Y. S. (2019). Investigation on performance of neural networks using quadratic relative error cost function. IEEE Access 7, 106642–106652. doi:10.1109/access.2019.2930520
Zhang, Q., Jiang, B., and Lv, H. (2016). Analytical solution for a circular opening in a rock mass obeying a three-stage stress–strain curve. Int. J. Rock Mech. Min. Sci. 86, 16–22. doi:10.1016/j.ijrmms.2016.03.013
Zhao, G. F., Wei, X. D., Liu, F., and Liu, W. B. (2020). Non-parameterized numerical analysis using the distinct lattice spring model by implementing the duncan–chang model. Rock Mech. Rock Eng. 53 (5), 2365–2380. doi:10.1007/s00603-020-02047-w
Zhao, H., Huang, Z., and Zou, Z. (2014). Simulating the stress-strain relationship of geomaterials by support vector machine. Math. Problems Eng. 2014, 1–7. doi:10.1155/2014/482672
Zhao, Y., Zhang, M., and Gao, J. (2022). Research progress of constitutive models of frozen soils: A review. Cold Regions Sci. Technol. 206, 103720. doi:10.1016/j.coldregions.2022.103720
Zheng, G., Tang, Y., Zhang, Y., Gao, Y., Zhu, G., Gao, M., et al. (2022). Study on failure difference of hard rock based on a comparison between the conventional triaxial test and true triaxial test. Front. Earth Sci. 10, 923611. doi:10.3389/feart.2022.923611
Keywords: triaxial test of frozen soil, deep learning, constitutive equation of frozen soil, weibull distribution, strain-softening, Duncan-Chang model, long short term memory networks
Citation: Teng Z-C, Zhou Y-D, Teng Y-C, Liu X-Y, Liu J-L and Li B (2023) Deviatoric stress-strain curve construction with strain-softening account via the damage-modified Duncan-Chang, arctangent and informer models: a comparative analysis. Front. Earth Sci. 11:1238286. doi: 10.3389/feart.2023.1238286
Received: 11 June 2023; Accepted: 21 July 2023;
Published: 03 August 2023.
Edited by:
Tianshou Ma, Southwest Petroleum University, ChinaReviewed by:
Zhenzhong Shen, Hohai University, ChinaQiangui Zhang, Southwest Petroleum University, China
Copyright © 2023 Teng, Zhou, Teng, Liu, Liu and Li. This is an open-access article distributed under the terms of the Creative Commons Attribution License (CC BY). The use, distribution or reproduction in other forums is permitted, provided the original author(s) and the copyright owner(s) are credited and that the original publication in this journal is cited, in accordance with accepted academic practice. No use, distribution or reproduction is permitted which does not comply with these terms.
*Correspondence: Ya-Dong Zhou, enlkMTk5NzA1MTJAMTYzLmNvbQ==