 Yulong Dong
 Yang Liu1*
 Yansi Chen
 Xiaobing Huang
- 1Center for Geophysical Survey, China Geological Survey, Langfang, China
- 2School of Earth Sciences and Resources, China University of Geosciences, Beijing, China
The bedrock beneath the Tengger Desert is covered by Quaternary deposits, making it difficult to directly observe the underlying geological information using traditional geological methods. In areas with limited prior geological information, employing geophysical methods to obtain deep-seated information, constructing a multi-source geophysical dataset, and performing three-dimensional modeling can significantly enhance our understanding of the underground geological structures. Cluster analysis is a fundamental unsupervised machine learning technique employed in data mining to investigate the data structure within the feature space. This paper proposes an iterative weighted distance-based extension to the k-means clustering algorithm, referred to as the Iterative Weighted Distance K-means (IW k-means++) algorithm. It incorporates the farthest distance method to select the initial centroid, performs iterative centroid updates based on weighted distance, and dynamically adjusts feature weights during training. The Davies-Bouldin index shows that the performance of IW k-means ++ clustering algorithm is better than the traditional K-Meme ++ clustering algorithm in 3D pseudo-lithology modeling.
1 Introduction
The term “overlying area” refers to a region where the bedrock is extensively and continuously covered by quaternary materials (such as aeolian sediments, alluvial sediments, swamps, etc.) over a prolonged period. With the progressive discovery and exploitation of mineral resources in exposed areas, mineral resources that are easy to find near the surface are gradually depleted. Geologists have started to emphasize the exploration of covered and semi-covered regions, which promotes the development of underground mineral potential mapping (Zhang et al., 2021), leading to the development of various exploration techniques suitable for these specific areas (Lowe et al., 1998; Wang et al., 2015). In the investigation of geological structures in covered areas, direct observation of the underlying geological information is hindered by limited bedrock outcrops and the presence of overlying layers (Cheng, 2003; Carneiro et al., 2012; Wu et al., 2021). To extract the subsurface information and unveil the characteristics of the bedrock, advanced exploration techniques are necessary. Among these techniques, geophysical methods have demonstrated notable effectiveness and have emerged as a widely adopted approach in recent years for studying covered areas in geology-related scientific survey (Shi et al., 2003; Lai et al., 2014; Perrouty S et al., 2014). In numerous globally significant mineralized belts, the utilization of geophysical techniques to acquire essential geological and mineralization information beneath cover has been instrumental in achieving breakthroughs in mineral exploration. Notable examples include the Spence, Gabriela Mistral, and Coyávasi Porphyry Copper Deposits in Chile. Moreover, investigations into the deep-seated geological structures in covered areas hold substantial importance in diverse domains, including geological hazard forecasting and prediction.
In comparison to conventional geological methods, geophysical techniques present a range of advantages, including non-invasiveness, non-contact nature, the ability to acquire macroscopic information, high precision, as well as low cost and time saving. In the past, the interpretation of geophysical data relied on manual analysis, demanding extensive time and experience, and potentially introducing subjectivity. Driven by the advancements in machine learning and artificial intelligence technologies, mathematical geology is undergoing a significant transformation towards the realm of digital geology (Li et al., 2013). Decision trees have been employed for auxiliary prediction and mapping of mineral resources (Rodriguez-Galiano et al., 2015), support vector machines have been utilized for geological modeling (Wang et al., 2015), clustering methods have been employed for the identification of homogeneous domains in geological statistics (Kapageridis et al., 2014), deep learning algorithm is used to solve the problem of unbalanced training data in metallogenic prospect mapping (Zhang et al., 2021). Intelligent interpretation of geophysical data is becoming feasible in the field of earth science (Shalev E et al., 2010; Ryan et al., 2013).
Cluster analysis is an important unsupervised machine learning method used to study classification problems (Steinhaus, 1956; Ball and Hall, 1965; Bosch, 1999; Bedrosian et al., 2007). By measuring the similarity between attributes in the feature space, it enables automatic, objective, and quantitative analysis of multi-source geophysical data sets (Fraser et al., 2012; Di Giuseppe et al., 2018; Melo and Li, 2019; Basant et al., 2021; Ali et al., 2021). Partition-based clustering methods, in particular, are widely used in the field of Earth sciences due to their advantages of simplicity, efficiency, ability to handle large-scale datasets, and interpretability of results (Ali et al., 2021). K-means clustering is used to group multiple conventional logging curves from the target reservoir, creating a meta-object for lithology identificatio (Cao et al., 2022).
This study proposes an iterative weighted k-means (IW k-means) algorithm, which uses the farthest distance method to set the initial centroid and automatically updates the weight of each feature during training (Li and Man, 2013; Yu et al., 2019; Li et al., 2019). Multi-source geophysical data sets were used for 3D pseudo-lithology modeling in the lower depth of the Tengger Desert cover area (Li and Man, 2013; Yu et al., 2019; Li et al., 2019). By comparing the modeling results of IW k-means algorithm with those of traditional K-means algorithm, the results show that IW k-means algorithm has more advantages in the clustering of multi-source geophysical data sets.
2 Methodology
Clustering is the process of grouping samples with high similarity into clusters (Jain, 2010). Unlike supervised learning algorithm, clustering methods do not require prior knowledge or the creation of labeled datasets (Wang et al., 2015). As well as, clustering excel in exploring the intrinsic characteristics of the data. To address the issue of pseudo-3D lithology modeling in covered areas where sample labels are scarce, clustering methods offer distinct advantages.
2.1 K-means and k-means++ algorithms
Traditional k-means algorithm clustering requires pre-specifying the number of clusters in advance. The algorithm iteratively assigns data points to clusters and updates the cluster centers to minimize the within-cluster sum of squares. Finally reach the goal of “points within clusters are close enough and points between clusters are far enough" (Li and Man, 2013).
K-means clustering algorithm is an optimization process. For a multidimensional dataset X = {x1, x2, ., xn}, the goal is to partition the data set into k clusters such that the similarity between data points within the same cluster is maximized, while the similarity between data points in different clusters is minimized, aiming to minimize the objective function Eq. 1:
Where
The multi-source geophysical data set composed of density data and resistivity data can be regarded as numerical data set, which is very suitable for clustering by k-means algorithm.
The traditional K-means algorithm workflow is as follows:
(1) Randomly select k data points as initial centroids.
(2) Compute the Euclidean distance between each data point and the k centroids, and assign the data point to the cluster associated with the nearest centroid. (Eq. 2).
(3) For each cluster, the centroid position is recalculated as the average of all data points in the cluster.
(4) Continue iterating through steps (2) and (3) until either the cluster assignments no longer change or the maximum number of iterations is reached.
The advantage of the k-means algorithm lies in its simplicity and ease of implementation. However, the random selection of initial centroids can result in unstable clustering outcomes, where the same dataset may yield different clustering results. The k-means++ algorithm provides an optimization by employing the farthest distance method for selecting initial centroids. The objective is to maximize the initial separation between cluster centers. This approach avoids the issue of weaker clustering that can sometimes occur in the standard k-means algorithm. However, it does introduce the problem of including noise points or outliers in the cluster centers. In certain scenarios, it is necessary to assign higher weights to certain features. The traditional k-means algorithm and its optimized version k-means++ algorithm treat all data features equally during training, which limits their effectiveness in analyzing multi-source geophysical data sets.
2.2 Iterative weighting k-means++ algorithm
This study proposes a iterative weighted k-means++ (IW k-means++) algorithm based on the traditional k-means algorithm. By introducing weighting factors, it aims to reduce the impact of noise and outliers on the clustering results.
Compared to the traditional k-means algorithm and IW k-means++ algorithm, the IW k-means++ algorithm can better handle noise and outliers. It incorporates different weights for each feature of the same data point during the training process, resulting in improved clustering accuracy (Li and Man, 2013; Yu et al., 2019). The details of the IW k-means++ algorithm are shown in Figure 1.
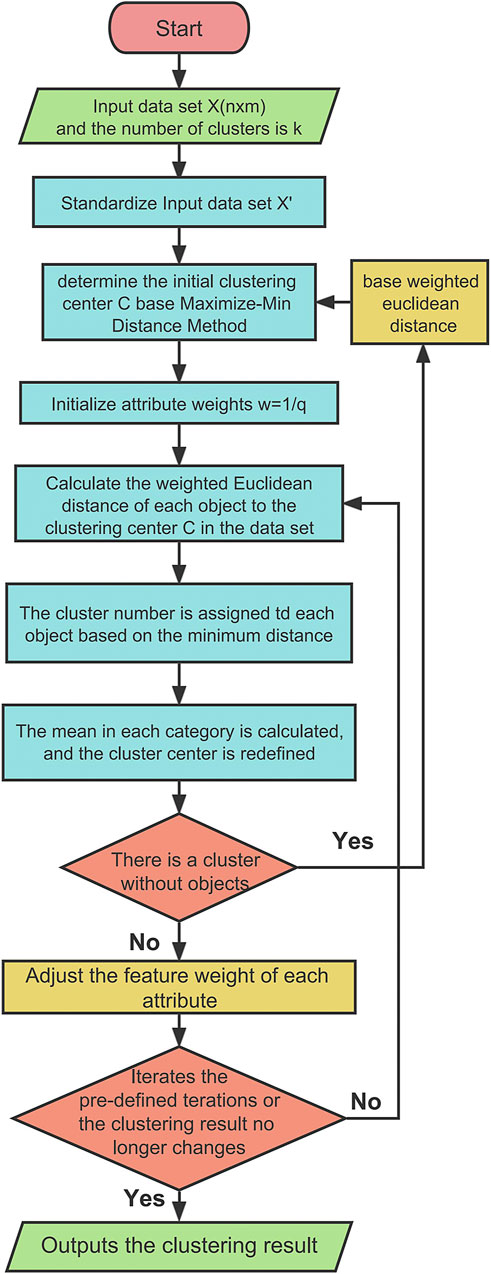
FIGURE 1. Workflow of the lW k-means++ algorithm.
The initial weight for each feature is set as 1/q, q is the default initial cluster number. During the iteration process of the algorithm, the feature weights are continuously updated to reflect the impact of different features on the clustering results. Calculate the weighted Euclidean distance (Eq. 3) and assign each sample to the center of mass that is closest in terms of this distance measure. weighted Euclidean distance is defined as:
The characterization factor (wo) is calculated based on Eq. 4, where nk represents the number of samples in cluster k, Mp denotes the mean of feature attribute p, and Mkp represents the mean of feature attribute p in cluster k.
Where wp is the weight factor (Eq. 5) that assists the IW k-means++ algorithm in selecting accurate cluster centers, reflecting the differentiation level of each feature in the selection of cluster centers. For each feature attribute p, the algorithm calculates the weighted Euclidean distance between the samples and all centroids, and the value of wp is updated. Then, the updated wp is used to calculate the weighted Euclidean distance and reassign the samples to the nearest centroid.
The IW k-means++ algorithm uses the furthest distance method to determine the initial centroids, which helps to address the issue of clustering result uncertainty. Additionally, the use of wp in IW k-means algorithm assists in selecting accurate cluster centers and reflects the differentiation level of each feature in choosing cluster centers.
3 Performance evaluation of clustering algorithm
The number of clusters is the most critical parameter that affects the effect of k-means algorithm. The Davies-Bouldin index (DBI) is used to evaluate clustering performance based on the compactness within clusters and separation between clusters (Eq. 6). It can be utilized for determining the optimal number of clusters and evaluating the performance of unsupervised clustering algorithms on unlabeled samples. (Brahmana et al., 2020; Wu et al., 2021).
Where K is the number of clusters, Sq and Sp represent the Euclidean distance between each sample and their respective centroids q and p, while Dpq signifies the Euclidean distance between centroids q and p.
As previously mentioned, the initial centroids in the traditional k-means algorithm are randomly determined, and the clustering results may vary depending on the initial centroids. In this study, we used the test data, took 4 as the clustering number, and used the traditional k-means algorithm for 10 times of clustering. The DBI for the clustering results range from 1.13 (K9) to 0.87 (K3). (Figure 2). In contrast to that the DBI for IW k-means++ algorithm clustering was found to be 0.76. These results demonstrate that the IW k-means++ algorithm outperforms the traditional k-means algorithm on the test data.
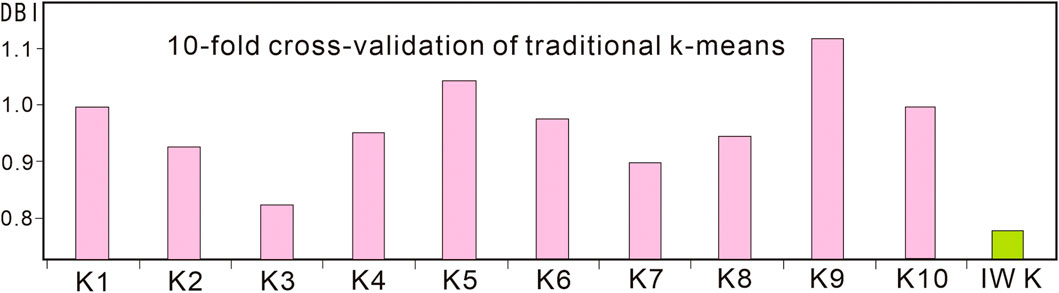
FIGURE 2. Davies-Bouldin index (DBI) for the traditional k-means and IW k-means++.
4 Multi-source geophysical datasets
4.1 Study area
The Tengger Desert is the fourth largest desert in China, located at approximately 37°–40°N and 102°-106°E. It covers an area of about 30,000 km2 and belongs to the typical inland arid climate (Wang et al., 1997). The desert has an average elevation of around 1,200–1,400 m. The study area is located in its southwest (Figure 6; Figure 7A).
China places great emphasis on desertification control, sand fixation, and environmental protection. There has been significant research on vegetation and biodiversity in the Tengger Desert (Chen and Pan, 2001; Ma et al., 2020). However, deep geological research in the area is relatively limited. Challenges such as deep water table, hole collapse during drilling, and high costs have restricted the application of geological drilling in deep geological investigations of the Tengger Desert. Geological research in the Alxa block, where the Tengger Desert is located, primarily focuses on rock outcrops and utilizes techniques such as rock dating, structural inference, route surveys, geophysical exploration, and remote sensing interpretation (Gong et al., 2011; Liu et al., 2019).
The geological structure in desert areas is complex and diverse. The study area is located at the junction of multiple tectonic plates and has experienced multiple phases of complex tectonic changes and crustal evolution (Figure 6A), resulting in distinct and prominent signatures in the geophysical field (Zhang and Liu, 2013). Gravity data is used to infer the distribution and density variations of subsurface materials by measuring changes in the gravity field on the Earth’s surface. The geoelectrical method is capable of detecting variations in the electrical conductivity of underground rock layers, thereby providing information about rock types, distribution, thickness, and structural changes. Additionally, compared to seismic exploration, gravity exploration and geoelectrical method have the advantages of not requiring a seismic source, being non-destructive, having lower costs, and being applicable in various contexts.
4.2 Geophysical data acquisition
The original data were collected by the Geophysical Survey Center of the China Geological Survey from the study area during the years 2020–2022. These data include 1:250,000 regional gravity survey data, 1:1,000,000 regional magneto telluric (MT) survey data, as well as rock and mineral specimen collection and physical property test data. The gravity data collection included 460 measurement points, following a regular grid pattern with a spacing of 2.8 km * 2.8 km (Figure 3A). For the magneto telluric (MT) survey, 80 measurement points were collected in the study area (MacQueen, 1967; Vozoff, 1987). The points were evenly distributed using a grid pattern with a spacing of 20 km * 20 km (Figure 3B).
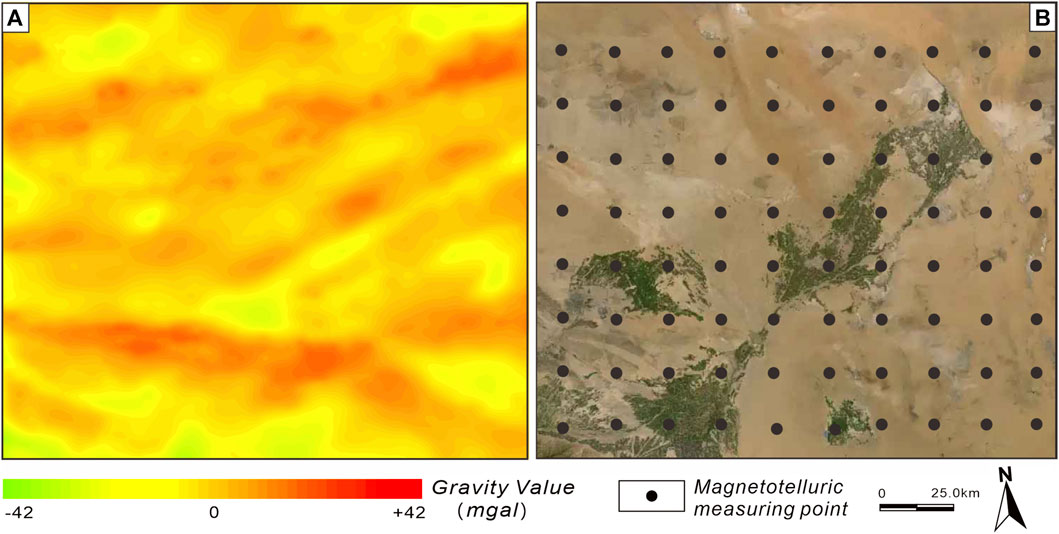
FIGURE 3. (A) Residual gravity map. (B) Actual material diagram of magnetotelluric sounding.
4.3 Integration and processing of gravity and geoelectrical data
Generating synthetic datasets that resemble real-world multi-rock physics datasets is a challenging task due to the nonlinearity of geological processes (Bosch et al., 2002). The sources of noise in different geophysical data and their sensitivity to noise vary. The integration of multiple data sources has yielded favorable results in providing a comprehensive interpretation of the same geological body (Gao et al., 2004; Jiang et al., 2012; Li et al., 2013), the joint inversion of observed data from multiple physical fields can provide more accurate and reliable information about subsurface media structure. The internationally popular approach for joint inversion is the model structure-coupled method (Lindsey and Newman, 2015). An exemplary instance is the cross-gradient constraint-based coupling method introduced by Gallardo and Meju. (2011). This method addresses the uncertainties and limitations faced by single-field inversions (Gallardo and Meju, 2003; Gallardo and Meju, 2004; Gallardo and Meju, 2007; Fraser et al., 2012). For instance, electromagnetic field inversion is affected by complexities in subsurface structures and seawater effects (Peng, 2012), while gravity inversion is influenced by the coupling effects of density and pressure (Yan et al., 2020). The study employed a three-dimensional joint inversion method for gravity and electromagnetic data to process the measured data, resulting in a dataset composed of resistivity and residual density.
To address the issue of grid mismatch arising from different inversion grids for various data types, a multi-to-one grid mapping algorithm was employed in the inversion process. The selection of cross-gradient weighting factors took into account the prior information of geological features, physical properties, and borehole data within the study area. By combining the multivariate Gaussian distribution with geophysical data, the electrical resistivity and density attributes of the subsurface media were obtained.
The data involved in the inversion process included Bouguer gravity anomalies obtained from field measurements, as well as four impedance tensor components (Zxx, Zxy, Zyx, Zyy) and tipper (Tzx, Tzy) measured at all data points. A total of 40 frequencies were considered, ranging from 320 Hz to 0.00055 Hz. The error floor for the data was set to 10% for each impedance tensor component and 2% for each tipper component. The study used equal spacing grid partitioning for the measured data coverage area, with increasing spacing towards the outer regions. In the vertical direction, the first layer had a thickness of 20 m, while subsequent layers increased exponentially. The initial inversion model was obtained from separate inversions of gravity and electromagnetic data. Maximum iteration count and data misfit threshold were set to control the stopping criteria for the inversion. The details are shown in Figure 4.
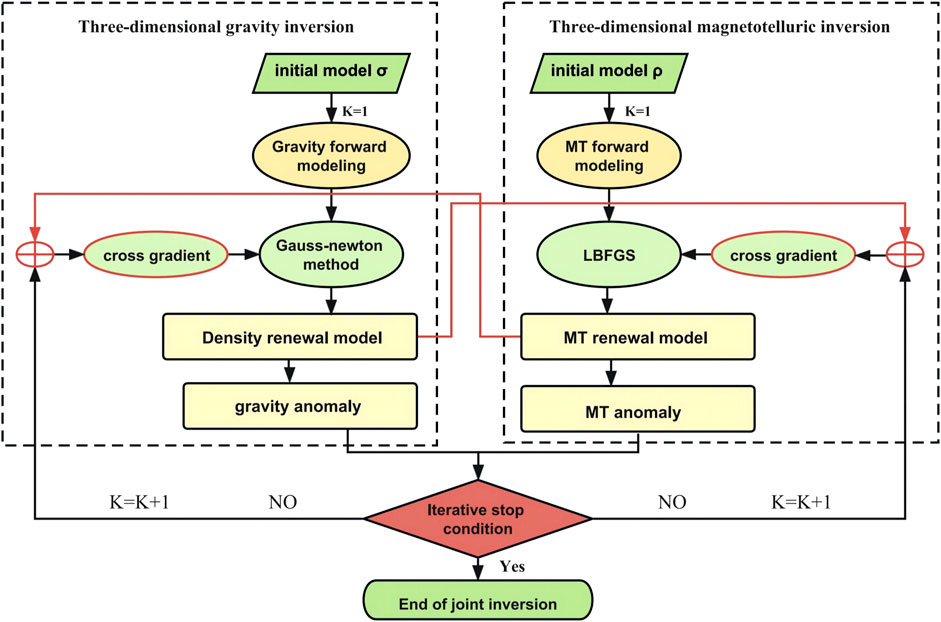
FIGURE 4. Workflow of the Three-diamensional joint inversion method for gravity and geoelectric field.
The obtained data from the inversion were subjected to discrete smoothing interpolation using SKUA-GOCAD software (Zhang et al., 2017; Zhang et al., 2021), resulting in the generation of a 3D density model and a 3D resistivity model (Jessell, 2001) (Figure 5).
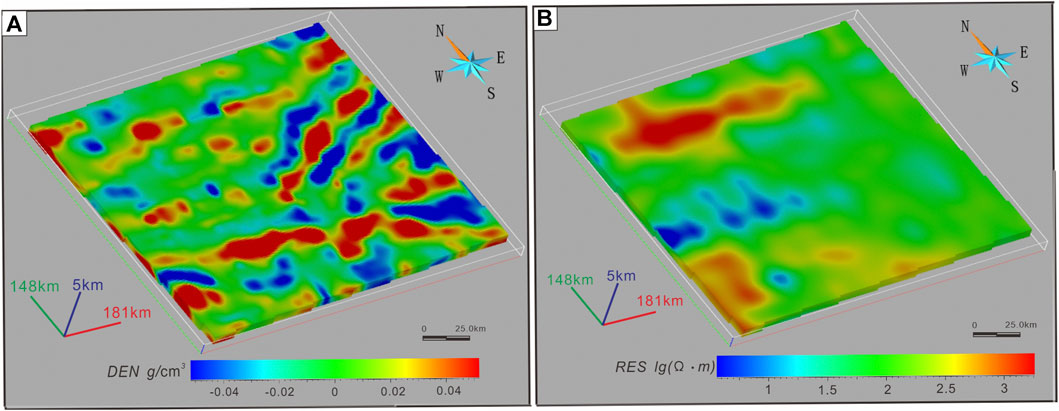
FIGURE 5. (A) 3D density model. (B) 3D resistivity model.
5 Geologic setting
The study area is situated in the northeastern part of the North Qilian block, which is located on the northeastern margin of the Qinghai-Tibet Plateau (Song et al., 2013), and in the southern part of the Alxa block on the southern margin of the North China Platform (Figure 6). It is a key region for the production of black metal, non-ferrous metal, precious metal, and salt minerals in China. The Jinchuan ultra-large magmatic Ni-Cu-PGE deposit, which has the third largest nickel metal reserves in the world, is located in the southwest Tengger Desert (Figure 7F).
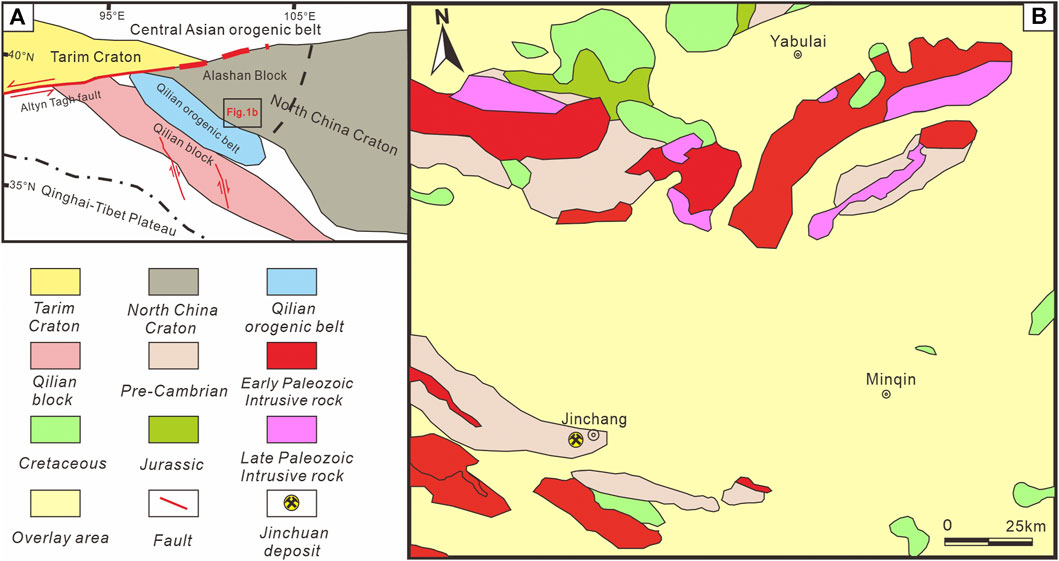
FIGURE 6. (A) Simplified tectonic geological map of the study area. (B) Simplified geological map of southern Alxa block (modified from 1: 1000000 geological map) Names of ore districts in (B) are Jinchuan district.
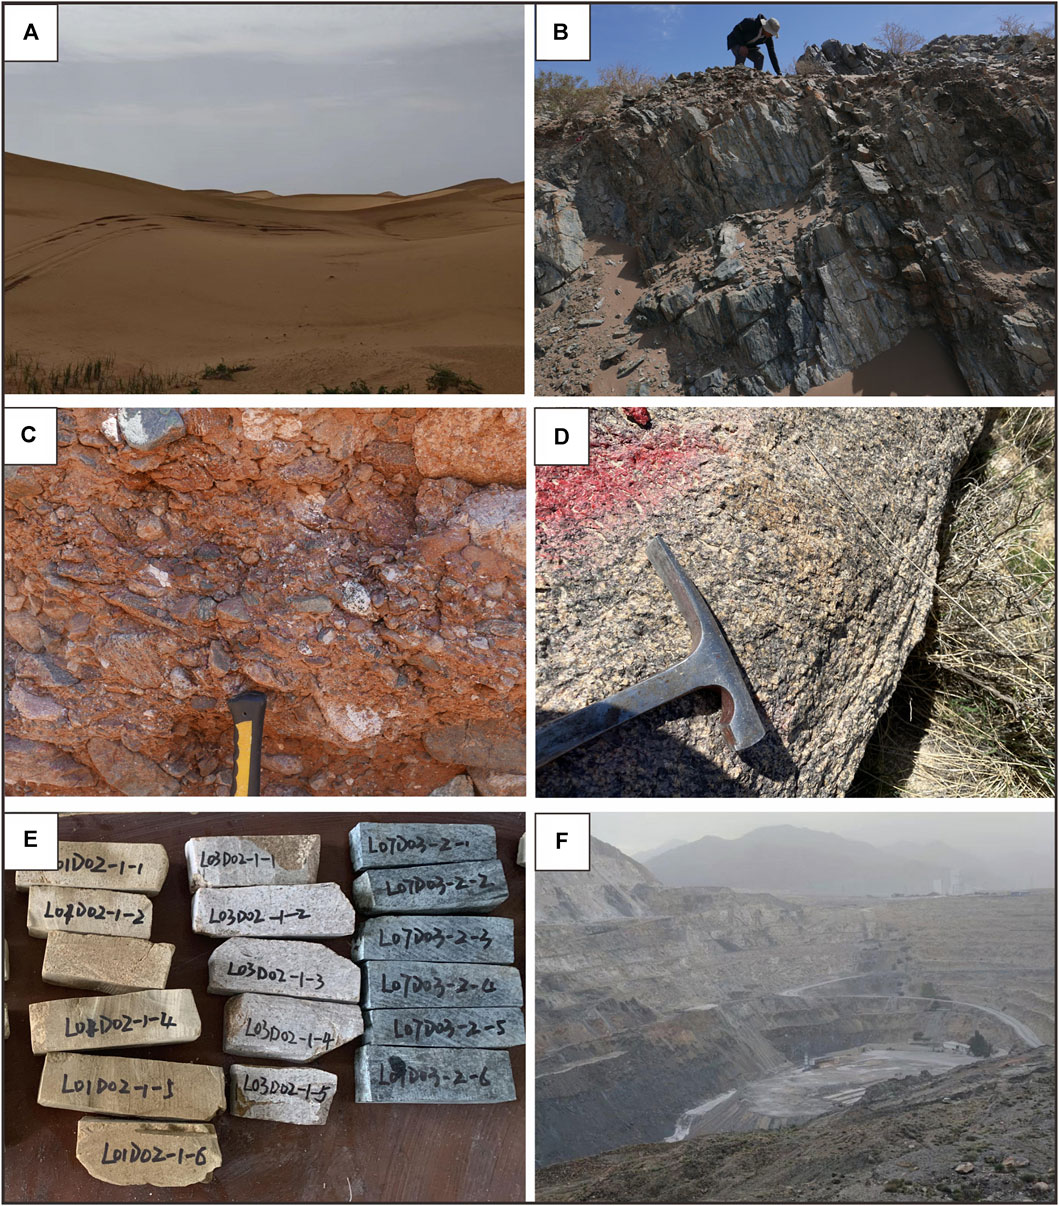
FIGURE 7. (A) Tengger Desert covering area. (B) Alxa Group of Pre-cambrian system. (C) Cretaceous Miaogou Formation Depositional clastic rock. (D) Early Paleozoic Granodiorite. (E) Physical property sample, The lithology from left to right is sandstone, granite, and gneiss. (F) Jinchuan Ni-Cu-PGE deposit.
Since its discovery in 1958, no new mineral deposits have been found in the surrounding area of the Jinchuan deposit for nearly 70 years. The Jinchuan super large-scale deposit, as an exceptional accumulation of mantle-derived metal elements before the Cambrian period, is likely the result of an important geologic event involving crust-mantle material exchange (Tang et al., 2006). It is closely related to Paleozoic intrusive rocks, suggesting the potential presence of similar genetically related deposits in the surrounding area (Figure 7A). In order to overcome the limited exposure of bedrock in the study area, sample collection will focus on areas with well-developed and well-exposed stratigraphy (Figure 7E).
The pre-Cambrian rock formations in the study area are mainly composed of the Longshoushan Formation (LSS) and Alxa Formation (Figure 7B), which consists of rock types such as amphibolite, gneiss, schist, marble, and quartzite. These rocks have densities ranging from 2.31 to 3.05 g/cm3 and resistivities ranging from 655 to 9,700 Ω m, indicating a medium to high density and medium to high resistivity characteristics.
The Jurassic strata are mainly represented by the Qingtujing Formation (QTJ), composed of conglomerates and sandstones, with densities ranging from 2.49 to 2.56 g/cm3 and resistivities ranging from 203 to 932 Ω m. The Cretaceous strata, specifically the Miaogou Formation (MG) (Figures 7C, E), are primarily distributed in the northwestern part of the study area, with scattered occurrences in various tectonic units. The MG is composed of conglomerates, conglomeratic sandstones, and mudstones, with densities ranging from 2.45 to 2.53 g/cm3 and resistivities ranging from 30 to 261 Ω m. Overall, these formations exhibit medium to low densities and relatively low resistivity properties.
The exposed rocks in the study area during the Middle Paleozoic are primarily acidic intrusive rocks, including granite, granodiorite, quartz monzonite, and quartz diorite (Figure 7F). They have densities ranging from 2.61 to 2.69 g/cm3 and resistivities ranging from 428 to 1,295 Ω m, displaying characteristics of moderate density and moderate resistivity. The Late Paleozoic intrusive rocks mainly consist of potassium feldspar granite and syenogranite, with densities ranging from 2.57 to 2.75 g/cm3 and resistivities ranging from 197 to 3,672 Ω m, exhibiting medium to high density and medium to high resistivity characteristics.
6 Results validation and discussion
The k-means algorithm was applied to the synthetic dataset of the study area in this study, and it was run randomly 30 times. The DBI for the traditional k-means clustering model ranged from 0.84 (K22) to 0.98 (K6) (Figure 8). Therefore, the clustering results from K22, which consisted of 3 clusters, were chosen as the final clustering output for the k-means algorithm. The IW k-means++ algorithm achieved a minimum DBI value of 0.74. This indicates that the IW k-means++ algorithm outperforms the traditional k-means algorithm in terms of performance in the study area. indicated that the optimal number of clusters was 3.
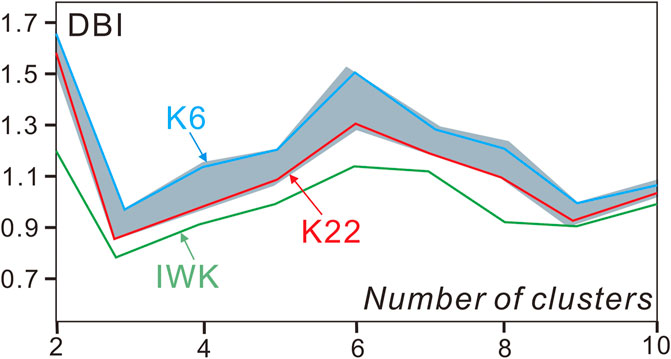
FIGURE 8. Davies-Bouldin index (DBI) for random run of traditional k-means clustering and IW k-means++ clustering.
The k-means algorithms (K22) and IW k-means++ algorithm clustering outcomes are depicted in Figure 9. In the IW k-means++ clustering, the weight values assigned to the density and resistivity features are 0.61 and 0.39, respectively. Assign different lithologic units to each cluster based on their dominant characteristics. Interpret the resulting pseudo-lithologic model to gain insights into the subsurface lithology of the Tengger Desert. The first two clusters exhibit similar clustering patterns in both methods. Cluster 1 is characterized by medium-low density and low resistivity, while Cluster 2 is characterized by medium density and medium resistivity.
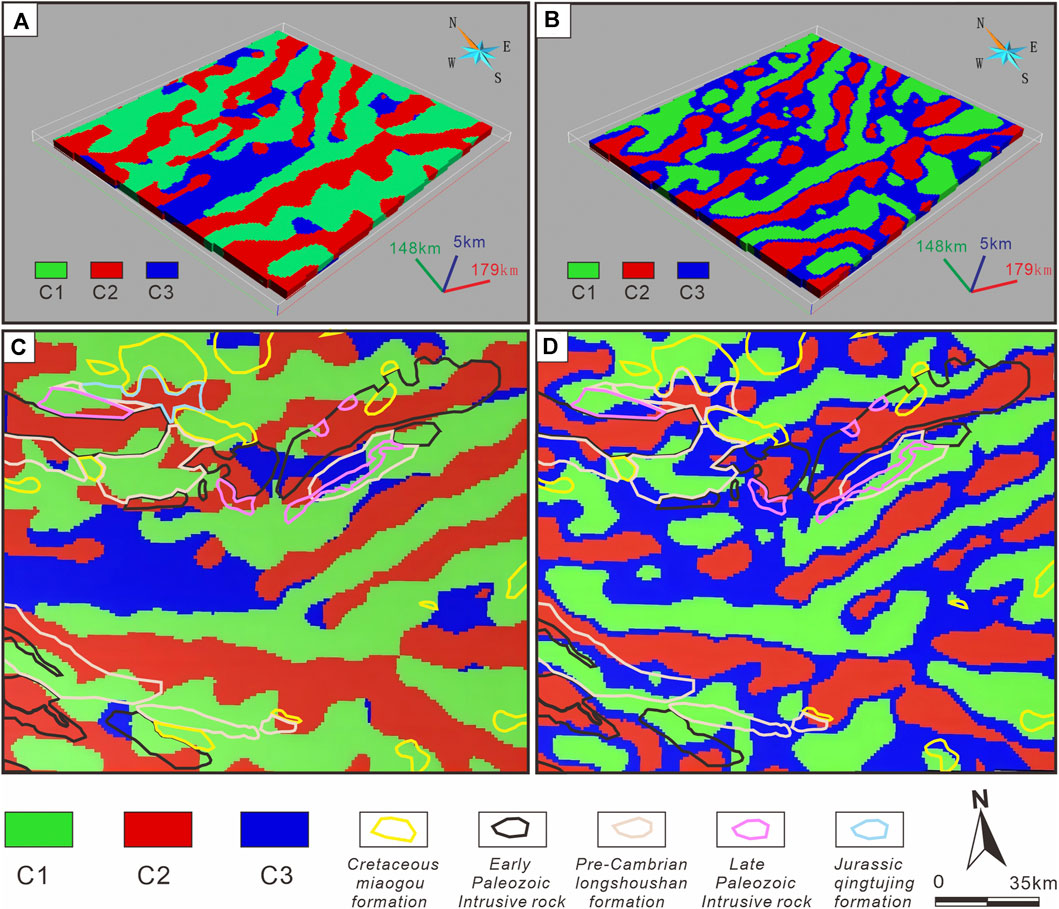
FIGURE 9. 3D pseudo-lithology models obtained via (A) traditional k-means clustering and (B) IW k-means++ clustering. Top view of 3D pseudo-lithology models obtained via (C) traditional k-means clustering and (D) IW k-means++ clustering.
Based on Table 1 and the clustering results, Cluster 1 is likely to correspond to the Cretaceous MG, and Cluster 2 may correspond to the Early Paleozoic acidic intrusive rocks and some Late Paleozoic intrusive rocks (Figure 10). Cluster 3 is characterized by high resistivity, which matches with the granite and quartz diorite in some pre-Cambrian rock formations and Early Paleozoic acidic intrusive rocks. However, this is not well reflected in the k-means clustering algorithm results. The petrophysical properties of rocks within the same geological layer exhibit a significant variation range in the study area. Due to the influence of the Qilian orogenic belt, the study area exhibits complex tectonic features, including numerous faults and folds. As a result, there may be significant deviations between the lithology exposed at the surface and the lithology at greater depths (Zhang et al., 2019a; Zhang et al., 2019b). Grid size may be much larger than the exposed rock bodies shown in some geological maps. It is challenging to differentiate different geological units in three-dimensional space by combining the inverted models with known petrophysical properties (Zhang et al., 2017).
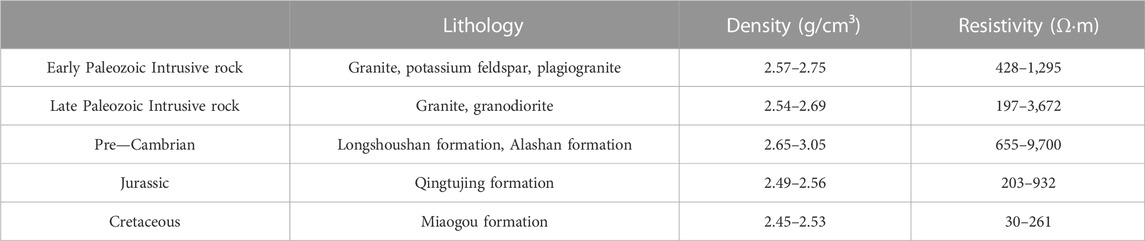
TABLE 1. Density and resistivity of the main lithologic units in the study area.
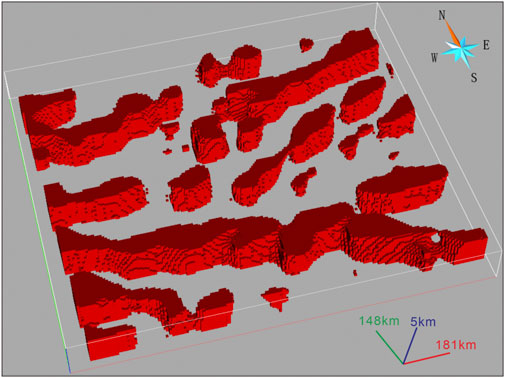
FIGURE 10. Deep 3D granite model obtained by IW k-means++ clustering.
The petrophysical properties of the Jurassic QTJ are similar to those of the granite in the Early Paleozoic acid intrusive rocks, making them difficult to distinguish. The complex lithology of the pre-Cambrian rock formations, along with a wide range of density and resistivity values, makes it challenging to differentiate from other rock formations. The comprehensive performance of IW k-means++ algorithm is better than that of traditional k-means algorithm (Figure 11). In the IW k-means++ clustering results, the boundaries of different lithologies can be distinguished well, showing better correlation with the lithologies exposed on the surface and demonstrating the spatial distribution of Paleozoic intrusive rocks closely related to mineralization (Figure 10). According to Figure 3A; Figure 6; Figure 9D, it is evident that the distribution of intrusive rocks aligns noticeably with the medium to high residual density zones. This provides strong evidence for the accuracy of the IW k-means++ algorithm. The cluster 3 in IW k-means++ also effectively identifies certain stratigraphic units of the pre-Cambrian rock formations. In general, the IW k-means++ clustering algorithm serves as a key tool for deep lithology research and provides insights into the trends of deep lithology.
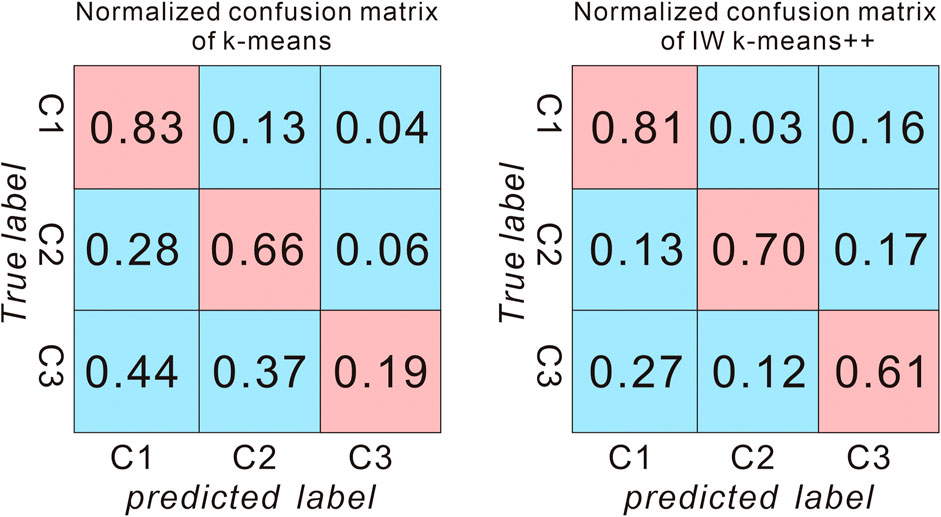
FIGURE 11. Normalized confusion matrices for results obtained by traditional k-means clustering (K22) and IW k-means++ clustering. C1 correspond to Cretaceous Miaogou formation, C2 correspond to intrusive rocks and C3 correspond to Pre-Cambrian rock formations.
7 Conclusion
The utilization of k-means and IW k-means++ algorithms for lithology identification in the Tengger Desert coverage area highlights the promising capabilities of clustering methods in pseudo lithology modeling using diverse geophysical datasets, and provides a solution for deep lithology analysis and overburden mapping. By taking into account the importance of each feature during the training procedure, the IW k-means++ algorithm constructs pseudo lithology models that exhibit improved alignment with the published geological maps in the study area and offer enhanced boundary delineation. Nevertheless, it is worth noting that both k-means and IW k-means++ algorithms have certain limitations when it comes to accurately identifying small-scale near-surface Jurassic rock layers, and the optimal number of clusters may differ from the number of rock types in existing geological data.
By collecting a greater variety and larger-scale geophysical data, and using more refined inversion grids, the ability to identify small-scale lithological units can be improved. However, this requires more advanced equipment and a longer time frame to complete. Additionally, when conducting deep pseudo-rock modeling, It is crucial to give careful consideration to the uncertainties associated with geophysical data acquisition and inversion processes (Zhang et al., 2020). Therefore, future research can explore the use of multiple machine learning algorithms of different types and weight their results to leverage the strengths of different algorithms, mitigating the uncertainties associated with a single algorithm, and constructing lithological probability models. Additionally, coupling machine learning methods with geological statistical methods can be attempted to complement each other’s limitations (Hristopulos et al., 2015).
Data availability statement
The original contributions presented in the study are included in the article/Supplementary Material, further inquiries can be directed to the corresponding author.
Author contributions
Conceptualization, YD, YL, and JF; Methodology, YD, WP, and HL; Software, QS; Formal analysis, YD; Investigation, YD, WP, XH, HL, and YC; Writing—Original Draft Preparation, YD; Writing—Review and Editing, YD and XH. All authors contributed to the article and approved the submitted version.
Funding
The research was funded by Science and Technology Innovation Fund of Command Center of Integrated Natural Resources Survey Center KC20220020 and the CGS project (Grant Nos. DD20230622, DD20230255 and DD20230591).
Acknowledgments
The authors acknowledge Handong Tan (China University of Geosciences, Beijing) for his help in geophysical data inversion and processing. The authors would like to express their sincere gratitude to Zhiqiang Zhang and the two reviewers for their valuable comments and contributions that have greatly enhanced the quality of this paper.
Conflict of interest
The authors declare that the research was conducted in the absence of any commercial or financial relationships that could be construed as a potential conflict of interest.
Publisher’s note
All claims expressed in this article are solely those of the authors and do not necessarily represent those of their affiliated organizations, or those of the publisher, the editors and the reviewers. Any product that may be evaluated in this article, or claim that may be made by its manufacturer, is not guaranteed or endorsed by the publisher.
References
Ali, A., Sheng-Chang, C., and Shah, M. (2021). Integration of cluster analysis and rock physics for the identification of potential hydrocarbon reservoir. Nat. Resour. Res. 30, 1395–1409. doi:10.1007/s11053-020-09800-6
Ball, G. H., and Hall, D. J. (1965). A novel method of data analysis and pattern classification. Menlo Park, CA: Stanford Research Institute.
Basant, R. A., Ryan, G. A., Peacock, J. R., Camacho, A. G., Blake, O. O., Hautmann, S., et al. (2021). Multi-geophysical parameter classification of the Montserrat geothermal system. Geothermics 90, 102006.
Bedrosian, P., Maercklin, N., Weckmann, U., Bartov, Y., Ryberg, T., and Ritter, O. (2007). Lithology-derived structure classification from the joint interpretation of magnetotelluric and seismic models. Geophys. J. Int. 170, 737–748. doi:10.1111/j.1365-246X.2007.03440.x
Bosch, M. (1999). Lithologic tomography: From plural geophysical data to lithology estimation. J. Geophys. Res. 104, 749–766. doi:10.1029/1998JB900014
Bosch, M., Zamora, M., and Utama, W. (2002). Lithology discrimination from physical rock properties. Geophysics 67, 573–581. doi:10.1190/1.1468618
Brahmana, R. W. S., Mohammed, F. A., and Chairuang, K. (2020). Customer segmentation based on RFM model using K-means, K-medoids, and DBSCAN methods. Lontar Komputer: J. Ilmiah Teknol. Inf. 11 (1), 32.
Cao, Z., Yang, C., Han, J., Mu, H., Wang, C., Wan, C., et al. (2022). Lithology identification method based on integrated K-means clustering and meta-object representation. Arabian J. Geosciences 15, 1462. doi:10.1007/s12517-022-10693-3
Carneiro, C. D. C., Fraser, S. J., Crósta, A. P., Silva, A. M., and Barros, C. E. D. M. (2012). Semiautomated geologic mapping using self-organizing maps and airborne geophysics in the Brazilian Amazon. Geophysics 77 (4), K17–K24. doi:10.1190/geo2011-0302.1
Chen, P., and Pan, X. L. (2001). The floristic characteristics in the area of the Hexi corridor. Bull. Botanical Res. 21 (1), 24–30. (in chinese).
Cheng, Q. (2003). Non-linear mineralization model and information processing methods for prediction of unconventional mineral resources. Earth Sci.- J. China Univ. Geosci. 37 (6), 1109–1125. (in chinese).
Di Giuseppe, M. G., Troiano, A., Patella, D., Piochi, M., and Carlino, S. (2018). A geophysical k-means cluster analysis of the Solfatara-Pisciarelli volcano-geothermal system, Campi Flegrei (Naples, Italy). J. Appl. Geophys. 156, 44–54. doi:10.1016/j.jappgeo.2017.06.001
Fraser, S. J., Wilson, G. A., Cox, L. H., Cuma, M., Zhdanov, M. S., and Vallée, M. A. (2012). Self-organizing maps for pseudo-lithological classification of 3D airborne electromagnetic, gravity gradiometry and magnetic inversions. ASEG Ext. Abstr. 2012, 1–4. doi:10.1071/aseg2012ab086
Gallardo, L. A., and Meju, M. A. (2003). Characterization of heterogeneous near-surface materials by joint 2D inversion of dc resistivity and seismic data. Geophys. Res. 30, 17370. doi:10.1029/2003gl017370
Gallardo, L. A., and Meju, M. A. (2007). Joint two-dimensional cross-gradient imaging of magnetotelluric and seismic traveltime data for structural and lithological classification. Geophys. J. Int. 169, 1261–1272. doi:10.1111/j.1365-246x.2007.03366.x
Gallardo, L. A., and Meju, M. A. (2011). Structure coupled multiphysics imaging in geophysical sciences. Rev. Geophys. 49, RG1003. doi:10.1029/2010RG000330
Gallardo, L., and Meju, M. A. (2004). Joint two-dimensional DC resistivity and seismic travel time inversion with cross-gradients constraints. J. Geophys. Res. 109, B03311. doi:10.1029/2003JB002716
Gao, D. Z., Zhao, J. H., Bo, Y. L., Tang, J., and Wang, S. (2004). A profile study of gravitative-magnetic and seismic comprehensive survey in the East China Sea. Chin. J. Geophys. 47 (5), 853–861. (in chinese).
Gong, J., Zhang, J., and Yu, S. (2011). The origin of longshoushan group and associated rocks in the southern part of the Alxa block: constraint from LA-ICP MS U-Pb zircon dating. Acta Petrol. Mineral. 30 (5), 795–818. (in chinese).
Hristopulos, D. T. (2015). Stochastic local interaction (SLI) model: interfacing machine learning and geostatistics. arXiv preprint, 67–78. Available at: https://arxiv.org/abs/1501.04053.
Jain, A. K. (2010). Data clustering: 50 years beyond K-means. Pattern Recogn. Lett. 31, 651–666. doi:10.1016/j.patrec.2009.09.011
Jessell, M. (2001). Three-dimensional geological modelling of potential-field data. Comput. Geosciences 27 (4), 455–465. doi:10.1016/s0098-3004(00)00142-4
Jiang, M., Peng, M., Wang, Y., Tan, H., Li, Y., Zhang, L., et al. (2012). Geophysical evidence for deep subduction of Indian Lithospheric plate beneath Eastern Himalayan Syntax. Acta Petrol. Sin. 28 (6), 1755–1764. (in chinese).
Kapageridis, I. K. (2015). Variable lag variography using K-means clustering. Comput. Geosci. 85, 49–63.
Lai, Y. R., Han, L., and Yang, S. S. (2014). The effects of applying high precision magnetic survey to geological mapping in Altay glacial till covering area. Geophys. Geochem. Explor. 38 (6), 1181–1185. (in Chinese with English abstract).
Li, Q., Zhang, L., and Wei, Z. (2013). Development status and issues of 3D geological modeling software. Geol. J. 37 (4), 554–561. doi:10.3969/j.issn.1674-3636.2013.04.554
Li, S., Man, Z., Yang, Q., Xu, H., He, J., Chen, Z., et al. (2013). The effects of hepatitis C virus core protein on the expression of miR-122 in vitro. Comput. Technol. Dev. 23, 98–101. doi:10.1186/1743-422X-10-98
Li, Y., Melo, A., Martinez, C., and Sun, J. (2019). Geology differentiation: A new frontier in quantitative geophysical interpretation in mineral exploration. Lead. Edge 38, 60–66. doi:10.1190/tle38010060.1
Lindsey, N. J., and Newman, G. A. (2015). Improved workflow for 3D inverse modeling of magnetotelluric data: Examples from five geothermal systems. Geothermics 53, 527–532. doi:10.1016/j.geothermics.2014.09.004
Liu, Q., Liu, G., Huang, C., and Li, H. (2019). Remote sensing monitoring of surface characteristics in the badain jaran, tengger, and ulan buh deserts of China. Chin. Geogra. Sci. 29, 151–165. doi:10.1007/s11769-018-0997-8
Lowe, C., Best, M. E., Bobrowsky, P. T., and Seemann, D. A. (1998). Integrated geophysics for mineral exploration in drift-covered volcanic terrains: examples from northern Vancouver Island, Canada. Geophys. Prospect. 46 (3), 201–225.
Ma, Q., Zhang, J., and Li, D. (2020). An analysis of the Tengger Desert spermatophytic flora characteristics. Acta Prataculturae Sin. 29 (3), 16–26. doi:10.11686/cyxb201948
MacQueen, J. B. (1967). “Some methods for classification and analysis of multivariate observations,” in Proc 5th berkley symposium on mathematical statistics and probability statistics vol I. Editors L. M. Le Cam, and J. Neyman (China: University of California Press), 281–297.
Melo, A. T., and Li, Y. (2019). “Geology differentiation of geophysical inversions using machine learning,” in International workshop on gravity, electrical & magnetic methods and their applications (Xi'an, China: Oxford University Press), 301–304.
Peng, M. (2012). Joint inversion of magnetotelluric and teleseismic data. Ph.D. Thesis). Beijing: China University of Geosciences.
Perrouty, S., Lindsay, M. D., Jessell, M. W., Aille` res, L., Martin, R., and Bourassa, Y. (2014). 3D modeling of the Ashanti Belt, southwest Ghana: Evidence for a litho-stratigraphic control on gold occurrences within the Birimian Sefwi Group. Ore Geol. Rev. 63, 252–264. doi:10.1016/j.oregeorev.2014.05.011
Rodriguez-Galiano, V., Sanchez-Castillo, M., Chica-Olmo, M., and Chica-Rivas, M. (2015). Machine learning predictive models for mineral prospectivity: An evaluation of neural networks, random forest, regression trees and support vector machines. Ore Geol. Rev. 71, 804–818. doi:10.1016/j.oregeorev.2015.01.001
Ryan, G. A., Peacock, J., Shalev, E., and Rugis, J. (2013). Montserrat geothermal system: A 3D conceptual model. Geophys. Res. Lett. 40 (10), 2038–2043. doi:10.1002/grl.50489
Shalev, E., Kenedi, C. L., Malin, P., Voight, V., Miller, V., Hidayat, D., et al. (2010). Three-dimensional seismic velocity tomography of Montserrat from the SEA-CALIPSO offshore/onshore experiment. Geophys. Res. Lett. 37 (19), 42498. doi:10.1029/2010gl042498
Shi, Z. J., Tian, G., Xue, J., Wang, Z. J., Zeng, Z. F., Zhao, W. J., et al. (2003). The application of single-receiver seismics to geological survey in the shallow covered areas. Glob. Geol. 22 (1), 86–90. (in Chinese with English abstract).
Song, S., Niu, Y., Su, L., and Xia, X. (2013). Tectonics of the North Qilian orogen, NW China. Gondwana Res. 23 (4), 1378–1401. doi:10.1016/j.gr.2012.02.004
Steinhaus, H. (1956). Sur la division de corps matériels en parties. Bull. Acad. Pol. Sci. 4, 801–804.
Tang, Z., Qian, Z., Jiang, C., Li, W., Yan, H., Zeng, Z., et al. (2006). Nickel-Copper-Platinum magmatic sulfide deposits in China and mineralization prediction. Geological Publishing House. (in chinese).
Vozoff, K. (1987). “The magnetotelluric method,” in Electromagnetic methods in applied geophysics: Application, 2B. Editor M. N. Nabighian (Tulsa: SEG). doi:10.1190/1.9781560802686.ch8
Yu, Y., Velastin, S. A., and Yin, F. (2019). Automatic grading of apples based on multi-features and weighted K-means clustering algorithm. Inf. Process. Agric. 6, 32. doi:10.1016/j.inpa.2019.11.003
Wang, G., Li, R., Carranza, E. J. M., Zhang, S., Yan, C., Zhu, Y., et al. (2015). 3D geological modeling for prediction of sub-surface Mo targets in the Luanchuan district, China. Ore Geol. Rev. 71, 592–610. doi:10.1016/j.oregeorev.2015.03.002
Wang, N., Zhang, H., and Cao, J. (1997). Preliminary study on magnetic stratigraphy of Wuwei loess section in southern Tengger Desert. J. Lanzhou Univ. Nat. Sci. 33 (4), 149–151.
Wu, G., Chen, G., Cheng, Q., Zhang, Z., and Yang, Z. (2021). Unsupervised machine learning for lithological mapping using geochemical data in covered areas of jining, China. Nat. Resour. Res. 30, 1053–1068. doi:10.1007/s11053-020-09788-z
Yan, Z., Tan, H., Peng, M., Kong, W., and Wu, P. (2020). Three-dimensional joint inversion of gravity, magnetic, and magnetotelluric data based on cross-gradient theory. Chin. J. Geophys. 63 (2). doi:10.6038/cjg2020M0355
Zhang, X., and Liu, J. (2013). Achievements of geological prospecting action in Gansu Province. Gansu Geol. 22, 2. (in chinese).
Zhang, Z., Wang, G., Carranza, E. J. M., Zhang, J., Tao, G., Zeng, Q., et al. (2019a). Metallogenic model of the Wulong gold district, China, and associated assessment of exploration criteria based on multi-scale geoscience datasets. Ore Geol. Rev. 114, 103138. doi:10.1016/j.oregeorev.2019.103138
Zhang, Z., Wang, G., Ding, Y., and Carranza, E. J. M. (2021). 3D mineral exploration targeting with multi-dimensional geoscience datasets, Tongling Cu (-Au) District, China. J. Geochem. Explor. 221, 106702. doi:10.1016/j.gexplo.2020.106702
Zhang, Z., Wang, G., Ma, Z., Carranza, E. J. M., Jia, W., Du, J., et al. (2019b). Batholith-stock scale exploration targeting based on multi-source geological and geophysical datasets in the Luanchuan Mo polymetallic district, China. Ore Geol. Rev. 118, 103225. doi:10.1016/j.oregeorev.2019.103225
Zhang, Z., Wang, G., Ma, Z., and Gong, X. (2017). Interactive 3D modeling by integration of geoscience datasets for exploration targeting in Luanchuan Mo polymetallic district, China. Nat. Resour. Res. 27 (3), 315–346. doi:10.1007/s11053-017-9353-4
Keywords: pseudo-lithology modeling, IW k-means++, multi-source geophysical datasets, overlay area, gravity magneto telluric joint inversion
Citation: Dong Y, Liu Y, Peng W, Chen Y, Fan J, Huang X, Liu H and Sun Q (2023) 3D pseudo-lithologic modeling via iterative weighted k-means++ algorithm from Tengger Desert cover area, China. Front. Earth Sci. 11:1235468. doi: 10.3389/feart.2023.1235468
Received: 06 June 2023; Accepted: 03 July 2023;
Published: 21 July 2023.
Edited by:
Zhiqiang Zhang, Hebei GEO University, ChinaReviewed by:
Shan Xu, China University of Geosciences Wuhan, ChinaShuai Zhang, China Aero Geophysical Survey and Remote Sensing Center for Natural Resources, China
Copyright © 2023 Dong, Liu, Peng, Chen, Fan, Huang, Liu and Sun. This is an open-access article distributed under the terms of the Creative Commons Attribution License (CC BY). The use, distribution or reproduction in other forums is permitted, provided the original author(s) and the copyright owner(s) are credited and that the original publication in this journal is cited, in accordance with accepted academic practice. No use, distribution or reproduction is permitted which does not comply with these terms.
*Correspondence: Yang Liu, MTExMzcwNTFAcXEuY29t