 Liu Zhifei
 Cao Daiyong2*
94% of researchers rate our articles as excellent or good
Learn more about the work of our research integrity team to safeguard the quality of each article we publish.
Find out more
ORIGINAL RESEARCH article
Front. Earth Sci., 11 July 2023
Sec. Petrology
Volume 11 - 2023 | https://doi.org/10.3389/feart.2023.1235457
In order to explore the graphitization characteristic differences between vitrinite and inertinite in coal, this study conducted high-temperature thermal simulation experiments (at five temperature points: 1800°C, 2100°C, 2400°C, 2700°C, and 3000°C) using inertinite-rich and vitrinite-rich samples as graphitization precursors. The quantitative comparison for the evolution characteristics of their graphite lattice was carried out using high-resolution transmission electron microscopy (HRTEM), X-ray diffractometer (XRD), and Raman spectroscopy (Raman) techniques. HRTEM revealed that an evident increase in carbon layer numbers and degree of extension was observed with increasing treatment temperature, XRD showed the variation of lattice parameters (d002/La/Lc) with temperature, Raman data revealed the variation of lattice defects (R2/R3) with temperature. It was discussed about the differences of graphite lattice construction processes between inertinite and vitrinite, throughout the entire temperature range of the experiment, the d002 spacing of inertinite was always smaller than that of vitrinite, indicating a higher degree of graphitization. vitrinite exhibited a uniform and smooth evolution state throughout the entire heating process, while inertinite exhibited an “inert” state between 1800°C and 2100°C (d002 values stagnated near at 0.3440 nm). With increasing simulated temperature, the defect level (R2 and R3) of vitrinite rapidly decreased below that of inertinite, throughout the entire temperature range, vitrinite demonstrated superior defect healing ability in terms of both rate and capability compared to inertinite. Under high-temperature thermal simulation, the three-dimensional lattice construction and defect elimination of vitrinite exhibited synchronous evolution characteristics. On the other hand, the formation of the graphite lattice in inertinite showed an evolutionary trend of “first three-dimensional lattice construction, followed by gradual defect elimination”.
Due to the insufficient quantity and quality of natural graphite resources, research on the preparation of artificial graphite through high-temperature methods has been receiving increasing attention (Rodrigues et al., 2013; Sierra et al., 2015; Hargreaves and Cooper, 2016; Mundszinger et al., 2017). Currently, the main raw material for artificial graphite is petroleum coke, with the continuous depletion of petroleum resources and the constant innovation of petroleum processing technologies, the supply of petroleum coke is gradually decreasing (Shan et al., 2018), therefore, there is an urgent need to explore new raw materials for artificial graphite. Coal contains a large amount of aromatic ring structures and is an excellent raw material for producing artificial graphite (coal-based graphite) (Bonijoly et al., 1982; Bustin et al., 1995; Xing et al., 2018).
Scholars use anthracite as the precursor to carry out artificial thermal simulation experiments, and study the microstructure evolution of anthracite in the graphitizing process through optical microscopy, Raman spectroscopy and X-ray diffraction (Atria et al., 2002; González et al., 2003; Suárez-Ruiz and García, 2007; Rodrigues et al., 2011a; Rodrigues et al., 2011b; Yang and Pu, 2013; Zhang et al., 2013; Tang et al., 2020). It is considered that anthracite has the advantages of low ash, low sulfur, high chemical activity, high fixed carbon content, etc., and is the first choice for preparing coal-based graphite by high-temperature treatment. Graphite crystal structure of most anthracite samples grows rapidly in the thermal simulation temperature range of 2000 °C–2,400°C, but some anthracite is difficult to be graphitized even at 3,000°C (González et al., 2003). With the deepening of research, scholars expand the precursor of coal-based graphite preparation from anthracite to “bituminous coal”, and use bituminous coal with different evolution degrees as raw materials to prepare coal-based graphite with different microstructures, such as polycrystalline graphite, single crystal graphite, spherical graphite, honeycomb graphite and rod graphite (Qiu, 2019; Zhang et al., 2022). Some scholars studied the influence of inorganic components on graphitization, and found that the existence of inorganic minerals significantly improved the graphite crystal structure in the anthracite (Pappano and Schobert, 2009; Yu et al., 2022).
Previous studies on coal graphitization have focused on different thermal maturation degree of the precursor and the influence of inorganic minerals, with limited research on the differential graphitization of macerals in coal. The chemical structure of macerals is characterized by heterogeneity and diversity (Stach et al., 1982; Qin et al., 2022), and the graphitization ability of different macerals varies. vitrinite is the product of plant lignocellulosic tissue undergoing different degrees of gelation in the coal-forming process, with high oxygen content and slightly low carbon content. Inertinite is characterized by coal forming material undergoing different degrees of oxidation in the peat stage (Rajak et al., 2019; Dai et al., 2020; Hudspith and Belcher, 2020), with rich carbon, poor hydrogen, and high aromaticity. It is generally believed that vitrinite is more prone to graphitization compared to inertinite (Qin, 1994). Zhang (2014) conducted high-temperature treatment at 2,500°C on inertinite-rich samples and vitrinite-rich samples, and found that the graphitization degree of inertinite was higher. The artificial thermal simulation comparison experiment conducted by Wang et al. (2019) between vitrinite and inertinite showed that the required graphitization temperature for inertinite was higher, vitrinite has higher graphitization ability than inertinite. Through the study of natural graphitized coal samples, Li et al. (2021) (Li, 2022), believes that the graphitization ability of liptinite is the highest, followed by vitrinite, and inertinite always shows inertness. The differences of sample selection and graphitization temperature settings lead scholars to opposite conclusions in the study of graphitization ability of different components.
To reveal the differential graphitization performance of macerals, the raw coal samples were hand-selected to obtain inertinite-rich samples and vitrinite-rich samples. High-temperature thermal simulation experiments were carried out to simulate the graphitization of macerals, and HRTEM, XRD, and Raman were used to quantitatively analyze and compare the graphite lattice evolution characteristics of the macerals, revealing the graphitization features and differences of macerals (vitrinite and inertinite) in coal.
Coal samples with different thermal maturation degree were collected from Ningdong mine, Jiulong mine, and Ge Mudi mine. The raw coal samples were hand-selected to obtain vitrinite-rich samples and inertinite-rich samples (Figure 1). According to the Chinese standard GB/T 15,588-2013 and GB/T 8899-2013, the obtained samples were observed under a microscope (Figures 1A, B), and the samples with 90% or higher inertinite purity were used as the precursor for the simulation experiments.
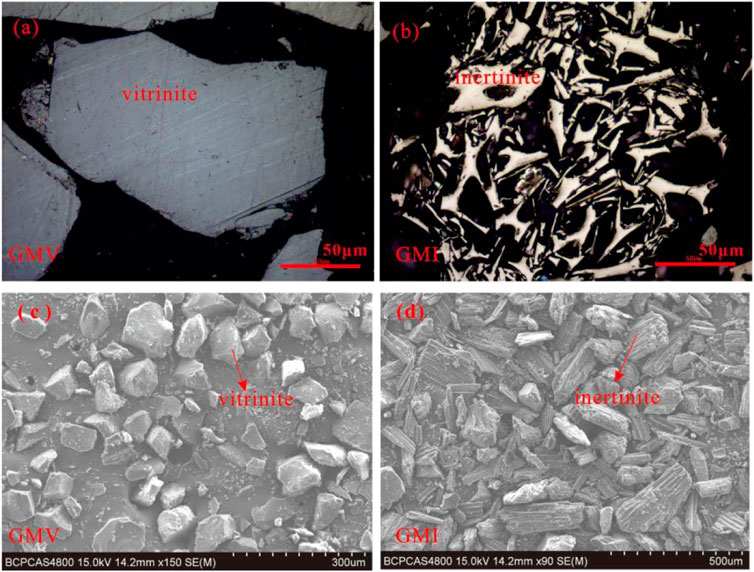
FIGURE 1. Microphotographs of the hand-selecting vitrinite-rich samples and inertinite-rich samples. (A) Optical microscope photograph of vitrinite-rich samples (B). Optical microscope photograph of inertinite-rich samples (C). SEM photograph of vitrinite-rich samples (D). SEM photograph of inertinite-rich samples.
Coal component quantification, vitrinite reflectance measurement, industrial analysis, and elemental analysis were performed as basic tests and analyses on the experimental samples. The basic information of the samples is presented in Table 1.

TABLE 1. Basic information of high-temperature thermal simulation samples.
The sample was crushed and sieved through a 200-mesh (75 μm) standard sieve. Approximately 15 g of coal powder was weighed and placed in a plastic beaker, it was then mixed with 80 mL of hydrochloric acid (36% mass fraction) solution (with proportional increase in acid quantity when the sample weight increased). The mixture was stirred for 4 h at a constant temperature of 60 °C in a thermostatic water bath. Subsequently, the HCl solution was filtered out, and 80 mL of hydrofluoric acid (40%) solution was added to the coal sample. The same water bath and acid washing process were repeated. Finally, the acid-washed coal sample was rinsed with ultrapure water until no precipitation appeared in the filtrate, and then filtered through filter paper. The filtered sample was placed in a oven and dried at 60°C for 24 h to obtain the demineralized coal samples.
The demineralized samples were assigned unique numbers and divided into six categories for high-temperature thermal simulation experiments (Table 2).
TABLE 2. Demineralized samples for high-temperature thermal simulation experiments.
The specific experimental procedure for high-temperature thermal simulation is as follows: Take a 10 g sample in a crucible and place it in the NTG-SML-60W integrated laboratory graphitization furnace. Prior to heating, evacuate the furnace to a vacuum level of 5 Pa and replace the gas once. Throughout the experiment, the furnace is protected by a continuous flow of argon gas at a rate of 10 L/min, maintaining a pressure inside the furnace 20–30 KPa above standard atmospheric pressure. The experiment uses a segmented heating method. Initially, in the temperature range of room temperature to 1,000°C, the heating rate is 5°C/min. Once it reaches 1,000°C, it is held for 60 min, and then the heating rate is changed to 10°C/min until the target temperature is reached, followed by a 90-min dwell time at the target temperature. Subsequently, natural cooling occurs. In this graphite thermal simulation experiment, the temperature points are set starting from 1800°C with intervals of 300°C, and the highest temperature point is set at 3,000°C. A total of 5 temperature points are set, and 30 sets of high-temperature thermal simulation experiments are conducted.
The experiments utilized the Tecnai G2 F30 field emission transmission electron microscope (TEM) with an acceleration voltage of 300 kV. The point resolution was 0.20 nm, the line resolution was 0.10 nm, and the information resolution was 0.14 nm. The magnification ranged from 3,000x to 500,000x.
The specific procedure involved grinding the sample to 300 mesh and then dispersing it in ethanol using ultrasonic treatment. The dispersed sample was then dropped onto a copper mesh. Subsequently, the sample was searched for on the holes of the copper mesh, and particles that could represent the majority of the particle characteristics within the sample were selected for multiscale observation. High-resolution images were captured during the observation process.
The XRD instrument selection specifications are: Smart Lab-9kW, copper target, acceleration voltage 45 kV, current 200 mA, scanning range 2θ from 5° to 70°, scanning rate 2°/min, X-ray wavelength 0.15418 nm. Two diffraction peaks on the XRD pattern (2θ ranges of 20°–30° and 40°–50°) correspond to the positions of the 002 and 100 peaks in the standard graphite XRD diffraction.
The experimental instrument used is the Jobin-Yvon Labram HR Evolution high-resolution micro-Raman spectrometer. The experiment measurements employed an argon ion laser as the excitation light source, with an excitation wavelength of 532 nm and laser power of 100 mW. The scanning range was from 800 cm-1 to 3,500 cm-1, and the exposure time was 10 s.
The obtained Raman spectra were analyzed using Origin 8.0 software, utilizing Lorentzian functions for fitting and processing. The Raman spectrum exhibited two bands: the first-order Raman (700 cm-1 to 2000 cm-1) and the second-order Raman (2000 cm-1 to 3,000 cm-1).
HRTEM allows the observation of the microcrystalline carbon layer structure and in-plane defect states (Oberlin and Terriere, 1975; Sharma et al., 2018; Zhu et al., 2021). It can be observed that there is difference in graphitization ability between vitrinite and inertinite, and the degree of extension and stacking of graphite layers increases significantly with increasing processing temperature.
Under the condition of 1800°C, the NDV sample exhibits carbon layers stacked to approximately 3 layers, with an extension length of less than 5 nm. The predominant structure is a flexibly wrinkled graphite structure with curved and randomly oriented carbon layers, and there is no apparent trend of three-dimensional graphite structure development (Figure 2A). Small-scale flat graphite layers have formed in the NDI sample, indicating a better degree of development than the NDV sample (Figure 2B). However, the internal development is uneven, with coexistence of curved and flexibly wrinkled graphite and well-developed flat graphite under the microscope (Figure 2B). In the JLV sample, a large number of onion-like concentric structures can be observed. This structure is a transitional structure where flexibly wrinkled graphite unfolds towards the development of large-sized graphite structures (Figure 2C). A large number of well-developed large-sized graphite layers can be observed in JLI, with a stacking thickness of more than 20 layers, about 10 nm (Figure 2D). Through observation, it can be noted that under the condition of 1800°C, the development of graphite structures in inertinite is superior to that in vitrinite under the same conditions.
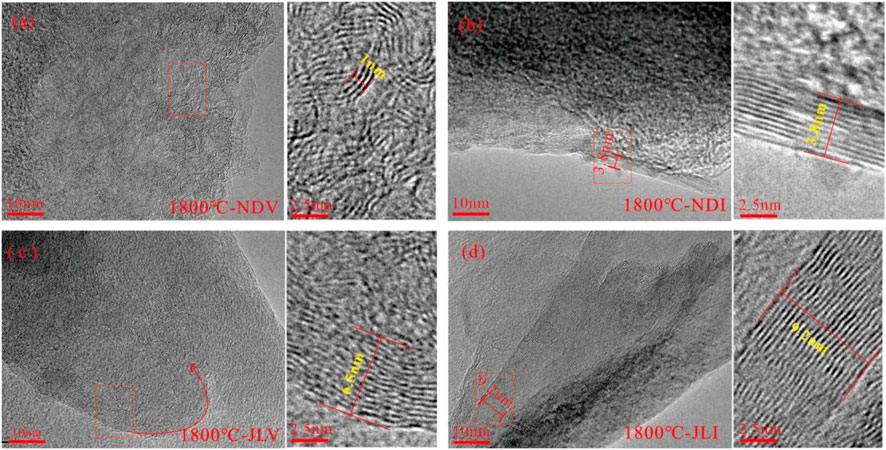
FIGURE 2. HRTEM features of different samples under thermal simulation at 1800°C (A) Flexibly wrinkled graphite with curved and randomly oriented carbon layers (B) Small-scale development of flat graphite starting at the edges (C) Transition stage towards the development of flat graphite (D) Well-developed large-scale graphite layers.
As the thermal simulation temperature increased to 3,000°C, all samples formed large-sized graphite structures. The graphite carbon layers in NDV and NDI samples exhibited relatively disordered orientations (Figures 3A, B). In the NDV sample, smaller-scale and more curved graphite structures were predominant. The development of graphite structures in the NDI sample was better than that in the vitrinite-rich samples, showing the presence of large-scale graphite layers. With an increasing degree of coal metamorphism, the carbon layers in JLV and JLI samples became flatter, more ordered in orientation, and formed larger and well-developed graphite layers (Figures 3C, D). In the JLI sample, the development of graphite layers was more advanced than that in the vitrinite-rich JLV sample. It exhibited highly ordered three-dimensional graphite structures with neat arrangement and distinct planar orientation, while the JLV sample still contained a significant amount of disordered carbon and defect structures, with higher curvature in the formed graphite layers.
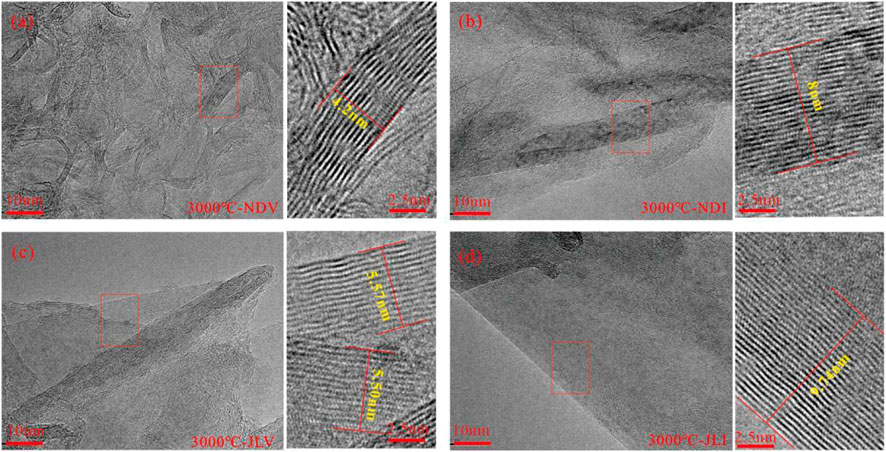
FIGURE 3. HRTEM characteristics of different samples under the thermal simulation temperature of 3,000°C. (A) Aromatic fringe morphology of sample NDV treated at 3000°C. (B) Aromatic fringe morphology of sample NDI treated at 3000°C. (C) Aromatic fringe morphology of sample JLV treated at 3000°C. (D) Well-developed large-scale graphite layers of sample JLI treated at 3000°C
When comparing the results of high-temperature thermal simulation experiments between GMV and GMI, which had higher initial degrees of coal metamorphism, more pronounced changes in development characteristics were observed under the microscope (Figure 4). Under the 1800°C and 2,100°C condition, both GMV and GMI samples exhibited predominantly flexibly wrinkled graphite structures with varying directions of microcrystalline stripes and high curvature (Figures 4A–D). However, the GMI sample showed the formation of higher elongation graphite layers at the edges. When the temperature increased to 2,700°C, the GMV sample still consisted mainly of flexibly wrinkled graphite structures, but their elongation and stacking layers significantly increased. In contrast, the inertinite-rich GMI sample at the same conditions already developed large-scale graphite layers (Figures 4E, F). At 3,000°C, the internal graphite structures of the GMV sample gradually exhibited more pronounced orientation and developed flat graphite layers, approaching the degree of structure development observed in the GMI sample under the same conditions (Figures 4G, H). Comparing the products at the same temperature points, the microcrystalline stripes in the GMI sample (Figures 4B, D, F, H) exhibited a more ordered orientation compared to the GMV sample (Figures 4A, C, E, G), indicating a higher degree of structural rationalization in the inertinite-rich sample.
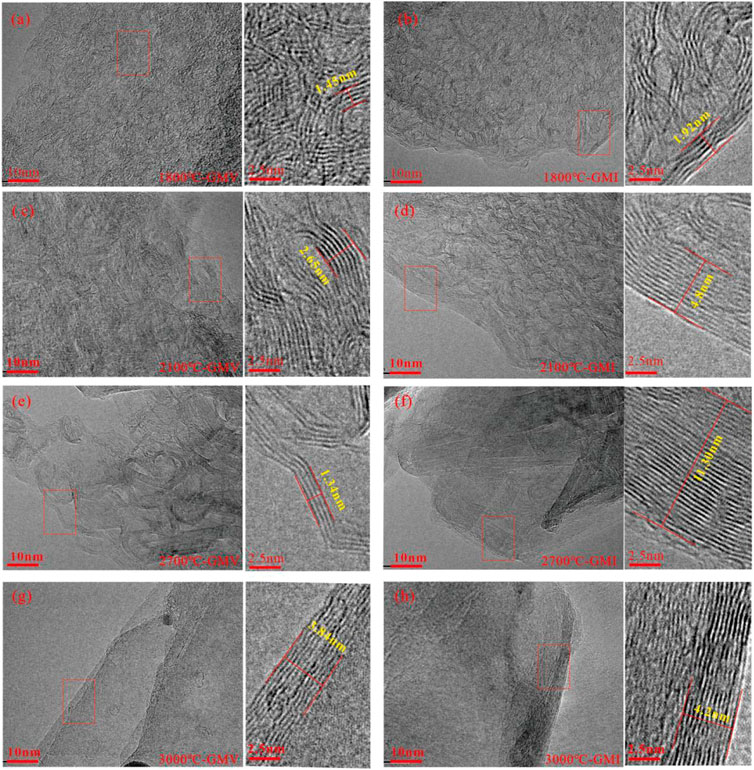
FIGURE 4. HRTEM characteristics of GMV/GMI samples under different thermal simulation temperature conditions. (A,B) Flexibly wrinkled graphite with curved and randomly oriented carbon layers of sample GMV and GMI treated at 1800°C. (C,D) Small-scale development of flat graphite of sample GMV and GMI treated at 2100°C. (E,F) Well-developed graphite layers of sample GMV and GMI treated at 2700°C. (G,H) Well-developed large-scale graphite layers of sample GMV and GMI treated at 3000°C
XRD is widely used in the study of coal and coal-based graphite materials (Ruland, 1964), and the following methods can be used to calculate the interlayer spacing d002 and microcrystalline parameters (La and Lc) from the fitted XRD spectra.
(1) The interlayer spacing d002 reflects the average interlayer distance of microcrystals within the scanning range, with units in nm. It can be calculated using the Bragg equation:
λ is the X-ray wavelength (0.154,056 nm) and θ002 is the diffraction angle of the (002) peak
(2) La represents the average size of microcrystalline planes. It can be calculated using the Scherrer formula:
where β100 is the full width at half maximum (FWHM) of the (100) peak and θ100 is the diffraction angle of the (100) peak, measured in degrees.
(3) Lc is the average stacking thickness in the vertical direction, with units in nm. The calculation formula is as follows:
where β002 is the FWHM of the (002) peak.
The XRD diffraction patterns of the high-temperature simulated samples are shown in Figure 5, and the lattice parameters such as d002, La, and Lc are calculated (Tables 3–5).
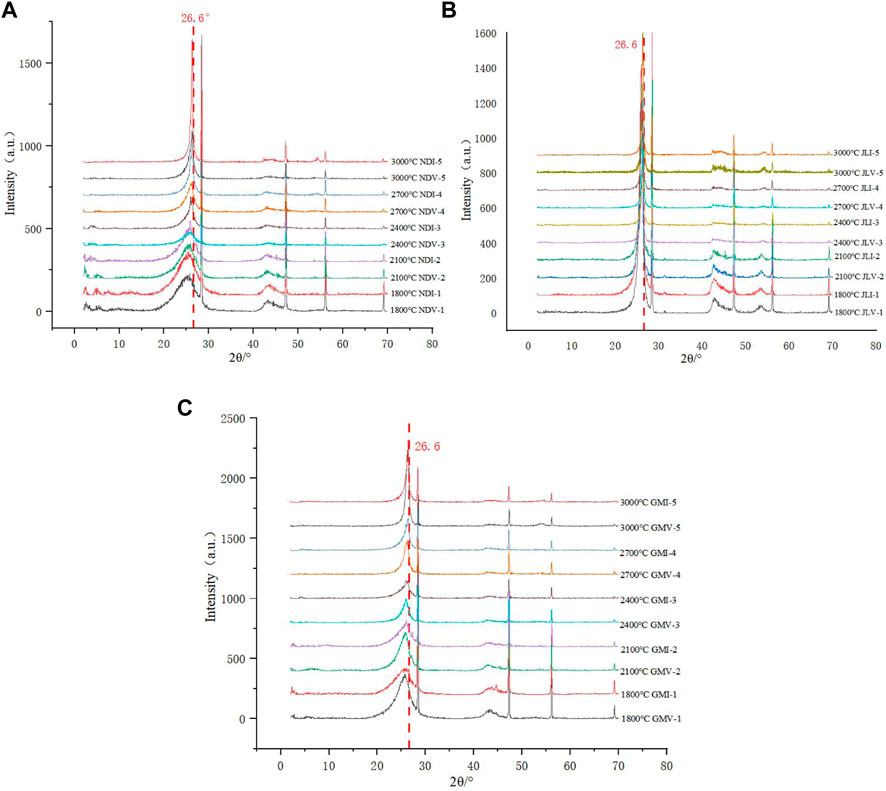
FIGURE 5. XRD diffraction patterns of the high-temperature simulated samples. (A) XRD diffraction patterns of sample NDV and NDI treated at different temperature. (B) XRD diffraction patterns of sample JLV and JLI treated at different temperature. (C) XRD diffraction patterns of sample GMV and GMI treated at different temperature.
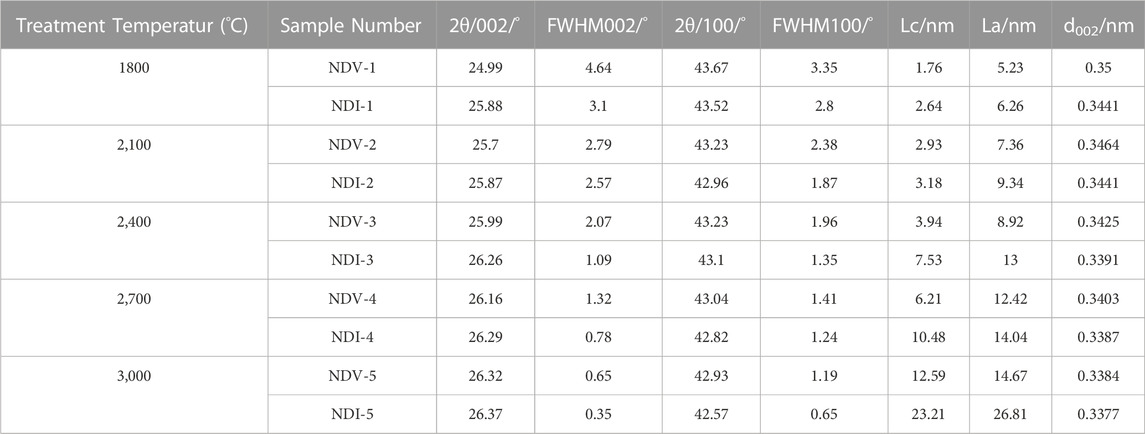
TABLE 3. XRD analysis data for the high-temperature simulated results of NDV and NDI samples.

TABLE 4. XRD analysis data for the high-temperature simulated results of JLV and JLI samples.
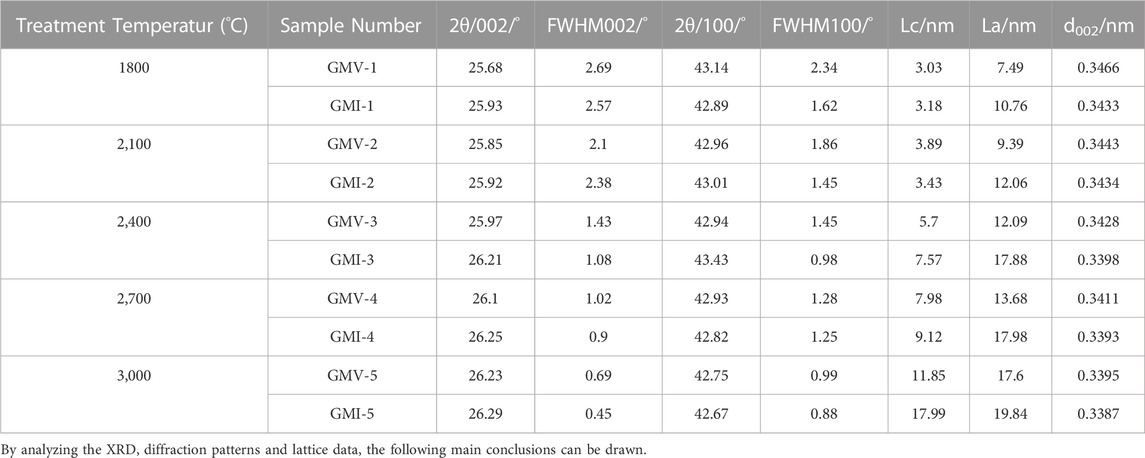
TABLE 5. XRD analysis data for the high-temperature simulated results of GMV and GMI samples.
For the same precursor, as the processing temperature increases, the (002) characteristic peak around 2θ=26.6° moves closer to the position of the standard graphite peak (2θ=26.6°), and the peak shape becomes sharper and more symmetrical (Figure 5). The overall trend of the calculated microcrystalline parameters shows a decrease in d002 and an increase in La and Lc, indicating an increase in the graphitization degree of the samples with the increase in experimental temperature.
The Raman spectra of the high-temperature simulated samples are shown in Figures 6–8. Various structural characterization parameters, such as the intensity of the D1 peak and the G peak (ID1 and IG), the intensity ratio between the D1 peak and the G peak (R1), the peak shift difference between the D1 peak and the G peak (ΔP), the full width at half maximum of the G peak (FWHMG), the defect peak area ratios (R2 and R3), and others, were calculated and are listed in Table 6. Among these parameters, R2 is referred to as the “in-plane defect parameter” representing the proportion of in-plane defects (D1) to the total area (AD1/(A (G+D1+D2))). This parameter is particularly useful for evaluating samples with a higher degree of evolution, fewer defects, and primarily D1-type defects (semi-graphite to graphite). R3 is called the “total defect parameter,” representing the proportion of all types of defect peaks to the total area (R3=A(D1+D2+D3+D4)/A(D1+D2+D3+D4+G)). It is more effective in characterizing samples with a lower degree of evolution and more defects (anthracite to semi-graphite).
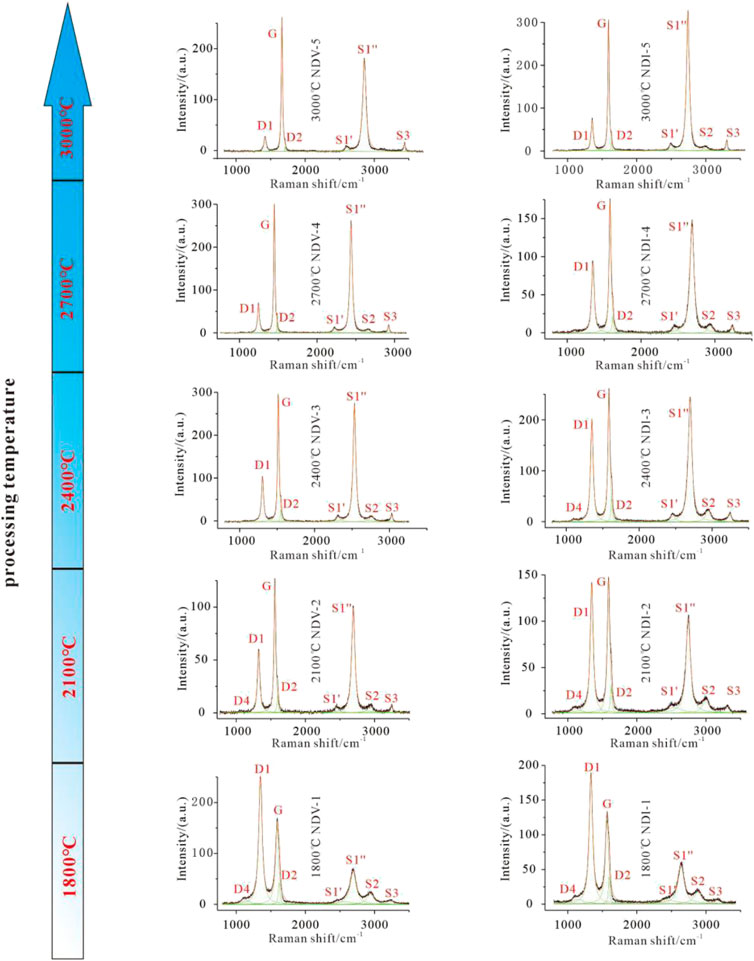
FIGURE 6. Raman peak spectra of high-temperature simulated NDV and NDI samples.
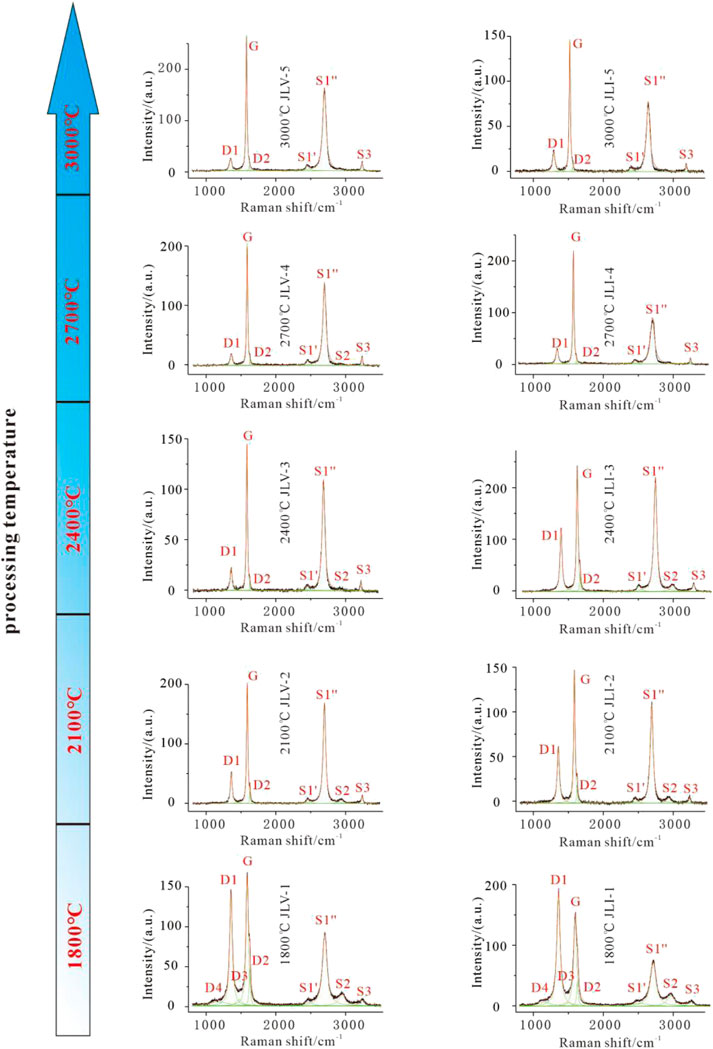
FIGURE 7. Raman peak spectra of high-temperature simulated JLV and JLI samples.
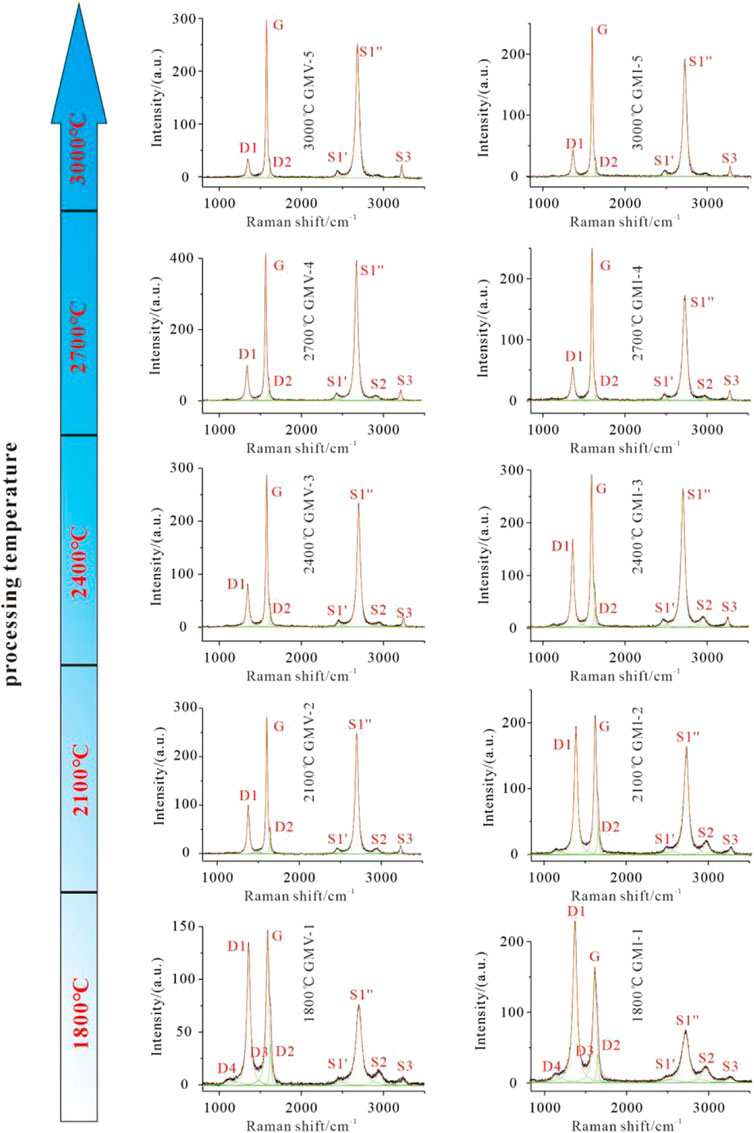
FIGURE 8. Raman peak spectra of high-temperature simulated GMV and GMI samples.
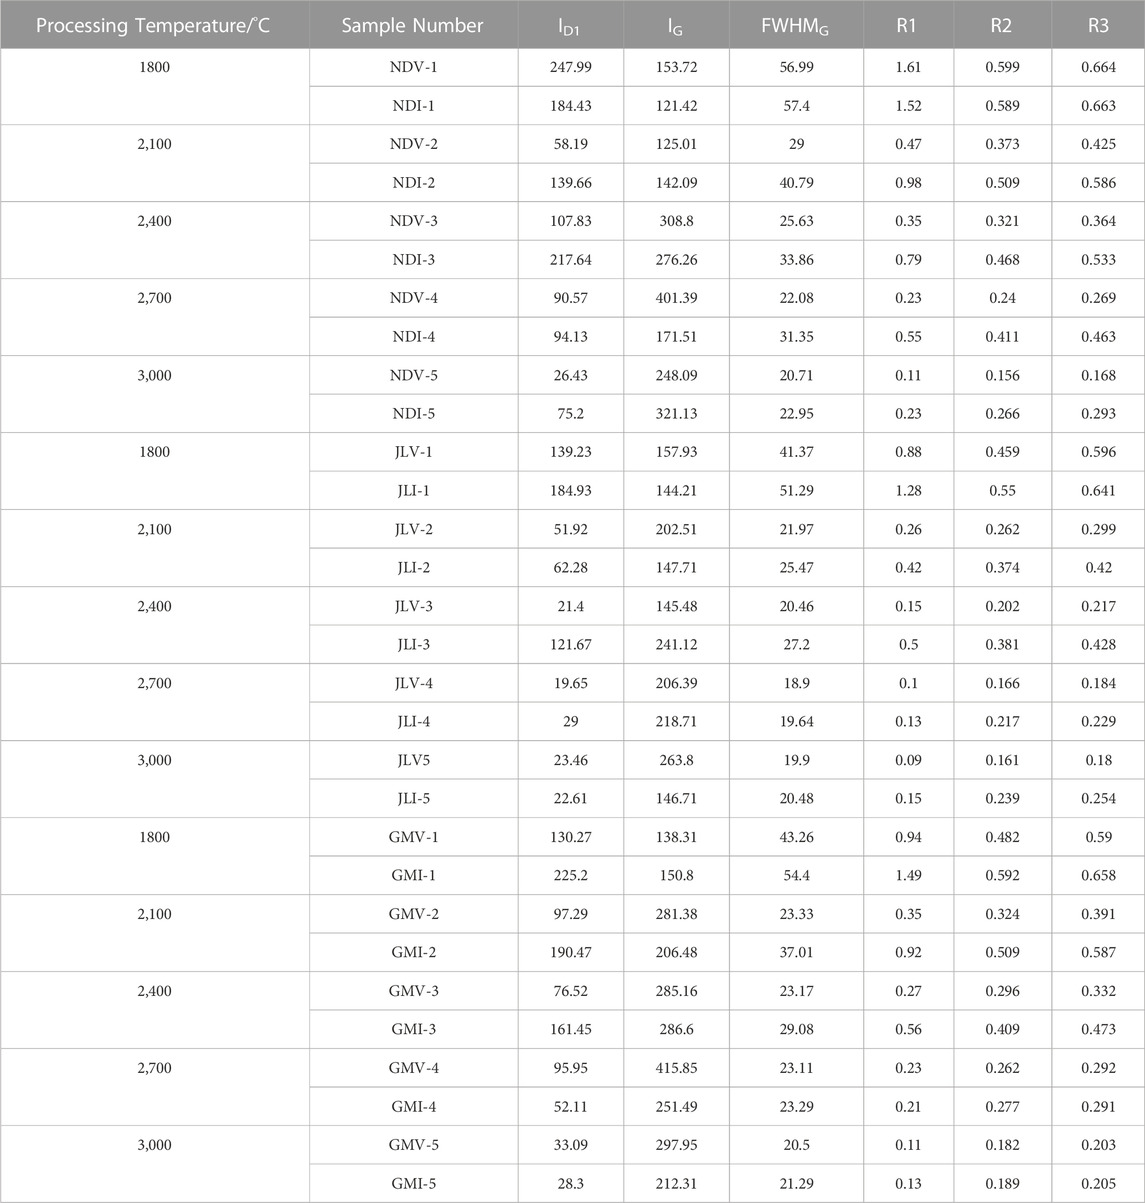
TABLE 6. Raman parameter values of high-temperature treated samples.
By analyzing the Raman spectra and data, it can be observed that with increasing simulated temperature, the G peak, which represents ordered graphite structures, gradually strengthens and shifts towards 1,580 cm-1, while the intensity of the D peak, representing disordered structures, weakens. Among the defect peaks, the D1 peak is predominant, and the D2 peak may also appear in samples with a higher degree of graphitization. However, the D4 peak completely disappears under high-temperature treatment conditions. When the simulated temperature exceeds 1800°C, the D3 peak, representing other heterocyclic defects, almost does not develop, and only a few samples may exhibit weak D4 defect peaks. When the temperature exceeds 2,400°C, the D4 peak no longer develops. Additionally, with increasing temperature, in the second-order Raman spectra, the S1 peak gradually separates into S1’ and S1” peaks, while the S2 peak gradually disappears, indicating the gradual formation of a three-dimensional structure.
By plotting the variation curve of d002 with temperature for all samples in high-temperature thermal simulation, with the high-temperature thermal simulation temperature as the x-axis and the measured d002 values as the y-axis (Figure 9), the following evolution characteristics of d002 during the maceral graphitization process can be summarized.
1) In comparison to vitrinite, inertinite has inherent structural advantages, with lower initial d002 values and stronger structural ordering. In the graphitization process under high-temperature thermal simulation, except for JLV at 2,100°C, where the d002 value is lower than that of JLI (Figure 9B), the evolution of graphite structure of vitrinite is generally lower than that of inertinite under the same conditions. Throughout the entire temperature range, the d002 of vitrinite is higher than that of inertinite, indicating a lower degree of graphitization compared to inertinite (Figures 9A,C).
2) Although vitrinite has a lower degree of graphitization compared to inertinite at the same temperature point, the evolution rate of vitrinite macromolecular structure is generally higher than that of inertinite. In the initial state, the △d002 values (absolute difference in d002) between vitrinite and inertinite are large. However, as the temperature increases, the difference in graphitization between vitrinite and inertinite decreases, and the △d002 values decrease. At 3,000°C, the d002 values of the two macerals are almost equal.
3) Throughout the entire temperature range of coal graphitization simulation experiments, the d002 of vitrinite shows a smooth evolution, while the curves representing the evolution of the macromolecular structure in inertinite exhibit a zigzag pattern. This evolution can be divided into three stages: between 1800°C and 2,100°C, the evolution of interlayer spacing remains relatively stable, with d002 maintained around 0.3440 nm (Figure 9), which is equivalent to the boundary between anthracite and coal-derived graphite (Kwiecińska and Peterson, 2004). Between 2,100°C and 2,400°C, the evolution rate of inertinite accelerates and surpasses that of vitrinite, causing the d002 value to rapidly decrease to around 0.3380nm, corresponding to the semigraphitization stage (Kwiecińska and Peterson, 2004). This indicates the presence of a graphitization threshold (Critical Temperature 2,100 °C) for the evolution of inertinite macromolecular structure. Between 2,400°C and 3,000°C, the rate of reduction in d002 for inertinite slows down again, approaching the evolution rate of vitrinite. The d002 value shifts from 0.3380 nm towards the standard graphite lattice spacing of 0.3354 nm.
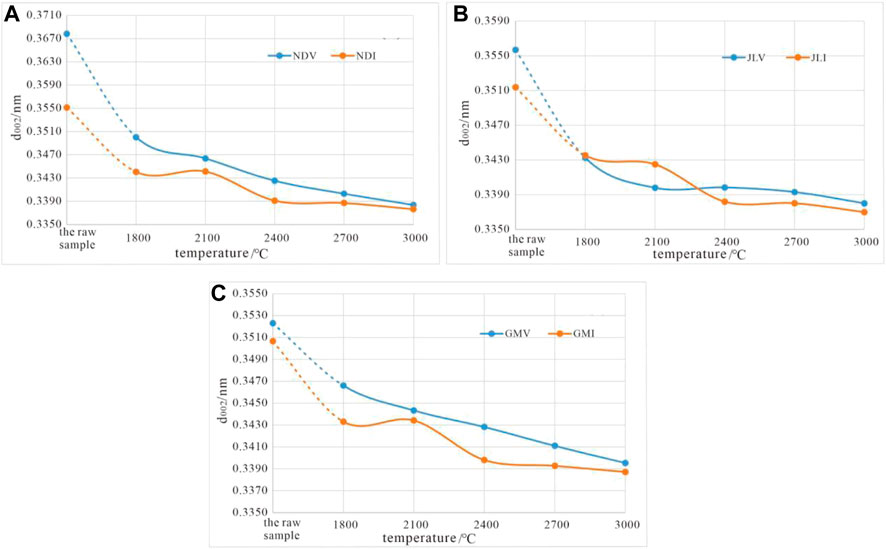
FIGURE 9. Variation of d002 with temperature for high-temperature thermal simulation samples. (A) Variation of d002 with temperature for sample NDV and NDI treated at different temperature. (B) Variation of d002 with temperature for sample JLV and JLI treated at different temperature. (C) Variation of d002 with temperature for sample GMV and GMI treated at different temperature.
Using the simulated temperatures as the x-axis and the R2 and R3 values of the simulated samples as the y-axis, the curves of R2 and R3 as a function of temperature for all the simulated samples were plotted (Figure 10).
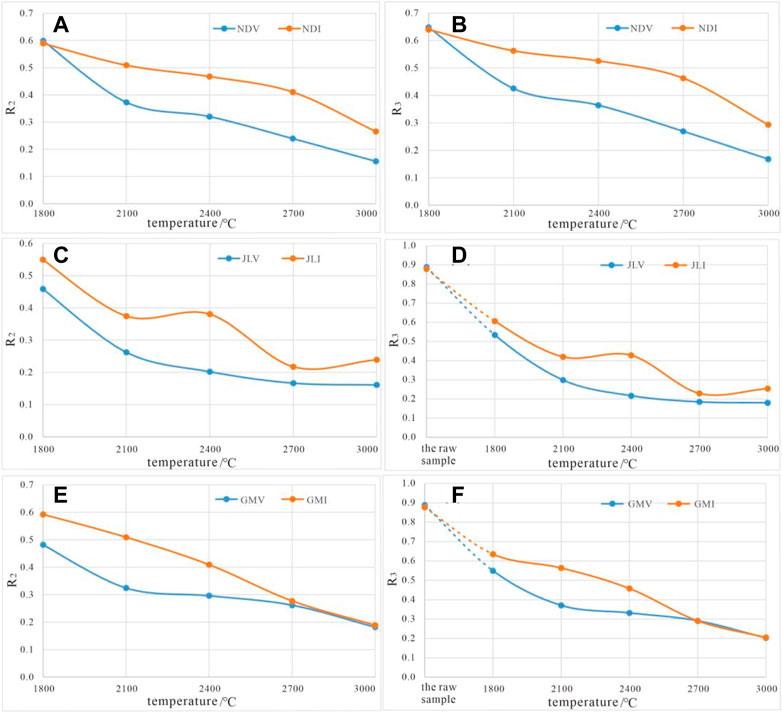
FIGURE 10. The temperature-dependent curves of Raman parameters R2 and R3 for high-temperature thermal simulation samples. (A,B) Variation of R2 and R3 with temperature for sample NDV and NDI treated at different temperature. (C,D) Variation of R2 and R3 with temperature for sample JLV and JLI treated at different temperature. (E,F) Variation of R2 and R3 with temperature for sample GMV and GMI treated at different temperature.
The R2 and R3 curves of vitrinite and inertinite exhibit similar evolution trends, showing a continuous decrease with increasing temperature, indicating the gradual healing of lattice defects. However, the forms of the lattice defect evolution curves for vitrinite and inertinite are not identical.
The R2 and R3 curves of vitrinite are consistently below the curves of inertinite, and in most cases, the slope of vitrinite curves is higher than that of inertinite curves. This indicates that under the same simulated temperature conditions, vitrinite has fewer lattice defects than inertinite, and the healing rate of defects in vitrinite (reflected by the decrease in R2 and R3 values) is also higher than that in inertinite.
Based on previous studies and the analyses in this paper, two explanations for the difference in defect elimination capacity between vitrinite and inertinite are proposed: (1) The formation of molecular configurations on the carbon layer is closely related to the integrity of the carbon layer (Ruland, 1964). Vitrinite has a lower proportion of aromatic structures, and the aromatic fragments are relatively smaller, making it easier to form carbon layers with fewer defects during stacking. In contrast, inertinite has relatively larger aromatic structures, making it more prone to the formation of carbon layers with vacancies during stacking (Figure 11). (2) Vitrinite produces gaseous carbon atoms during the evolution process, which contribute to defect repair.
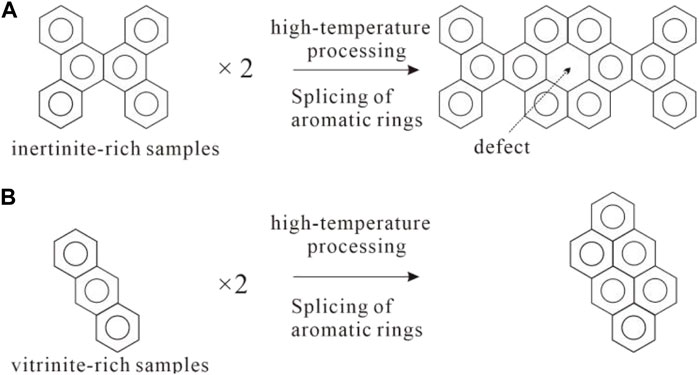
FIGURE 11. illustrates the formation of subsurface defects under the stacking of aromatic layers with different configurations (A): inertinite; (B) vitrinite).
The structural evolution during the graphitization process can be characterized by two aspects: the construction of three-dimensional graphite structure, represented by the decrease in interlayer spacing (d002) and an increase in microcrystalline size (La and Lc); and the elimination of lattice defects, which can be measured using R2 and R3. By analyzing the correlation between microcrystalline morphology parameters (d002, La, and Lc) and lattice defect parameters (R2) of high-temperature thermal simulation samples, the development process of graphite structure in inertinite and vitrinite under high-temperature thermal simulation conditions and their differences can be revealed.
Analyzing the d002-R2 scatter plot (Figure 12A), the following observations can be made: ① The evolution of vitrinite shows a near-linear relationship between d002 and R2, indicating a relatively uniform evolution path for vitrinite during the graphitization process. The scatter plot of inertinite follows a reverse “S" curve, exhibiting a three-stage transition characteristic. The two transition points are located at the starting point of coal-derived graphite-smokeless coal boundary (d002= 0.344 nm) and the boundary between semi-graphite and graphite (d002 = 0.338 nm) (Kwiecińska and Peterson, 2004; Cao et al., 2021), with d002 ranging from 0.344 nm to 0.338 nm, and the rate of decrease in R2 is relatively low. ② The evolution curve of vitrinite is always below or to the right of inertinite, indicating that, under the same interlayer distance (d002), vitrinite has fewer lattice defects than inertinite; or under the same defect level, inertinite has a smaller interlayer distance than vitrinite.
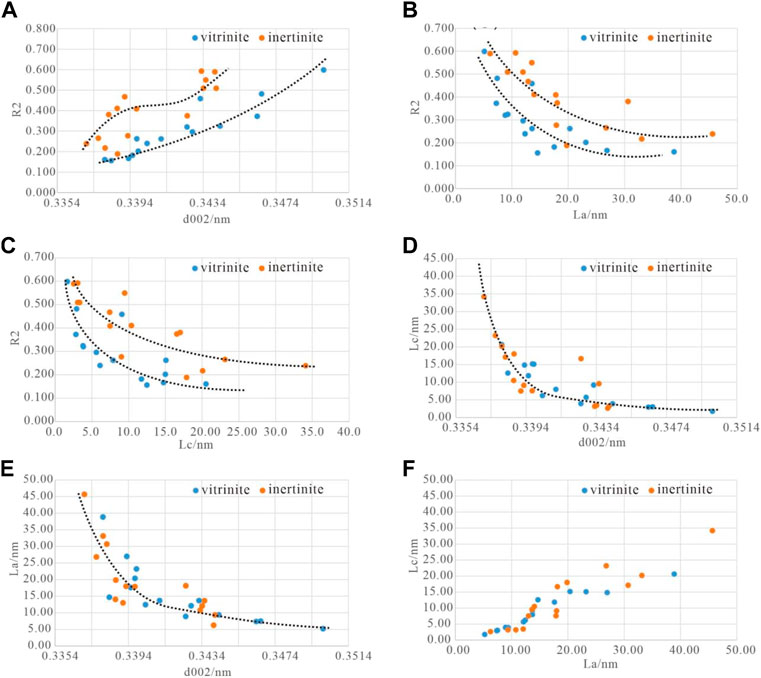
FIGURE 12. The correlation between structural parameters of high-temperature thermal simulation samples. (A) The correlation between d002 and R2. (B) The correlation between La and R2. (C) The correlation between Lc and R2. (D) The correlation between d002 and Lc. (E) The correlation between d002 and La. (F) The correlation between La and Lc.
The La-R2 and Lc-R2 scatter plots (Figures 12B, C) exhibit similar characteristics: ① Microcrystalline size parameters (La and Lc) are negatively correlated with the lattice defect R2, indicating simultaneous growth of graphite microcrystals during the healing of lattice defects. ② The data points of vitrinite fit into an exponential function curve (y = ax, 0 < a <1), showing clear regularity: in the R2 > 0.35 range, La slowly increases from 5 nm to 10 nm, and Lc slowly increases to 5 nm; in the R2 < 0.35 range, La rapidly increases from 10 nm to 40 nm, and Lc rapidly increases to 30 nm. The data points and fitted curve for inertinite are more scattered and roughly exhibit three-stage characteristics, indicating the complexity of graphite microcrystal development in inertinite. ③ In the La-R2 and Lc-R2 scatter plot, most data points of vitrinite are located below or to the left of inertinite, implying that vitrinite has fewer lattice defects than inertinite under the same microcrystalline size (La and Lc).
The d002-Lc and d002-La scatter plot fitted curve (Figures 12D, E) follows a typical exponential function curve (y = ax, 0 < a <1), roughly consisting of three stages: ① In the d002 > 0.344 nm range, La and Lc show a low-value and nearly horizontal distribution, with La <10 nm and Lc < 5 nm. ② In the 0.344 nm < d002 < 0.338 nm range, Lc and La slowly increase to around 15 nm and 20 nm, respectively. ③ After d002 < 0.338 nm, Lc and La rapidly increase, indicating the rapid formation of three-dimensional ordered graphite structure. The evolution path of microcrystalline parameters in vitrinite and inertinite during high-temperature thermal simulation is generally the same, but there are differences in microcrystalline size. For the same d002 interlayer distance, the La and Lc of inertinite are often larger than those of vitrinite, especially in the d002 < 0.338 nm range, where the difference in Lc is particularly evident.
The fitted curve of the La-Lc scatter plot (Figure 12F) shows that the increase in Lc occurs only when La reaches a certain level. When La <10 nm, Lc increases weakly, while after La >10 nm, Lc increases rapidly.
(1) XRD tests showed that inertinite has inherent structural advantages, with higher structural order than vitrinite from the same raw coal. Throughout the entire temperature range of the experiment, the interlayer spacing (d002) of inertinite is always smaller than that of vitrinite, indicating a higher degree of graphitization. However, the graphitization rate of vitrinite is faster than that of inertinite, and at 3,000°C, the d002 values of both macerals tend to be the same.
(2) Vitrinite exhibits a uniform and smooth evolution state throughout the entire temperature ramp, while inertinite exhibits an “inactive” state between 1800°C and 2,100°C (with d002 stagnating around 0.3440 nm). There is a “threshold” for the development of the macromolecular structure of inertinite at 2,100°C. Once the processing temperature exceeds this threshold, inertinite can undergo rapid evolution, and its evolution rate can even be faster than that of vitrinite during certain stages (2,100°C–2400°C).
(3) Raman spectroscopy shows that with the increase in simulated temperature, the defect level of vitrinite rapidly decreases below that of inertinite. Throughout the entire temperature range, vitrinite has a superior defect healing ability compared to inertinite in terms of both rate and capability.
(4) With the increase in processing temperature, an increase in the number of stacked graphite layers can be observed. The development of the internal graphite structure in inertinite is superior to that of vitrinite under the same temperature conditions, characterized by larger graphite layer sizes and straighter carbon layer stripes.
(5) Under high-temperature thermal simulation conditions, the three-dimensional lattice construction and defect elimination in vitrinite show synchronous evolution characteristics (R2-d002 exhibits linear evolution), while the formation of graphite lattice in inertinite exhibits an evolutionary trend of “first three-dimensional lattice construction, followed by gradual defect elimination” (R2-d002 exhibits an “S"-shaped evolution pattern).
The original contributions presented in the study are included in the article/Supplementary material, further inquiries can be directed to the corresponding author.
LZ: conceptualization, Methodology, Software, Investigation, Formal Analysis, Writing—Original Draft; CD: funding Acquisition, Resources, Supervision. CG: data Curation, Writing—Original Draft; CQ: resources, Supervision; BZ: software Validation. All authors contributed to the article and approved the submitted version.
This research was funded by The National Natural Science Foundation of China (42072197, 41772156), and Special project of Science and Technology Innovation and Entrepreneurship Fund of China Coal Science and Industry Group Co., Ltd (2019-ZD004). The funder was not involved in the study design, collection, analysis, interpretation of data, the writing of this article or the decision to submit it for publication.
LZ, CQ, and BZ were employed by the China Coal Technology and Engineering Group Corp.
The remaining authors declare that the research was conducted in the absence of any commercial or financial relationships that could be construed as a potential conflict of interest.
All claims expressed in this article are solely those of the authors and do not necessarily represent those of their affiliated organizations, or those of the publisher, the editors and the reviewers. Any product that may be evaluated in this article, or claim that may be made by its manufacturer, is not guaranteed or endorsed by the publisher.
Atria, J. V., Rusinko, F., and Schobert, H. H. (2002). Structural ordering of Pennsylvania anthracites on heat treatment to 2000−2900 °C. Energy and Fuels 16 (6), 1343–1347. doi:10.1021/ef010295h
Bonijoly, M., Oberlin, M., and Oberlin, A. (1982). A possible mechanism for natural graphite formation. Int. J. Coal Geol. 1 (4), 283–312. doi:10.1016/0166-5162(82)90018-0
Bustin, R. M., Rouzaud, J. N., and Ross, J. V. (1995). Natural graphitization of anthracite: Experimental considerations. Carbon 33 (5), 679–691. doi:10.1016/0008-6223(94)00155-s
Cao, D., Wei, Y., Li, Y., Liu, Z., Li, H., Wang, L., et al. (2021). Determination of identification indexes and construction of classification and grading system for coal-based graphite. J. China Coal Soc. 46 (6), 1833–1846. doi:10.13225/j.cnki.jccs.2021.0305
Dai, S. F., Bechtel, A., Eble, C. F., lorese, R. M., French, D., Graham, I. T., et al. (2020). Recognition of peat depositional environments in coal: Areview. Int. J. Coal Geol. 219, 103383–103467. doi:10.1016/j.coal.2019.103383
González, D., Montes-Morán, M. A., and Garcia, A. B. (2003). Graphite materials prepared from an Anthracite: A structural characterization. Energy and fuels 17 (5), 1324–1329. doi:10.1021/ef0300491
Hargreaves, N. J., and Cooper, S. J. (2016). Nanographite synthesized from acidified sucrose microemulsions under ambient conditions. Cryst. Growth and Des. 16 (6), 3133–3142. doi:10.1021/acs.cgd.5b01753
Hudspith, V. A., and Belcher, C. M. (2020). Some semifusinite in coal may form during diagenesis, not wildfires. Int. J. Coal Geol. 218, 103360. doi:10.1016/j.coal.2019.103360
Kwiecińska, B., and Peterson, H. I. (2004). Graphite, semi-graphite, natural coke and natural char classification-ICCP system. Int. J. Coal Geol. 54, 99–116. doi:10.1016/j.coal.2003.09.003
Li, J. Q. (2022). Differential evolution and mechanism of graphitized coal structure: A case of middle permian coal in yongan basin. China, Xu zhou: China University of Mining and Technology.
Li, J. Q., Qin, Y., Chen, Y. L., Luo, Q. Y., Deng, R. J., Guo, S., H., et al. (2021). Differential graphitization of organic matter in coal: Some new understandings from reflectance evolution of meta-anthracite macerals. Int. J. Coal Geol. 240, 103747. doi:10.1016/j.coal.2021.103747
Mundszinger, M., Farsi, S., Rapp, M., Golla-Schindler, U., Kaiser, U., and Wachtler, M. (2017). Morphology and texture of spheroidized natural and synthetic graphites. Carbon 111, 764–773. doi:10.1016/j.carbon.2016.10.060
Oberlin, A., and Terriere, G. (1975). Graphitization studies of anthracites by high resolution electron microscopy. Carbon 13 (5), 367–376. doi:10.1016/0008-6223(75)90004-4
Pappano, P. J., and Schobert, H. H. (2009). Effect of Natural mineral inclusions on the graphitizability of a Pennsylvania anthracite. Energy and Fuels 23 (1), 422–428. doi:10.1021/ef800515r
Qin, X., Singh, H., and Cai, J. (2022). Sorption characteristics in coal and shale: A review for enhanced methane recovery. Capillarity 5 (1), 1–11. doi:10.46690/capi.2022.01.01
Qin, Y. (1994). Microscopic petrological characteristics and structural evolution of high-rank coals in China. Xuzhou: China University of Mining and Technology Press.
Qiu, D. (2019). Study on the graphitization process of coal and the transformation of coal-related minerals[D]. Xuzhou: China University of Mining and Technology.
Rajak, P. K., Singh, V. K., and Singh, P. K. (2019). Distribution of inertinites in the early paleogene lignites of western India: On the possibility of wildfire activities. J. Geol. Soc. India 93 (5), 523–532. doi:10.1007/s12594-019-1213-x
Rodrighues, S., Suárez-Ruiz, I., Marques, M., Flores, D., Camean, I., and García, A. B. (2011a). Development of graphite-like particles from the high temperature treatment of carbonized anthracites. Int. J. Coal Geol. 85 (2), 219–226. doi:10.1016/j.coal.2010.11.007
Rodrigues, S., Suárez-Ruiz, I., Marques, M., Ignacio, S., and Flores, D. (2011b). Microstructural evolution of high temperature treated anthracites of different rank. Int. J. Coal Geol. 87 (3-4), 204–211. doi:10.1016/j.coal.2011.06.009
Rodrigues, S., Marques, M., Suárez-Ruiz, I., Camean, I., Flores, D., and Kwiecinska, B. (2013). Microstructural investigations of natural and synthetic graphites and semi-graphites. Int. J. Coal Geol. 111, 67–79. doi:10.1016/j.coal.2012.06.013
Ruland, W. (1964). X-ray studies on the carbonization and graphitization of acenaphthylene and bifluorenyl. Carbon 2 (4), 365–378. doi:10.1016/0008-6223(65)90007-2
Shan, Y., Guan, D., Meng, J., Liu, Z., Heike, S., Liu, J., et al. (2018). Rapid growth of petroleum coke consumption and its related emissions in China. Appl. Energy 226, 494–502. doi:10.1016/j.apenergy.2018.06.019
Sharma, S., Shyam, K. C. N., Korvink, J. G., and Kübel, C. (2018). Evolution of glassy carbon microstructure: In situ transmission electron microscopy of the pyrolysis process. Sci. Rep. 8 (1), 16282. doi:10.1038/s41598-018-34644-9
Sierra, U., Álvarez, P., Blanco, C., Granda, M., Santamaría, R., and Menéndez, R. (2015). New alternatives to graphite for producing graphene materials. Carbon 93, 812–818. doi:10.1016/j.carbon.2015.05.105
Stach, E., Mackowsky, M. T., Techmuller, G. H., and Taylor, D. (1982). Stach's text book of coal Petrology. 3rd ed. Berlin: Gebruder Bonrtraeger.
Suárez-Ruiz, I., and García, A. B. (2007). Optical parameters as a tool to study the microstructural evolution of carbonized anthracites during high-temperature treatment. Energy and Fuels 21 (5), 2935–2941. doi:10.1021/ef700221r
Tang, Y., Xu, J., Huan, X., Wang, S., and Chen, P. (2020). Preparation and spectral characterization of Yunnan Xiaofalu smokeless coal-based graphene. J. China Coal Soc. 45 (2), 740–748. doi:10.13225/j.cnki.jccs.2019.0216
Wang, L., Qin, R. F., Li, Y., and Zhang, H. (2019). On the difference of graphitization behavior between vitrinite- and inertinite-rich anthracites during heat treatment. Energy Sources Part A 217, 4991–5003. doi:10.1080/15567036.2019.1656681
Xing, B., Zhang, C., Cao, Y., Huang, G., Liu, Q., Zhang, C., et al. (2018). Preparation of synthetic graphite from bituminous coal as anode materials for high performance lithium-ion batteries. Fuel Process. Technol. 172, 162–171. doi:10.1016/j.fuproc.2017.12.018
Yang, L., and Pu, M. (2013). Study on preparation of graphene by TaiXi smokeless coal-based graphite[J]. Coal Process. Compr. Util. 5, 58–60. doi:10.16200/j.cnki.11-2627/td.2013.05.006
Yu, Z., Xie, W., Qiu, D., Lu, Q., Jiang, H., and He, Y. (2022). Influence of additives on the microstructure of coal-based graphite. Coal Sci. Technol. 10, 1–8. doi:10.13199/j.cnki.cst.2021-0966
Zhang, X. (2014). Graphitization of Shenfu coal and its maceral catalysis. Xi'an: Xi'an University of Science and Technology.
Zhang, X., Wang, S., Chen, H., Li, X., and Zhang, Y. (2022). Study on graphitization of low-rank coal: Evolution characteristics of aromatic structure. J. China Coal Soc. 47 (07), 2768–2778. doi:10.13225/j.cnki.jccs.2021.1052
Zhang, Y., Zhou, A., Zhang, X., and Qiu, J. (2013). Study on preparation of coal-based graphene from TaiXi smokeless coal precursor. Coal Convers. 36 (4), 57–61. doi:10.19726/j.cnki.ebcc.2013.04.014
Zhu, H., Huang, C., Ju, Y., Bu, H., Li, X., Yang, M., et al. (2021). Multi-scale multi-dimensional characterization of clay-hosted pore networks of shale using fibsem, tem, and x-ray micro-tomography: Implications for methane storage and migration. Appl. Clay Sci. 213, 106239. doi:10.1016/j.clay.2021.106239
Keywords: coal-based graphite, high-temperature thermal simulation, vitrinite, inertinite, X-ray diffraction
Citation: Zhifei L, Daiyong C, Gaojian C, Qingtong C and Zhongwei B (2023) High-temperature graphitization characteristics of vitrinite and inertinite. Front. Earth Sci. 11:1235457. doi: 10.3389/feart.2023.1235457
Received: 06 June 2023; Accepted: 03 July 2023;
Published: 11 July 2023.
Edited by:
Yong Wang, Southwest Petroleum University, ChinaReviewed by:
Yanyan Chen, Research Institute of Petroleum Exploration and Development (RIPED), ChinaCopyright © 2023 Zhifei, Daiyong, Gaojian, Qingtong and Zhongwei. This is an open-access article distributed under the terms of the Creative Commons Attribution License (CC BY). The use, distribution or reproduction in other forums is permitted, provided the original author(s) and the copyright owner(s) are credited and that the original publication in this journal is cited, in accordance with accepted academic practice. No use, distribution or reproduction is permitted which does not comply with these terms.
*Correspondence: Cao Daiyong, Y2R5QGN1bXRiLmVkdS5jb20=
Disclaimer: All claims expressed in this article are solely those of the authors and do not necessarily represent those of their affiliated organizations, or those of the publisher, the editors and the reviewers. Any product that may be evaluated in this article or claim that may be made by its manufacturer is not guaranteed or endorsed by the publisher.
Research integrity at Frontiers
Learn more about the work of our research integrity team to safeguard the quality of each article we publish.