 Lian Liu
 Jeremy D. Bricker
 Chao Hu
94% of researchers rate our articles as excellent or good
Learn more about the work of our research integrity team to safeguard the quality of each article we publish.
Find out more
BRIEF RESEARCH REPORT article
Front. Earth Sci., 24 August 2023
Sec. Hydrosphere
Volume 11 - 2023 | https://doi.org/10.3389/feart.2023.1232481
This article is part of the Research TopicRisk Assessment and Management of Water Conservancy ProjectsView all 16 articles
Early initial impoundment can generate additional revenue but bring more flood risk in late-stage construction diversion. In view of the possible flood risk and catastrophic consequences caused by high dam failures induced by early impoundment, a comprehensive assessment is proposed. Taking the Lianghekou high rockfill dam on the Yalong River, southwest China, as an example, this study established the late-stage diversion risk model and predicted the failure probabilities for the original, 15 days ahead, and 30 days ahead schemes varied with the initial impoundment time using the Monte Carlo method. Then, considering overtopping-induced gradual breaking of rockfill dams, the NWS dam-break flood forecasting model (DAMBRK) was used to estimate the break development and the outflow hydrograph. Due to no significant differences being found in the outflow hydrographs of the three schemes, life loss was used an index for the consequences of inundation. Combining the failure probability, life loss, and early impoundment revenues brought by earlier power generation, a satisfied initial impoundment scheme was acquired using the multi-objective decision model. The results revealed this method can find a reasonable initial impoundment time in view of the late-stage diversion risk assessment.
It is generally believed that a large-scale flood is not likely to occur within the dam construction period (Marengo et al, 2017), but a high dam’s longer construction period makes flood risks more possible. Since 1930, half of all failures and most relevant fatalities for dams higher than 30 m have been due to overtopping during construction (Lempérière, 2017). Available hydrologic evidence demonstrates this (e.g., at Kariba, Oros, Aldedavilla, Akosombo, Cahora Bassa, Tarbela, and Aguamilpa). For high dams of a 200 m level, river diversion failure probability, as well as its consequences, may be amplified by high impounded water levels, uncertain construction progress, and multiple construction flood seasons.
In the past 5 years, an increasing number of super high dams have been built or are being built in China, such as Xiluodu Station (285.5 m), Baihetan Station (289.0 m), Wudongde Station (270.0 m), Changheba Station (240.0 m), and Shuangjiangkou Station (305.0 m). Many of them choose to impound water ahead of schedule to generate more revenue in late-stage diversions. Compared with two other typical diversion processes—the initial and mid stage diversions—storage and discharge capacity are limited at the late stage. Once overtopping flood events happen, the water level rises rapidly and the unbuilt dam overtopping risk increases greatly. In this case, early initial impoundment will bring potential safety hazards if the late diversion system does not work well. In August 2018, an overtopping flood occurred at the Hidroituango rockfill dam (225 m) in Colombia, induced by the heavy rainfall during the late-stage diversion. Nevertheless, researchers believed that closing two diversion tunnels to impound water before the time when the dam height was sufficient and the intermediate discharge structure not being finished yet were the factors that produced the overtopping (Guillermo, 2018). This failure cost at least 1 billion dollars, including a 3-year delay in power sales loss, plus clean-up and reconstruction costs. Hence, a late-stage diversion risk assessment is desirable before taking early initial impoundment.
Present risk assessment-related research about river diversions during dam construction has mainly focused on the initial and mid stages. Diversion risk probability is predicted well if the probabilistic distribution functions for uncertainties are known based on the Monte Carlo Simulation method (Hu et al, 2006; Song et al, 2018; Liu et al, 2019; Zhang et al, 2019). Generally, the curve between tunnel discharge and the upstream water level is relatively simple, but more constraints have to be considered about tunnel discharge in late-stage diversions, such as the water level rising speed rate, the ecological flow requirement, and maintenance days, and previous diversion risk models have not yet reflected these. As for the risk consequences, the flood inundation damage commonly represents it with velocity of flow, water depth, and inundation duration (Moel et al, 2011; McGrath et al, 2015), while high dam (200 m–300 m) failures will bring catastrophic consequences and make water depth much higher than a common dam, which means the depth or duration-damage functions are not adopted in this situation, as the downstream cities or towns are nearly completely inundated.
Taking the Lianhekou high rockfill dam as the case study, this article aims to estimate the late-stage diversion failure probability and risk consequences due to overtopping varied with initial impoundment times. Considering the constraints of initial impoundment, the late-stage diversion risk model is established, and the uncertainties are simulated using the Monte Carlo method to calculate the risk probability. Combining the risk probability, inundation loss by empirical formulas, and early impoundment revenues brought by earlier power generation, a comprehensive assessment is made using a multi-attribute decision-making method.
Lianghekou Station is situated at a section about 2 km downstream from the junction of the Yalong River and its tributary, the Xianshu River. It is 25 km north of Yajiang County and 640 km north of Panzhihua City along the Yalong River in Sichuan Province, southwest China. The Yalong River is one of tributaries of the Yangtze River. The Jinsha River, the upper main reach of the Yangtze River, and the Yalong River are both nearly parallel to the Lancang River, an international river in the junction of Xizang Province and Yunnan Province. A map indicating the study area is shown in Figure 1.
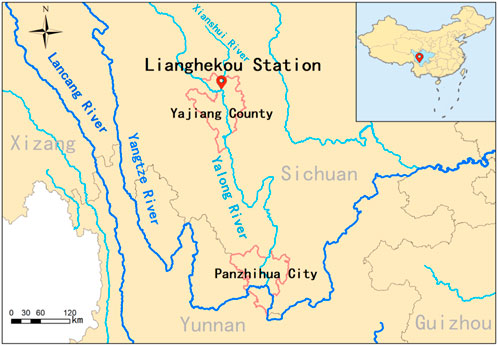
FIGURE 1. Location of Lianghekou Station.
The Lianghekou earth core wall rockfill dam has a maximum height of 295 m, and the reservoir capacity is about 10.15 billion m3. Average annual discharge is 666 m3/s. Its construction started in 2014 and is ongoing in 2023 with the main purpose of energy generation, and the total generation capacity is 3,000 MW. As the layout of the diversion system of Lianghekou Station (Figure 2) shows, five diversion tunnels are at the construction site, three higher elevation tunnels (#3, #4, and #5) and two lower tunnels (#1 and #2) are on the left and right bank, respectively. At the end of February 2018, the mid stage diversion began, when the dam height was 2,658 m in elevation. When it comes to the late-stage diversion, the height should be at 2,775 m elevation. Table 1 provides the detailed original late-stage diversion procedure.
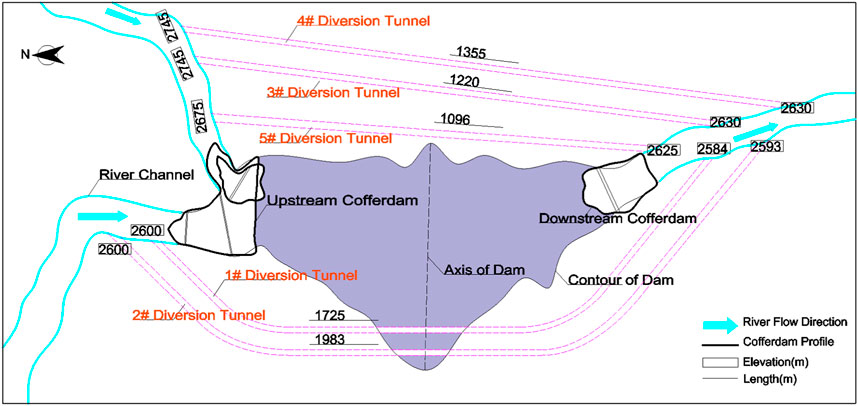
FIGURE 2. Layout of diversion system of Lianghekou Station.
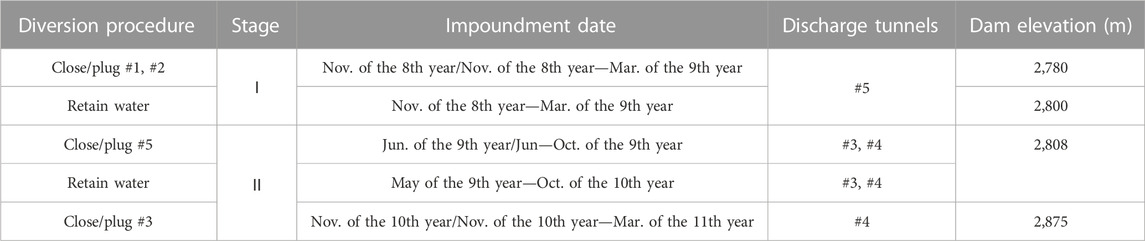
TABLE 1. The original late-stage diversion procedure of Lianghekou Station.
The power generation water level for the first unit (2,785 m) needs to go through two impoundment stages. The monthly average flood discharge is more than 550 m3/s in September and October every year, when the water level exceeds the closed-gate standard. Accordingly, only stage Ⅱ has the early impoundment opportunity but the possibility of overtopping still exists. Hence, two early schemes are implemented to compare with the original scheme as shown in Table 2, 15 days ahead and 30 days ahead, respectively.
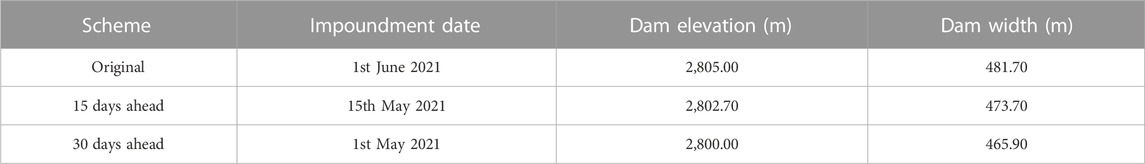
TABLE 2. Early impoundment schemes.
Uncertainty refers to a condition or variable which is not able to be quantified exactly and it has random characteristics (Liu et al, 2017). Uncertainty analysis arises from our inability to assess the outcome of a system failure due to its inherent random characteristics in complex and non-linear models, and incomplete historical recorded data, or both. For a river diversion system risk assessment, hydrologic and hydraulic uncertainties are two main uncertain variables, which are described by flood inflow and diversion structure discharge, respectively (Afshar et al, 2009). One problem regarding these two variables under some predicable conditions is selecting their probabilistic distribution functions (PDF) to sample enough data with appropriate accuracy. The Pearson type III (P-III) distribution is widely accepted as the best PDF to fit hydrological variables like flood inflow series at different time scales in China (Wu et al, 2012; Hong et al, 2015), and it has also been generally adopted in river diversion risk analysis (Marengoa et al, 2013) and recommended to be used for frequency distributions for hydrological stochastic variables according to standard specifications in China (MWR, 2017a).
Another uncertainty is the discharge capacity of diversion structures, which is related to the river diversion system itself. Designed discharge that is inconsistent with the actual one often happens in practical construction due to design errors of hydraulic parameters or some unforeseen situations. Empirical formulas are commonly used to calculate diversion structure discharge capacity, such as the Manning formula (Najafi et al, 2012; Andersson et al, 2019) being applied in open channels and the pressure flow formula in pressure tunnels. As the roughness highly correlates with the discharge value, its uncertainty can well describe the tunnel discharge uncertainty. Previous work (Johnson, 1996) has proved the roughness random variables approximate the normal distribution or triangular distribution, so it is reasonable and feasible that triangular distribution is assumed for diversion discharge variability (Liu et al, 2019; Zhang et al, 2019). Additionally, impoundment for high dams commonly uses tunnels at different elevations to discharge water in stages, and even adopts joint discharge, which makes the discharge capacity more random.
These two uncertainties combined with the relationship between the reservoir discharge capacity q and reservoir water level Z jointly determine the highest upstream water level of the dam through the method of water balance calculation. In late-stage diversions, the reservoir capacity V is determined by the temporary dam section during construction, and its V-q and V-Z relation are generally obtained by measurement and hydrological observation. Hence, the flood regulating calculation can be expressed by the equation of water balance, V-q, and V-Z relations as Formula 1:
where Q1 and Q2 are the initial and end reservoir inflow in time interval t; q1 and q2 are the initial and end reservoir discharge in time interval t; V1 and V2 are the initial and end storage capacity in time interval t; f1 is the functional relationship between q and V; and f2 is the functional relationship between V and Z.
Diversion risk is considered the failure probability of diversion works, which derives from uncertainties throughout the service life. For rockfill dams, overtopping is our most concerning and easily observed failure during the diversion period; therefore, this article defined overtopping probability as diversion risk. Compared with the initial- and mid-stage diversion risk definitions in previous studies (Zhang et al, 2014; Liu et al, 2019; Zhang et al, 2019), the late-stage diversion risk model with more constraints is as Formula 2:
where Rt is the diversion risk probability at time t; Zm is the highest upstream water level of the dam; Hd is the dam elevation; P ( ) is the probability that Zm exceeds Hd under some constraints; m is the stages of impoundment; q is the discharge capacity of the diversion structures; qmin and qmax are the lower and upper limits of q; v ( ) is the rising rate of the water level; vmax is the upper limit of v before the overtopping flood event occurs; Hr is the water head for the retaining of the tunnel gate; hrmax is the upper limit of Hr; Hc is the water head for closing tunnel gate; and hcmax is the upper limit of Hc.
Monte Carlo Simulation (MCS) is an effective approach to perform risk simulation which can replicate stochastic variables according to their distribution functions. It simplifies some complex mathematical analyses into a probabilistic model which is easily to implement. If the distribution functions are chosen reasonably, the problem of insufficient observation data can be solved. Therefore, MCS is widely applied in quantitative risk analyses involving uncertainties.
In the model above, Rt is obtained by the frequency statistics of sampling that Zm is higher than Hd by MCS. Hd can be gained from the dam construction schedule, while Zm cannot be calculated by the simulation-based sampling directly, as the measured highest upstream water level data sequence is too short during construction to fit a reliable distribution function. Therefore, the indirect access to credible samples of Zm is the water balance calculation as described in 3.1 after generating random samples of flood inflow Q and discharge capacity q, which follow the P-III distribution and triangular distribution, respectively.
Each simulation generates one random flood inflow and one discharge of diversion structures, then outputs a single water level value at a time. The total simulation time is set as M. If the times that water level values are larger than the dam elevation Hd is N, the risk probability at time t is N/M.
Besides the risk probability, consequence is also a significant quantitative index for risk assessment. The diversion risk assessment is separately defined as the product of overtopping probability and inundation loss downstream caused by overtopping. Compared with concrete dams and other dams with cementitious materials, rockfill dams have weaker flood resistance ability, especially when they are under construction. Hence, the extreme flood overtopping for the temporary dam section is highly likely to induce a dam break. The dam breach outflow and the river course characteristics both affect the downstream flood routing. Therefore, the numerical simulation for dam breach and flood routing can serve to risk assessment for dam failure and inundation.
Overtopping breaking of rockfill dams in most cases is a kind of gradual breaking and is affected by overtopping flow, dam materials and structural type, and various other factors (Luo et al, 2014). The two modeling tasks of computing a dam breach outflow hydrograph and the flood routing through the downstream valley can be considered separately, and the breach outflow hydrograph can be further divided into a breach simulation and outflow hydrograph computation (Wurbs, 1987):
(1) The DAMBRK model (Fread, 1984) was used to predict the breach characteristics since breach outflow is largely by the geometry of the breach and the development of the breach with time. Figure 3 shows the breach parameter for a trapezoidal shape geometry required in the DAMBRK model. The final breach bottom width B can be determined using this relation:
where Bavg is the average breach width, and it can be deduced by empirical formula proposed by the Bureau of Reclamation (USBR, 1988); hw is the water height above the breach bottom; and z is the breach side slope. Its value is deduced by the dam material and can refer to Formula 4:
where φ is the internal friction angle of dam material, and 38° is reasonable since the main material of the dam is gravelly soil after rolling.
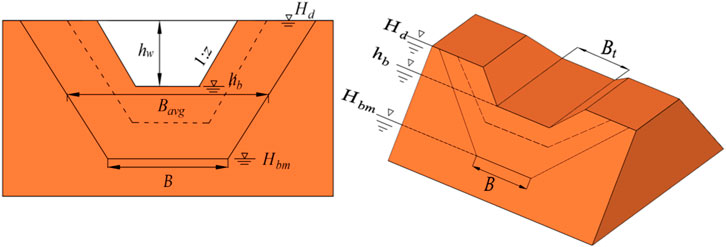
FIGURE 3. Geometric representation of breach parameters.
The development of the breach bottom elevation hb and breach bottom width Bt can be seen as the functions of time in Formula 5:
where Hd is the elevation of the dam; Hbm is the final breach bottom height; Tk is the dam break duration deduced by empirical formula proposed by the Bureau of Reclamation (USBR, 1988); tb is the time that has elapsed since the beginning of the breach; and ρ is the parameter representing the breach non-linearity. In this paper, it is set as 1, assuming that the development of hb and Bt follow a linear growth rate.
(2) The breach outflow Qk is calculated using the broad crested weir equation shown in Formula 6–8. It can be seen as the upstream boundary for the flood routing model.
where Vc is the correction coefficient of the discharge; hz is the reservoir water level by flood routing; hf is the tail water level; and Ks is the coefficient considering the backwater effect of tailwater level. If Ks is 1, this effect is not considered; Bd is the dam width varied with impoundment time.
Inundation loss mainly involves life loss and economic loss from damage caused by dam breaches. An approximation for loss of life derived from the historical record of dam failure and flash flood cases is put forward in Formula 7, and it was applied in the “Chinese risk assessment code for flood control on construction of hydropower and water resources project” issued by the National Energy Administration.
where Np is the number of lives lost; PT is population of the at risk region; Tw is the number of hours warning; and CF is the flooding forcefulness. If PT is located on a plain, where flood water is likely to be shallow and slow, CF is 0; if PT is located in a canyon, where flood water is likely to be very deep and swift, CF is 1.
It is reasonable to think human life value can be used as a statistical term to enable the numerical relation of life loss and economic loss to be established (Ge et al, 2017), although putting an economic value on human life can lead to strong criticism and opposition for ethical reasons.
The Chinese government, based on the economic data collected from prior accidents, believes that each individual death caused by an accident is roughly equivalent to 3.3 million to 5 million Yuan of direct economic loss. Thus, a ratio of 1 person to 4 million Yuan is recommended for the determination of economic risk criteria for dams in China (Li et al, 2018; Ge et al, 2022). Therefore, if the inundation areas are determined by numerical model, PT and Np will be used to estimate the direct economic losses.
Generation revenue comes from generation ahead of schedule, and is needed to predict how long the early impoundment will take compared with the original scheme. The early impoundment process calculation is as follows.
The reservoir inflow data can be directly extracted from the annual runoff series during the impoundment period every year, and frequency analysis can be conducted.
According to “Chinese specification on water conservancy computation of hydroelectric projects”, the inflow guarantee frequency for the initial impoundment calculation requires 75%–80%. Therefore, the inflow frequency which is closest to the guarantee frequency is selected as the inflow for the reservoir impoundment process calculation.
Since impoundment and power generation is a gradual and continuous process, 1 day was selected for the generation calculation time step for accuracy requirements. The power generation calculation was described as follows:
Based on Bernoulli’s equation and the energy conservation, the hydraulic turbine output power P and the daily generation w can be expressed as Formula 8
where h is the daily average net water head. It is equal to the difference between the impoundment water level and the downstream water level. ηt is the efficiency coefficient for the turbines; ηg is the efficiency coefficient for the generators; and q is the daily average water flow through the hydraulic turbines. It is equal to the reservoir inflow minus the outflow of the discharge structures and other water consumption, like ecological flow. To is the operation time.
The generation revenue Bg is given in Formula 9:
where Tc is the accumulated days; c is the electricity price; and wi is the generation on the ith day.
Combining the failure probability, life loss, and early impoundment revenues brought by earlier power generation, a technical route for late-stage diversion risk assessment for high dams considering early initial impoundment is shown in Figure 4.
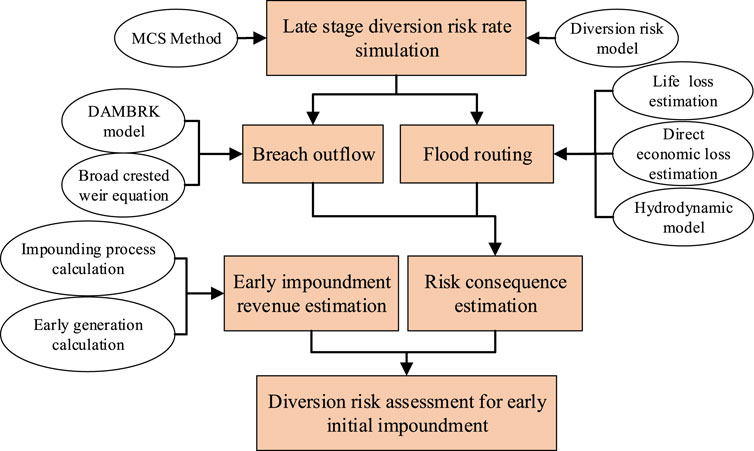
FIGURE 4. The technical route for late-stage diversion risk assessment.
Based on data from 1952 to 2012 from Yajiang hydrological station, the parameters of the Yalong River’s P-III distribution are in Table 3. The random flood peak series were used to simulate flood hydrographs using the varied ratio amplification method (Xiao et al, 2007) deduced from a local typical flood hydrograph. The 2012 flood hydrograph was selected as the typical flood hydrograph. If the simulation time M was 10, the simulated flood hydrographs are in Supplementary Appendix SA.
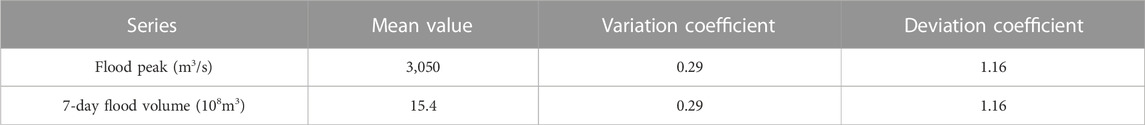
TABLE 3. P-III distribution parameters of flood flow in the Yalong River.
In the second impoundment stage, tunnels #3 and #4 discharged jointly from November 2020 to March 2021. The discharge ability appeared in the triangular distribution and its parameters of maximum, median, and minimum were set as 0.98, 1.00, and 1.02, respectively. The relationship between reservoir discharge capacity q and reservoir water level Z in Formula 1 are given in the form of the relationship between reservoir capacity V and Z, as well as Z and q in Supplementary Appendix SB.
The initial calculation water level is set 2,745 m as it is the starting level of the second impoundment stage; the ecological flow is 10% of the annual average flow, which is 67 m3/s; the maximum flow is 6,387.5 m3/s; The highest gate static water head is 70 m.
With all the data provided above, the upstream water level series and the highest upstream water level for each series can be calculated. Early impoundment makes the dam elevation for water retaining lower than that of the orginal scheme, so the risk simulation results using the MCS vary with the impoundment time advanced from May 31st to May 1st, as shown in Figure 5. To ensure accuracy and stability, the MCS should be conducted enough times to collect stable results. For this case, 100,000 times is enough. Figure 5 also reveals the tendency change of the diversion risk probability along with the impoundment time, and the filling elevation of the dam.
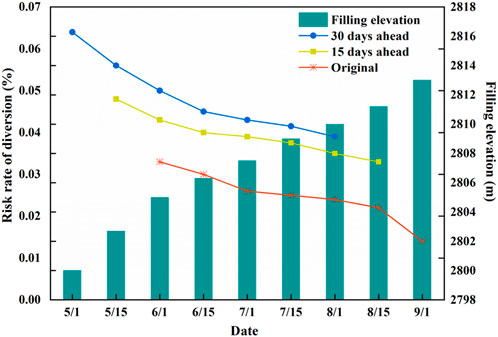
FIGURE 5. Diversion risk along with the impoundment time and filling elevation.
Since complete dam failures are rare, some remain parts of the dam will exist. Therefore, the breach bottom elevations are set 1/4 Hd, 1/3 Hd, 1/2 Hd, and 2/3 Hd. Table 4 gives the unbuilt dam parameters for the three schemes. The dam-break flood is set 5000-year flood to meet the worst condition. Breach failure time is predicted according to the empirical formula proposed by the Bureau of Reclamation (BR). The breach bottom elevation and breach bottom width vary linearly with time, and breach side slope z is 2.05.
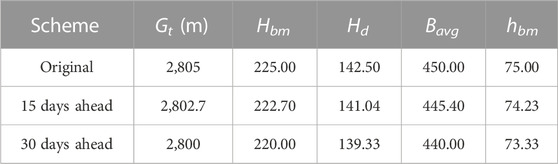
TABLE 4. Unbuilt dam parameters for the three schemes.
The outflow hydrograph results in Figure 6 for the three impoundment schemes shows the outflow hydrographs have no significant difference.
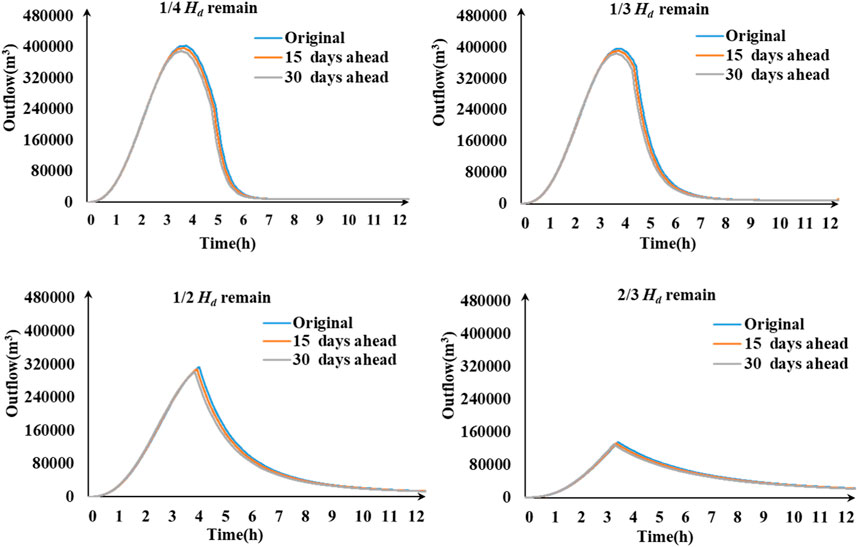
FIGURE 6. Breach outflow hydrographs of the three early impoundment schemes.
The outflow hydrographs also indicate the flood routing and inundation loss of the three schemes are no different. The results of the hydrodynamic numerical calculations prove that all downstream villages with densely populated settlements along the river are totally under the water at a depth of 50–140 m. The consequences are catastrophic and homogeneous. Hence, the economic loss may not be considered as a risk assessment index in this case.
Since the downstream counties are all quite remote mountainous areas, the value of Cf is 1 in Formula 7. When the distance from the dam site is more than 50 km, people have sufficient evacuation time. Thus, the population at risk is in the Yajiang County region. The life losses are shown in Table 5. Tw is the duration from the time when the breach is observed to the outflow spread to the nearest village downstream. Through computing the flood routing, the number of inundated villages and the corresponding population PT can be derived from the inundated water depth.
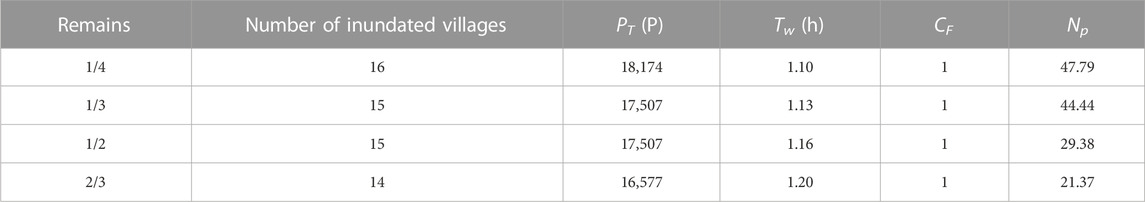
TABLE 5. The parameters and the result for loss of life in the 30 days ahead scheme.
After frequency analyzing for runoff series from June to August at the dam site, the inflow of 1987 was selected as the reservoir impoundment inflow (the monthly average flow was 1,015.7 m³/s) due to its 75.9% frequency, which is in the range of 75%–80%. During the impoundment period, the ecological water supply needs to be guaranteed. Generally, the ecological water demand for downstream rivers is about 10%–20% of the average annual flow. Therefore, the minimum ecological water outflow is 10% of the average flow, approximately 67 m3/s below 2,745 m and 96 m3/s above 2,745 m.
From June to August, the inflow is relatively large, so it has little effect on the guaranteed output of the downstream cascade power stations. Therefore, this paper does not consider the downstream station’s generation requirement, and assumes that no surplus water can be realized by reasonable reservoir operation, which means the early generation capacity is the effective energy that can be absorbed by the grid system.
The water level control principle while rising is: at 2,685–2,745 m, the rising rate is not more than 1.5 m per day, and the monthly total rising height is within 40 m; when reaching 2,745 m, the water level must to be maintained at 2,745 m for 7 days due to the requirement for tunnel #5 closure; at 2,745–2,785 m, the rising rate is not more than 1.6 m per day, and the monthly total rising height is within 50 m. The dates of reaching the 2,745 m level of early impoundment are in Figure 7. The original scheme’s date is from 1 June to 1 September. The other two schemes’ dates are from 15 May to 16 August and 1 May to 3 August, respectively, and the time to reach 2,785 m has been advanced by 28 and 15 days, respectively.
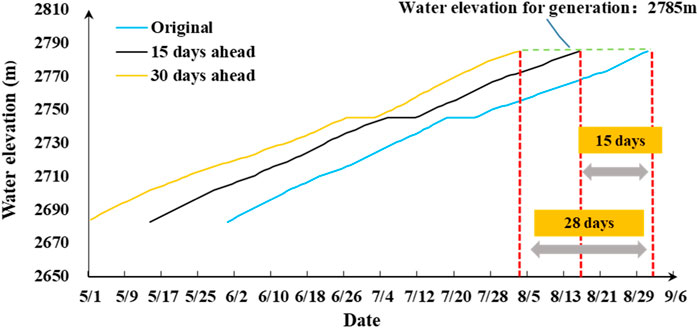
FIGURE 7. Days to reach generating water elevation in advance.
The electricity price in the grid is set 0.343 yuan/KWh according to the Sichuan Provincial Development and Reform Commission. Hence, the increased generation revenues for early impoundment Bi are predicted by Formula 8 in Table 6.
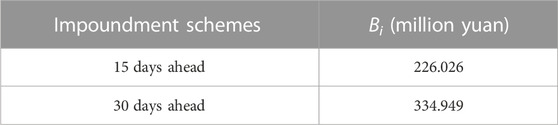
TABLE 6. The increased generation revenues for early impoundment schemes.
Three indexes of the risk assessment for early initial impoundment of the Lianghekou dam are in Table 7. They are expressed in unified dimensionless form in Table 8. By combining the subjective and objective weights with linear calculation, the weight vector for indexes w is obtained as {0.267, 0.201, and 0.532}. Based on the TOPISI multi-attribute decision-making method, the positive and negative ideal solutions and relative closeness of each scheme are in Table 9.
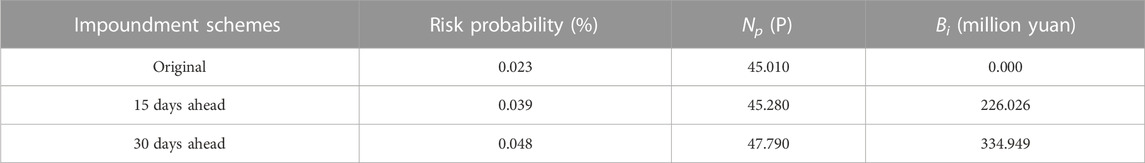
TABLE 7. Three indexes of the risk assessment for early initial impoundment.
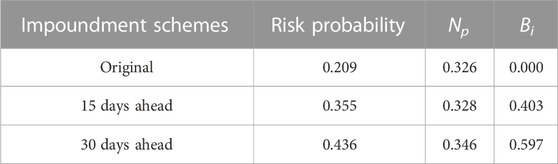
TABLE 8. Three indexes expressed in unified dimensionless form.
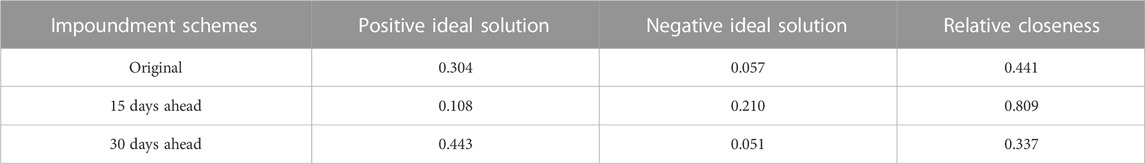
TABLE 9. The positive and negative ideal solutions and relative closeness of each scheme.
The highest value of relative closeness is the most satisfactory scheme in Table 9. Hence, 15 days ahead is the best initial impoundment scheme, and the existing scheme comes next MWR—Ministry of Water Resources, 2017b.
In this research, a late-stage diversion risk assessment for high dams considering early initial impoundment has been applied to the Lianghekou Station, and used to find a reasonable impound time for early generation. In the proposed approach, the Monte Carlo method is employed for risk simulation to obtain the dam overtopping probability for one assessment index. Considering overtopping-induced gradual breaking, the DAMBRK model and empirical formulas of life loss can serve as the inundation consequence estimation, which is selected as the second index. The days to reach 2,785 m in advance are predicted through impoundment process calculations, and used for assessing the increase of generation revenue, and is the third index. The three indexes are introduced in a multi-objective decision model for risk assessment. After comparing the three schemes, the 15 days ahead initial impoundment scheme is the best considering the three indexes. Generally, the major conclusions of this research are highlighted as follows.
(1) The tendency change of the late-stage diversion risk probability along with the impoundment time and corresponding dam elevation are significant. The equivalent return period of each late-stage diversion scheme is higher than the 500-return-year flood period, which means all three schemes meet the engineering design requirement.
(2) The breach outflow for high rockfill dam breaches induced by overtopping failure is extremely large. The economic loss brought about by high dam breaches is not sensitive to the impact of impoundment time. Hence, the economic loss of inundation may not be considered as an assessment index.
(3) The good performance of the 15 days ahead scheme indicates that it is feasible and scientific to take early initial impoundment for the Lianghekou dam.
The original contributions presented in the study are included in the article/Supplementary Material, further inquiries can be directed to the corresponding author.
LL: writing, content conception, data processing, and funding acquisition; JB: software and formal analysis; CH: data resource and subject selection. All authors contributed to the article and approved the submitted version.
This work was supported by the Open Foundation of Hubei Key Laboratory of Construction and Management in Hydropower Engineering (2020KSD12) and the National Natural Science Foundation of China (No.51879147).
The authors would like to thank Hu Zhigen and Liu Quan at Wuhan University for their help with the diversion risk model. We also thank the Faculty of Civil Engineering and Geosciences, Delft University of Technology, which provided us with a high-performance server for parallel computing.
The authors declare that the research was conducted in the absence of any commercial or financial relationships that could be construed as a potential conflict of interest.
All claims expressed in this article are solely those of the authors and do not necessarily represent those of their affiliated organizations, or those of the publisher, the editors and the reviewers. Any product that may be evaluated in this article, or claim that may be made by its manufacturer, is not guaranteed or endorsed by the publisher.
The Supplementary Material for this article can be found online at: https://www.frontiersin.org/articles/10.3389/feart.2023.1232481/full#supplementary-material
Afshar, A., Rasekh, A., and Afshar, M. H. (2009). Risk-based optimization of large flood-diversion systems using genetic algorithms. Optim. Eng. 41 (3), 259–273. doi:10.1080/03052150802433213
Andersson, L. R., Hellström, J., Gunnar, I., Andreasson, P., and Lundström, T. S. (2019). Numerical investigation of a hydropower tunnel: Estimating localised head-loss using the Manning equation. Water 11 (8), 1562. doi:10.3390/w11081562
Ávila, Guillermo (2018). “Risk conditions for possible failure of HidroItuango dam in Colombia,” in Proceedings of 2018 IPL Symposium on Landslides, Kyoto, Japan, December 3, 2018.
Fread, D. L. (1984). Dambrk: The NWS dam-break flood forecasting model. MA, United States: National Weather Service (NWS) Report, NOAA, Silver Spring.
Ge, W., Jiao, Y., Wu, M., Li, Z., Wang, T., Li, W., et al. (2022). Estimating loss of life caused by dam breaches based on the simulation of floods routing and evacuation potential of population at risk. J. Hydrology 612, 128059. doi:10.1016/j.jhydrol.2022.128059
Ge, W., Li, Z. K., Liang, R. Y., Li, W., and Cai, Y. C. (2017). Methodology for establishing risk criteria for dams in developing countries, case study of China. Water Resour. Manag. 31 (13), 4063–4074. doi:10.1007/s11269-017-1728-0
Hong, X. J., Guo, S. L., Zhou, Y. L., and Xiong, L. H. (2015). Uncertainties in assessing hydrological drought using streamflow drought index for the upper Yangtze River basin. Stoch. Environ. Res. Risk Assess. 29 (4), 1235–1247. doi:10.1007/s00477-014-0949-5
Hu, Z. G., Fan, X. E., Liu, Q., and Huang, H. (2006). Design of integrated risk distribution mechanism of construction diversion system. J. Hydraulic Eng. 37 (10), 1270–1277. doi:10.3321/j.issn:0559-9350.2006.10.020
Johnson, P. A. (1996). Uncertainty of hydraulic parameters. J. Hydraulic Eng. 122 (2), 112–114. doi:10.1061/(asce)0733-9429(1996)122:2(112)
Li, Z., Li, W., and Ge, W. (2018). Weight analysis of influencing factors of dam break risk consequences. Nat. Hazards Earth Syst. Sci. 18 (12), 3355–3362. doi:10.5194/nhess-18-3355-2018
Liu, L., Luo, S., Zhao, C. J., Zhou, Y. H., Wang, J., He, J., et al. (2019). Choice of surgical procedure - lobectomy, segmentectomy, or wedge resection - for patients with stage T1-2N0M0 small cell lung cancer: A population-based study. Eng. Lett. 27 (3), 593–600. doi:10.1111/1759-7714.12943
Liu, Q., Hu, Z. G., Qi, Z. J., and Min, R. (2017). Risk feature analysis of river diversion for dam reconstruction on the original site. Adv. Eng. Sci. 49 (5), 35–41. doi:10.15961/j.jsuese.201700079
Luo, Y., Chen, L., Xu, M., and Huang, J. (2014). Breaking mode of cohesive homogeneous earth-rock-fill dam by overtopping flow. Nat. Hazards 74 (2), 527–540. doi:10.1007/s11069-014-1202-8
Marengo, H., Arreguin, F. I., Aldama, A. A., and Morales, V. (2017). Case study: Risk analysis by overtopping of diversion works during dam construction: The La Yesca hydroelectric project, Mexico. Engineering 42 (3), 26–34. doi:10.1016/j.strusafe.2013.01.005
Marengoa, H. H., Arreguin, F. I., Aldama, A. A., and Morales, V. (2013). Case study: Risk analysis by overtopping of diversion works during dam construction: The La Yesca hydroelectric project, Mexico. Struct. Saf. 42, 26–34. doi:10.1016/j.strusafe.2013.01.005
McGrath, H., Stefanakis, E., and Nastev, M. (2015). Sensitivity analysis of flood damage estimates: A case study in fredericton, new brunswick. Int. J. Disaster Risk Reduct. 14, 379–387. doi:10.1016/j.ijdrr.2015.09.003
Moel, H. D., and Aerts, J. C. (2011). Effect of uncertainty in land use, damage models and inundation depth on flood damage estimates. Nat. Hazards 58, 407–425. doi:10.1007/s11069-010-9675-6
MWR—Ministry of Water Resources (2017b). Regulation for hydrologic computation of water resources and hydropower projects; sl278-2002. Beijing, China: The Ministry of Water Resources of the People’s Republic of China.
MWR—Ministry of Water Resources (2017a). Specifications for construction planning of water resources and hydropower projects; sl303-2017. Beijing, China: The Ministry of Water Resources of the People’s Republic of China.
Najafi, M. R., and Nabipour, M. (2012). The effect of step on the hydraulic characteristics of the subcritical free surface flow in conveyance tunnel. Tunn. Undergr. Space Technol. 28 (1), 212–217. doi:10.1016/j.tust.2011.10.013
Song, Z. D., Liu, Q., Hu, Z. G., Li, H. A., and Xiong, J. Q. (2018). Assessment of sediment impact on the risk of river diversion during dam construction: A simulation-based project study on the jing river, China. Water 10 (2), 217. doi:10.3390/w10020217
USBR (1988). Bureau of Reclamation, Downstream hazard classification guidelines. Denver: U.S. Dept. of the Interior, Bureau of Reclamation. ACER Tech. Memorandum Rep. No. 11.
Wu, Y. C., Liou, J. J., Su, Y. F., and Cheng, K. S. (2012). Establishing acceptance regions for L-moments based goodness-of-fit tests by stochastic simulation. Stoch. Environ. Res. Risk Assess. 26 (6), 49–62. doi:10.1016/j.jhydrol.2008.02.023
Wurbs, R. A. (1987). Dam-breach flood wave models. J. Hydraulic Eng. 113 (1), 29–46. doi:10.1061/(asce)0733-9429(1987)113:1(29)
Xiao, Y., Guo, S. L., and Xiong, L. H. (2007). A new random simulation method for constructing synthetic flood hydrographs. J. Sichuan Univ. Eng. Sci. Ed. 39 (2), 55–60. doi:10.3969/j.issn.1009-3087.2007.02.010
Zhang, C., and Hu, Z. G. (2019). Risk model of flow diversion in the initial through middle stages for high arch dam construction and its application. Adv. Water Sci 30 (1), 102–111. doi:10.14042/j.cnki.32.1309.2019.01.011
Keywords: late stage diversion, diversion risk assessment, initial impoundment, MC method, Lianghekou Station
Citation: Liu L, Bricker JD and Hu C (2023) Late-stage diversion risk assessment for high dams considering early initial impoundment: a case study of Lianghekou Station, China. Front. Earth Sci. 11:1232481. doi: 10.3389/feart.2023.1232481
Received: 31 May 2023; Accepted: 05 July 2023;
Published: 24 August 2023.
Edited by:
Zongkun Li, Zhengzhou University, ChinaReviewed by:
Shaowei Wang, Changzhou University, ChinaCopyright © 2023 Liu, Bricker and Hu. This is an open-access article distributed under the terms of the Creative Commons Attribution License (CC BY). The use, distribution or reproduction in other forums is permitted, provided the original author(s) and the copyright owner(s) are credited and that the original publication in this journal is cited, in accordance with accepted academic practice. No use, distribution or reproduction is permitted which does not comply with these terms.
*Correspondence: Jeremy D. Bricker, amVyZW15ZGJAdW1pY2guZWR1
Disclaimer: All claims expressed in this article are solely those of the authors and do not necessarily represent those of their affiliated organizations, or those of the publisher, the editors and the reviewers. Any product that may be evaluated in this article or claim that may be made by its manufacturer is not guaranteed or endorsed by the publisher.
Research integrity at Frontiers
Learn more about the work of our research integrity team to safeguard the quality of each article we publish.