 Miho Asada1*
 Mikiya Yamashita1
 Rina Fukuchi2
 Toshiyuki Yokota1
 Tomohiro Toki3,4
 Akira Ijiri5,6
 Kiichiro Kawamura7
- 1Geological Survey of Japan, National Institute of Advanced Industrial Science and Technology (AIST), Ibaraki, Japan
- 2Graduate School of Education, Naruto University of Education, Tokushima, Japan
- 3Department of Chemistry, Biology and Marine Science, Faculty of Science, University of the Ryukyus, Okinawa, Japan
- 4Research Institute for Humanity and Nature, Kyoto, Japan
- 5Graduate School of Maritime Sciences, Kobe University, Kobe, Japan
- 6Kochi Institute for Core Sample Research, Institute for Extra-cutting-edge Science and Technology Avant-garde Research (X-Star), Japan Agency for Marine-Earth Science and Technology (JAMSTEC), Kochi, Japan
- 7Graduate School of Science and Technology for Innovation, Yamaguchi University, Yamaguchi, Japan
We identified 27 new mud volcanoes, including potential ones, in a part of the Hyuga-nada area, southwest offshore Japan, at the northern end of the Ryukyu Trench, based on subseafloor geological structures using geophysical investigations. These mud volcanoes exhibited high density and breadth and were likely connected to other mud volcano fields in the south. Acoustic investigations indicated subseafloor structures. Multiple acoustically transparent bodies were interpreted as a region containing gas. They were likely to appear along faults and below the bottom of valleys and sometimes reached the seafloor, expressing mud volcanoes onto the seafloor. They also indicated the wide distribution of subseafloor free-gas throughout the area. These acoustic investigations suggested that a swarm of mud volcanoes exists over the Hyuga-nada area, heterogeneously distributed along a series of plate convergent margins, the Nankai Trough, and the northern part of the Ryukyu Trench.
1 Introduction
Mud volcanoes are a surface expression of moving sediment and fluid from the Earth’s depths to the surface. Mud volcanoes can only be certified when mud diapirs reach the surface and change the topography (Milkov, 2000; Dimitrov, 2002; Kopf, 2002). Mud volcanoes have been used as subsurface oil and natural gas reservoir indicators because they were initially observed in oilfields (Bates and Jackson, 1987). Despite the name “volcano” being reminiscent of a hot and mountain-like structure, the definition of the mud volcano does not include high temperature any specific landform because they are formed by sediment and the shape is determined by the viscosity of the extrudes which varies with the water content (Shih, 1967; Brown, 1990; Hamada et al., 2009). Mud volcanoes have been reported worldwide from sediment basins, along convergent margins, delta systems of large rivers with high sedimentation rates, inland seas, lakes, and geothermal fields (Milkov, 2000; Dimitrov, 2002; Kopf, 2002; 2016; Mazzini and Etiope, 2017). Thus, mud volcanoes are considered to be constructed under a compressional stress field. To make mud and fluid move upward from depths to the surface, gravitational instability and/or buoyancy sources such as heat and gas are required as driving forces (Milkov, 2000; Dimitrov, 2002; Kopf, 2002; 2016; Mazzini and Etiope, 2017). In particular, gas is necessary for buoyancy during the formation of mud diapirs that reach the Earth’s surface (Brown, 1990). Over 98% of land mud volcanoes discharge methane gas (Milkov, 2005). Deformation and decreasing strength of rocks under the compressional stress field can be a driving or triggering force for mud volcanism (Soto et al., 2021a; b). Seismic activities that occur nearby can also trigger mud volcanisms (Manga et al., 2009; Wang and Manga, 2021).
Because mud volcanoes transport mud and fluids from the depths to the surface, heat and elements discharged from mud volcanoes sometimes harm living organisms (as observed for the Lusi mud volcano, Sidoarjo, Indonesia) and may result in pollution. Mud volcanoes can sometimes trigger tsunamis if located offshore and have explosive characteristics, resulting in large slump-generating waves. Thus, mud volcanoes are considered a potential submarine geohazard, and this is a reason why attention should be paid to them (URL1). Moreover, mud volcanoes can discharge fluid and living organisms from the subseafloor (e.g., Hoshino et al., 2017); they can affect the submarine environment and be a stepstone for the propagation and distribution of chemosynthetic ecosystems. These are the reasons why we want to determine an accurate distribution of offshore mud volcanoes.
Japan, located along a convergent plate margin, has large and a few small mud volcano fields in offshore areas and on land, respectively. Previous studies of offshore mud volcanoes in Japan have mainly focused on the Kumano Basin, a forearc basin in the Nankai Trough (Figure 1). Within the Kumano Basin, a swarm of 14 mud volcanoes, comprising a large mud volcano field, has been reported (Kuramoto et al., 2001; Pape et al., 2014; Asada et al., 2021) (Figure 2). Geochemical (Tsunogai et al., 2012; Toki et al., 2013; Pape et al., 2014; Nishio et al., 2015; Menapace et al., 2017; Ijiri et al., 2018a; b; Lalk et al., 2022), geophysical (Martin et al., 2010; Strasser et al., 2011; Tsuji et al., 2014; Moore et al., 2015), and other investigations have been conducted in the area. Bottom simulating reflectors (BSRs), seismic reflections nearly parallel to the seafloor, are significant indicators of subseafloor free-gas distribution and have been reported through the Kumano Basin.
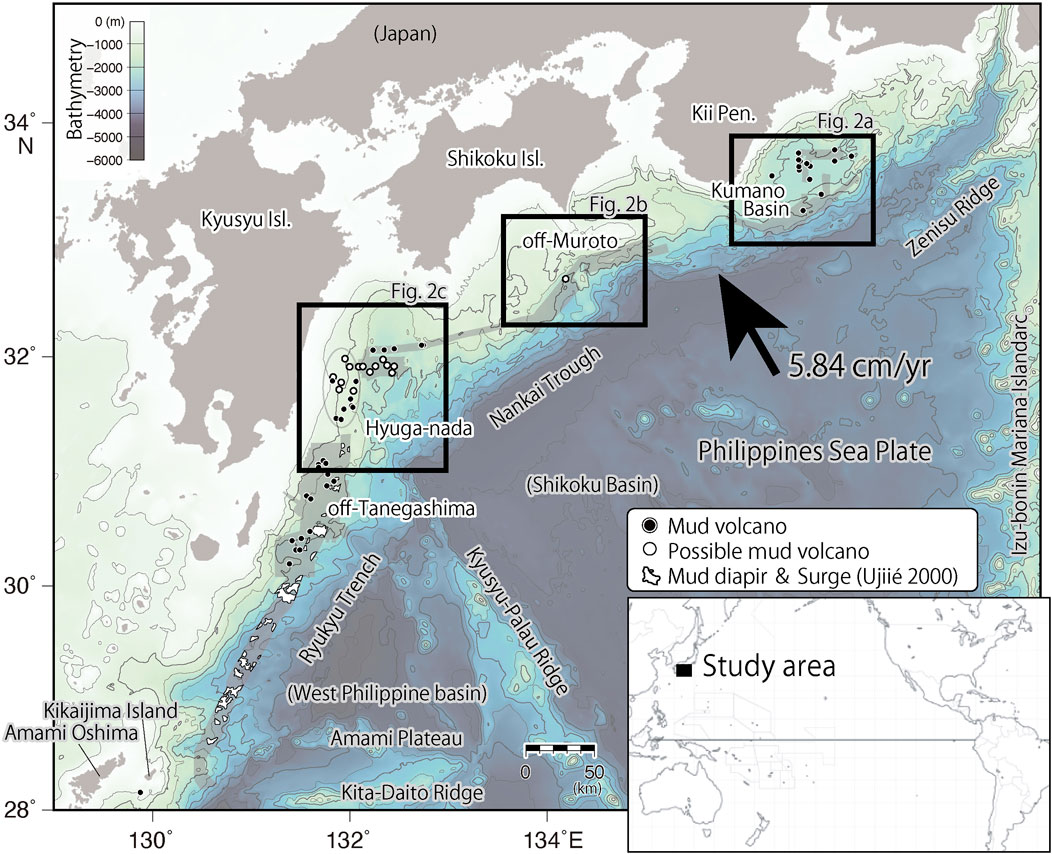
FIGURE 1. Bathymetry map of the study area. Circles: mud volcanoes (white) and potential mud volcanoes (black) in the Kumano Basin (Kopf et al., 2013; Pape et al., 2014; Asada et al., 2021), off-Muroto (this study), Hyuga-nada (this study), mud volcanoes in off-Tanegashima (Inagaki et al., 2018). Polygon: mud diapir and surge off Tanegashima to off-Amami Oshima (Ujiié, 2000), and mud volcano off-Kikaijima (Sato and Itaki, 2015); black arrow: direction of the Pacific Plate convergence relative to the Eurasian Plate (DeMets et al., 2010). The isobath contour interval is 100 m. The black boxes on the map indicate the location of Figures 2A–C.
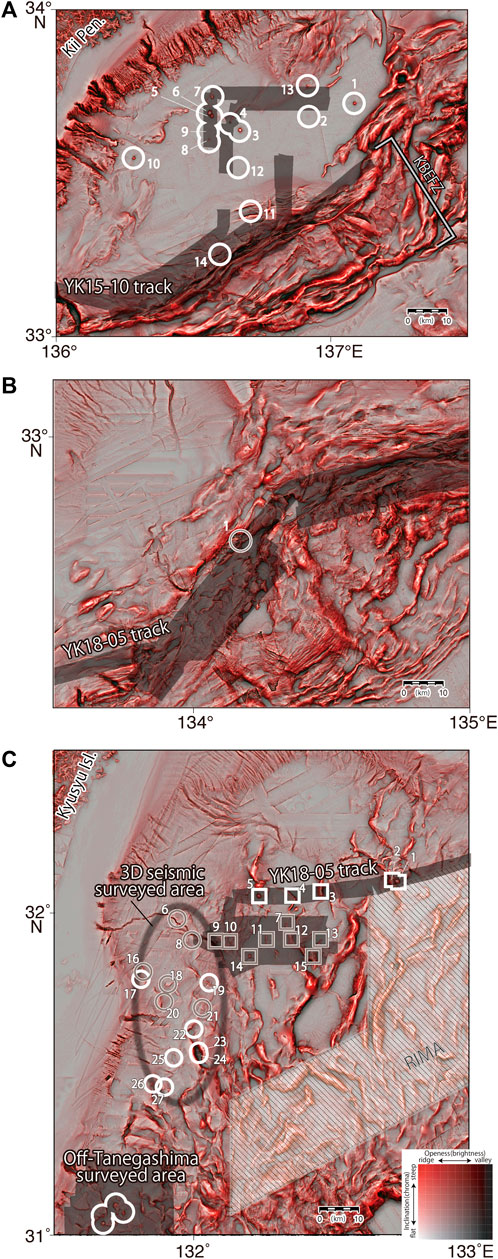
FIGURE 2. Location of mud volcanoes on Red Relief Image Maps. Gray-colored narrow belts indicate areas in which acoustic mapping has been performed during two cruises (YK15-10 and YK18-05). (A) Kumano Basin. Circles and numbers indicate known mud volcanoes (Kopf et al., 2013; Pape et al., 2014, 1a). KBEFZ: Kumano Basin Edge Fault Zone (Martin et al., 2010). (B) off-Muroto. Circle: a potential mud volcano. (C) Hyuga-nada. The 13 open boxes indicate the location of the newly identified mud volcanoes including potential ones, confirmed using an SBP, and the 14 open circles indicate mud volcanoes identified using seismic profiles, respectively. White symbol: mud volcano with distinguished high backscatter intensity (square) or with subseafloor feature (circle); gray symbols: potential mud volcano with unclear features. Number: a newly certified number in this study. RIMA: restricted area because it is used by the U.S. Navy for training purposes.
Our research target area, the Hyuga-nada (Figure 1), is another offshore and scientifically underrepresented location positioned at the intersection of two trenches, the Nankai Trough and the Ryukyu Trench, in the eastern offshore region of Kyushu Island. Mud volcanoes in the Hyuga-nada were first identified around the 2000s during the installation of submarine cables by a telecommunication company; however, to date, academic investigations have yet to be performed.
We report 27 newly identified mud volcanoes in the Hyuga-nada area, including mud volcano candidates. We defined new mud volcanoes based on whether their conduit reached the seafloor on subseafloor profiles obtained from three-dimensional (3D) seismic surveys or sub-bottom profilers (SBP). Moreover, bathymetric expressions and backscatter intensity on the seafloor in the surrounding area where the conduit reached the seafloor sometimes helped recognize new mud volcanoes. Furthermore, we propose that the huge mud volcano field (a swarm of multiple mud volcanoes) encompassing the Hyuga-nada and areas further south, which are off Tanegashima, and the region toward Kikai-jima Island (Ujiié, 2000; Nakayama et al., 2010; Inagaki et al., 2018) are established along the Ryukyu Trench (Figure 1). The series of mud volcano fields may be the largest mud volcano field in offshore areas of Japan.
2 Geological setting
2.1 Mud volcano
Mud volcano fields can be found worldwide in Azerbaijan (both on land and offshore oilfields) (Planke et al., 2003; Yusifov and Rabinowitz, 2004), Cadiz Bay (offshore sedimentary field; e.g., Somoza et al., 2003; Van Rensbergen et al., 2005), southwest Taiwan (both on land and offshore sedimentary fields; Shih, 1967; Chuang et al., 2010; Sun et al., 2010; Doo et al., 2015), northeast New Zealand (both on land and offshore sedimentary fields; Ridd, 1970; Leighton et al., 2022), Barbados (offshore sedimentary field; Brown and Westbrook, 1987; Lance et al., 1998; Summer and Westbrook, 2001), and in the Kumano Basin in Japan (offshore sedimentary fields) for instance. The mud volcano is sometimes used in geothermal fields (e.g., Yellowstone in the US, LUSI in Indonesia, and Rotorua in New Zealand). However, this phenomenon is rather confusing because mud volcanoes are not formed from magmatic rocks like many other volcanoes in the region but from buoyant sediments owing to gases and heat. Mud volcanoes frequently appear along existing geological structures such as faults and fissures (Bonini, 2012; Soto et al., 2021a; Soto et al., 2021b) and anticline (Shih, 1967; Hamada et al., 2009). Nevertheless, not all faults, fissures, and ridges accompany mud volcanoes. Knowledge of the characteristics of seismic signals (Soto et al., 2021a; Soto et al., 2021b; Hudec and Soto, 2021), which visualize conduits below the mud volcanoes, is essential to understanding the depths; however, knowledge on the origin of conduits remains limited. Several studies have discussed planar distribution and original depths of conduits by comparing sediments with geological data (Miyakawa et al., 2013). The planar distribution of mud volcanoes can be easily investigated on land, but it is difficult offshore because they sometimes display tiny geophysical features. Geophysical investigations have indicated the presence of conduits just below mud volcanoes, which can be evidence of sediment movement from the depths toward and reaching the surface (Van Rensbergen et al., 2005; Deville et al., 2006; Feyzullayev, 2012; Asada et al., 2021; Soto et al., 2021a; Soto et al., 2021b; Hudec and Soto, 2021; Kirkham and Cartwright, 2022). We sometimes need to use several methods to verify mud volcanoes.
2.2 Geology along southwest Japan from the Kumano Basin to Hyuga-nada
The Philippine Sea Plate subducts beneath southwest Japan, along the eastern edge of the Eurasian Plate at the Nankai Trough and the Ryukyu Trench (Figure 1). The Nankai Trough is notorious for large earthquakes triggered by the subducting Philippine Sea Plate, which subducts at a rate of approximately 5.84 cm/yr (DeMets et al., 2010). The Kumano forearc basin is located along the eastern part of the Nankai Trough (Figure 2A) and is a sedimentary basin with a thickness of > ∼1 km overlying the accretionary complex (Moore et al., 2015; Ramirez et al., 2015). The bathymetry within the basin undergoes a minimal change across tens of kilometers across the area. The basin’s south-eastern (oceanward) edge, known as the Kumano Basin Edge Fault Zone, is characterized by its steep geometry (Martin et al., 2010). The distribution and geochemical characteristics of mud volcanoes in the Kumano Basin have been reported in previous studies based on results from the scientific drilling vessel Chikyu (Japan Agency for Marine-Earth Science and Technology) (Nishio et al., 2015; Ijiri et al., 2018a; b).
The fluid discharged from several mud volcanoes in the Kumano Basin is mostly methane gas of biogenic and thermogenic origins. The depth from which this methane gas originated is approximately 1 km below the seafloor (near the bottom of the sedimentary basin of the Kumano Basin) for biogenic gas, and several kilometers below the seafloor (within the accretionary prism) for thermogenic gas, respectively (Pape et al., 2014; Ijiri et al., 2018b; Wiersberg et al., 2018). Additionally, fluid originating from the depth of the mantle wedge, possibly deeper than approximately 30 km below the seafloor, is included within the discharged fluid from mud volcanoes in the Kumano Basin (Nishio et al., 2015). Sediments discharged from mud volcanoes are considered to have originated at depths of a few kilometers below the seafloor (near the basement rocks of the sedimentary basin; Ijiri et al., 2018a), suggesting that the depths from which fluids and sediment are sourced are not necessarily the same.
The ancient accretionary complex, named the Shimanto Belt, formed between the Cretaceous and Paleogene periods is exposed onshore of southwestern Japan parallel to the trench axis in the Nankai Trough (e.g., Taira et al., 1992; Moore and Saffer, 2001; Kawabata et al., 2007). Industrial operation of gas fields is performed along the eastern coast of Kyusyu Island, which is adjacent to the western onshore area of the Hyuga-nada, based on the accretionary complex. Gas products from onshore gas fields indicate that the gas has a mixed origin and is both biogenic and thermogenic and is released upon mining from 150 to 1700 m below the surface (Kato et al., 2011). The original stratigraphy and reservoir of the onshore gas fields consist of late Miocene sediments (Kato et al., 2011) belonging to the accretionary complex and continue to dip steeply oceanward (Okamura, 2008). The narrow shelf along Kyusyu Island is tens of kilometers wide. There is a forearc basin named the Miyazaki-oki Basin with a rough bathymetry, which is unlike that of the Kumano Basin. Deformation structures, such as faults and folds, can be recognized on the offshore geological map and seismic profiles (Okamura, 2008).
3 Data acquisition
3.1 3D seismic reflection data
Subseafloor geological structures were obtained from 3D seismic reflection surveys conducted between 2009 and 2013 by domestic oil and natural gas explorations in the eastern offshore area of Kyushu Island. Since disclosing specifics of the exploration is forbidden, we cannot provide more details; however, seismic profiles showed high-quality subseafloor structures to depths of ∼3500∼4000 ms in two-way travel time below the seafloor, which sufficiently supports the purpose of this research. The dominant frequency of the seismic waves at the seafloor was ∼35 Hz, corresponding to a wavelength of −40 m when the sound wave velocity was 1,500 m/s (Figure 3). The frequency within 10 dB from the peak frequency was in the range between ∼ 15 and 60 Hz, with a corresponding vertical resolution of ∼ 4–25 m (
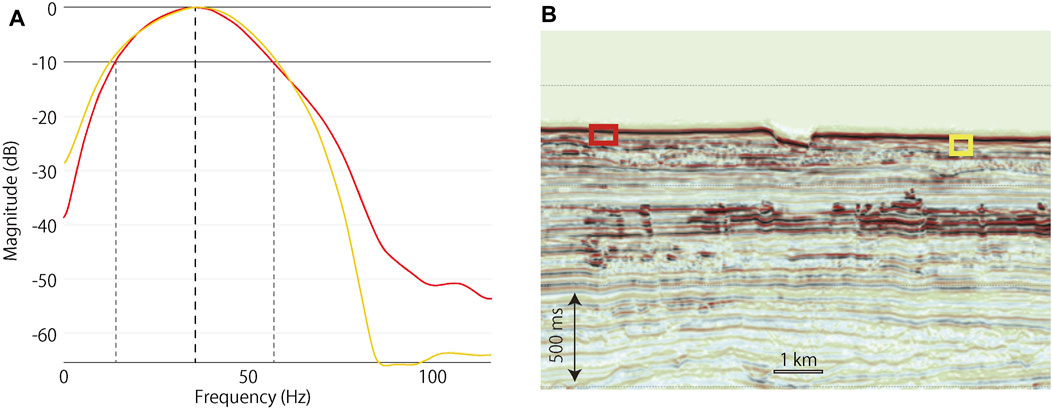
FIGURE 3. Results from the frequency analysis. (A) Frequency spectrum distribution of reflected waves on the seafloor. Red and yellow lines show the results of the frequency analysis performed at the location of the boxes in the same color in (B). (B) Seismic profile. Frequency spectrum analysis was performed at the position of each box, indicating a simple and flat seafloor. The color of the box corresponds to the colored line in (A).
3.2 Acoustic mapping through the YK15-10 and YK18-05 cruises
An acoustic investigation using a shipboard SBP for shallow subseafloor structures (EdgeTech, 3300-HM, 2–16 kHz, for shallow subseafloor structures) and a shipboard multi-beam echo sounder for mapping (Kongsberg, EM122, 12 kHz, for bathymetry and backscatter intensity) was conducted during research cruises in 2015 (YK15-10, URL2) and 2018 (YK18-05, URL3) along southwest offshore Japan, over the areas connecting the Kumano Basin and Hyuga-nada areas (Figure 1). Bathymetry data and backscatter intensity were obtained along the same survey lines as the sub-bottom profiles. The sub-bottom profiles displayed shallow subseafloor structures down to ∼ 60 ms of two-way travel time below the seafloor. The SBP transmits a single conical acoustic signal per ping, thus it only detects the structure just below the survey lines (Figure 4).
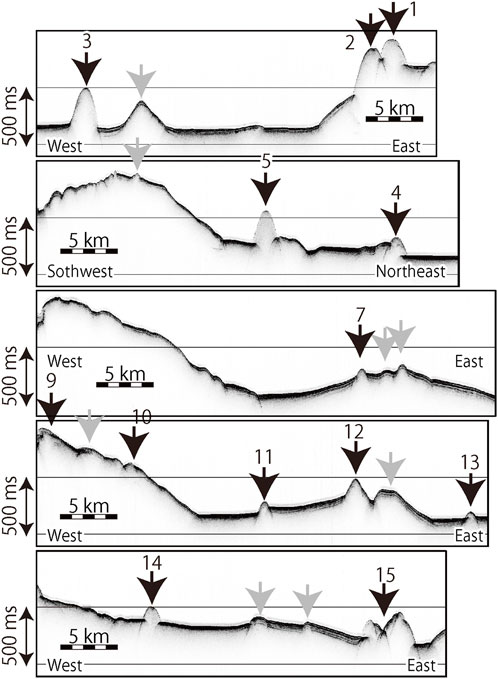
FIGURE 4. Subseafloor structures obtained by the SBP, in the Hyuga-nada area, for HyMV1–5, 7, and 9–15. Darker colors indicate a higher amplitude. Black arrow: mud volcano; gray arrow: anticline. Vertical exaggeration is ∼2.0. The horizontal lines (on both left and right panels) are spaced 500 ms in two-way time.
3.3 Bathymetric visualization
The compiled bathymetry data (Yamashita et al., 2017) were used to observe surface expressions in the area in which the acoustically transparent body touched the seafloor in the Hyuga-nada or the locations of known mud volcanoes in the Kumano Basin reported by previous studies (Kuramoto et al., 2001; Pape et al., 2014; Asada et al., 2021). Figures 2, 5 display bathymetry maps using a 3D presentation technique called the Red Relief Image Map (RRIM) (Chiba et al., 2007; 2008). RRIM is an elaborate illumination-independent 3D visualization method that uses high-density and high-resolution digital elevation model (DEM) data to extract the slope, concavities, and convexities from a given zenith (Chiba et al., 2007; 2008). In RRIM, a change in the slope angle is represented by a red-to-white color variation and concavities and convexities by grayscales, which enhances the characteristics of bathymetric features such as small-scale deformations. The source of the bathymetric data for our target area was compiled from acoustic mapping data provided by Yamashita et al. (2017), which does not include backscatter intensity.
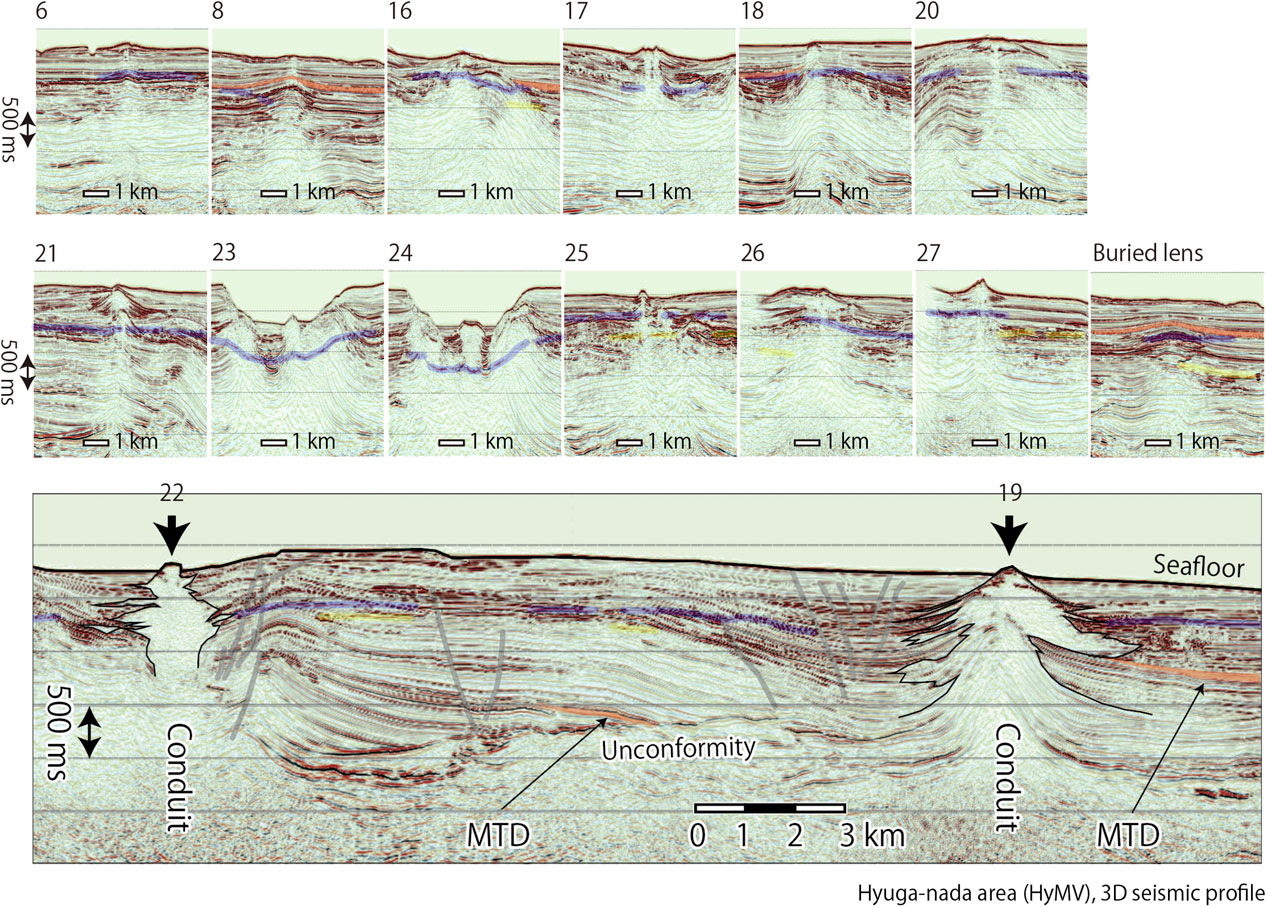
FIGURE 5. Subseafloor structures obtained by the seismic reflection survey in the Hyuga-nada area, for HyMV6, 8, and 16–27. The horizontal lines (on both left and right panels) are spaced 500 ms in two-way time. Bold lines indicate BSRs (blue: shallowest BSR, yellow: second BSR). Orange area indicates layer or block with internal chaotic facies. Vertical exaggeration is ∼4.0.
4 Interpretations of acoustic investigations
4.1 Methods for recognizing mud volcanoes in the Hyuga-nada
We identified conduits that appeared transparent with few reflected waves (“acoustically transparent body”) in the sub-bottom and 3D seismic profiles to identify subseafloor moving sediment. The acoustically transparent body is mostly a vertical structure which sometimes cuts through the stratigraphy from the depths toward the surface. If there are no sediment layers on top of the acoustically transparent body, we inferred that the location of the point of the acoustically transparent body reaching the seafloor is a point of extrusion, and the bathymetric feature at the point is a surface expression of it, a mud volcano. At the same time, if the top of the acoustically transparent body is covered by sediment layers, it should not be a mud volcano and might be a mud diapir and/or a part of a compressional ridge. The identification of “Christmas-tree structures” (a typical subseafloor structure below mud volcanoes, which refers to the penetration of a lateral part of the acoustically transparent body into the surrounding stratigraphy) contributed to the identification of the subseafloor structure forming the mud volcano.
The bathymetric feature with high backscatter intensity suggests fluid discharge from the seafloor. The higher backscatter intensity on the seafloor indicates harder materials such as outcrops and/or animals with hard shells. This is because hard materials generate larger jumps in acoustic impedance than the surrounding sediment (Asada and Yokota, 2021). Chemosynthetic shelled animal communities often inhabit fluids discharged from the seafloor. Methane-derived authigenic carbonates (MDACs; Hovland et al., 1987; Buckman et al., 2020; Aloisi et al., 2002) are also generated in such areas due to the reaction between seawater and methane gas, and they contribute to generating higher backscatter intensity of acoustic signals (Ceramicola et al., 2018). Consequently, the detection of high backscatter intensities has been used historically for the exploration of mud volcanoes (e.g., Van Rensbergen et al., 2005; Blondel, 2009; Ceramicola et al., 2018; Asada et al., 2021). Circular patterns of high backscatter intensities support the identification of locations in which fluid is discharged from a point source. Bathymetry is often useful in identifying mud volcanoes, however, due to the resolution limits of geophysical surveys, its accuracy is not always sufficient to indicate bathymetric changes in the seafloor.
4.2 Mud volcanoes in the Kumano Basin
Based on previous studies, we have summarized the bathymetric characteristics of mud volcanoes in the Kumano Basin (Kopf et al., 2013; Pape et al., 2014; Asada et al., 2021; Table 1). A total of 14 mud volcanoes have been reported in the Kumano Basin, and they have been numbered based on the order of their discovery (Figure 2A). They are distributed on the relatively flat basin floor and mostly classified as the “pancake type” with a mean surface gentle slope angle of <10° (Kioka and Ashi, 2015).
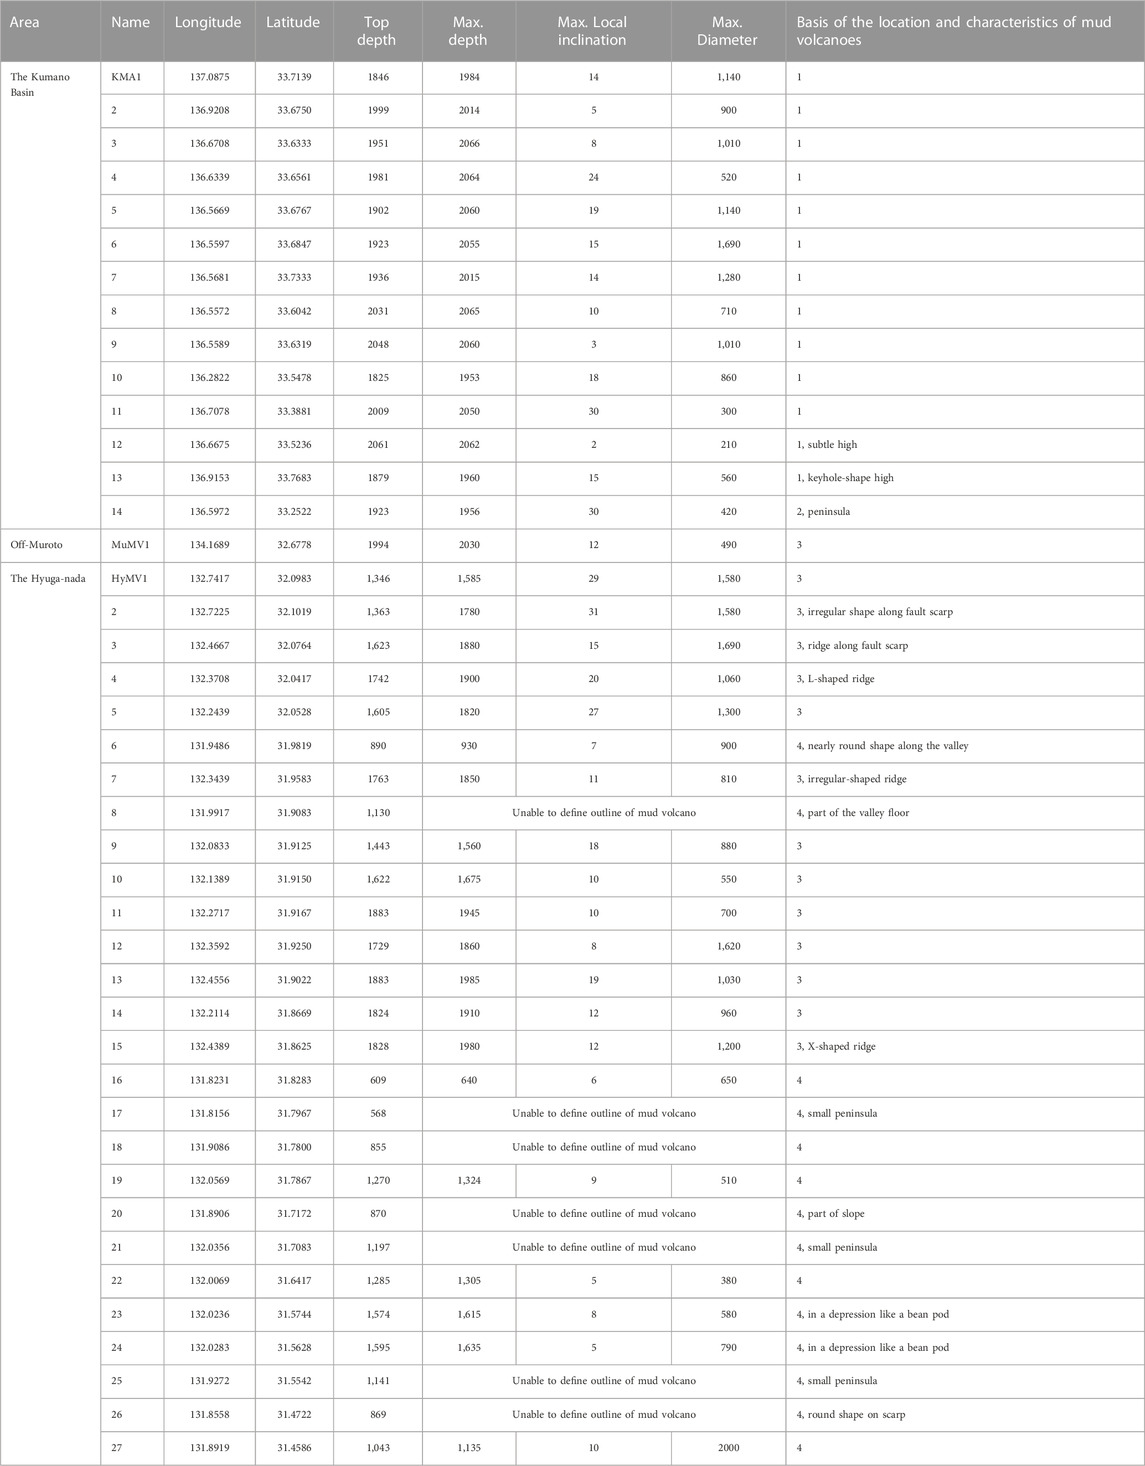
TABLE 1. Center location, depth, and remarks regarding the bathymetric features of mud volcanoes, including potential ones, in the Kumano Basin, off-Muroto, and Hyuga-nada areas based on the bathymetry map drawn by the RRIM shown in Figure 6. If no bathymetric feature was found in the bathymetry map, only the location of the point at which the acoustic transparent body reaches the seafloor (determined by the profiles shown in Figures 4, 5) is shown in the table. The basis of the location is shown in the remarks, 1: Pape et al. (2014); 2: Asada et al. (2021); 3: this study, positions from the sub-bottom profile; and 4: this study, positions from the 3D reflection seismic profile.
Depths (Pape et al., 2014) at the top of a small hill. The small and remarkably steep KMV14 shows a local inclination exceeding 30°, indicating high ejecta viscosity. Asada et al. (2021) suggested that KMV14 may have fault gouges because it is located in the Kumano Basin Edge Fault Zone (Martin et al., 2010).
A remarkably high backscatter intensity was observed near the mud volcano KMV14, where gas discharge had been reported (Menapace et al., 2017; Asada et al., 2021; Asada and Yokota, 2021). The high backscatter intensity of KMV5, a known active mud volcano discharging fluids (Nishio et al., 2015; Ijiri et al., 2018a; b), displays a circular pattern (Figure 5, KMV5 and 6), indicating an area influenced by fluid discharged from a point source.
4.3 Mud volcanoes off Muroto, the area connecting the Kumano Basin and Hyuga-nada
Acoustic mapping with sub-bottom profiles connecting the Kumano Basin and Hyuga-nada areas was obtained during the YK18-05 cruise (Figure 1). The survey line was designed along a constant depth of ∼2,000 m, roughly the same depth as that of the mud volcanoes in the Kumano Basin, to maintain a stable acoustic signal output power level. This survey enables us to compare the observed backscatter intensities between different areas. Only one potential mud volcano was identified along the connecting area, marked by a notably high backscatter intensity and an isolated hill slightly off-nadir of SBP (Figure 2B). The high backscatter intensity shows a characteristic three-way branching resembling the tip of a chicken foot (Figure 5, MuMV1). The isolated hill is located at the heel of the chicken foot, and the high backscatter intensity distributes flow downward to increase water depth. The hill is located along the fault zone in the off-Muroto area. Because MuMV1 was slightly off-nadir, the shallow subseafloor structures could not be obtained, so we designated the isolated hill as a “potential” mud volcano.
4.4 Mud volcanoes in the Hyuga-nada
We identified 27 mud volcanoes including potential ones in the Hyuga-nada, based on a subseafloor acoustically transparent body reaching the seafloor (Figures 4, 5, HyMV1–27). HyMV1−5, 17, 19, and 22–27 have distinctive subsurface features; thus, we propose that they are mud volcanoes (Figure 2C, white open symbols). At the same time, subseafloor features below HyMV6−16, 18, 20, and 21 were weak and required more verification using other methods such as the dating of sampling materials; nevertheless, they are new potential mud volcanoes (Figure 2C, gray open symbols). These mud volcanoes show a dense distribution within the surveyed area. Several other bathymetric features were detected outside the seismically studied area and off the survey line of SBP, suggesting the presence of other mud volcanoes in the area. Most mud volcanoes in the Hyuga-nada were identified on slopes; therefore, it is difficult to define their exact diameter and inclination.
Sub-bottom profiles display acoustically transparent bodies cutting through the sediment layers at shallow depths. In this study, if the stratigraphy was not cut by acoustically transparent bodies or a shallow sedimentary layer was found on top of these bodies, thus not reaching the seafloor at present, they were not considered mud volcanoes (gray arrows in Figure 4). A circular to semi-circular high backscatter intensity pattern was recognized around HyMV5, 9, and 15 (Figure 5). Partially high backscatter intensities reflect a patchy distribution of relatively harder materials on the seafloor and/or shallow subseafloor, suggesting the existence of hard rocks and/or shelled animals due to fluid discharge from the seafloor. Although the bathymetric expression was distinct at HyMV1, 10, and 14, the backscatter intensity is relatively low. This suggests that HyMV1, 10, and 14 are mostly covered by sediment similar to that covering the surrounding seafloor, which indicates ceased fluid discharge. HyMV2–4, 7, and 11–13 stand on acoustically transparent bodies; however, their bathymetric expression and the backscatter intensity were not distinct, thus they were categorized as potential mud volcanoes.
Seismic profiles provide the fine structure of the deeper subseafloor (Figure 5). The shallower part of the profile shows a horizontally traceable stratigraphy. The attenuation of seismic waves weakens the intensity of reflection waves in areas deeper than 1,000 ms below the seafloor. The lateral continuity of the stratigraphy is more prominent landward, and deformation increases oceanward. A layer and/or a block with chaotic facies inside bounded by a well-continuous upper and lower stratigraphy are interpreted as a result of mass transport which occurred during the geological timescales. The blocks are especially interpreted as a part of mass transport deposits (MTDs), whose internal geometry and configuration can be used to reconstruct the kinematics of the sediment (Moore et al., 2015; Lackey et al., 2018; Figure 5). Some MTDs had a duplex structure within their internal facies, which is interpreted as deformation due to the horizontal shortening of stratigraphy. Unlike MTDs, the lenticular bodies show mostly transparent interiors and lack duplex structures inside (Figure 5, HyMV20 and buried lens). Lenses are occasionally situated at the upper end of the acoustically transparent body and reach the seafloor. Acoustically transparent bodies were likely to appear along a ridge of gentle anticlines (HyMV8, 16, 18–21, 25, 26), places at which the stratigraphy changes depth, likely due to being faulted (HyMV17, 22, 27), and below the bottom of a valley (HyMV23, 24). Sometimes the acoustically transparent body included a weak stratigraphy dragged upward.
BSRs were widely distributed throughout the area (Figure 5). They occurred sub-parallel to the seafloor, with a high-amplitude and reverse polarity of seismic waves from the seafloor (Figure 5, blue line). BSRs became continuous and clearer oceanward. In places, two and three BSRs were identified (Figure 5, yellow line). In this case, the shallowest BSR shows relatively good lateral continuity, and the second and third ones tend to be discontinuous and weak. Most mud volcanoes were accompanied by BSRs in and around the underlying acoustically transparent bodies.
Acoustically transparent bodies reaching the seafloor could be especially clear below HyMV17, 19, and 22–27, which had bathymetric expressions on the seafloor. Seismic profiles showed a Christmas-tree structure at the side of the acoustically transparent bodies, especially below HyMV19–22 (Figure 5). The acoustically transparent bodies below HyMV6, 8, 16, 18, and 25–27 were relatively weak and narrow. The acoustically transparent bodies become less distinct at greater depths, and their bottom could not be identified. The magnified bathymetry map around the location at which subseafloor structures reached the seafloor (Figure 6) shows various bathymetric expressions such as hills or ridges with various backscatter intensities. Some of them (HyMV8, for example) lacked distinct bathymetric features.
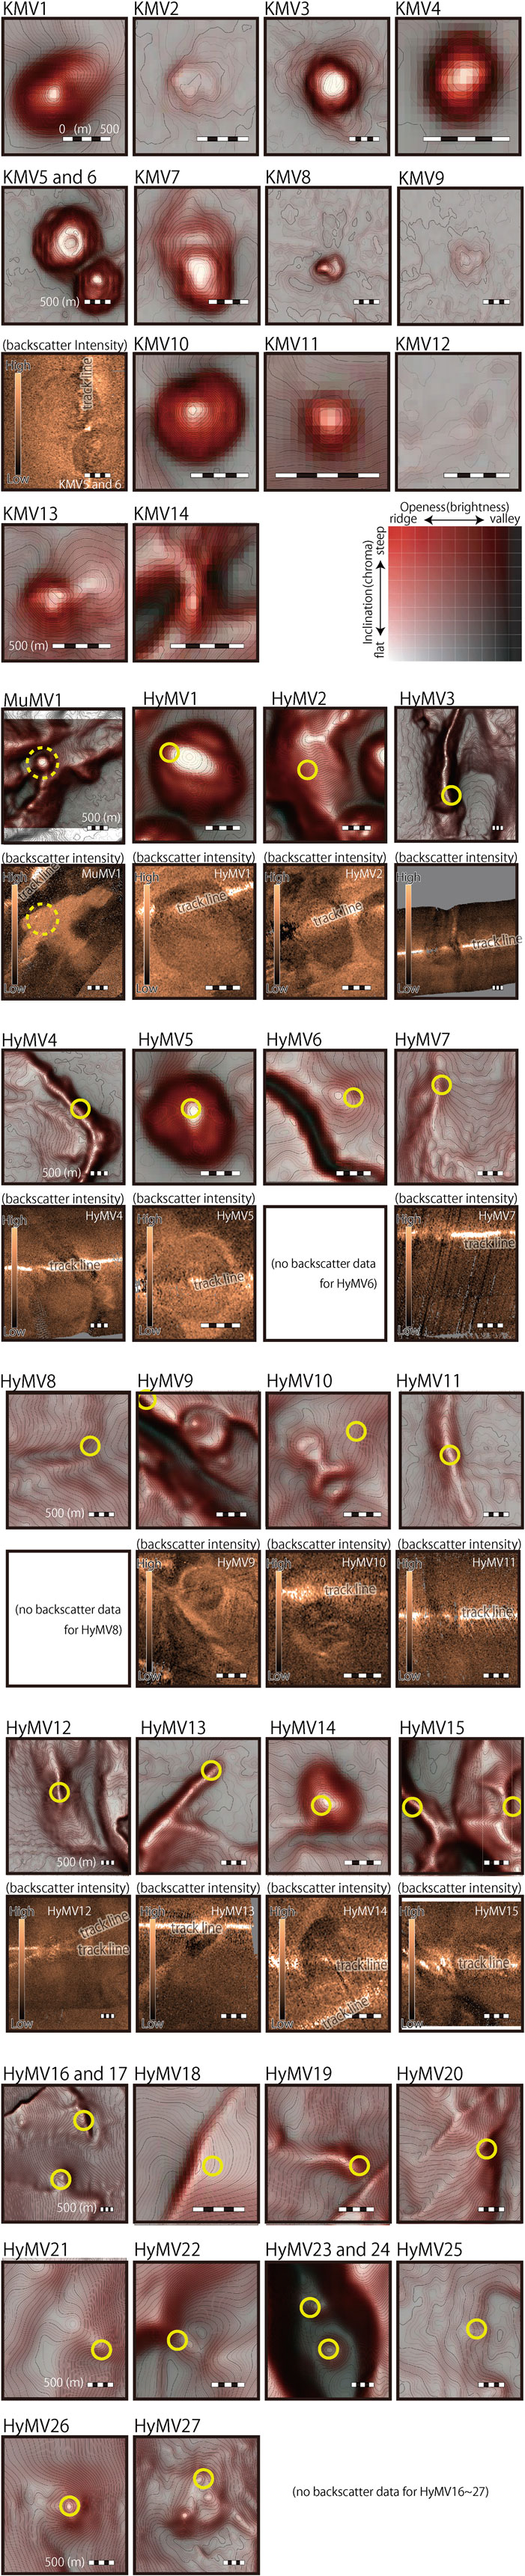
FIGURE 6. Closeup bathymetric maps of mud volcanoes and their candidates, shown as isobath contour lines (1-m depth intervals) on Red Relief Image Maps (Yamashita et al., 2017). KMV1–KMV14: mud volcano in the Kumano Basin. The backscatter intensity obtained by the YK15-10 cruise (URL2) is shown below KMV5 and 6. MuMV1: a potential mud volcano in the off-Muroto area (yellow dotted circle). The backscatter intensity obtained by the YK18-05 cruise is shown below MuMV1. HyMV1–27: mud volcano in the Hyuga-nada area. The backscatter intensity obtained by the YK18-05 cruise (URL3) is shown below HyMV1–5, 7, and 9–15. Circles on HyMV1–27 show the location of the mud volcano, which are indicated by points where acoustic transparent bodies reach the seafloor (Figure 4). The center location and morphological features in Table 1 are based on this map of bathymetrically recognized features. Continuing from Figure 6, HyMV1–8, HyMV6, and 8 are in the area of seismic observation; thus, there is no backscatter strength image. Continuing from Figure 5, HyMV9–15. Continuing from Figure 5, HyMV16–27 are in the area of seismic observation; thus, there is no backscatter strength image.
5 Discussion
5.1 A large mud volcano field in the Hyuga-nada
The Hyuga-nada is located ∼100 km eastward from the onshore industrial gas field on Kyusyu Island. As the source stratigraphy of the gas field is inclined oceanward (Okamura, 2008), the gas field is expected to extend to the Hyuga-nada. The 3D reflection seismic profiles showed that BSRs were widely distributed over the surveyed area and became more pronounced oceanward; thus, gas-bearing fluids are also expected to spread over the area of interest. The mud volcanoes identified in the Hyuga-nada displayed a variety of bathymetric features: mounds and ridges with various sizes and inclinations. Furthermore, some of these topographical features could not be detected within the observation accuracy. Additional mounds outside the observed area suggest the presence of more mud volcanoes in the target area. Including potential ones, we suspect the number, density, and area of mud volcanoes covering the Hyuga-nada to be extensive, possibly much larger than those covering the Kumano Basin. Moreover, the mud volcano field in the Hyuga-nada may extend toward southern areas. Ujiié (2000) reported a wide-ranging distribution of “mud diapir and surge” along the landward slope of the Ryukyu Trench, extending off-Tanegashima and southward (Figure 1). Other scientific research cruises conducted in the off-Tanegashima region, which lies on the southern side of the Hyuga-nada, reported that a group of mud volcanoes had been discovered in that area (Hoshino et al., 2017; Inagaki et al., 2018). Itaki et al. (2015, 2017) and Sato and Itaki (2015) reported at least one mud volcano and 11 similar bathymetric features off-Kikai-jima area (Figure 1) based on the results of acoustic mapping and sediment sampling. The huge area from the Hyuga-nada to off-Kikai-jima may contain a large mud volcano field.
5.2 Characteristics of mud-volcano conduits based on seismic profiles
Acoustically transparent bodies nearly correspond to “mobile shales” (Soto et al., 2021a; b; Hudec and Soto, 2021), nearly vertical conduits below mud volcanoes that cut the stratigraphy. Soto et al. (2021a) mentioned that shales become mobile owing to increasing overpressure and shear and then reduce the rock strength. They reviewed physical properties indicated by seismic characteristics and reported that sediment had decreased porosity, phase change of clay minerals, and smectite to illite transformation with increasing depth and temperature. Gas, another main component of discharged elements by mud volcanoes worldwide, is generated thermogenically at greater depths (and then migrate upward) and biologically at shallower depth; thus, changes in gas saturation within sediments affect acoustic impedance and can be detected in seismic signals (Soto et al., 2021a). The seismic profiles shown in Figures 3, 5 that reach down to a depth of several hundred meters (∼a few kilometers deep below the seafloor) may indicate such a change in physical properties, although we cannot confirm this suggestion without having in-situ and geophysical data at depth.
Acoustically transparent bodies represent a part of the transparent interior of seismic or sub-bottom profiles from which weak signals are returned and where nearly no stratigraphy exists inside. As discussed by Brown (1990), all conduits reaching the seafloor require buoyancy containing gas. In addition, as discussed by Domenico (1976), the transparent acoustic nature suggests that the gas within the body absorb seismic waves. Acoustically transparent bodies can also occur in other scenarios, such as in the absence of any structure (no density-velocity contrast) within the body or reflection of all seismic energy at the top. The former is quite likely when a conduit lacks the inner layered structure. Even in that case, it is natural to assume that the gas is not necessarily contained in the entire acoustically transparent body but only in a part of the conduit. In contrast, the reflection of all energy at the top of acoustically transparent bodies in this study was unlikely, as there were no remarkable high-amplitude parts at the top of these bodies. Therefore, it is reasonable for us to assume that a gas field exists in the background of our target area, and the condition is an important setting for forming mud volcano fields. The existence of multiple BSRs in this field (Figure 5) implies a continuous gas supply, thus supporting this idea.
5.3 Heterogeneous distribution of mud volcano field along offshore southwest Japan
The acoustic investigations connecting the Kumano basin and Hyuga-nada did not reveal the existence of any other dense mud volcano field within the area covered by our acoustic investigation (Figure 2B). Only one potential mud volcano was found in the off-Muroto area, which is located in a fault zone. It is an isolated hill with a high backscatter intensity and a steep surface slope angle. Although we could not clearly identify the isolated hill as a mud volcano because we did not have data on the subseafloor structure nor samplings, the distinctive bathymetric expression implies that the hill consists of a highly viscous sediment captured fault gouge along the fault zone, similar to KMV14 in the KBEFZ (Asada et al., 2021). The distinctive high backscatter intensity over the hill suggests that large amounts of fluid are discharged at present and may cultivate shelled animals and carbonate rocks. Thus, we expect the isolated hill to be a mud volcano. However, no other similar features that could be considered mud volcanoes were found nearby.
No swarm of mud volcanoes in the off-Muroto area indicates a heterogeneous distribution of mud volcano fields (with a blank area from the Kumano basin to Hyuga-nada) under a series of convergent plate margins. We expect that the subseafloor environment of the off-Muroto area differs from the Kumano and Hyuga-nada areas, which may explain the heterogeneity in the mud volcano fields. The Kumano Basin and the potentially vast area extending from the Hyuga-nada toward the south are in a similar tectonic setting: subducting seamounts are present, i.e., Paleo-zenisu and related seamounts are subducting under the Kumano Basin, and the Kyusyu-Palau Ridge and related ridges and plateaus are subducting under the Hyuga-nada and regions further south (Figure 1). Subducting volcanic and sedimentary rocks are widely encountered in other mud volcano fields worldwide; for example, the Gagua ridge near the southwest part of Taiwan, the northern part of Hikurangi part of New Zealand, and the oceanic plate (does not accompany thick hemipelagic sediment) below Barbados and the Bay of Cadiz, on a regional scale. The subduction of seamounts results in a higher number of volcanic rocks that are a source of clay minerals, which are the main component of mud volcanoes in the Kumano Basin (Menapace et al., 2017; Ijiri et al., 2018a), rather than pelagic sediments (Kameda et al., 2011; 2017). Further, the formation of local stress fields owing to the bumpy surface of subducting seamounts may contribute to the formation of mud volcanoes. In other words, clay minerals may be needed to form swarms of mud volcanoes. Moreover, subseafloor temperature, the chemical environment, and loading conditions at depth may characterize the subseafloor environment. In other words, satisfying compressional stress fields and relatively large amounts of gas discharge along convergent plate margins are insufficient for forming the swarm of mud volcanoes, and other subseafloor conditions are required. Such characteristic subseafloor environments may contribute to other geological phenomena, such as crustal deformation and/or slip. The heterogeneous distributions of mud volcanoes may thus be used as indicators of deep and local subseafloor geological conditions, which may be difficult to visualize using geophysical surveys or sediment core samplings.
6 Conclusion
Faults, folds, lenses, MTDs, BSRs, and other geological subseafloor structures were located across the target area. The deformation of stratigraphy increased, and BSRs became clearer oceanward. We identified new mud volcanoes, including potential ones, in the Hyuga-nada by analyzing subseafloor structures indicated by seismic and sub-bottom profiles. In the Hyuga-nada, abundant mud volcanoes show a dense distribution and are considered extensive in the area toward the south, connected to the off-Tanegashima and off-Kikai-jima areas. However, mud volcanoes may be scarce in the connecting area between the Kumano Basin and the Hyuga-nada, suggesting heterogeneous distribution of the mud volcano fields along the series of convergent margins, the Nankai Trough and the northern part of the Ryukyu Trench, off the southwest coast of Japan.
Data availability statement
The datasets presented in this study can be found in online repositories. The names of the repository/repositories and accession number(s) can be found below: YK15-10 cruise data: https://doi.org/10.17596/0001663 (URL2) and YK18-05 cruises data: https://doi.org/10.17596/0002693 (URL3), respectively.
Author contributions
MA and TY contributed to the conception and design of this study. MA designed this work, organized the wo research cruises (YK15-10 and YK18-05), and contributed to acoustic data processing. RF contributed to the description of the onshore geological setting and discussion. TY was responsible for the process of obtaining permission to publish the 3D seismic data and drawings. TT and AI contributed to the discussions of the off-Tanegashima mud volcano field. KK contributed to the discussion and provided general information on mud volcano studies. All authors contributed to the article and approved the submitted version.
Funding
This study was supported by the Japan Society of the Promotion of Science KAKEN from fiscal years 2016–2018 ending on 31 March 2019.
Acknowledgments
We are grateful to the two reviewers and editor for their constructive comments. This study was in a part based on data from the off-Miyazaki area’s domestic oil and natural gas survey, led by the Ministry of Economy, Trade, and Industry (METI), Japan. The Generic Mapping Tools software was used to generate bathymetric maps (Wessel and Smith, 1998).
Conflict of interest
The authors declare that the research was conducted in the absence of any commercial or financial relationships that could be construed as a potential conflict of interest.
Publisher’s note
All claims expressed in this article are solely those of the authors and do not necessarily represent those of their affiliated organizations, or those of the publisher, the editors and the reviewers. Any product that may be evaluated in this article, or claim that may be made by its manufacturer, is not guaranteed or endorsed by the publisher.
References
Aloisi, G., Bouloubassi, I., Heijs, S. K., Pancost, R. D., Pierre, C., Sinninghe Damste, J. S., et al. (2002). CH4-consuming microorganisms and the formation of carbonate crusts at cold seeps. Earth Planet. Sci. Lett. 203, 195–203. doi:10.1016/S0012-821X(02)00878-6
Asada, M., Moore, G. F., Kawamura, K., and Noguchi, T. (2021). Mud volcano possibly linked to seismogenic faults in the Kumano Basin, Nankai Trough, Japan. Mar. Geophys. Res. 42, 4. doi:10.1007/s11001-020-09425-7
Asada, M., and Yokota, T. (2021). A case study on the penetration difference of acoustic signals into sediment due to frequency based on backscatter strength distribution obtained along the Kumano Basin Edge Fault Zone. Proc. 14th SEGJ Int. Symp., AS-01. doi:10.1190/segj2021-001.1
Bates, R. L., and Jackson, J. A. (1987). Glossary of Geology. 3rd edition. American Geological Institute, 788.
Blondel, P. (2009). “7. Continental margins,” in The Handbook od SIDESCAN SONAR. Editor P. Blondel (Springer), 147–183.
Bonini, M. (2012). Mud volcanoes: indicators of stress orientation and tectonic controls. Earth-Sci. Rev. 115, 121–152. doi:10.1016/j.earscirev.2012.09.002
Brown, K. M. (1990). The nature and hydrogeologic significance of mud diapirs and diatremes for accretionary systems. J. Geophys. Res. B Solid Earth 95, 8969–8982. doi:10.1029/jb095ib06p08969
Brown, K. M., and Westbrook, G. K. (1987). The tectonic fabric of the Barbados Ridge accretionary complex. Mar. Petrol. Geol. 4, 71–81. doi:10.1016/0264-8172(87)90022-5
Buckman, J., Donnelly, T., Jiang, Z., Lewis, H., and Ruffell, A. (2020). Methane derived authigenic carbonate (MDAC) aragonite cemented quaternary hardground from a methane cold seep, Rathlin Basin, Northern Ireland: δ13C and δ18O isotopes, environment, porosity and permeability. Geoscence 10, 255. doi:10.3390/geosciences10070255
Ceramicola, S., Dupre, S., Somoza, L., and Woodside, J. (2018). “Cold seep systems,” in Submarine geomorphology. Editors A. Micallef, S. Krastel, and A. Savini (Springer Nature), 367–387. doi:10.1007/978-3-319-57852-1_19
Chiba, T., Kaneda, S., and Suzuki, Y. (2008). Red relief image map: new visualization method for three dimensional data. ISPRS Ann. Photogramm. Remote Sens. Spat. Inf. Sci. 37, 1071–1076.
Chiba, T., Suzuki, Y., and Hiramatsu, T. (2007). Digital terrain representation methods and red relief image map, a new visualization approach. J. Jpn. Cartogr. Assoc. “Map”. 45 (1), 27–36. doi:10.11212/jjca1963.45.27
Chuang, P.-C., Yang, T. F., Hong, W.-L., Lin, S., Sun, C.-H., Lin, A. T.-S., et al. (2010). Estimation of methane flux offshore SW Taiwan and the influence of tectonics on gas hydrate accumulation. Geofluids 10, 497–510. doi:10.1111/j.1468-8123.2010.00313.x
DeMets, C., Gordon, R. G., and Argus, D. F. (2010). Geologically current plate motions. Geophys. J. Int. 181, 1–80. doi:10.1111/j.1365-246x.2009.04491.x
Deville, E., Guerlais, S. H., Callec, Y., Griboulard, R., Huyghe, P., Lallemant, S., et al. (2006). Liquefied vs stratified sediment mobilization processes: insight from the South of the Barbados accretionary prism. Tectonophysics 428, 33–47. doi:10.1016/j.tecto.2006.08.011
Dimitrov, L. I. (2002). Mud volcanoes—the most important pathway for degassing deeply buried sediments-The most important pathway for degassing deeply buried sediments. Earth Sci. Rev. 59, 49–76. doi:10.1016/s0012-8252(02)00069-7
Domenico, S. N. (1976). Effect of brine-gas mixture on velocity in an unconsolidated sand reservoir. Geophysics 41, 882–894. doi:10.1190/1.1440670
Doo, W. B., Hsu, S. K., Lo, C.-L., Chen, S. C., Tsai, C. H., Lin, J. Y., et al. (2015). Gravity anomalies of the active mud diapirs off southwest Taiwan. Geophys. J. Int. 203, 2089–2098. doi:10.1093/gji/ggv430
Feyzullayev, A. A. (2012). Mud volcanoes in the South Caspian basin: nature and estimated depth of its products. Nat. Sci. 04, 445–453. doi:10.4236/ns.2012.47060
Hamada, Y., Tanaka, K., and Miyata, Y. (2009). Geologic structure and geochemistry of Taiwanese mud volcanoes. J. Geogr. 118, 408–423. (in Japanese with English abstract). doi:10.5026/jgeography.118.408
Hoshino, T., Toki, T., Ijiri, A., Morono, Y., Machiyama, H., Ashi, J., et al. (2017). Atribacteria from the subseafloor sedimentary biosphere disperse to the hydrosphere through submarine mud volcanoes. Fron. Microbiol. 8, 1135. doi:10.3389/fmicb.2017.01135
Hovland, M., Talbot, M. R., Qvale, H., Olaussen, S., and Aasberg, L. (1987). Methane-related carbonate cements in pockmarks of the North Sea. J. Sed. Petrol. 57, 881–892. doi:10.1306/212F8C92-2B24-11D7-8648000102C1865D
Hudec, M. R., and Soto, J. I. (2021). Piercement mechanisms for mobile shales. Basin Res. 33, 2862–2882. doi:10.1111/bre.12586
Ijiri, A., Iijima, K., Tsunogai, U., Ashi, J., and Inagaki, F. (2018a). Clay mineral suites in submarine mud volcanoes in the Kumano forearc basin, Nankai Trough: constraints on the origin of mud volcano sediments. Geosci 8, 220. doi:10.3390/geosciences8060220
Ijiri, A., Inagaki, F., Kubo, Y., Adhikari, R. R., Hattori, S., Hoshino, T., et al. (2018b). Deep-biosphere methane production stimulated by geofluids in the Nankai accretionary complex. Sci. Adv. 4, eaao4631–15. doi:10.1126/sciadv.aao4631
Inagaki, F., Ijiri, A., Kitada, K., and Machiyama, H. (2018). Interactions between biogenic gas and microbial activity in the subseafloor– Frontiers in scientific ocean drilling. J. Jpn. Assoc. Petrol. Technol. 83, 130–137. (in Japanese with English abstract). doi:10.3720/japt.83.130
Itaki, T., Sato, T., Inoue, T., Amano, A., and Tanaka, Y. (2015). “Characteristics of bottom sediments collected from the submarine caldera off south of the Kikai-jima Island,” in Annual Meet. Geol. Soc. Japan (northern Ryukyu Arc. Abstract 158.
Itaki, T., Sato, T., Inoue, T., Amano, A., and Tanaka, Y. (2017). Mud volcano distributed around the kikai-jima Island, northern Ryukyu arc. JpGU-AGU Joint Meet. Abstract, SGL-34–05.
Kameda, J., Inoue, S., Tanikawa, W., Yamaguchi, A., Hamada, Y., Hashimoto, Y., et al. (2017). Alteration and dehydration of subducting oceanic crust within subduction zones: implications for décollement step-down and plate-boundary seismogenesis. Earth Planets. Space 69, 52. doi:10.1186/s40623-017-0635-1
Kameda, J., Yamaguchi, A., Saito, S., Sakuma, H., Kawamura, K., and Kimura, G. (2011). A new source of water in seismogenic subduction zones. Geophys. Res. Lett. 38. doi:10.1029/2011gl048883
Kato, S., Waseda, M., and Iwano, H. (2011). Geochemistry of natural gas and formation water from water-dissolved gas fields in Miyazaki Prefecture. J. Jpn. Assoc. Petrol. Technol. 76, 244–253. doi:10.3720/japt.76.244
Kawabata, K., Tanaka, H., and Kimura, G. (2007). Mass transfer and pressure solution in deformed shale of accretionary complex: examples from the Shimanto Belt, southwestern Japan. J. Struct. Geol. 29, 697–711. doi:10.1016/j.jsg.2006.11.009
Kioka, A., and Ashi, J. (2015). Episodic massive mud eruptions from submarine mud volcanoes examined through topographical signatures. Geophys. Res. Lett. 42, 8406–8414. doi:10.1002/2015gl065713
Kirkham, C., and Cartwright, J. (2022). Mud volcanoes and dissolution structures as kinematic markers during salt tectonic deformation. Basin Res. 34, 99–120. doi:10.1111/bre.12612
Kopf, A., Asshoff, K., Belke-Brea, M., Bergenthal, M., Bohrmann, G., Bräunig, A., et al. (2013). Report and preliminary results of RV Sonne cruise SO222: MEMO–MeBo drilling and in situ long-term monitoring in the Nankai Trough accretionary complex, Japan. Berichte MARUM—Zentrum für Mar. Umweltwiss. Fachbereich Geowiss. Univ. Brem. 297, 123.
Kopf, A. J. (2016). “Mud volcano,” in Encyclopedia mar. Geosci. Editors J. Harff, M. Meschede, S. Petersen, and J. Thiede (Springer), 527–536.
Kuramoto, S., Ashi, J., Greinert, J., Gulick, S., Ishimura, T., Morita, S., et al. (2001). Surface observation of subduction related mud volcanoes and large thrust sheets in the Nankai subduction margin; Report on YK00-10 and YK01-04 cruises. JAMSTEC Deep Sea Res. 19, 131–139.
Lackey, J., Moore, G., and Strasser, M. (2018). Three-dimensional mapping and kinematic characterization of mass transport deposits along the outer Kumano Basin and Nankai accretionary wedge, southwest Japan. Prog. Earth Planet Sci. 5, 65. doi:10.1186/s40645-018-0223-4
Lalk, E., Pape, T., Gruen, D. S., Kaul, N., Karolewski, J. S., Bohrmann, G., et al. (2022). Clumped methane isotopologue-based temperature estimates for sources of methane in marine gas hydrates and associated vent gases. Geochim. Cosmo. Acta. 327, 276–297. doi:10.1016/j.gca.2022.04.013
Lance, S., Henry, P., Le Pichon, X., Lallemant, S., Chamley, H., Rostek, F., et al. (1998). Submersible study of mud volcanoes seaward of the Barbados accretionary wedge: sedimentology, structure and rheology. Mar. Geol. 145, 255–292. doi:10.1016/s0025-3227(97)00117-5
Leighton, A., Brook, M. S., Cave, M., Rowe, M. C., Stanley, A., and Tunnicliffe, J. F. (2022). Engineering geomorphological reconnaissance of the December 2018 Waimata Valley mud volcano eruption, Gisborne, New Zealand. Quat. J. Eng. Geol. Hydrogeol. 55. doi:10.1144/qjegh2021-149
Manga, M., Brumm, M., and Rudolph, M. L. (2009). Earthquake triggering of mud volcanoes. Mar. Petrol. Geol. 26, 1785–1798. doi:10.1016/j.marpetgeo.2009.01.019
Martin, K. M., Gulick, S. P. S., Bangs, N. B. L., Moore, G. F., Ashi, J., Park, J. O., et al. (2010). Possible strain partitioning structure between the Kumano forearc basin and the slope of the Nankai Trough accretionary prism. Geochem. Geophys. Geosyst. 11 (5), 68. doi:10.1029/2009G
Mazzini, A., and Etiope, G. (2017). Mud volcanism: an updated review. Earth. Sci. Rev. 168, 81–112. doi:10.1016/j.earscirev.2017.03.001
Menapace, W., Völker, D., Kaul, N., Tryon, M. D., and Kopf, A. J. (2017). The role of mud volcanism and deep-seated dewatering processes in the Nankai Trough accretionary prism and Kumano Basin, Japan. Geochem. Geophys. Geosyst. 18, 2486–2509. doi:10.1002/2016GC006763
Milkov, A. V. (2000). Worldwide distribution of submarine mud volcanoes and associated gas hydrates. Mar. Geol. 167, 29–42. doi:10.1016/s0025-3227(00)00022-0
Milkov, A. V. (2005). “Global distribution of mud volcanoes and their significance in petroleum exploration as a source of methane in the atmosphere and hydrosphere and as a geohazard,” in Mud volcanoes, geodynamics and seismicity, NATO sci. Ser. Editors G. Martinelli, and B. Panahi (Springer), 29–34.
Miyakawa, K., Tokiwa, T., and Murakami, H. (2013). The origin of muddy sand sediments associated with mud volcanism in the Horonobe area of northern Hokkaido, Japan. Geochem. Geophys. Geosyst. 14, 4980–4988. doi:10.1002/2013GC004924
Moore, G. F., Boston, B. B., Strasser, M., Underwood, M. B., and Ratliff, R. A. (2015). Evolution of tectono-sedimentary systems in the Kumano Basin, Nankai Trough forearc. Mar. Petrol. Geol. 67, 604–616. doi:10.1016/j.marpetgeo.2015.05.032
Moore, J. C., and Saffer, D. (2001). Updip limit of the seismogenic zone beneath the accretionary prism of southwest Japan: an effect of diagenetic to low-grade metamorphic processes and increasing effective stress. Geology 29, 183–186. doi:10.1130/0091-7613(2001)029<0183:ulotsz>2.0.co;2
Nakayama, N., Ashi, J., Tsunogai, U., Gamo, T., and Tanahashi, M. (2010). Sources of pore water in a Tanegashima mud volcano inferred from chemical and stable isotopic studies. Geochem. J. 44, 561–569. doi:10.2343/geochemj.1.0094
Nishio, Y., Ijiri, A., Toki, T., Morono, Y., Tanimizu, M., Nagaishi, K., et al. (2015). Origins of lithium in submarine mud volcano fluid in the Nankai accretionary wedge. Earth Planet. Sci. Lett. 414, 144–155. doi:10.1016/j.epsl.2015.01.018
Okamura, N. (2008). Geological map of Hyuga nada, mari. Geol. Map series, 64. Geological Survey of Japan.
Pape, T., Geprägs, P., Hammerschmidt, S., Wintersteller, P., Wei, J., Fleischmann, T., et al. (2014). Hydrocarbon seepage and its sources at mud volcanoes of the Kumano forearc basin, Nankai Trough subduction zone. Geochem. Geophys. Geosys. 15, 2180–2194. doi:10.1002/2013gc005057
Planke, S., Svensen, H., Holand, M., Banks, D. A., and Jamtveit, B. (2003). Mud and fluid migration in active mud volcanoes in Azerbaijan. Geo-Mar Lett. 23, 258–268. doi:10.1007/s00367-003-0152-z
Ramirez, S. G., Gulick, S. P. S., and Hayman, N. W. (2015). Early sedimentation and deformation in the Kumano forearc basin linked with Nankai accretionary prism evolution, southwest Japan. Geochem. Geophys. Geosys. 16, 1616–1633. doi:10.1002/2014gc005643
Sato, T., and Itaki, T. (2015). Bathymetry of GH14 cruise area (Amami-Oshima island-kikai-jima Island), marine geological and geophysical studies around okinawa islands -around of amami-oshima, tokuno-shima and okinoerabu-jima islands-, preliminary reports on research in fiscal year 2014. GSJ Interim Rep. 67, 5–14.
Shih, T. T. (1967). A survey of the active mud volcanoes in Taiwan and a study of their types and the character of the mud. Petrol. Geol. Taiwan 5, 259–311.
Somoza, L., Díaz-del-Río, V., León, R., Ivanóv, M., Fernández-Puga, M. C., Gardner, J. M., et al. (2003). Seabed morphology and hydrocarbon seepage in the Gulf of Cádiz mud volcano area: acoustic imagery, multibeam and ultra-high resolution seismic data. Mar. Geol. 195 (1-4), 153–176. doi:10.1016/s0025-3227(02)00686-2
Soto, J. I., Heidari, M., and Hudec, M. R. (2021b). Proposal for a mechanical model of mobile shales. Sci. Rep. 11, 23785. doi:10.1038/s41598-021-02868-x
Soto, J. I., Hudec, M. R., Mondel, N. H., and Heidari, M. (2021a). Shale transformations and physical properties—implications for seismic expression of mobile shales. Earth-Sci. Rev. 220, 103746. doi:10.1016/j.earscirev.2021.103746
Strasser, M., Moore, G. F., Kimura, G., Kopf, A. J., Underwood, M. B., Guo, J., et al. (2011). Slumping and mass transport deposition in the Nankai fore arc: evidence from IODP drilling and 3-D reflection seismic data. Geochem. Geophys. Geosyts 12, Q0AD13. doi:10.1029/2010gc003431
Sumner, R. H., and Westbrook, G. K. (2001). Mud diapirism in front of the Barbados accretionary wedge: the influence of fracture zones and North America–South America plate motions. Mar. Petrol. Geol. 18, 591–613. doi:10.1016/s0264-8172(01)00010-1
Sun, C. H., Chang, S. C., Kuo, C. L., Wu, J. C., Shao, P. H., and Oung, J. N. (2010). Origins of Taiwan’s mud volcanoes: evidence from geochemistry. J. Asian Earth Sci. 37, 105–116. doi:10.1016/j.jseaes.2009.02.007
Taira, A., Hill, I., Firth, J., Berner, U., Brückmann, W., Byrne, T., et al. (1992). Sediment deformation and hydrogeology of the Nankai Trough accretionary prism: synthesis of shipboard results of ODP Leg 131. Earth Planet. Sci. Lett. 109, 431–450. doi:10.1016/0012-821x(92)90104-4
Toki, T., Higa, R., Tanahara, A., Ijiri, A., Tsunogai, U., and Ashi, J. (2013). Origin of pore water in Kumano mud volcanoes (in Japanese with English abstract). Chikyukagaku 47, 221–236. doi:10.14934/chikyukagaku.47.221
Tsuji, T., Kamei, R., and Pratt, R. G. (2014). Pore pressure distribution of a mega-splay fault system in the Nankai Trough subduction zone: insight into up-dip extent of the seismogenic zone. Earth Planet. Sci. Lett. 396, 165–178. doi:10.1016/j.epsl.2014.04.011
Tsunogai, U., Maegawa, K., Sato, S., Komatsu, D. D., Nakagawa, F., Toki, T., et al. (2012). Coseimic massive methane release from a submarine mud volcano. Earth Planet. Sci. Lett. 341–344, 79–85. doi:10.1016/j.epsl.2012.06.004
Ujiié, Y. (2000). Mud diapirs observed in two piston cores from the landward slope of the northern Ryukyu Trench, northwestern Pacific Ocean. Mar. Geol. 163, 149–167. doi:10.1016/s0025-3227(99)00113-9
[URL1] International Union of International Geosciences (2023). Task group on submarine geohazards (IUGS-TGSG.com). (visited on March 15, 2023) Available at: https://www.kiso.co.jp/sssgr/about/TGSG/entry-962.html.
[URL2] YOKOSUKA YK15-10 Cruise Data (2023). [URL2] YOKOSUKA YK15-10 cruise data. JAMSTEC. doi:10.17596/0001663
[URL3] R/V Yokosuka Cruise Report YK18-05 (2023). [URL3] R/V yokosuka cruise report YK18-05. JAMSTEC. doi:10.17596/0002693
Van Rensbergen, P., Depreiter, D., Pannemans, B., and Henriet, J.-P. (2005). Seafloor expression of sediment extrusion and intrusion at the El Arraiche mud volcano field, Gulf of Cadiz. J. Geophys. Res. Earth Surf. 110, F02010. doi:10.1029/2004jf000165
Wang, C.-Y., and Manga, M. (2021). “Mud volcanoes,” in Water and earthquakes. Editors C.-Y. Wang, and M. Manga (Springer Nature), 323–342. doi:10.1007/978-3-030-64308-9_12
Wessel, P., and Smith, W. H. F. (1998). New, improved version of generic mapping tools released. Eos Trans. AGU 79, 579. doi:10.1029/98eo00426
Wiersberg, T., Hammerschmidt, S. B., Fuchida, S., Kopf, A., and Erzinger, J. (2018). Mantle-derived fluids in the Nankai Trough Kumano forearc basin. Prog. Earth Planet. Sci. 5, 79. doi:10.1186/s40645-018-0235-0
Yamashita, M., Miura, S., Moore, G. F., Nakanishi, A., Kodaira, S., and Kaneda, Y. (2017). Bathymetric imaging of protothrust zone along the Nankai Trough. Isl. Arc 27. doi:10.1111/iar.12233
Keywords: mud volcano, Hyuga-nada, Kumano Basin, three-dimensional reflection seismic survey, sub-bottom profiler, subseafloor structure
Citation: Asada M, Yamashita M, Fukuchi R, Yokota T, Toki T, Ijiri A and Kawamura K (2023) Identification of a large mud volcano field in the Hyuga-nada, northern end of the Ryukyu trench, offshore Japan. Front. Earth Sci. 11:1232302. doi: 10.3389/feart.2023.1232302
Received: 31 May 2023; Accepted: 11 October 2023;
Published: 30 November 2023.
Edited by:
Stéphanie Dupré, Institut Français de Recherche pour l’Exploitation de la Mer, FranceReviewed by:
Luis Somoza, Instituto Geológico y Minero de España (IGME), SpainJuan I. Soto, The University of Texas at Austin, United States
Copyright © 2023 Asada, Yamashita, Fukuchi, Yokota, Toki, Ijiri and Kawamura. This is an open-access article distributed under the terms of the Creative Commons Attribution License (CC BY). The use, distribution or reproduction in other forums is permitted, provided the original author(s) and the copyright owner(s) are credited and that the original publication in this journal is cited, in accordance with accepted academic practice. No use, distribution or reproduction is permitted which does not comply with these terms.
*Correspondence: Miho Asada, YXNhZGEubWlob0BhaXN0LmdvLmpw