 Anouk Boon
 Frans A. Buschman
 Tim H. M. van Emmerik
 Sophie Broere
 Bart Vermeulen
- 1Hydrology and Environmental Hydraulics Group, Wageningen University, Wageningen, Netherlands
- 2Rivers Department, Deltares, Delft, Netherlands
- 3Noria Sustainable Innovators, Delft, Netherlands
Plastic pollution has become an enormous environmental problem, endangering ecosystems, livelihoods, safety and human health. Large quantities of plastics are trapped in or transported by rivers. Monitoring methods mostly focus on plastics floating at the surface or deposited on riverbanks, while a substantial part of plastics may be transported below the water surface. Available underwater monitoring methods rely on nets and large equipment, making them labour-intensive, expensive and invasive. The measurements are, therefore, limited to occasional point measurements. In this paper, we explore the potential of echo sounding for the monitoring of suspended macroplastic (plastic items bigger than 5 mm). We performed tests in a controlled (basin), a semi-controlled (harbour) and an uncontrolled (river) environment using the high-end Acoustic Doppler Current Profiler (ADCP). This device is already in use for the estimation of flow velocity and suspended sediment concentrations using the wide network of ADCPs in the Netherlands and other countries. In the undisturbed controlled environment, 25 items varying in size, material, and orientation could be detected up to at least 4.6 m from the ADCP. The semi-controlled experiments showed that most of these items can also be detected among other naturally occurring scatterers, such as aquatic life, organic material and air bubbles. The field tests under natural conditions, combining ADCP and net measurements, showed that ADCP data can be calibrated towards a correct order of magnitude estimate of plastic transport. The coupling of the ADCP data to item characteristics such as size, material and orientation is still challenging, but more research into, for example, the signature of items may enable distinguishing item characteristics. This fundamental knowledge, combined with repetitions of validated field measurements under different flow conditions, is needed for the development of a robust monitoring method. Such a method may enable continuous or cross-sectional monitoring of suspended plastics and give insight into historic and plastic transport through 30-year long datasets. These insights can help improve and determine the effect of current mitigation and cleaning efforts.
1 Introduction
The massive amounts of plastic litter trapped in or transported from land to sea by rivers have become a global concern (Tramoy et al., 2020b; Lau et al., 2020; Liro et al., 2020; van Emmerik et al., 2022a). Negative impacts include ingestion or entanglement of fauna, increased urban flood risk, damage to vessels and expensive mitigation and cleaning efforts (Windsor et al., 2019; Lau et al., 2020; van Emmerik and Schwarz, 2020). To minimise these impacts, global and national cleaning and mitigation efforts are put into place. The UN is working towards a legally binding treaty to reduce plastic pollution, and the EU has recently banned single-use plastics (European Comission, 2022; IISD, 2022). Monitoring is key to show the efficacy of the cleaning and mitigation measures.
Successful measurement techniques have been developed for the monitoring of floating and on riverbanks deposited plastic items (Duncan et al., 2020; Geraeds et al., 2019; Tramoy et al., 2020a; van Emmerik et al., 2018; van Emmerik et al., 2020; van Lieshout et al., 2020). Despite being successful and giving a first-order estimate of the riverine plastic transport, these measurement techniques do not include the plastics suspended in the water column (Vriend et al., 2020). The suspended plastics might, however, make up a substantial part of the total riverine plastic transport (Morritt et al., 2014; Hohenblum et al., 2015; Collas et al., 2021; Haberstroh et al., 2021; Blondel and Buschman, 2022; Velimirovic et al., 2022). Recent efforts trying to develop a monitoring method for these plastics rely on fyke and fishing nets. Because large ships, cranes and anchors are needed to keep the nets in place, the campaigns are highly labour-intensive, invasive and expensive. Due to these practical limitations, suspended plastic transport monitoring is not continuous and limited to point measurements.
Echo sounding may provide an opportunity for non-invasive continuous monitoring. During echo sounding measurements, a high-frequency acoustic signal is transmitted, which is returned to the device by scattering and reflection by particles. This returned signal is called the echo. The Doppler shift and the intensity of the echo can be used to estimate flow velocity and suspended sediment concentration, respectively (Sassi et al., 2012; Vermeulen et al., 2014; ?). As the echo intensity depends on the size, form and material of the sampled object, larger objects like fish can be recognised based on their distinct echo intensity pattern. The potential of echo sounding for the detection of plastics has recently been shown for three kinds of acoustic instruments: a fish finder (Broere et al., 2021), an Adaptive Resolution Imaging Sonar (ARIS) and a side-scan sonar (SSS) (Valdenegro-Toro, 2019; Flores et al., 2022). A general understanding per instrument of echo intensity characteristics of a large relevant plastic item selection and a robust monitoring method for acoustic instruments in the riverine environment have yet to be developed.
In this study, we explore the potential of the Acoustic Doppler Current Profiler (ADCP) for the monitoring of riverine macroplastic (plastic items bigger than 5 mm) transport. Since the ADCP is commonly used for flow monitoring, an extensive network of fixed, continuously measuring ADCPs is present at many locations around the globe, and regular cross-sectional moving-boat measurement campaigns are undertaken. For example, datasets obtained in large rivers in the Netherlands date back up to 30 years, giving the unique opportunity to explore historical trends in suspended plastic transport. We investigate the potential of the ADCP by performing tests in a controlled (basin), a semi-controlled (harbour) and an uncontrolled (river) environment. The goals of these tests are respectively: 1) to determine the range of echo intensity and the effect item characteristics, such as orientation, form and material, have on this echo intensity, 2) to confirm the detectability of the plastic items in a natural environment with other disturbances such as air bubbles and aquatic life, and 3) to evaluate an ADCP plastic monitoring method in the field with simultaneous net measurements.
2 Materials and methods
We performed three tests of increasing complexity. We started with a test in a controlled environment where the kind and location of plastic items were known. This test gave the opportunity to determine the magnitude of the echo intensity depending on item material, size and orientation, distance from the transducer and positioning of items in the absence of other scatterers. We continued to a semi-controlled natural environment (harbour), still placing known items at a known location. In this semi-controlled environment, the echo intensity of added items among naturally present scatterers (air, flora and fauna) could be evaluated. Lastly, a test in an uncontrolled natural environment (river) with unknown plastic items and location was performed. Simultaneous ADCP and net measurements were undertaken, aiming to compare the number of items collected in the net (no items were introduced) with the estimate based on ADCP recordings. In the following sections, we first discuss the item selection for the first two tests (Section 2.1). The ADCPs and setups used for the three different locations will be described in Section 2.2. Finally, we explain the data processing applied for all three tests (Section 2.3). Details on the litter items can be found in the (Supplementary Figures S1, S2).
2.1 Item selection
In the first two tests, items were added to the water column to link the item to a certain echo intensity. As plastic litter items show a wide variety in characteristics, a selection of macroplastics was made that is expected to be most common in the water column of Dutch rivers. During recent net measurements in the Waal (Oswald et al., 2023), undefined soft and hard pieces of plastic (0–50 cm), food wrapping, strings and bags were found to be the most occurring plastic items, accounting for about 80% of the total suspended litter items. Therefore, the plastic categories strings, bottles, bags/film and food wrapping were chosen as test materials. For comparison, items containing an aluminium or paper layer and organic plant material were tested. A food container lid and a piece of geotextile are added for a test considering object orientation because of their large difference in area depending on orientation. During the controlled test, multiple sizes of each item category were sampled. For the semi-controlled test, one or two sizes per category were chosen (Supplementary Figure S2).
2.2 Experimental setup
2.2.1 Controlled test in a basin
The controlled test was carried out in the Intake and Outfall Structures 2 basin at Deltares (Delft, the Netherlands). The basin is 6 m wide and 16 m long and was filled up to a water depth of 1.1 m. A StreamPro ADCP (Teledyne RD Instruments, United States) was horizontally fixed at a depth of 35 cm on one side of the basin, adjacent to a glass wall used for observations of the positioning and orientation of items (Figure 1). Frequency, cell size and sampling rate are set as respectively 2 MHz, 20 cm and 1 signal per s. WinRiver II was used for data acquisition, and the toolbox adcptools in MATLAB for data reading and analysis (Sassi et al., 2012). To minimise interference due to reflection on the bottom and walls of the basin by down or up-facing beams, three of the four beams were taped off using ten layers of duct tape (1.8 mm total). The ADCP was mounted such that the open beam looked horizontally through the water column.
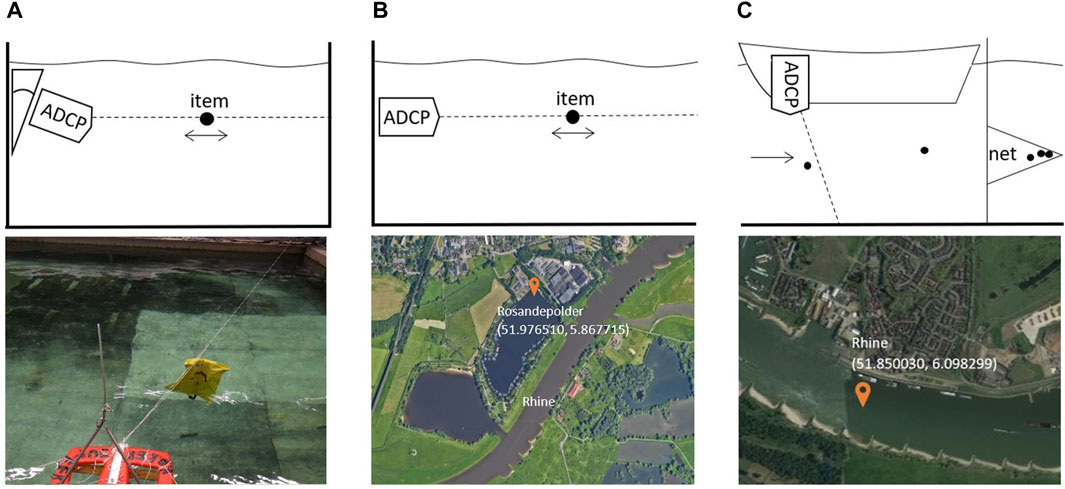
FIGURE 1. Set-up and location of the (A) controlled, (B) semi-controlled and (C) field test.
During the controlled test, five experiments were done, focusing on different aspects of the item and signal characteristics. The first experiment gives an overview of the echo intensity of all selected items. The items were held in the ADCP beam at 1, 2.8, and 4.6 m from the transducer (Figure 1). The first and third measurement points were located in two cells (40 cm) from the near field (0.56 cm) and opposite wall (5 m), and the second measurement point was chosen in between. When possible, items were placed freely in the ADCP beam. A piece of 0.15 mm string had to be used to successfully fix the bottles due to their tendency to sink. The string was kept outside of the beam as much as possible. Items varying in surface area depending on orientation were held perpendicular to the beam, maximising the area facing the acoustic beam. It is assumed that the actual area of the bags equals 0.75 times the stretched area, as it could not be prevented that the bags slightly deformed in the water. For each item, five repetitions were done per distance.
We performed three additional experiments. The first focuses on orientation by placing items differing in surface area depending on orientation parallel and perpendicular in the beam. The items were held in the beam twice for a 30 s time period at the second (2.8 m) and third (4.6 m) measurement points, using a string to keep them in position. Also, the effect of placing items in series was assessed by placing small items behind the 41 × 47 cm bag twice for a 30 s time period. Finally, the possible echo from items outside of the main cone of the acoustic signal (side lobe) is tested. If items scatter in both the side and main lobe, this might result in an overestimation of the plastic count. During the experiment, we slowly moved items on a string from the wall until the middle of the ADCP beam and checked when an increase in echo intensity occurred.
2.2.2 Semi-controlled test in a harbour
The semi-controlled test was undertaken in the Rosandepolder harbour (Arnhem, the Netherlands) on the 23rd of November 2020 (Figure 1). The harbour is roughly 200 by 500 m in size and 2–3 m deep. It is connected to a branch of the Rhine river, but the influence of wind or ship waves is negligible. On the day of the test, the local flow velocity was between 0.0 and 0.2 m/s. Air bubbles were created by a drain entering the harbour at about 20 m from the ADCP. Sediment was suspended in the water column. The Signature ADCP (Nortek, Norway) was fixed at a pole 1 m below the water surface. Only the central vertical beam was used. Frequency, cell size and sampling rate are respectively 1 MHz, 25 cm and 2 signals per s. The ADCP was positioned such that the operational beam was horizontal and parallel to both the northeastern bank and a pier.
In the harbour, we repeated the first experiment we did in the controlled environment. This experiment focused on testing the echo intensity of various items, this time among other scatterers present in natural water bodies. From the pier next to the ADCP, we released items at 1, 3, and 5 m from the transducer using a net or hook. No strings or other tools were used to keep the items in place during a time interval of 10 s. The net was used to recollect the tested items. It was not possible to visually monitor the orientation of the items underwater. For each distance and item, the procedure was repeated five times.
2.2.3 Field test in a river
The uncontrolled test was performed in the main channel of the Rhine river (Tolkamer, The Netherlands) on 11th of April 2022 (Figure 1). The Rhine is one of Europe’s biggest rivers, with an average annual discharge of about 2,000 m3/s (Uelhinger et al., 2009). Around the measurement location, the average dimensions of the river are roughly 400 m wide and 6 m deep. On the measurement day, the flow velocity ranged between 1 and 1.5 m/s. Passing ships generated waves, whereas the wind was mild and only resulted in minor waves.
From a ship, a net was deployed in the water column, and from a second ship, measurements were carried out with a Workhorse ADCP (Teledyne RD Instruments, United States). Frequency, cell size and sampling rate are set as respectively 600 kHz, 50 cm and 2 signal per s. The second ship was held stationary at about 20 m upstream from the net. The net was 1 m high by 4 m wide, with a mesh size of 2 mm. It was placed halfway the water column (2.8–3.8 m), with the opening perpendicular to the flow. After being held at depth for 40 min, the net was pulled up to count both the plastic and organic items collected during the measurement. The ADCP was deployed for 29 min. The total number of items (plastic plus organic) between 2.8 and 3.8 m from the water surface of both the net and ADCP are compared. These are converted to the average number of items per m2 per minute, accounting for the difference in sample size and time of the net and the ADCP.
2.3 ADCP data processing
ADCPs emit an acoustic signal. This signal travels through the water column with an opening angle depending on the frequency and transducer radius, forming a cone shape called the beam. The part of the water column close to the device and the part close to the bottom are often discarded because of interferences distorting the acoustic signal. The water column is divided into depth cells over which the echo intensity is averaged for each time step. When a plastic item reflects the sound, the returned signal is much stronger with respect to the background signal, i.e., when no item is present (a complete time series for one item can be found in the (Supplementary Figure S6). This difference in echo intensity ΔE was calculated as:
Where ΔE is the difference between the item echo intensity E and the background echo intensity Eb. All three variables are given in the unit counts (1 count typically equals 0.45 dB) (Deines, 1999). The background echo intensity was determined as the median value of the echo intensity over the entire time series at each depth. The controlled test consists of 25 separate time series. The background echo intensity is calculated for each time series separately. The semi-controlled and field test consist of one long time series. For these tests, one background echo intensity was determined.
During the two controlled tests, the item location was known. We focused on the 10 s period in which the items were present in the beam. Because the time that items remained within the beam differed due to water movements or the tendency of items to sink or float, the maximum echo intensity of the 10 s period was chosen to compare items. When an item covered multiple cells, the cell with the highest echo intensity was chosen. The median value of the maxima of the five repetitions at one distance is presented in the results.
For the uncontrolled test, it was unknown whether or not an item was present in the beam at a certain time step. We, therefore, applied a threshold to estimate which peaks in the echo intensity correspond to an item. This threshold was calibrated to fit with the result from the net measurement. With a threshold of 3 standard deviations (σ) of the overall signal, the number of items estimated from the ADCP data corresponds well with with the net-based item count. When the echo intensity of a certain measurement cell exceeds this value, we assume an item was present within this cell. We assumed that an item was present in the beam for only one time step (0.5 s) during the field test, as almost all items were smaller than 50 cm.
3 Results
3.1 Controlled test in basin
The echo intensity of all tested items is higher than the background noise at the three measurement distances, overall ranging from 5 to 99 counts increase compared to the background (Figure 2). Most of the items seem to have a roughly linear decrease in echo intensity with distance. For some items, there was a low echo intensity found at the first measuring point (1 m). The variation in the background signal is determined as the standard deviation of the signal, which falls between 5.8 and 9.5 counts.
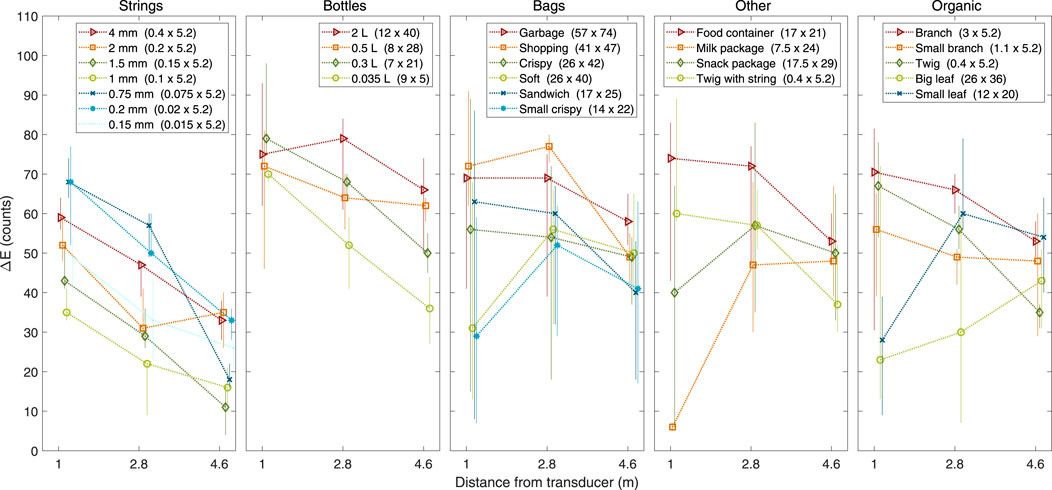
FIGURE 2. Difference in echo intensity with the background (ΔE) of items tested in the controlled environment. The bars show the full range of echo intensity found during 5 repetitions per item. The markers indicate the median value of these repetitions. Dimensions of the items (width x length) are given in cm.
The different categories show an overlapping range in echo intensity. Although there may be a difference in the average echo intensity between, for example, the strings and bottles, the highest and lowest intensities in these categories coincide. Also, the items containing a paper or aluminium lining and the organic material show a comparable echo intensity range as the plastic items. Within the categories, no clear trend based on item size or material can be found. The variation between repetitions of the same item is larger than the differences between items. The variation seems to be higher for items that can more easily deform and/or rotate (bags and leaves). In the test focused on the effect of orientation, no consistent relation between the orientation of the item and the echo intensity is found (Supplementary Figure S3).
The side lobe test aimed to indicate whether overestimation due to double scattering is expected to occur when items pass the ADCP beam. The echo intensity does not increase at the location of the side lobe with an amount that is comparable to the increase in echo intensity in the main lobe (Supplementary Figure S4). The increase in echo intensity in the second half of the experiment (01:00 till 01:30 min) is expected to be caused by air bubbles left in the main lobe rather than the side lobe. In the other experiments, the echo intensity also increases after the placement of larger items.
Items could also be detected when placed in series at different distances from the transducer (Supplementary Figure S5). When located in the same measurement cell (see also the twig with additional plastic string), no extra increase in echo intensity is found. For some of the largest items, an additional echo intensity peak is found further from the transducer, mostly at the first measurement point. The acoustic signal might be reflected between the wall where the ADCP is mounted and the item, causing a second echo.
3.2 Semi-controlled test in a harbour
In the semi-controlled test in the harbour, ΔE is lower than in the basin, ranging from 1 to 23 counts (Figure 3). Items are most successfully detected at 3 m from the transducer. Similar to the controlled test, there is a decrease in echo intensity between the second (3 m) and third (5 m) measurement points found for almost all items. At the 1 m point, the echo intensity is generally lower than at 3 m distance from the ADCP. ΔE even became negative during some of the repetitions, meaning that the background noise is larger than the item reflection. This occurs for the large film (−76.5 counts), 1 mm string (−74.5 counts) and drink package (−74 counts). The standard deviation of the background signal in the harbour is for the cells on 1, 3, and 5 m, respectively 1.7, 2.1, and 1.5 counts.
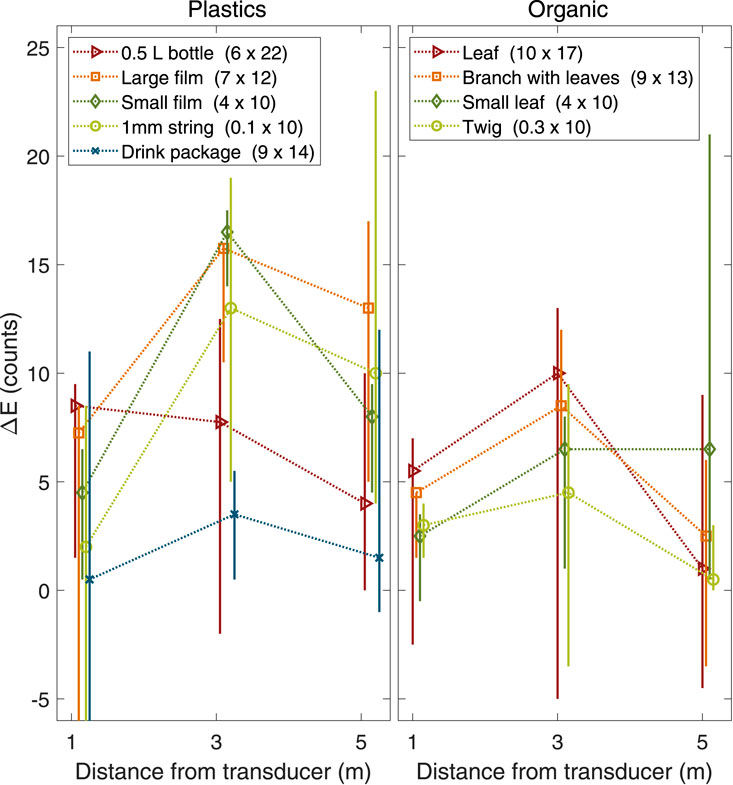
FIGURE 3. Difference in echo intensity with the background (ΔE) of items tested in the semi-controlled environment. The bars show the complete range of ΔE over 5 repetitions done for each item. The markers indicate the median value of these repetitions. The y-bar is cut off at −5 counts, other negative values are found for the large film (−76.5 counts), 1 mm string (−74.5 counts) and drink package (−74 counts).
Similar to the basin tests, no distinct relation between item size and echo intensity can be seen. The drink package with aluminium layers is the weakest scatterer, regardless of the distance at which it is placed. For this item, the variation between repetitions is particularly large. No relation between item characteristics and the variation between repetition is seen during this experiment. Organic material has a similar ΔE range as plastics but is mostly found in the lower half of the plastic range.
3.3 Field test in a river
During the field test, around 2,500 items were collected in the net (Figure 4). About 96% of these items were organic plant material, being mostly small pieces of leaves (5–10 mm). The rest of the items consisted of plastic items (109 in total). Most of the plastic items were classified as relatively small (5–25 mm) pieces of soft and hard plastic or thin chords. With a threshold for detection of 3 σ above the background noise, the estimated amount of items based on the ADCP data (between 13 and 16.3 items per m2 per minute) is of the same order of magnitude as the net based count (15.6 items per m2 per minute). With this threshold, 88% of the items of the controlled test would have been detected.
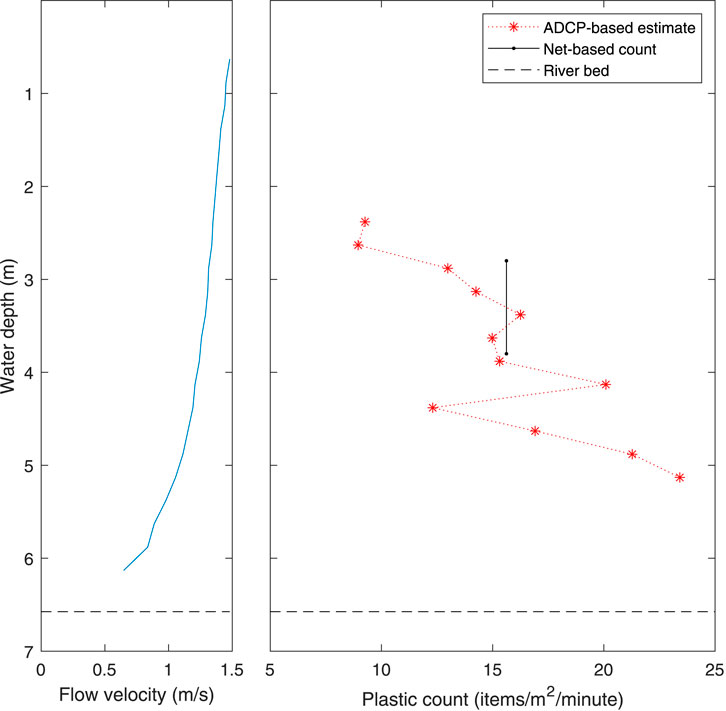
FIGURE 4. Vertical profile of flow velocity magnitude (left) and the estimated transport rate of suspended items, calibrated on net-based measurements (right).
4 Discussion
In this paper, we show the potential of ADCP echo for suspended macroplastic flux monitoring. To improve the robustness of the monitoring method, some improvements are needed. First, more understanding of the echo intensity signature of items will help improve item recognition. The ADCP is chosen for this study because it is widely used, providing the potential for immediate implementation upon the development of a method. The studies of Broere et al. (2021) and Flores et al. (2022) have already shown that different echo sounders bring other possibilities for plastic detection, depending on device characteristics. Also, yet to be explored devices that use multiple frequencies at the same time may give new opportunities for improvement of item recognition. Lastly, repetition of field tests is key. This allows for the development of a method that works under the different conditions found in the open water system.
4.1 The echo of macroplastics
With the controlled test, we showed that the selected items could be detected using ADCP echo. Items could be detected irrespective of variation in the distance from the transducer, size, material and/or orientation of the items. The relatively low echo intensity at 1 m found for some of the items might be explained by the small beam size (8.2 cm diameter) of the StreamPro ADCP at the first measurement point, which challenged the placement of items in the beam. When thinking about the implication of the results for a field application, we see few problems. The tests show that there is no indication that a correction for the side lobe has to be done. We see furthermore indications that part of the signal can travel through the plastics, allowing for the detection of items shadowed by other items closer to the transducer. The second echo found for some of the larger items may lead to overestimation of the item count. As in nature no hard walls are present, this effect is expected to be minor or non-existent.
Although detection is possible, recognition of item type based on the echo intensity alone is still challenging. Especially when taking into account the variation in echo intensity between repetitions, most items fall within the same range of magnitude. The echo intensity depends on size, form, density and roughness of a surface, its similarity to the wavelength of the signal, and the beam coverage. As most of these characteristics may differ between repetitions, due to, for example, deformation, the increasing or decreasing effect of either of these characteristics may compensate for one another. This might explain why echo intensity varies more between repetitions of the same item than when changing specific characteristics of the same item.
To improve the recognition of item type, more fundamental research is needed. Similar to our results, Broere et al. (2021) and Flores et al. (2022) found overlap in the echo intensity of items during the test with, respectively, a fish finder and an ARIS. They did, however, show the potential for recognition during the controlled test, as the reflections in the signal of the fish finder increased with item size. One of the main differences with the study of Broere et al. (2021) is that they considered moving items. This allows for the analysis of the signature a moving item causes in the echo. An ADCP test with flowing items with a small time interval between acoustic signals and a smaller cell size may give a more detailed image of the material type of the detected items. Adding item recognition on top of detection could give better insight into the sources of plastic pollution.
4.2 Detection in the field
The semi-controlled experiments proved that most of the selected items can also be detected in a natural environment. The difference in echo intensity between items and the background is lower compared to the basin test. This may be related to the different scaling of the ADCPs, a higher background signal caused by the other scatterers present in the natural environment (flora and fauna) and the unforeseen air bubbles due to a drain. The water was furthermore turbid, making it difficult to determine when an item is placed inside the beam correctly. The items might not have been placed correctly when the echo intensity value is smaller than the median background echo intensity. Specifically the low echo intensity at 1 m distance from the ADCP may be caused by the disturbances from the near field of the ADCP, resulting in an even higher background noise close to the device.
As for the controlled environment, it would be useful to do a test with moving plastics similar to Broere et al. (2021). The relevant environment would be best approached by performing this test near and/or in the main channel of a river. More items varying in characteristic can be selected to take into account expected processes like item movement, orientation and fragmentation. The possible indication of a depth dependency for detection, seen as the items are best detected at 3 m from the transducer, should also be further investigated in the test. This test may then give the best insight into the echo characteristics of plastics compared to other materials in the field.
4.3 Monitoring macroplastic transport
In this paper, we present a simple threshold-based detection method intended to show the potential of monitoring the transport of suspended macroplastics using ADCPs. This method has only been applied to very limited data. Firstly, the presented test was performed on a limited range of the water column. An extensive test with nets on different depths would make it possible to assess the method on the full range from transducer to river bed. For example, Blondel and Buschman (2022) and Broere et al. (2021) have shown that plastic amount varies over the depth and width of the river, making it relevant to study if the method works well for all locations in the cross-section. The river conditions may furthermore vary depending on location and season. This has implications for the flow velocity and fraction of organic matter to plastics. The presented results are only based on one measurement, where calibration of the threshold on the net measurements and validation have been done with the same data. Repeating the test under different conditions is therefore necessary to assess the sensitivity of the calibration of the threshold. This can be done by using part of the gathered data for calibration and validating the calibration with the rest of the data.
Not only testing of the method under different conditions but also improvement of the simple threshold-based method is needed to come to robust monitoring. In the presented method, we have made multiple assumptions that may not hold under different conditions. Depending on flow velocity, items may reside more than one time step in the beam. Our assumption that every cell reaching an echo intensity above the threshold correlates with an item is then no longer valid. It is also possible that in other seasons, countries or rivers where the fraction of plastic is higher, multiple items are present in one cell at a time. In the controlled test, no indication of an increase in echo intensity was found when adding two items. It should be tested how the echo behaves in a natural environment when a conglomerate of plastic might be detected. Lastly, Artificial Intelligence might improve the recognition of items, using approaches similar to the visible plastics (van Lieshout et al., 2020). A combination of fundamental advancement and more field testing is needed for the development of a functional monitoring method.
4.4 Instrument choice
For this study, we have chosen to work with ADCPs. ADCPs are available with a range of specifications like frequency, cell size, amount of beams and mounting options. Depending on these specifications, certain ADCPs might be best suited for the detection of specific items (types). As discussed before, there is some indication that items with a size similar to the frequency of the signal might reflect stronger. ADCPs with a higher frequency may thus be more suited for the detection of smaller items. Similarly, a smaller cell size would enable a more detailed view of items. Calibration of all ADCP beams may furthermore extend the monitored area, as the beams all look through a different part of the water column. This study serves as a first exploration of the detection of plastic items using ADCP echo, using three different devices in three different environments. We show that all three ADCPs could be used to detect plastic items, but more research using various types of ADCPs in the same environment is needed to find an optimal ADCP set-up for field monitoring.
Although the purchase price of ADCPs is high (around 30k euros), a broad network of (continuously measuring) ADCPs already exists. In the Netherlands, Rijkswaterstaat has a measurement network of 5 fixed horizontal ADCPs and 6 locations where regular vertical measurements are taken. The data collected, used to make, for example, river discharge estimates, can also be used to estimate the suspended plastic transport, assuming ratios of plastics and other items found during net measurements. This way, ADCPs could provide simultaneous flow velocity (or discharge), sediment concentration and plastic transport estimates. Allowing for the analysis of the relations between hydrodynamic conditions and plastic transport.
The present limitations of ADCPs include the loss of information at about 0.5–1.5 m near the ADCP and the lowest 6% near the bed due to interference. The presented method is also only suited for order of magnitude estimates. This, however, fits quite well within the current riverine plastics monitoring strategy (Vriend et al., 2020). Floating plastics are already measured by current monitoring methods (Geraeds et al., 2019; van Emmerik et al., 2018; van Emmerik et al., 2020; van Lieshout et al., 2020). The certainty of an order magnitude of the method is furthermore comparable to that of methods like visual counting (van Emmerik et al., 2022b). The presented ADCP method thus has the potential to fill in the blank spot below the visible floating plastics and complete the total riverine plastic transport estimate.
5 Conclusion
ADCP echo can be used to detect suspended macroplastic. This study showed that 25 items varying in form and material could be detected in different orientations and at multiple distances from the transducer in a controlled environment. Even 0.2 mm thin cords and items placed in series resulted in a substantial increase in the echo intensity. A semi-controlled field test verified that most items can also be detected in a natural environment. The coupling of echo intensity with item characteristics (size, material and orientation) still presents a challenge. For a field test, we developed a simple threshold-based detection method using the plastic count from the net measurement. With this method, we showed that ADCP data can be calibrated towards a correct order of magnitude estimate of plastic transport. To create a robust monitoring method, more fundamental knowledge on the echo of items under flowing conditions, analysis of the sensitivity of the calibration and repetitions under different conditions are needed. When developed, this method could be applied to the already available measurement network of ADCPs, enabling long-term continuous or cross-sectional estimates of suspended plastic transport alongside the current flow and suspended sediment concentration measurements. The application of the method on historical data sets may even enable the reconstruction of trends. These new insights may help in planning better prevention and reduction strategies.
Data availability statement
The datasets presented in this study can be found in online repositories. The names of the repository/repositories and accession number(s) can be found below: 10.4121/f1f0fdec-d8e0-452a-af79-31953587bb47.
Author contributions
Conceptualisation: FB, TvE, BV, and AB. Methodology: FB and AB. Data collection: FB, SB, and AB. Data analysis and visualization: FB and AB. First draft: AB. All authors contributed to the article and approved the submitted version.
Funding
This work is supported by the European Commission project MAELSTROM (H2020-FNR-2020-1- REA, Project ID: 101000832). The work of TvE is supported by the Veni research program The River Plastic Monitoring Project with project number 18211, which is (partly) funded by the Dutch Research Council (NWO).
Acknowledgments
This paper is based on the MSc internship “Towards automated estimation of underwater macroplastic concentration using acoustic backscatter.” The data collection in the harbour was done in collaboration with Nortek, for which we are thankful. We want to give a special thank you to Jan-Willem Mol and Margriet Schoor for organising and sharing the data of the river test.
Conflict of interest
The authors declare that the research was conducted in the absence of any commercial or financial relationships that could be construed as a potential conflict of interest.
Publisher’s note
All claims expressed in this article are solely those of the authors and do not necessarily represent those of their affiliated organizations, or those of the publisher, the editors and the reviewers. Any product that may be evaluated in this article, or claim that may be made by its manufacturer, is not guaranteed or endorsed by the publisher.
Supplementary material
The Supplementary Material for this article can be found online at: https://www.frontiersin.org/articles/10.3389/feart.2023.1231595/full#supplementary-material
Supplementary Figure S1Difference in echo intensity with the background (ΔE) of items placed in different rotations relative to the ADCP transducer.
Supplementary Figure S2Difference in echo intensity with the background (ΔE) of items placed in the ADCP beam either alone or in series.
Supplementary Figure S3Difference in echo intensity with the background (ΔE) of items placed on different distances perpendicular from the main lobe. Measurements start at the side wall of the basin, moving until the main lobe located at the middle of the measurement duration (between 00:30 and 01:00 minute) and back to the basin wall.
Supplementary Figure S4Item selection for the semi-controlled test. Dimensions (width x length) are given in cm.
Supplementary Figure S5Item selection for the controlled test. Dimensions (width x length) are given in cm.
References
Blondel, E., and Buschman, F. A. (2022). Vertical and horizontal plastic litter distribution in a bend of a tidal river. Front. Environ. Sci. 10, 861457. doi:10.3389/fenvs.2022.861457
Broere, S., van Emmerik, T., González-Fernández, D., Luxemburg, W., de Schipper, M., Cózar, A., et al. (2021). Towards underwater macroplastic monitoring using echo sounding. Front. Earth Sci. 9, 628704. doi:10.3389/feart.2021.628704
Collas, F. P. L., Oswald, S. B., and Verberk, W. C. E. P. (2021). Plastic in de waterkolom van de Boven-Rijn, Waal en IJssel. Verslagen Dierecologie en Fysiologie. 2021-4.
Deines, K. L. (1999). Backscatter estimation using broadband acoustic Doppler current profilers. Tech. Rep. doi:10.1109/CCM.1999.755249
Duncan, E. M., Davies, A., Brooks, A., Chowdhury, G. W., Godley, B. J., Jambeck, J., et al. (2020). Message in a bottle: open source technology to track the movement of plastic pollution. PL0S ONE 15, e0242459. doi:10.1371/journal.pone.0242459
European Comission (2022). Single-use plastics. Available at: https://environment.ec.europa.eu/topics/plastics/single-use-plastics_en (Accessed April 1, 2023).
Flores, N. Y., Oswald, S. B., Leuven, R. S., and Collas, F. P. (2022). Underwater macroplastic detection using imaging sonars. Front. Environ. Sci. 10, 875917. doi:10.3389/fenvs.2022.875917
Geraeds, M., van Emmerik, T., de Vries, R., and bin Ab Razak, M. S. (2019). Riverine plastic litter monitoring using Unmanned Aerial Vehicles (UAVs). Remote Sens. 11, 2045. doi:10.3390/rs11172045
Haberstroh, C. J., Arias, M. E., Yin, Z., Sok, T., and Wang, M. C. (2021). Plastic transport in a complex confluence of the Mekong River in Cambodia. Environ. Res. Lett. 16, 095009. doi:10.1088/1748-9326/ac2198
Hohenblum, P., Frischenschlager, H., Reisinger, H., Konecny, R., Uhl, M., Mühlegger, S., et al. (2015). Untersuchung zum vorkommen von Kunststoffen in der Donau in österreich. Umweltbundesamt.
IISD (2022). Unea launches negotiation of plastic pollution treaty, science body on chemicals. Available at: https://sdg.iisd.org/news/unea-launches-negotiation-of-plastic-pollution-treaty-science-body-on-chemicals (Accessed April 1, 2023).
Lau, W. W. Y., Shiran, Y., Bailey, R. M., Cook, E., Stuchtey, M. R., Koskella, J., et al. (2020). Evaluating scenarios toward zero plastic pollution. Science 369, 1455–1461. doi:10.1126/science.aba9475
Liro, M., van Emmerik, T., Wyzga, B., Liro, J., and Mikuś, P. (2020). Macroplastic storage and remobilization in rivers. WaterSwitzerl. 12, 2055. doi:10.3390/w12072055
Morritt, D., Stefanoudis, P. V., Pearce, D., Crimmen, O. A., and Clark, P. F. (2014). Plastic in the Thames: a river runs through it. Mar. Pollut. Bull. 78, 196–200. doi:10.1016/j.marpolbul.2013.10.035
Oswald, S. B., Ragas, A. M., Schoor, M. M., and Collas, F. P. (2023). Quantification and characterization of macro-and mesoplastic items in the water column of the river Waal. Sci. Total Environ. 877, 162827.
Sassi, M. G., Hoitink, A. J., and Vermeulen, B. (2012). Impact of sound attenuation by suspended sediment on ADCP backscatter calibrations. Water Resour. Res. 48. doi:10.1029/2012WR012008
Tramoy, R., Gasperi, J., Colasse, L., Silvestre, M., Dubois, P., Noûs, C., et al. (2020a). Transfer dynamics of macroplastics in estuaries – new insights from the Seine estuary: part 2. Short-term dynamics based on GPS-trackers. Mar. Pollut. Bull. 160, 111566. doi:10.1016/j.marpolbul.2020.111566
Tramoy, R., Gasperi, J., Colasse, L., and Tassin, B. (2020b). Transfer dynamic of macroplastics in estuaries — new insights from the Seine estuary: part 1. Long term dynamic based on date-prints on stranded debris. Mar. Pollut. Bull. 152, 110894. doi:10.1016/j.marpolbul.2020.110894
Uelhinger, U., Wantzen, K. M., Leuven, R. S., and Hartmut, A. (2009). “The Rhine river basin,” in Rivers of Europe (Elsevier), 199–245. doi:10.1016/b978-0-12-369449-2.00006-0
Valdenegro-Toro, M. (2019). “Deep neural networks for marine debris detection in sonar images,”. Ph.D. thesis.
van Emmerik, T., Kieu-Le, T. C., Loozen, M., Oeveren, K. V., Strady, E., Bui, X. T., et al. (2018). A methodology to characterize riverine macroplastic emission into the ocean. Front. Mar. Sci. 5, 00372. doi:10.3389/fmars.2018.00372
van Emmerik, T., Mellink, Y., Hauk, R., Waldschläger, K., and Schreyers, L. (2022a). Rivers as plastic reservoirs. Front. Water 3, 786936. doi:10.3389/frwa.2021.786936
van Emmerik, T., and Schwarz, A. (2020). Plastic debris in rivers. Wiley Interdiscip. Rev. Water 7, 1–24. doi:10.1002/wat2.1398
van Emmerik, T., Seibert, J., Strobl, B., Etter, S., den Oudendammer, T., Rutten, M., et al. (2020). Crowd-based observations of riverine macroplastic pollution. Front. Earth Sci. 8, 00298. doi:10.3389/feart.2020.00298
van Emmerik, T., Vriend, P., and Copius Peereboom, E. (2022b). Roadmap for long-term macroplastic monitoring in rivers. Front. Environ. Sci. 9, 802245. doi:10.3389/fenvs.2021.802245
van Lieshout, C., van Oeveren, K., van Emmerik, T., and Postma, E. (2020). Automated River plastic monitoring using deep learning and cameras. Earth Space Sci. 7, e2019EA000960. doi:10.1029/2019EA000960
Velimirovic, M., Teunkens, B., Ghorbanfekr, H., Buelens, B., Hermans, T., Van Damme, S., et al. (2022). What can we learn from studying plastic debris in the Sea Scheldt estuary? Sci. Total Environ. 851, 158226. doi:10.1016/j.scitotenv.2022.158226
Vermeulen, B., Sassi, M. G., and Hoitink, A. J. (2014). Improved flow velocity estimates from moving-boat ADCP measurements. Water Resour. Res. 50, 4186–4196. doi:10.1002/2013WR015152
Vriend, P., Roebroek, C. T., and van Emmerik, T. (2020). Same but different: a framework to design and compare riverbank plastic monitoring strategies. Front. Water 2, 563791. doi:10.3389/frwa.2020.563791
Keywords: echo sounding, underwater acoustics, hydrology, pollution, litter, transport, hydrodynamics
Citation: Boon A, Buschman FA, van Emmerik THM, Broere S and Vermeulen B (2023) Detection of suspended macroplastics using acoustic doppler current profiler (ADCP) echo. Front. Earth Sci. 11:1231595. doi: 10.3389/feart.2023.1231595
Received: 30 May 2023; Accepted: 13 October 2023;
Published: 23 November 2023.
Edited by:
Lei Wang, Chinese Academy of Sciences (CAS), ChinaReviewed by:
Kyungsik Choi, Seoul National University, Republic of KoreaElda Miramontes, University of Bremen, Germany
Copyright © 2023 Boon, Buschman, van Emmerik, Broere and Vermeulen. This is an open-access article distributed under the terms of the Creative Commons Attribution License (CC BY). The use, distribution or reproduction in other forums is permitted, provided the original author(s) and the copyright owner(s) are credited and that the original publication in this journal is cited, in accordance with accepted academic practice. No use, distribution or reproduction is permitted which does not comply with these terms.
*Correspondence: Anouk Boon, YS5ib29uMUB1dS5ubA==
†ORCID:Anouk Boon, orcid.org/0009-0001-9243-760X; Tim H. M. van Emmerik, orcid.org/0000-0002-4773-9107