 Dehua Chen1,2,3*
 Yongcheng Jiang
95% of researchers rate our articles as excellent or good
Learn more about the work of our research integrity team to safeguard the quality of each article we publish.
Find out more
ORIGINAL RESEARCH article
Front. Earth Sci. , 06 September 2023
Sec. Atmospheric Science
Volume 11 - 2023 | https://doi.org/10.3389/feart.2023.1230879
This article is part of the Research Topic Observation Characteristics and Formation Mechanisms of Severe Weather Events View all 13 articles
Based on Doppler Weather radar observations and numerical simulations applying the Weather Research and Forecasting (WRF) system, this study focused on the rapid intensification (RI) of Typhoon “Mekkhala” (2006) in the inshore area in 2020. The simulated track of the typhoon relatively matched with the observation, with a slight eastward bias compared to the observed track. During the phase of RI, there was a slight weakening of vertical wind shear between 200–500 hPa. The temporary decrease in vertical wind shear became a favorable factor for the intensification of the typhoon. In general, vertical wind shear of the lower atmosphere is the key to supporting the RI of Typhoon Mekkhala. In the middle troposphere, the southward component of the vertical wind shear suddenly increases, indicates that the inflow of southern wind to the core of the typhoon had strengthened. Thus, the strengthening of the moisture transport by enhanced southern wind, contributed to the intensification of the typhoon. During the intensification of the typhoon, the low-level vorticity was significantly enhanced, and the high vorticity values expanded from the lower to higher troposphere. The vertical distribution of vorticity transformed from symmetry to asymmetry. The development of secondary circulation on both sides of the typhoon is a dynamic factor for intensification.
China is one of the countries most severely affected by tropical cyclones (TC) in the world. Statistical research shows that an average of 16% of TCs moving towards the Chinese coast rapidly intensify, and the sudden intensification or change in direction of TCs in the offshore area is a difficulty in TC forecast. Such TCs often cause serious wind and rain disasters due to sudden changes, resulting in unavailing precautionary measures or inadequate emergency response plans.
South China Sea typhoons refer to typhoons that occur in the central and eastern parts of the South China Sea (12°-20°N, 90°-120°E). They develop quickly, have a relatively short life cycle, and have high intensity and track uncertainty. The time left for the meteorological department to provide services is relatively short compared to typhoons in the Western Pacific. Especially for typhoons that suddenly intensify shortly before landing, the forecasting difficulty is extremely high, and the lead time and predictability are very limited. Therefore, it poses great difficulties for disaster prevention and reduction. Typhoon “Mekkhala” (2006) was generated in the South China Sea and rapidly intensified in the offshore area, landing on the south coast of Fujian, causing varying degrees of damage to the southern part of Fujian Province. In Fujian province, China, a total of 56,000 people were affected, with 17 houses collapsed and 43,000 people urgently evacuated. The crop damage was 8,100 ha, causing a direct economic loss of 610 million yuan.
With the effective assimilation of multiple observation data, improvement and optimization of numerical modeling framework, and development of ensemble forecasting, the accuracy of intensity and track forecasting of tropical cyclones (TC) has been continuously improving. However, the progress in improving the accuracy of intensity change forecasting through numerical modeling has been slow (Liu et al., 2006; Yang et al., 2017). Numerical forecasting initial fields for TC vortex structure characteristics and sub-grid physical parameter description is still not clear and accurate enough, and there is a large uncertainty. Furthermore, there is still insufficient understanding of the physical process and intensity change organization feedback of TC. In addition, the lack of observations at sea, particularly for the physical mechanisms of intensity and track changes in TC, poses significant challenges for forecasting these types of TC. For example, the forecasting of nearshore abrupt changes in South China Sea landing TCs faces significant challenges. Rapid intensification (RI) of TCs as an important phenomenon of TC intensity change is a major scientific issue and focus of routine operation in the current international TC research field (Duan et al., 2006).
Many scholars have conducted extensive research on nearshore TC intensification through theoretical studies, observational analysis, and numerical simulations, which has given us a better understanding of nearshore TC intensification. Yu and Yao (2006) proposed the criteria (Δp < −7.78 hPa/6 h) for RI, and conducted synthetic analysis and comparative analysis of two groups of TCs with RI and rapid weakening in China’s nearshore regions. They discovered that the location of TCs with RI would not occur in high-latitude areas north of 30°N or in low-latitude areas of 0°–5°N. Relevant studies have indicated that the main factors affecting TC intensity are atmospheric environmental fields, ocean environmental fields, and TC vortex convective activity. These studies have explored the effects of factors such as atmospheric environmental fields (e.g., sea surface temperature, wind shear, and humidity), rainfall rates and rainfall area in the TC nucleus region, severe convection events, and lightning activities on TC RI (Steranka et al., 1986; Kaplan and DeMaria, 2003; Guimond et al., 2010; Harnos and Nesbitt, 2011; DeMaria et al., 2012; Bai and Wang, 2013; Wang and Yu, 2013; Susca-Lopata et al., 2015; Hu and Duan, 2016; Wang et al., 2017; Zhang et al., 2019).
Shou and Yao (1995) conducted diagnostic analysis of the synthetic environmental field for explosively developing TCs and found that during explosive development, low-level convergence and upper-level divergence both increase. Xia et al. (1995) stated that non-adiabatic heating is an important factor affecting TC intensity change. Yu and Wu (2001) believed that there was a close relationship between the interaction between the environmental flow field in the upper atmosphere and TC outflow and the sudden intensification of TCs before landing in China’s nearshore regions, and that strong southwest monsoon water vapor transport is a precursor condition for sudden strengthening before TC landing in southern China, and that the development of tilted vortices is the cause of the RI of TCs. Liang et al. (2003) conducted diagnostic analysis on the nearshore intensified TC “Vongfong” and found that the strong development of “Vongfong” before landing was related to the invasion of cold, dry air from the northern small stream that led to the strengthening of potential instability. Hu et al. (2005) used NCEP/NCAR reanalysis data to conduct large-scale analysis of TCs with rapidly weakening and rapidly strengthening before landing in the southern regions of China, and the research revealed that the TCs with RI were located in the south of the subtropical high, and that low-level convergence and high-level divergence were strong. Yu et al. (2008) analyzed the characteristics and mechanisms of RI of TC “Saomai” in China’s nearshore regions using NCEP/NCAR reanalysis data. Gao et al. (2012) found that the strengthening and enrichment of middle and lower level water vapor inflow, strong lower level convergence, upper level divergence, and weak vertical shear are closely related to the diagnosis and discovery of Typhoon “Meranti” near the sea. Zhang et al. (2019) suggested the RI process of Typhoon “Hato” is exerted by a convection and vortex coupled environment.
Previous studies have shown that several factors mainly lead to TC intensitification, including atmospheric environmental field, ocean environmental field, and convection activities within typhoon vortex. Observational and numerical simulation studies have shown that the environmental field plays an important role in the RI of TC (Merrill, 1988; Wang and Wu, 2004; Kelley et al., 2004; Kelley et al., 2005; Vigh and Schubert, 2009; Wang and Yu, 2011; Zagrodnik and Jiang, 2014; Yin et al., 2015). Environmental fields such as higher sea surface temperature, thicker ocean mixed layer, lower vertical wind shear, higher relative humidity in the lower layer of the atmosphere, conditionally unstable atmospheric, large-scale upper-level divergence and lower-level convergence are conducive to the RI of TC (Simpson et al.,1998; Rogers, 2010). Kaplan et al. (2010) believe that effective forecasting of RI of TC can be achieved using only large-scale environmental field parameters. Hendricks et al. (2010) discovered that the sea surface temperature and other environmental parameters that control the intensity changes of TC during RI are very similar to those during slow intensification, indicating that the rate of TC strengthening may be related to internal processes rather than environmental fields.
Therefore, this paper intends to conduct research on the environmental characteristics and major possible influencing factors of the sudden intensitificaiton of Typhoon “Mekkhala” near the landing site through observations and numerical simulations, and to reveal the possible mechanism of the RI of “Mekkhala” in the inshore area before landing.
The typhoon track data used in this study were obtained from the collections of best track data, released by Shanghai Typhoon Institute, China. The surface meteorological automated observations from Chinese National Meteorological Information Center (http://data.cma.cn/). The Base Reflectivity data of Doppler dual-polarization weather radars were observed from weather radar station in Xiamen (at coordinates 119.00°E, 24.49°N).
In this study, the Fujian Weather Research and Forecasting (FJ-WRF) model, which is based on the WRF-ARW version 3.4.1, was used to simulate Typhoon “Mekkhala” (2006). The simulation domain of the FJ-WRF model covers Fujian Province and its surrounding areas, with a central longitude and latitude of 119.632°E and 25.295°N, respectively. The model adopts a single-layer grid with a horizontal resolution of 9 km × 9 km, consisting of a grid size of 300 × 312. In the vertical direction, there are a total of 40 layers, with a model top pressure of 10 hPa. The main parameterization schemes for physical processes include the Lin microphysics scheme, Kain-Fritsch cumulus parameterization scheme, RRTM longwave and Dudhia shortwave radiation schemes, YSU planetary boundary layer scheme, and a 5-layer thermal diffusion land surface scheme (Table 1). The initial and boundary conditions are obtained from the operational analysis and forecast fields of the National Centers for Environmental Prediction (NCEP) Global Forecast System (GFS) model, with a horizontal resolution of 0.5° × 0.5° and a temporal interval of 6 h (https://rda.ucar.edu/datasets/ds083.2/). The simulation started at 14:00 on 10 August 2020 (LST) and integrates for 24 h, with hourly output of the simulation results. In this study, the simulation results from 02:00 to 17:00 on August 11 were analyzed.
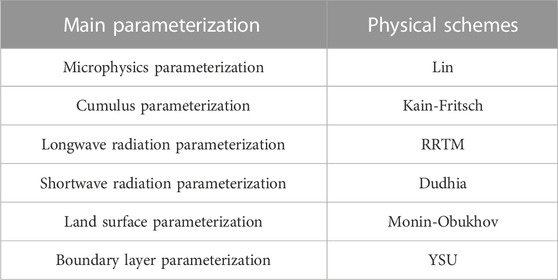
TABLE 1. The main parameterization schemes of the FJ-WRF Model.
Using the output from the FJ-WRF, various variables such as vertical wind shear, water vapor flux, pseudo-equivalent potential temperature, divergence, vorticity, and vertical circulation were calculated. The calculation method of vertical Wind shear is wind vector difference at different heights. For example, the vertical wind shear in 500–850 hPa is the value that subtracting the wind speed at 500 hPa from the wind speed at 850 hPa. This analysis aimed to examine the mesoscale evolution characteristics of lower-level dynamic lifting, thermal disturbance, water vapor disturbance, as well as the vertical structures of water vapor, dynamics, and thermodynamics in the mid-high levels during the RI phase of Typhoon “Mekkhala.” The study also aimed to investigate the impact mechanisms of positive feedback on the RI of Typhoon “Mekkhala.”
Figure 1 presents the track, maximum wind speed, and minimum atmospheric pressure evolution of Typhoon “Mekkhala”. “Mekkhala” originated in the South China Sea on August 10th at 11:00 a.m. (Beijing time, hereafter referred to as local time). After formation, it steadily moved towards the north with a relatively fast speed, gradually intensifying in strength. By 17:00, it had strengthened into a severe tropical storm with a decrease in atmospheric pressure from 998 to 985 hPa, the variation of pressure in 6 h (Δp6) was −13 hPa, greatly exceeding the RI standard of −7.78 hPa from Yu and Yao (2006). The wind speed increased from 18 to 25 m/s. At 06:00 on the approaching landfall day, it further intensified into a typhoon, with the atmospheric pressure further dropping to 980 hPa (Δp6 = −5 hPa) and the wind speed further increasing to 33 m/s. Over the next 12 h, the wind speed continued to strengthen by an additional 8 m/s. This indicates that Typhoon “Mekkhala” experienced a sudden intensification from its formation until just before landfall. At 07:30, it made landfall along the coastal areas of Zhangpu County, Fujian Province, maintaining its intensity category as typhoon with a central pressure of 980 hPa and maximum near-center wind force of 33 m/s. This intensity was consitent with the result of the new evaluation method developed in Howell et al. (2022). After landfall, “Mekkhala” continued to move northwestward, rapidly weakening in intensity. By 14:00, it had weakened into a tropical depression within Liancheng County, Fujian Province, and was subsequently declassified by the China Meteorological Administration at 17:00.
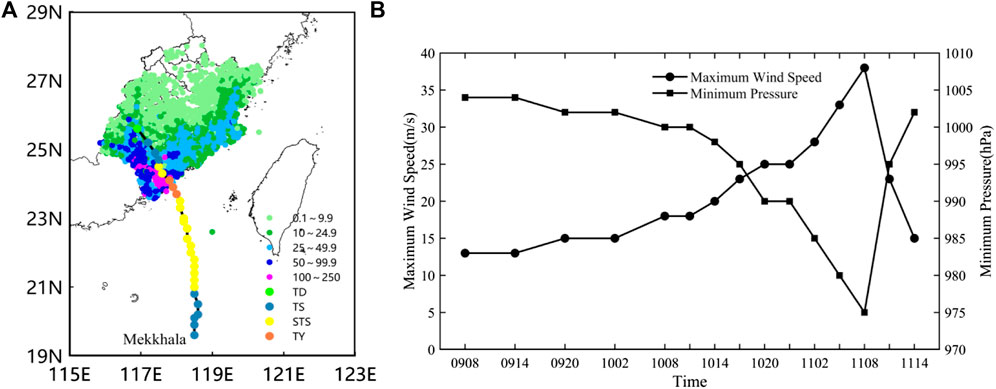
FIGURE 1. (A) Accumulated rainfall in Fujian Province from 20:00 on August 10th to 20:00 on August 11th (unit: mm) and the track of Typhoon “Mekkhala”. (B) Hourly evolution of the maximum wind speed and minimum atmospheric pressure of the Typhoon “Mekkhala” (pressure unit: hPa; wind speed unit: m/s).
As a result of the influence of Typhoon “Mekkhala”, the southern regions of Fujian Province experienced heavy torrential rainfall, particularly over the left side of the typhoon track. The highest recorded precipitation occurred in Zhangpu County, with a rainfall amount of 179.7 mm. The maximum recorded hourly rainfall is 80.3 mm.
Typhoon “Mekkhala” has exhibited the following characteristics since its formation: 1) Nearshore genesis: When “Mekkhala” formed in the South China Sea, it was only 540 km south of Xiamen. 2) Rapid development and intensification near the coast: After formation, it quickly intensified and reached typhoon strength within 3 h before landfall, transitioning from a tropical storm to a typhoon in just 19 h 3) Stable track: After formation, it maintained a stable northward trajectory, directly heading towards the coastal areas of southern Fujian. Moreover, it had a fast movement speed, taking less than 21 h from formation to landfall, with a total lifespan of only 27 h 4) Small size and high intensity: Upon landfall, it remained at typhoon intensity (33 m/s), with a radius of maximum winds of only 30 km “Mekkhala” belongs to the rare category of rapidly intensifying small-scale typhoons near the coast, characterized by a short lifespan, posing significant challenges for forecasting and defense efforts.
Typhoon “Mekkhala” exhibited significant asymmetric characteristics, with the strong echo of the inner core mainly distributed in the fourth quadrant. The impact of “Mekkhala” on southern Fujian can be divided into two stages. From 00:00 to 06:00 LST, the typhoon moved predominantly in a northward direction, approaching the coastal areas of southern Fujian. During this period, the southern Fujian region was mainly affected by the outer rainbands, resulting in precipitation. The outer rainbands had a narrow strong echo region, fast movement speed, and short duration, resulting in relatively minor rainfall. At 06:00, “Mekkhala” intensified to typhoon strength and continued to approach the southern coastal areas of Fujian. During this stage, the southern Fujian region was influenced by the inner core region, leading to the occurrence of heavy precipitation. The inner rainbands had a wider strong echo region and a longer duration, with impacts on Xiamen continuing even after “Mekkhala” made landfall. After landfall, the eye gradually filled, and the asymmetric characteristics changed, with the strong echo region shifting to the third quadrant. After 11:00, Mekkhala weakened to a tropical storm and gradually moved away from southern Fujian (Figure 2). The wind speed near the center of Typhoon “Mekkhala” also exhibited significant asymmetric characteristics before landing (Figure 3). The relatively strong radial velocity was located at southern and eastern part of typhoon, and the maximum speed of radial velocity exceeded 60 m/s during RI stage.
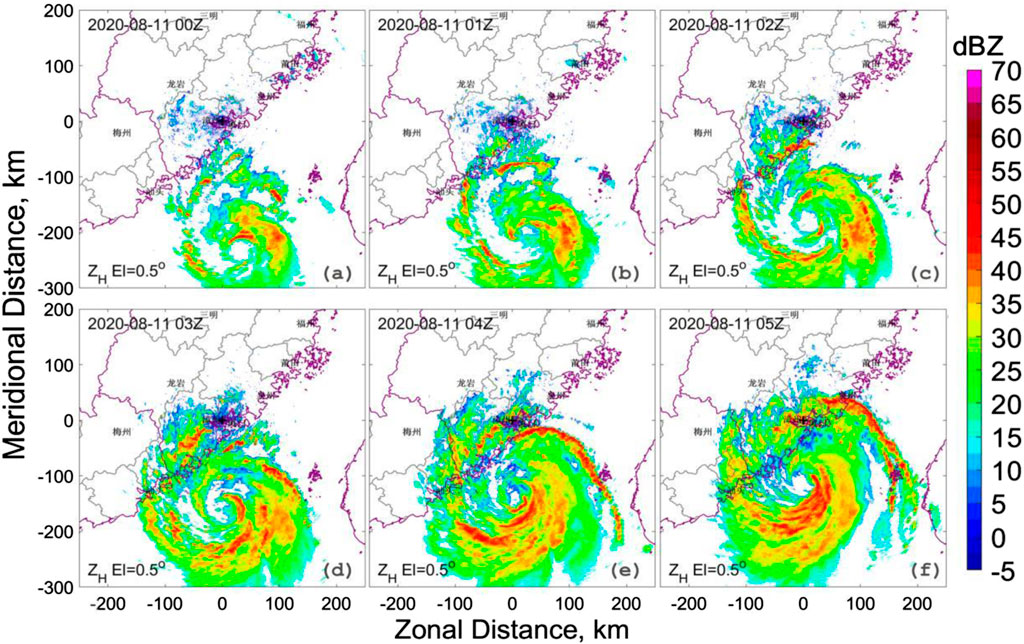
FIGURE 2. Radar reflectivity (dBZ) at 0.5° elevation of the Xiamen dual-polarization radar from 00:00–05:00, August 11 during the peripheral impact stage of Typhoon “Mekkhala”.
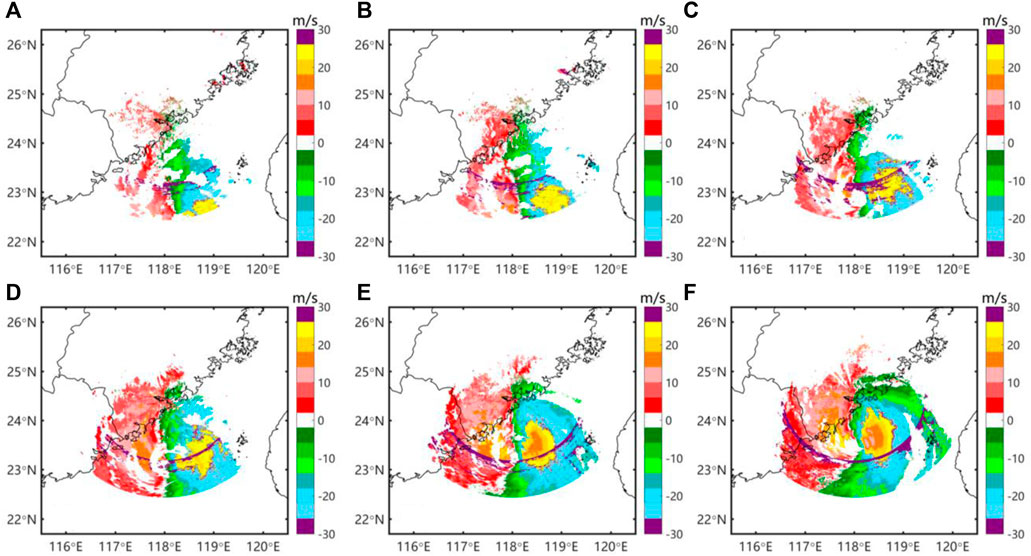
FIGURE 3. Radial velocity (m/s) at 0.5° elevation of the Xiamen dual-polarization radar from 00:00–05:00, August 11 during the peripheral impact stage of Typhoon “Mekkhala”.
Figure 4 shows the evolution of maximum radial velocity at 0.5°, 1.5°, and 2.4° elevations during landfall (02:58–10:41, August 11). From 3:00, the velocity field from the dual-polarization radar showed a significant enhancement of velocities around the eyewall at a 1.5° elevation. Later, a clear enhancement was observed at a 0.5° and 2.4° elevations at 3:50 and 4:08, respectively. The enhancement of velocity lasted 4 h at different levels before landfall. At a 1.5° elevation, enhancements are observed around the eyewall and the eastern side of the typhoon. At a 2.4° elevation, wind speed of eyewall enhanced (Figure 5).
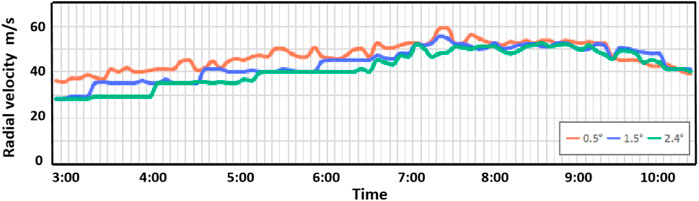
FIGURE 4. Evolution of maximum radial velocity at 0.5°, 1.5°, and 2.4° elevations during landfall (02:58–10:41, August 11).
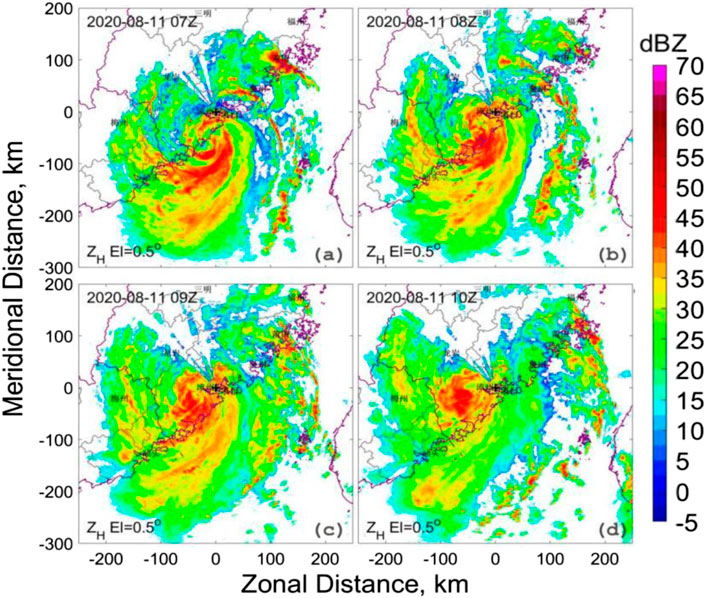
FIGURE 5. Radar reflectivity (dBZ) at 0.5° elevation of the Xiamen dual-polarization radar from 07:00–10:00, August 11 during the inner impact stage of Typhoon “Mekkhala”.
During the outer rainband impact stage, there were two main periods of rainband influence. As shown in Figure 6, during the rainband impact at 03:44, the rainband exhibited a southwest-to-northeast orientation, with multiple convective cells within the rainband. The region with reflectivity greater than 35 dBZ extended vertically from below 2 km–6 km. The differential reflectivity was generally small (<1 dBZ), indicating that the precipitation below the freezing level was mainly composed of moderate to light raindrops.
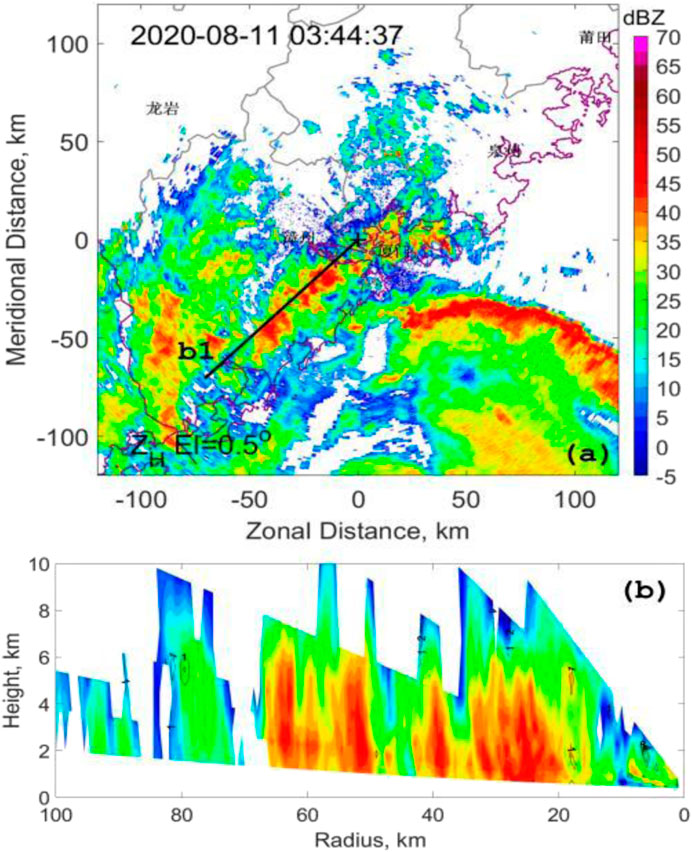
FIGURE 6. Rainfall process during the impact of outer rainband, (A) Xiamen dual-polarization radar reflectivity at a 0.5° elevation, (B) Vertical cross-section along the b1, with reflectivity as the color fill and differential reflectivity as the contour lines.
The second period of outer rainband impact occurs around 04:30, as shown in Figure 7. Compared to the previous rainband, this one had a longer length. In Figures 7B,C, the region with reflectivity greater than 35 dBZ extended vertically to 6 km, and a large differential reflectivity area (>2 dBZ) appeared between 4 km and 6 km, indicating the presence of large raindrops generated by the melting of ice particles in the mid to upper levels.
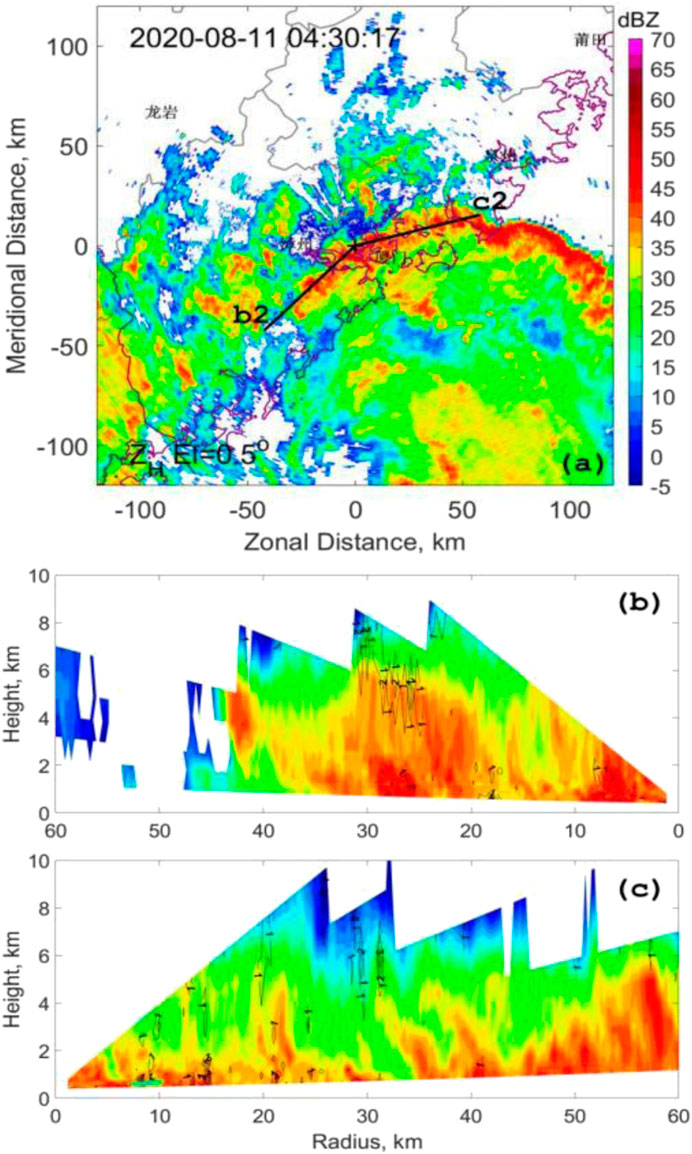
FIGURE 7. Rainfall process during the second outer rainband impact, (A) Xiamen dual-polarization radar reflectivity at a 0.5° elevation, (B) Vertical cross-section along the b2, (C) Vertical cross-section along the c2, with reflectivity as the color fill and differential reflectivity as the contour lines.
During the inner rainband impact, the shoreside rainband showed a significant enhancement compared to former stage. In Figures 8A, B significant high differential reflectivity area was observed below 2 km, indicating the presence of a larger number of large raindrops in the lower levels of the inner rainband. In Figure 8C, during the initial stage of “Mekkhala” landfall, the intensity and orientation of the inner rainband maintained, and the width of the rainband was large. In Figure 8D, the morphology of large raindrops in the lower levels was maintained.

FIGURE 8. (A–C) were reflectively at a 0.5° elevation at 07:15 and 08:01 respectively (during landfall), observed by Xiamen Doppler Radar. (B–D) were vertical cross-section along the b3 and d3, with reflectivity as the color fill and differential reflectivity as the contour lines.
After landfall, significant changed occur in the asymmetric characteristics, with the southern and especially southwestern sides became the center of strong echoes. Comparing Figure 9C with Figure 9A, the range of strong echoes narrowed, and the inner rainband weakened. In Figures 9A, B high reflectivity value was observed at lower levels, but no corresponding high differential reflectivity was observed at upper levels, indicating that the intense precipitation might be caused by the warm rain process during the raindrop fall. In Figures 9A, D significant melting layer was observed at a range of 60–80 km, which corresponds to the edge of the terrain area, suggesting that intense precipitation might be influenced by the topography.
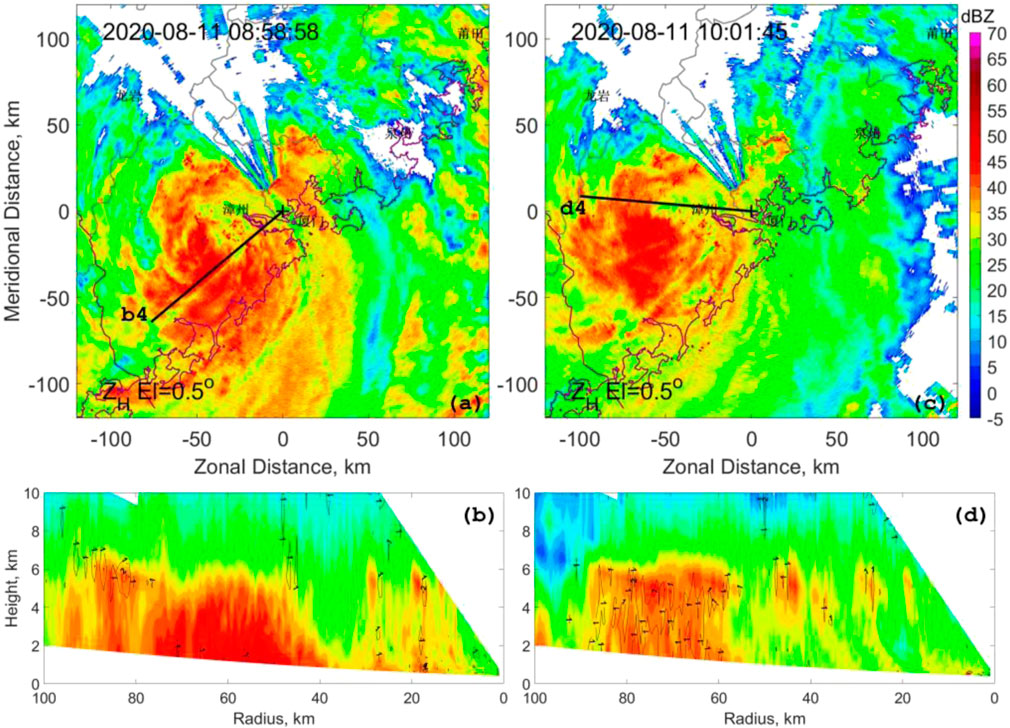
FIGURE 9. (A–C) were reflectivity at a 0.5° elevation at 08:58 and 10:01 respectively (after landfall), observed by Xiamen Doppler Radar. (B–D) were vertical cross-section along the b3 and d3, with reflectivity as the color fill and differential reflectivity as the contour lines.
To evaluate the simulation performance of the WRF model for the RI of Typhoon “Mekkhala”, this study simulated the sea-level pressure field, wind field, equivalent potential temperature field, divergence field, vertical velocity field, and other variables during the period when Typhoon “Mekkhala” developed and made landfall (from 03:00 to 14:00 on the 11th).
Figure 10 presents a comparison between the observed and simulated tracks and intensities of Typhoon “Mekkhala”. It can be observed that the simulated track was consistent with the observation, with the simulated typhoon track being relatively close to the observed track, albeit slightly eastward overall. The range of track errors in the simulation is generally small (see Figure 10A). Regarding intensity, the minimum sea-level pressure at the typhoon center was mainly used. Before the typhoon made landfall (from 03:00 to 08:00, August 11), the simulated intensity was slightly weaker compared to the observations, while the observed RI before landfall was more pronounced. Although the model simulated the intensification characteristics of the typhoon, the overall magnitude of intensification was relatively weaker. After landfall, the simulated typhoon intensity was generally stronger compared to the observations, and the simulated weakening speed after landfall was slower.
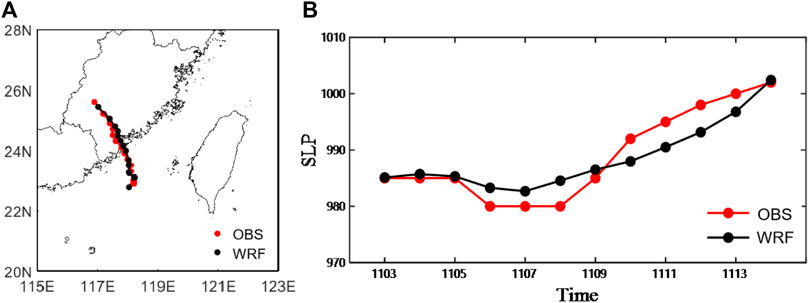
FIGURE 10. (A) Observed (red line) and WRF-simulated (black line) tracks of Typhoon “Mekkhala” from 02:00 to 14:00 on August 11. (B) Observed (red line) and WRF-simulated (black line) minimum sea-level pressure near the Typhoon “Mekkhala” center.
Figure 11 presents the simulated radar reflectivity at 03:00 and 07:00. The structure of simulated and observed radar reflectivity was basically consistent (Figure 11). At 03:00, the maximum reflectivity is observed on the south and southeast sides of the typhoon, greater than 50 dBZ. By 07:00, as the typhoon intensified, the reflectivity also increased. The high reflectivity area extended from the south and southeast sides to the southwest side of the typhoon, with a significantly larger range of values exceeding 50 dBZ. The structural development of the typhoon became more complete. At 03:00, there were few precipitation cloud systems on the northern side of the typhoon, while at 07:00, there was a significant increase in convective cells on the northern side, and the development of the eye of the typhoon became more distinct. This indicated that the model could effectively simulate the phenomenon of RI of Typhoon “Mekkhala”.
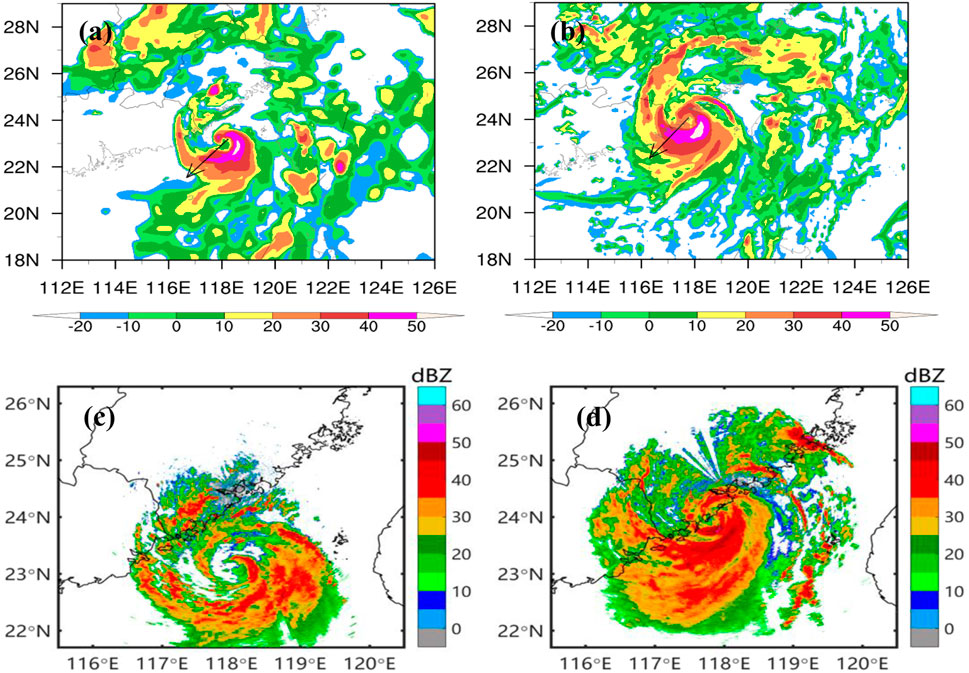
FIGURE 11. The FJ-WRF simulated reflectively factor (dBZ) of Typhoon “Mekkhala” at (A) 03:00, August 11, and (B) 07:00, August 11. The (C, D) were the observed reflectively factor at the same time. The wind arrows located at simulated typhoon center indicate vertical wind shear between 500–850 hPa.
The WRF model is a significant tool for analyzing the fine structure of typhoon, it could be used to study the characteristics of RI of Typhoon Mekkhala. Many previous studies have linked the asymmetry of typhoon to the direction of vertical wind shear inside the typhoon, and linked the change in typhoon intensity to the magnitude of the vertical wind shear inside the typhoon. Considering the signification of vertical wind shear, three types of vertical wind shear were included in the study, The vertical wind shear in the deep atmosphere (200–850 hPa), upper atmosphere (200–500 hPa), and lower atmosphere (500–850 hPa) respectively.
The results show that, compared with the wind shear of the deep and upper atmospheres (not shown), the direction of the vertical wind shear of the lower atmospheres can better indicate the distribution of convection of this unsymmetrical typhoon during its landfall process (Figure 11). It could be observed that the high values of the radar reflectivity were located on the left side of the lower vertical wind shear.
On the other hand, Figure 12 shows the magnitude and direction of vertical wind shear in the deep atmosphere (200–850 hPa), upper atmosphere (200–500 hPa), and lower atmosphere (500–850 hPa). It could be seen that the vertical wind shear in all three atmospheric layers generally follows a trend of increasing and then decreasing. The magnitude of vertical wind shear in the deep atmosphere was mostly above 12 m/s, reaching a maximum of around 18 m/s around 07:00. The magnitude of vertical wind shear in the upper atmosphere ranges between 8–12 m/s, while in the lower atmosphere, it remained around 4 m/s. The relatively lower vertical wind shear in the lower atmosphere in the WRF model played a role in the intensification of the typhoon, consistent with the observations. Lower vertical wind shear could strengthen the organization of typhoon, so that the updraft near the typhoon center could be maintained continuously. Regarding the direction of vertical wind shear between different layers, the wind shear in the lower atmosphere was more northerly compared to the deep and upper atmospheres, mainly in the northwest direction. The northward component of wind shear increased continuously during the development of the typhoon.
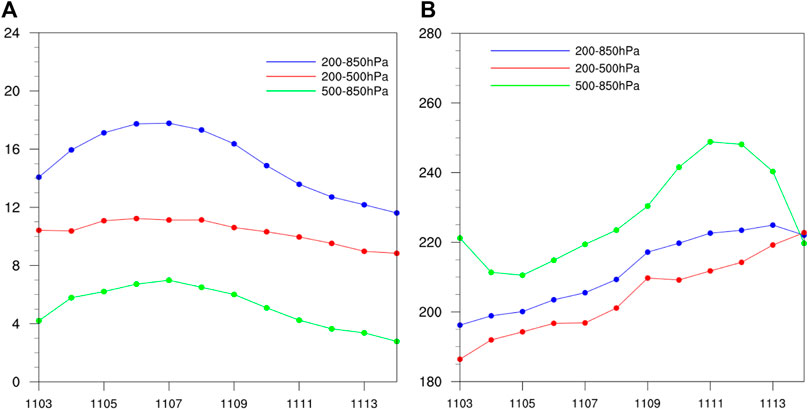
FIGURE 12. The vertical wind shear of Typhoon “Mekkhala” in different levels (200–850, 200–500, and 500–850 hPa) from 03:00–13:00 in August 11, simulated by FJ-WRF. (A) is vertical wind shear speed (m/s) and (B) is vertical wind shear direction.
During the RI stage of the typhoon (03:00–05:00), a slight decrease in vertical wind shear was observed in the 200–500 hPa layer in the model. Based on the small wind shear in the lower atmosphere, the wind shear in the upper atmosphere also weakened. This temporary decrease in vertical wind shear became a favorable factor for the intensification of the typhoon. The southward component of vertical wind shear between 500–850 hPa notably increased, indicating an increase in the southwest airflow’s southward component in the convective layer, which enhanced the transport of water vapor and contributed to the intensification of the typhoon.
Figure 13 shows the simulated results of the 850 hPa wind and water vapor flux field at the intensification period of Typhoon “Mekkhala” (03:00 and 07:00 in August 11). It could be observed that the high-value area of water vapor flux was located on the east of the typhoon at 03:00 and 07:00, but the range of the high-value vapor flux was significantly larger at 07:00. Compared to 03:00, the wind speed within the typhoon circulation was noticeably increased at 07:00, and the transport of water vapor became more significant. At 03:00, the water vapor flux on the south side of the typhoon is around 28–32 g/(ms), while at 07:00, the southward water vapor transport is significantly enhanced, reaching 32–36 g/(ms). This confirms that the strengthening of southwest water vapor transport plays a role in the RI of Typhoon “Mekkhala”. The enhanced water vapor transport could strengthen latent heat releasing in such strong uplift area, thus enhanced warm core structure of typhoon.
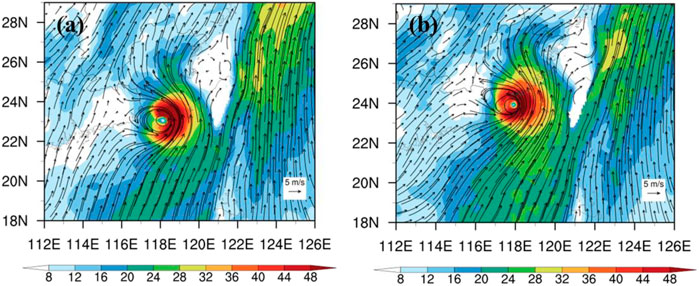
FIGURE 13. The distribution of horizontal wind (arrow vector) and vapor flux (shaded area) at (A) 03:00 and (B) 07:00 in August 11 over Typhoon “Mekkhala” and its surrounding areas, simulated by FJ-WRF.
Figure 14 shows the vorticity field and flow field at 03:00 and 07:00, along the vertical wind shear direction between 500–850 hPa (represented by the black line indicating the typhoon center). It could be seen that vorticity significantly increases before and after the intensification of the typhoon. At 03:00, the high-vorticity area was mainly concentrated below 800 hPa in the lower atmosphere and was relatively symmetric, with intensity reaching about 2×10⁻⁴ s-1. By 07:00, the high-vorticity area expanded to higher levels, reaching 200 hPa, and became more asymmetric, mostly located on the east side of the typhoon, with intensity exceeding 2.5×10⁻⁴ s-1. At 03:00, there was weak secondary circulation on the west side of the typhoon at 300–400 hPa, while at 07:00, the secondary circulation disappeared on the west side, and a new secondary circulation developed at 400–600 hPa on the east side of the typhoon.
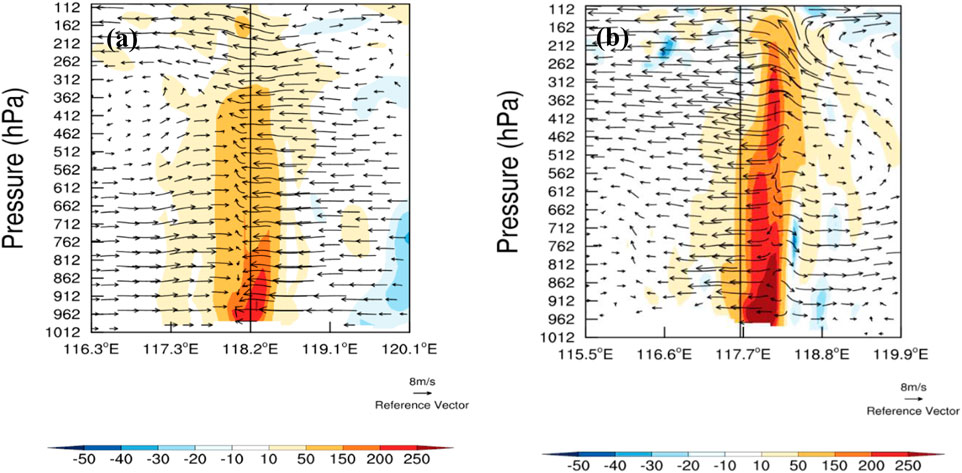
FIGURE 14. The simulated vertical section plane of horizontal wind (arrow vector) and vorticity (shaded area, unit: s-1) along the vertical wind shear direction of 500–850 hPa at (A) 03:00 and (B) 07:00, August 11.
Figure 15 shows the divergence field and flow field at 03:00 and 07:00, along the vertical wind shear direction between 500–850 hPa (represented by the black line indicating the typhoon center). At 03:00, divergence and convergence were mainly concentrated in the lower levels, with divergence layer between 700–900 hPa and intensity of about 3×10⁻⁴ s-1, while convergence layer was below 900 hPa with intensity around −5×10⁻⁴ s-1, all located on the east side of the typhoon center. By 07:00, the divergence and convergence within the typhoon became more significant and extended to the upper levels and the west side of the typhoon. The strongest divergence and convergence on the east side of the typhoon extended to higher levels, with intensity exceeding 5×10⁻⁴ s-1, especially in the convergence layer at around 250 hPa. The divergence and convergence on the west side of the typhoon also developed in the lower levels, with intensity ranging from 3×10⁻⁴ to 4×10⁻⁴ s-1.
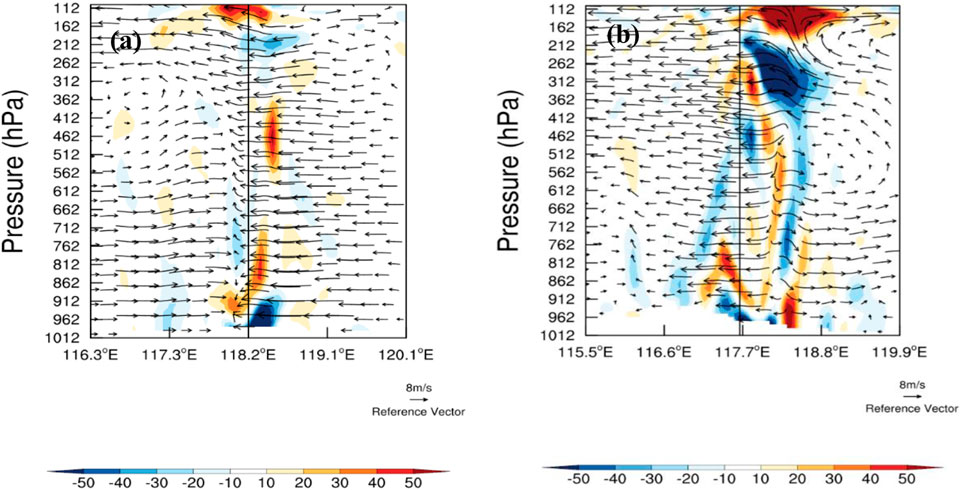
FIGURE 15. The simulated vertical section plane of horizontal wind (arrow vector) and divergence (shaded area, unit: s-1) along the vertical wind shear direction of 500–850 hPa at (A) 03:00 and (B) 07:00, August 11.
Figure 16 shows the distribution of equivalent potential temperature and flow field along the vertical wind shear direction between 500–850 hPa at 03:00 and 06:00. At 03:00, the high-value area of equivalent potential temperature was mainly concentrated below 600 hPa, with values exceeding 370 K. By 07:00, the equivalent potential temperature decreased significantly in the low-level of the typhoon, reaching around 364 K, but increased in the upper levels of 200–400 hPa, from 358 K at 03:00 to around 362 K.
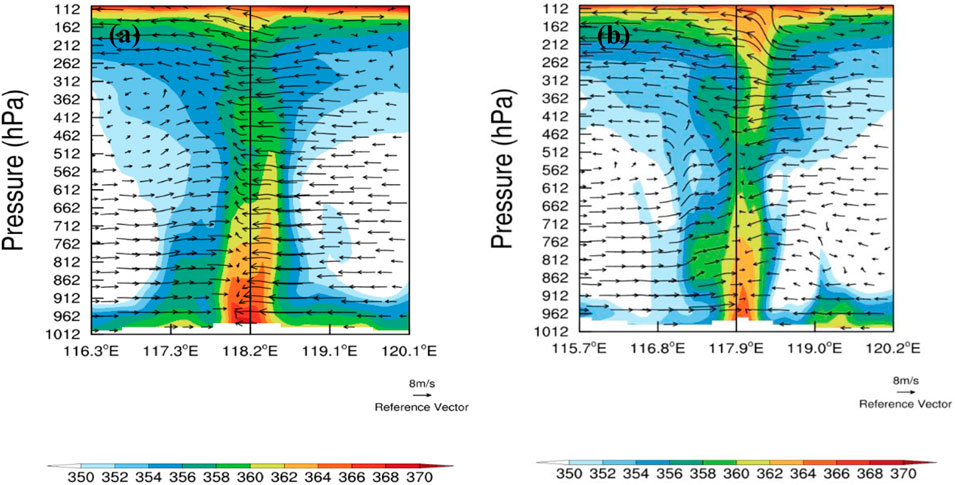
FIGURE 16. The simulated vertical section plane of horizontal wind (arrow vector) and equivalent potential temperature (shaded area, unit: K) along the vertical wind shear direction of 500–850 hPa at (A) 03:00 and (B) 07:00, August 11.
1. The simulated typhoon tracks show good performance, with simulated tracks relatively close to the observed tracks. Overall, the simulated tracks exhibited a slight eastward bias compared to the observations, but the range of simulation errors was generally small. The simulated intensity was slightly weaker than the observed intensity. The RI feature observed before typhoon landfall was more pronounced in the observations, while the simulated intensification, although capturing the strengthening characteristics, was relatively weaker in magnitude. After landfall, the simulated typhoon intensity was generally stronger than the observed intensity, and the simulated decay rate is slower compared to the observations. The simulated radar reflectivity also effectively reproduced the observed phenomenon of increasing typhoon intensity prior to landfall.
2. During the RI phase, there was a slight reduction in vertical wind shear between 200–500 hPa. On the basis of low-level wind shear, the high-level wind shear also weakened to some extent. This temporary decrease in vertical wind shear served as a favorable factor for typhoon intensification. The sudden increase in the southward component of the mid-level vertical wind shear indicated an increase in the inflow of southwest winds into the core of the typhoon in the mid-troposphere. The enhanced transport of water vapor strengthened the moisture flux, thereby favoring typhoon intensification. In general, the direction and magnitude of vertical wind shear of the lower atmosphere (500–850 hPa) indicate the convection distribution and intensity changes of Typhoon “Mekkhala” better.
3. Before and after the intensification of the typhoon, low-level vorticity significantly increased. The high vorticity values were mainly concentrated below 800 hPa in the lower atmosphere and exhibited a relatively symmetric distribution. As the typhoon intensified, the high vorticity area extended to higher levels, reaching 200 hPa, and became more asymmetric, mostly located on the east side of the typhoon. At 03:00, there was weak secondary circulation on the west side of the typhoon at 300–400 hPa, while at 07:00, this secondary circulation disappeared on the west side, and a new secondary circulation developed at 400–600 hPa on the east side of the typhoon. The development of secondary circulation on both sides of the typhoon contributed to the intensification of typhoon intensity.
4. The high values of equivalent potential temperature were mainly concentrated below 600 hPa, with values exceeding 370 K. By 07:00, the low-level equivalent potential temperature decreased significantly to around 364 K, while in the upper levels of 200–400 hPa, it increased from 358 K at 03:00 to around 362 K.
The original contributions presented in the study are included in the article/Supplementary Material, further inquiries can be directed to the corresponding authors.
DC contributed to conception and design of the study. DC, YJ, and XH drafted the manuscript, and discussed the data. AX, HD, and XH contributed to the data collection, analysis, and discussion. All authors contributed to the article and approved the submitted version.
This research was supported by the National Natural Science Foundation of China (42005139 and 41705045), Natural Science Foundation of Fujian Province, China (2022J011082), Major Scientific and Technological Special of Fujian Key Laboratory of Meteorological Disaster (2020TF12). This research was also supported by Marine Meteorology Innovation Team, Xiamen Key Laboratory of Strait Meteorology.
The authors declare that the research was conducted in the absence of any commercial or financial relationships that could be construed as a potential conflict of interest.
All claims expressed in this article are solely those of the authors and do not necessarily represent those of their affiliated organizations, or those of the publisher, the editors and the reviewers. Any product that may be evaluated in this article, or claim that may be made by its manufacturer, is not guaranteed or endorsed by the publisher.
Bai, L., and Wang, Y. (2013). Effect of vertical wind shear on tropical cyclone intensity change. J. Trop. Meteorol. 29 (6), 955–962.
DeMaria, M., DeMaria, R., Knaff, J., and Molenar, D. (2012). Tropical cyclone lightning and rapid intensity change. Mon. Wea. Rev. 140, 1828–1842. doi:10.1175/mwr-d-11-00236.1
Duan, Y., Yu, H., and Wu, R. (2006). Review of the research in the intensity change of tropical cyclone. Acta Meteorol. Sin. 63 (5), 636–645.
Gao, S., Lv, X., Wang, H., and Xu, Y. (2012). An observational and diagnostic analysis on the intensity and intensity changes of typhoon meranti (1010). Meteorol. Mon. 38 (7), 834–840.
Guimond, S. R., Heymsfield, G. M., and Turk, F. J. (2010). Multiscale observations of hurricane dennis (2005): the effects of hot towers on rapid intensification. J. Atmos. Sci. 67 (3), 633–654. doi:10.1175/2009jas3119.1
Harnos, D. S., and Nesbitt, S. W. (2011). Convective structure in rapidly intensifying tropical cyclones as depicted by passive microwave measurements. Geophys. Res. Lett. 38 (7), 1451–1453. doi:10.1029/2011gl047010
Hendricks, M. S., Peng, B. F., and Li, T. (2010). Quantifying environmental control on tropical cyclone intensity change. Mon. Wea. Rev. 138, 3243–3271. doi:10.1175/2010mwr3185.1
Howell, B., Egan, S., and Fine, C. (2022). Application of microwave space-based environmental monitoring (SBEM) data for operational tropical cyclone intensity estimation at the joint typhoon warning center. Bull. Amer. Meteor. Soc. 103, E2315–E2322. doi:10.1175/bams-d-21-0180.1
Hu, C., Duan, Y., Yu, H., Yu, R., and Du, B. (2005). The diagnostic analysis of the rapid change in tropical cyclones intensity before landfall in South China. J. Trop. Meteorol. 21 (4), 377–382.
Hu, H., and Duan, Y. (2016). Analysis of environmental variables of rapidly intensifying tropical cyclones in the South China Sea. J. Trop. Meteorol. 32 (3), 299–303. doi:10.1016/j.chemosphere.2016.08.080
Kaplan, J., DeMaria, M., and Knaff, J. A. (2010). A revised tropical cyclone rapid intensification index for the Atlantic and eastern North Pacific basins. Wea. Forecast. 25 (1), 220–241. doi:10.1175/2009waf2222280.1
Kaplan, J., and DeMaria, M. (2003). Large-scale characteristics of rapidly intensifying tropical cyclones in the North Atlantic basin. Wea. Forecast. 18 (6), 1093–1108. doi:10.1175/1520-0434(2003)018<1093:lcorit>2.0.co;2
Kelley, O. A., Stout, J., and Halverson, J. B. (2005). Hurricane intensification detected by continuously monitoring tall precipitation in the eyewall. Geophys. Res. Lett. 32 (20), L20819. doi:10.1029/2005gl023583
Kelley, O. A., Stout, J., and Halverson, J. B. (2004). Tall precipitation cells in tropical cyclone eyewalls are associated with tropical cyclone intensification. Geophys. Res. Lett. 31 (24), L24112. doi:10.1029/2004gl021616
Liang, J., Chen, Z., Wan, Q., Ding, W., Liu, C., and Lin, A. (2003). Diagnostic analysis of the landfall process tropical cyclone “Vongfong”. J. Trop. Meteorol. 19, 45–55.
Liu, S., Yan, W., and Wang, J. (2006). Hinokitiol, a metal chelator derived from natural plants, suppresses cell growth and disrupts androgen receptor signaling in prostate carcinoma cell lines. J. Trop. Oceanogr. 25 (5), 26–32. doi:10.1016/j.bbrc.2006.09.166
Merrill, R. T. (1988). Environmental influences on hurricane intensification. J. Atmos. Sci. 45 (11), 1678–1687. doi:10.1175/1520-0469(1988)045<1678:eiohi>2.0.co;2
Rogers, R. (2010). Convective-scale structure and evolution during a high-resolution simulation of tropical cyclone rapid intensification. J. Atmos. Sci. 67 (1), 44–70. doi:10.1175/2009jas3122.1
Shou, S., and Yao, X. (1995). A diagnostic study of the composite ambient fields of the explosively developing typhoons. Chin. J. Atmos. Sci. 19 (4), 487–493.
Simpson, J., Halverson, J. B., Ferrier, B. S., Petersen, W. A., Simpson, R. H., Blakeslee, R., et al. (1998). On the role of “hot towers” in tropical cyclone formation. Meteor. Atmos. Phys. 67, 15–35. doi:10.1007/bf01277500
Steranka, J., Rodgers, E. B., and Gentry, R. C. (1986). The relationship between satellite measured convective bursts and tropical cyclone intensification. Mon. Wea. Rev. 114 (8), 1539–1546. doi:10.1175/1520-0493(1986)114<1539:trbsmc>2.0.co;2
Susca-Lopata, G., Zawislak, J., Zipse, E. J., and Rogers, R. F. (2015). The role of observed environmental conditions and precipitation evolution in the rapid intensification of Hurricane Earl (2010). Mon. Wea. Rev. 143 (6), 2207–2223. doi:10.1175/mwr-d-14-00283.1
Vigh, J. L., and Schubert, W. H. (2009). Rapid development of the tropical cyclone warm core. J. Atmos. Sci. 66 (11), 3335–3350. doi:10.1175/2009jas3092.1
Wang, F., Qie, X., and Cui, D. (2017). Climatological characteristics of lightning activity within tropical cyclones and its relationship to cyclone intensity change over the Northwest Pacific. Chin. J. Atmos. Sci. 41 (6), 1167–1176.
Wang, W., and Yu, J. (2013). Characteristic comparison between the rapid intensification of tropical cyclones in easterly and westerly wind shear over the Northwest Pacific. Trans. Atmos. Sci. 36 (3), 337–345.
Wang, X., and Yu, J. (2011). A comparative analysis of environmental dynamical control of change of tropical cyclones intensity in different oceans. J. Trop. Meteorol. 27 (3), 387–395.
Wang, Y., and Wu, C. C. (2004). Current understanding of tropical cyclone structure and intensity changes–a review. Meteorol. Atmos. Phys. 87 (4), 257–278. doi:10.1007/s00703-003-0055-6
Xia, Y., Zheng, Z., and Liu, S. (1995). The effects of heating in the inner core and the external part of typhoon on their intensity abrupt changes. Acta Meteorol. Sin. 53 (4), 423–430.
Yang, S., Li, Y., and Chen, L. (2017). The characteristics of tropical cyclone intensity change in Western North Pacific. J. Trop. Meteorol. 33 (5), 666–674.
Yin, H., Wang, Y., and Zhong, W. (2015). A statistical analysis of moisture characteristics during the rapid intensification of tropical cyclones over the Northwestern Pacific. Clim. Environ. Res. 20 (4), 433–442.
Yu, H., and Wu, G. (2001). Moist baroclinity and abrupt intensity change of tropical cyclone. Acta Meteorol. Sin. 59 (4), 440–449.
Yu, Y., Chen, L., and Yang, C. (2008). The features and mechanism analysis on rapid intensity change of super typhoon saomai (2006) over the offshore of China. Chin. J. Atmos. Sci. 32 (2), 405–416.
Yu, Y., and Yao, X. (2006). A neural model of the scintillating grid illusion: disinhibition and self-inhibition in early vision. J. Trop. Meteorol. 22 (6), 521–544. doi:10.1162/089976606775623306
Zagrodnik, J. P., and Jiang, H. (2014). Rainfall, convection, and latent heating distributions in rapidly intensifying tropical cyclones. J. Atmos. Sci. 71 (8), 2789–2809. doi:10.1175/jas-d-13-0314.1
Keywords: Typhoon “Mekkhala”, rapid intensification, numerical simulation, doppler weather radar, West coast of Taiwan Strait
Citation: Chen D, Jiang Y, Huang X, Xun A, Dai H and Zhang H (2023) Observation and simulation study on the rapid intensification mechanism of Typhoon “Mekkhala” (2006). Front. Earth Sci. 11:1230879. doi: 10.3389/feart.2023.1230879
Received: 29 May 2023; Accepted: 24 August 2023;
Published: 06 September 2023.
Edited by:
Shenming Fu, Chinese Academy of Sciences (CAS), ChinaReviewed by:
Jiafeng Zheng, Chengdu University of Information Technology, ChinaCopyright © 2023 Chen, Jiang, Huang, Xun, Dai and Zhang. This is an open-access article distributed under the terms of the Creative Commons Attribution License (CC BY). The use, distribution or reproduction in other forums is permitted, provided the original author(s) and the copyright owner(s) are credited and that the original publication in this journal is cited, in accordance with accepted academic practice. No use, distribution or reproduction is permitted which does not comply with these terms.
*Correspondence: Dehua Chen, ZGVodWFfY2hlbkAxNjMuY29t; Yongcheng Jiang, eWNqaWFuZ185MjVAZm94bWFpbC5jb20=
Disclaimer: All claims expressed in this article are solely those of the authors and do not necessarily represent those of their affiliated organizations, or those of the publisher, the editors and the reviewers. Any product that may be evaluated in this article or claim that may be made by its manufacturer is not guaranteed or endorsed by the publisher.
Research integrity at Frontiers
Learn more about the work of our research integrity team to safeguard the quality of each article we publish.