 Luyao Wang
94% of researchers rate our articles as excellent or good
Learn more about the work of our research integrity team to safeguard the quality of each article we publish.
Find out more
ORIGINAL RESEARCH article
Front. Earth Sci., 11 August 2023
Sec. Geochemistry
Volume 11 - 2023 | https://doi.org/10.3389/feart.2023.1226074
The escalating issues of worldwide energy scarcity and environmental contamination have brought geothermal resources into the spotlight as a sustainable and eco-friendly energy alternative. The circum-Wugongshan geothermal belt has abundant geothermal resources at a medium-low temperature, offering significant potential for development and utilization. In this study, samples of geothermal groundwater, cold spring water, and surface water were collected from the western Wugongshan area. Hydrochemical and thermodynamic methods were used to estimate the reservoir temperature and analyze its mechanism of origin. The results of these analyses indicated that, in terms of hydrochemical characteristics, most geothermal groundwater samples were Na-HCO3 and Na-SO4, while cold spring and surface water samples were Na-HCO3 and Ca-HCO3, respectively. Quartz and multicomponent geothermometers provided the most reliable estimations of reservoir temperatures, ranging from 64.8°C to 93.4°C. The circulation depth of geothermal water was found to range from 1729.3 m to 2,292.5 m. A mixing model indicated that shallow cold water was blended at a rate of 62.1%–78.8%. The δD and δ18O values validated the conclusion that the geothermal water originates from atmospheric precipitation, with recharge elevations varying between 503.1 m and 1,375.6 m. Based on the above analysis, a conceptual model is proposed to illustrate the mechanism of geothermal groundwater genesis.
In recent years, the overuse of fossil fuels has resulted in a variety of environmental problems, including depletion of resources, excessive emissions of carbon dioxide, and global warming. Renewable energy sources are urgently required to replace fossil fuels in order to minimize environmental damage. Geothermal energy, as a green and sustainable source of power, has garnered significant attention worldwide for its potential to reduce carbon emissions and promote clean energy (Karimi et al., 2017; Alqahtani et al., 2023). China has a high energy consumption rate, and its energy structure is still heavily dependent on fossil fuels (Chen et al., 2019). Therefore, it is necessary for China to vigorously develop and utilize geothermal energy to improve its energy infrastructure. The distribution of geothermal resources in China exhibits clear regularity and zonality. High-temperature geothermal resources are primarily found in southern Tibet, western Yunnan, western Sichuan, and Taiwan. Medium- and low-temperature geothermal resources are mainly concentrated along the southeast coast. Several previous studies have revealed the hydrochemical characteristics and mechanism of origin of high-temperature geothermal springs/wells, such as the Yangbajing, Yangyi, and Rehai geothermal fields (Duo, 2003; Zhang et al., 2008; Wang and Guo, 2010; Guo, 2012; Wang et al., 2022; Wang et al., 2022). However, there is limited research focusing on the medium- and low-temperature dome-controlled geothermal systems along the southeast coast. The mechanisms of origin of medium- and low-temperature dome-controlled geothermal systems remain unclear.
Thermal reservoir temperature is a crucial parameter that serves as a fundamental basis for classification of the genesis type of a geothermal system, and for evaluation of its energy potential (Chatterjee et al., 2019; Wei et al., 2021; Li et al., 2022). Accurately determining the thermal reservoir temperature is a crucial task in geothermal resource exploration. Due to the complex geological setting, selection of an accurate and suitable geothermometer to determine the thermal reservoir temperature remains a challenging task, especially for medium- and low-temperature dome-controlled geothermal systems. Previous studies have revealed that several methods can be used to calculate the temperature of a geothermal reservoir, including direct measurement, chemical geothermometry, and multi-component geothermometers (Deng et al., 2022). The direct measurement method is reliable and accurate, but is also expensive and time-consuming (Yang et al., 2019). Chemical geothermometry is a technique that utilizes the correlation between the water chemistry, gas composition, and isotopic composition of geothermal fluids to estimate the temperature of thermal reservoirs (Alçiçek et al., 2018; Bagheri et al., 2020).Their validity and accuracy vary depending on the application conditions, which limits their applicability to certain reservoirs (Fournier and Truesdell, 1973; Fournier, 1977; Fournier, 1979; Arnórsson et al., 1983; Giggenbach, 1988). In recent years, the use of the multi-component geothermometer has become more widespread (Reed and Spycher, 1984; Pang and Reed, 1998; Spycher et al., 2016; Goswami et al., 2022). Compared to classical geothermometers, multi-component geothermometers offer the advantage of comprehensive fluid analysis and numerical calculations based on thermodynamics, rather than relying on the solubility or (semi-)empirical correlation of a small number of minerals (Xu et al., 2019). Therefore, this method can be used effectively as a way to complement and validate various chemical geothermometer calculations.
The Wugongshan area, located in the northwest of Jiangxi Province on China’s southeast coast geothermal belt is rich in medium- and low-temperature geothermal resources. These resources have significant potential for development and utilization. In recent years, several studies have been conducted on the geology, tectonics, geophysics, and petrology of the Wugongshan geothermal area as a whole (Lou et al., 2002; Liu et al., 2016; Zhang et al., 2022a; Jia et al., 2022; Liu et al., 2023). Additionally, research has been conducted on the hydrogeochemistry, the heat source, and the mechanism of genesis of the local area (Sun J. et al., 2022; Sun W. et al., 2022; Zhang et al., 2022b; Gao et al., 2022; Yu et al., 2022). However, there is still a lack of systematic studies on the hydrogeochemistry of and thermal reservoir temperatures in the western part of the Wugongshan area. The model of genesis for the geothermal resources in this area remains unclear, and the development and utilization of these resources are still in their early stages. The main objectives of this study were: i) to determine the hydrogeochemical characteristics of the area and identify sources of geothermal water; ii) to estimate the reservoir temperature of this geothermal water using multiple geothermometers and identify the most appropriate geothermometer for use with the thermal reservoir in the study area; and iii) to develop a conceptual model of the genesis of geothermal water in the western Wugongshan area. This study presents crucial foundational data for understanding the geothermal genesis and the potential for future exploration and utilization of geothermal resources in the Wugongshan area.
The study area is located in the western part of Wugongshan, northwest Jiangxi Province, China. The area is dominated by hilly and mountainous terrain, with a humid subtropical monsoon climate and mountainous climatic features, abundant rainfall, and four distinct seasons. The average annual air temperature, evaporation, and rainfall are approximately 15°C, 1,300 mm, and 1700 mm, respectively.
Tectonically, the Wugongshan area is on the south side of the Yangtze Block and Cathaysia Block convergence belt, which belongs to the middle Jiangxi tectonic collision belt on the northern margin of the Cathaysia Block (Figure 1). The study area has experienced multi-stage magmatic activity and tectonic activity from the Neoproterozoic to the present. Several faults have developed in the northeast, northwest, and near-southeast directions. The northeast-trending fault is the most developed, including the Xinquan-Wentang fault and the Qianshan-Sanjiang fault. The rock is extensively fractured along the faults, which has facilitated the formation of a regional thermal anomaly output channel.
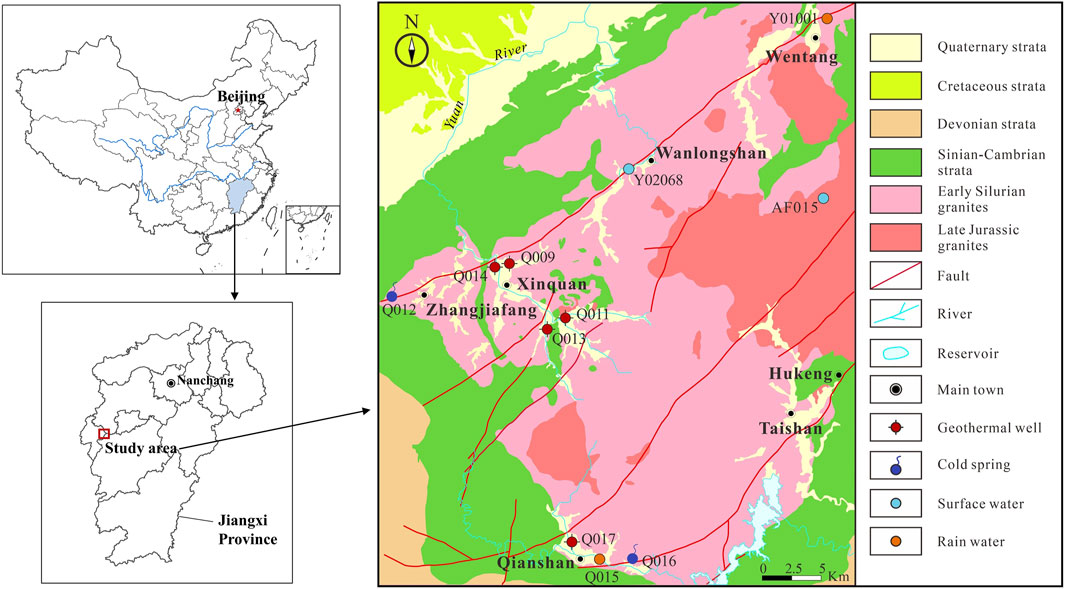
FIGURE 1. Geological map of the Wugongshan area and the locations of sampling sites (adapted from Zhang et al., 2022b).
The groundwater types in the study area are classified into Quaternary loose rock pore water and bedrock fissure water. Quaternary loose rock pore water is only distributed in the mountain valley, which consists of sandy soil, a layer of pebble gravel, gravel, and rolling stones. The aquifer is 2–10 m thick. The recharge sources mainly consist of atmospheric precipitation and bedrock fissure water. Bedrock fissure water is the primary type of groundwater in the study area, and the lithology is black mica diorite granite. Atmospheric precipitation flows down the slope to the lower area and is discharged into valleys and streams through descending springs or scattered flow.
A total of 11 geothermal groundwater samples, consisting of five geothermal well water samples, two cold spring water samples, two surface water samples, and two rainwater samples, were collected in the study area (Figure 1).
At each sampling site, physical and chemical parameters were measured using portable multi-parameter water quality probes (SX-620 pH meter, SX-630 ORP meter, SX-650 conductivity/resistivity/TDS/salinity meter, Sanxin, Shanghai, China); these parameters included pH, electrical conductivity (EC), oxidation-reduction potential (ORP), and total dissolved solids (TDS). The Hatch water quality probe (HQ40d, HACH, Loveland, Colorado, USA) was used to measure water temperature (T) and dissolved oxygen (DO). All water samples used for geochemical analysis were filtered with 0.45 μm microporous membranes and then stored in either brown glass or high-density polyethylene (HDPE) bottles. Samples for cation and trace element analysis were stored in brown glass bottles and acidified with ultrapure HNO3 to a pH < 2. Samples for anion and isotope analysis were stored in polyethylene bottles without any added chemicals.
Hydrochemical analysis of water samples was conducted at Guirui Test Technology Co. (Beijing). The concentrations of Na+ and K+ were determined using flame atomic absorption spectrophotometry (GB 11904–89); Ca2+ and Mg2+ were determined by atomic absorption spectrophotometry (GB 11905–89); Fe3+ and Fe2+ were determined by phenanthroline spectrophotometry (for trial) (HJ/T 345–2007) with a detection limit of 0.03 mg/L; and inorganic anions (F−, Cl−, NO2−, Br−, NO3−, PO43-, SO32-, SO42-) were determined by ion chromatography (HJ 84–2016). H2SiO3 content was determined by silicon-molybdenum yellow spectrometry, and this analysis was based on China’s national food safety standard “Test method for natural mineral drinking water” (GB8538-2022). HCO3− and CO32- concentrations were analyzed using the acid-base indicator titration method specified in “Analytical Methods for Water and Wastewater Monitoring (fourth edition)”. The concentrations of trace elements such as Sr, Mn, Al, and Ag were determined according to “Water quality—Determination of 65 elements—Inductively coupled plasma-mass spectrometry” (HJ 700–2014). The isotope analysis was conducted at the Institute of Geographical Sciences and Resources, Chinese Academy of Sciences, using Phoenix-type thermal ionization mass spectrometry to determine the strontium isotopic composition. This analysis was based on the publication “Isotopic Determination Method of Pb, Sr, and Nd in Rocks” (GB/T 17,672–1999). Finally, δ18O-H2O and δD-H2O values were determined using a liquid water isotope analyzer (LGR, DLT-100). The results were determined using the Vienna Standard Mean Ocean Water (VSMOW) as the standard, with analytical precision of 1‰ (δD) or 0.1‰ (δ18O).
The equations for the chemical geothermometers used in this study are listed in Table 1.
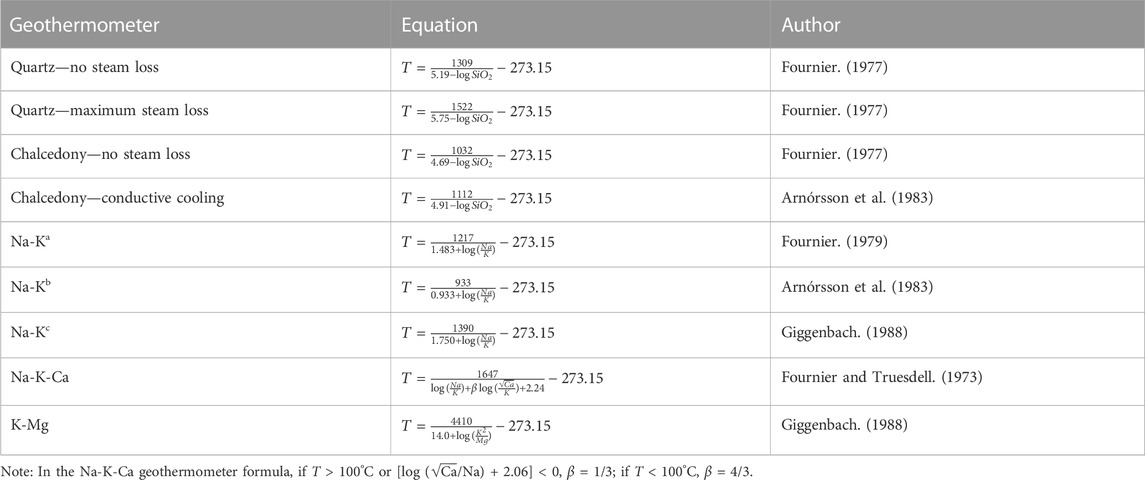
TABLE 1. Chemical geothermometers used in this study.
Chemical geothermometers rely on the following assumptions: that the concentrations of the chemical species reflect the equilibrium between the reservoir fluid and minerals at the maximum underground temperature; that there is no mixing with geothermal fluids that have different chemical compositions from the ascending fluid; and that there is no re-equilibration of the geothermal fluid during its ascent to the surface discharge point (Fowler et al., 2018; Mao et al., 2021). These assumptions can be considered reliable under the condition that the temperature ranges estimated by different geothermometers are consistent. Otherwise, the primary assumptions should be revisited.
In order to determine the equilibrium state of each mineral, the saturation index (SI) was calculated using the following equation (Keesari et al., 2022):
Here, IAP and KT are the activity constant and equilibrium constant, respectively, of the mineral at a specific temperature. When SI < 0, the mineral is in an undersaturated state; when SI > 0, the mineral is in a supersaturated state; and when SI falls within the range of −0.2 to 0.2, the mineral is mostly in a state of quasi-equilibrium.
(1) Silicon-enthalpy model
In this study, the initial temperature of the deep geothermal fluid and the proportion of cold water mixture added were calculated using the silicion-enthalpy mixing model proposed by Truesdell and Fournier. (1977), in the form of the following equations:
Here, Sh is the initial enthalpy of hot water (J/g); Sc is the enthalpy of cold water (J/g); Ss is the final enthalpy of thermal water (J/g); SiO2h is the initial SiO2 content of thermal water (mg/L); SiO2c is the SiO2 content of shallow cold water (mg/L), using the SiO2 data for cold water at the surface near the thermal water sample; SiO2h is the final SiO2 content of thermal water (mg/L); and X is the mixing ratio of subsurface cold water. Solving Eqs. 2, 3 for XT and XSi at different temperatures gives:
Plotting XT and XSi against temperature yields two curves whose intersection coordinates are the estimated initial temperature of the thermal water and the mixing ratio of the cold water. If the two curves do not intersect, the initial geothermal water and the cold water on the surface have lost heat before mixing.
(2) Mixing model based on Sr and 87Sr/86Sr
The mixing ratio between geothermal water and shallow cold water in the study area was estimated using a binary mixing model based on Sr and 87Sr/86Sr, as shown below (Xu et al., 2021):
Here, (87Sr/86Sr)m, (87Sr/86Sr)1, and (87Sr/86Sr)2 are the Sr isotope ratios of the mixed sample, end-member 1, and end-member 2, respectively [Sr]m [Sr]1, and [Sr]2 are the Sr contents of the mixed sample, end-member 1, and end-member 2, respectively; and f is the mixing ratio of end-member 1.
(3) Mixing model based on chloride
Based on the mass balance model, the mixing ratio between thermal water and cold water can be calculated using chloride as a conservative tracer. The equation for this calculation is shown below (Syah et al., 2019):
Here, R is the mixing ratio of cold water (%) [Cl−Mix] is the chloride concentration in mixed groundwater (mg/L) [Cl−C] is the chloride concentration in shallow cold water (mg/L); and [Cl−T] is the chloride concentration in hot water (mg/L).
The circulation depths of geothermal water samples were calculated according to the following equation (Yuan et al., 2022):
Here, Z is the circulation depth (m); Z0 is the depth of the constant temperature zone (m); TR is the thermal storage temperature (°C); T0 is the annual average temperature of the constant temperature zone (°C); and G is the ground temperature gradient (°C/100 m).
The isotopic composition of hydrogen and oxygen in atmospheric precipitation displays an elevation effect, and δD and δ18O decrease as groundwater recharge elevation increases. Thus, the recharge elevation of geothermal water can be determined using the following equation (Yuan et al., 2022):
where H is the geothermal water recharge elevation (m); h is the geothermal water sampling point elevation (m); δG is the δD (δ18O) value of the sampled groundwater; δP is the δD (δ18O) value of the atmospheric precipitation near the sampling point; and K is the isotope height gradient (-δ/100 m).
Furthermore, the recharge elevation can be calculated using the relationship between the δD value of atmospheric precipitation (or δ18O) and elevation (Yu et al., 1987; Wang and Wang, 2002):
The results of physicochemical analyses of water samples collected from the study area are summarized in Table 2 and Table 3. All analysis results were checked based on the charge balance error. The ion concentration in each case indicated that the samples were suitable for hydrochemical analysis. The temperatures of all samples ranged from 27.4°C to 49.2°C, with an average value of 36.3°C. The pH range of geothermal water was 7.4–8.9, with an average value of 8.42, indicating weakly alkaline water. Total dissolved solids content fell within the range of 83–283 mg/L, with an average value of 176.4 mg/L, which can be classified as low-mineralization water. Electrical conductivity fell within the range of 0.7–608 μs/cm, with an average value of 194.68 μs/cm.
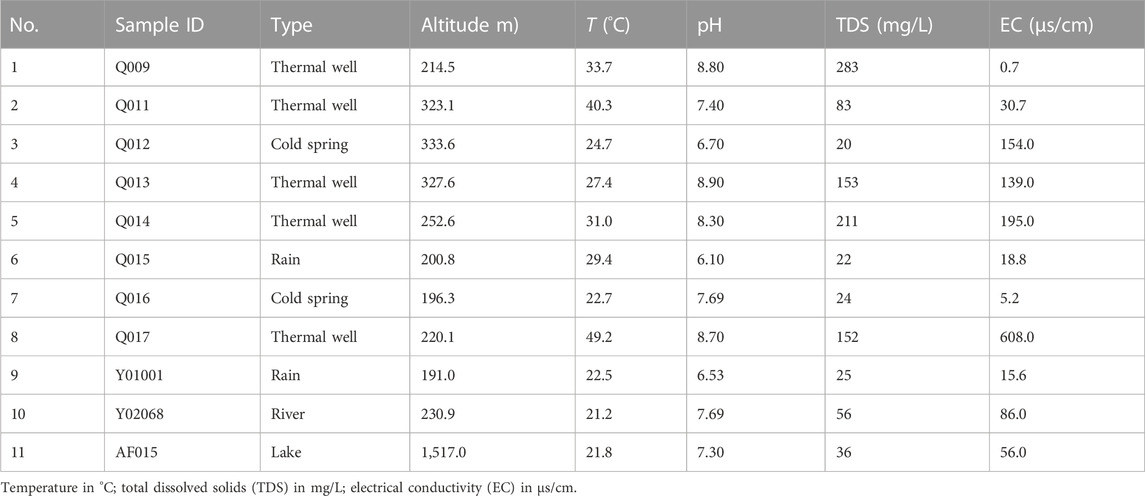
TABLE 2. In situ measurements of altitude, temperature, pH, total dissolved solids, and electrical conductivity data for selected water samples in the study area.
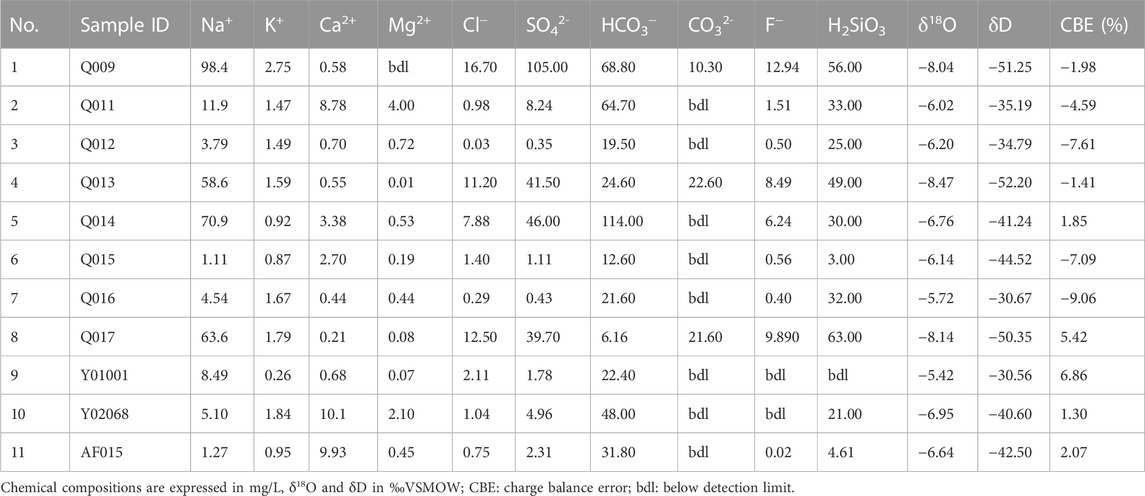
TABLE 3. Major chemical constituents, charge balance error, δ18O, and δD isotope ratios of the water samples in the study area.
The main cation in the geothermal water samples was Na+, with content levels falling within the range of 11.9–98.4 mg/L. Concentrations of other cations were 0.92–2.75 mg/L for K+, 0.58–8.78 mg/L for Ca2+, and 0–4 mg/L for Mg2+. The main anion in the geothermal water samples was HCO3−, with content levels falling within the range of 6.16–114 mg/L. Concentrations of other anions were 8.24–105 mg/L for SO42-, 0.98–16.70 mg/L for Cl−, and 0–22.60 mg/L CO32-.
According to the Piper diagram for the main anions and cations (Figure 2), all the cold spring samples were Na-HCO3 water, and the surface water was Ca-HCO3 water. The hydrochemical characteristics of geothermal water are complex; they include Na-SO4-HCO3 (Q009), Na-Ca-HCO3 (Q011), Na-SO4-CO3 (Q013 and Q017), and Na-HCO3-SO4 (Q014) water.
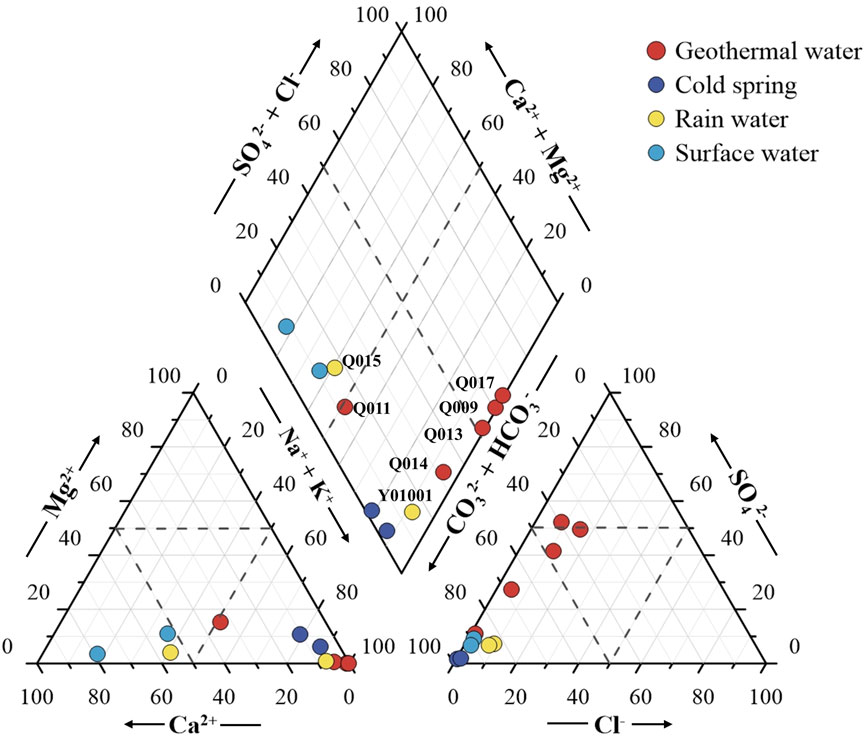
FIGURE 2. Piper diagram of water samples in the study area.
As shown in Table 3, the δ18O and δD values of the geothermal water samples in the study area ranged from −8.47‰ to −6.02‰ (mean value of −7.49‰) and from −52.20‰ to −35.19‰ (mean value of −46.05‰), respectively; those of the cold spring samples ranged from −6.20‰ to −5.72‰ and from −34.79‰ to −30.67‰; those of the surface water samples ranged from −6.95‰ to −6.64‰ and from −42.5‰ to −40.6‰; and those of the rainwater samples ranged from −6.14‰ to −5.42‰ and from −44.52‰ to −30.56‰.
Giggenbach’s Na-K-Mg ternary diagram and the SI were used to analyze the water–rock equilibrium state. Giggenbach’s Na-K-Mg ternary diagram is often used to identify the equilibrium state and type classification of geothermal fluids (Giggenbach, 1988). The diagram classifies geothermal water as full equilibrium water, partial equilibrium water, or immature water. All thermal water samples collected from the study area fell near the Mg1/2 corner of the diagram (the lower right corner), indicating that none of the thermal water samples had reached a state of water–rock equilibrium (Figure 3), either because the thermal water was diluted by shallow cold water during the upwelling process or because the geothermal groundwater did not fully react with the surrounding rock in the deep crust. The Q011 and Q014 water sample points fell within the immature water region; the Q013 and Q017 water sample points fell within the partial equilibrium region; and because data on Mg2+ content were lacking for sample Q009, its water–rock equilibrium state could not be determined from the Na-K-Mg triangle diagram.
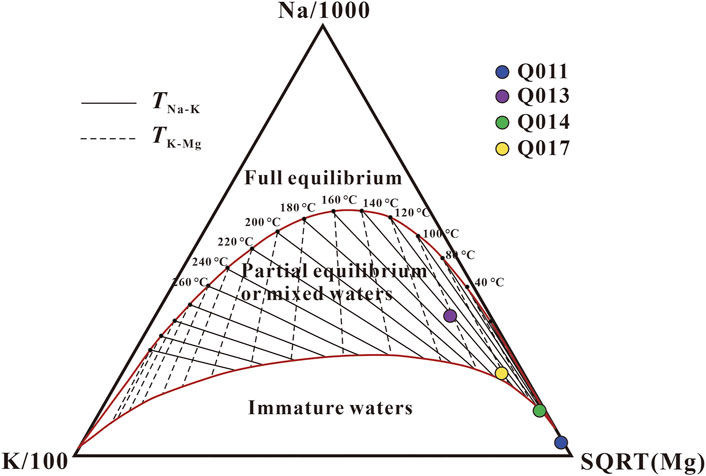
FIGURE 3. Distribution of thermal waters from the study area within an Na-K-Mg ternary diagram.
The SIs of different minerals in geothermal water were calculated using PHREEQC at the measured discharge temperature (Table 4). All thermal water samples in the study area were saturated with goethite and hematite, indicating that iron minerals tended to precipitate; chalcedony and quartz were in a lightly saturated state; and other minerals had not reached saturation and would continue to dissolve. The SI values showed that the main minerals in the geothermal water of the study area were unsaturated, which also indicated that the geothermal water had not reached a state of water–rock equilibrium.
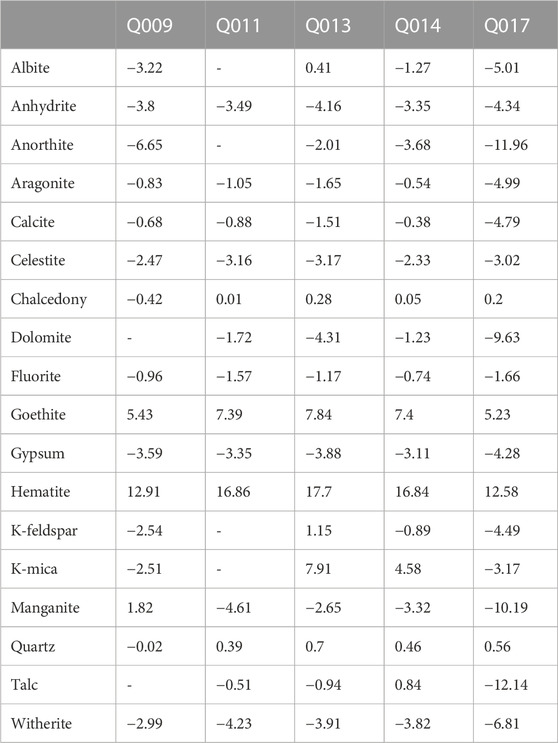
TABLE 4. Saturation indices for various minerals at the discharge temperature of thermal waters.
Table 5 shows the reservoir temperature of geothermal water samples in the study area calculated by different chemical geothermometers. Appropriate geothermometers must be carefully selected to estimate reservoir temperatures to avoid erroneous results or interpretations. There are large differences between the reservoir temperatures estimated by different chemical geothermometers, which emphasizes the necessity of choosing appropriate geothermometers for the study area.
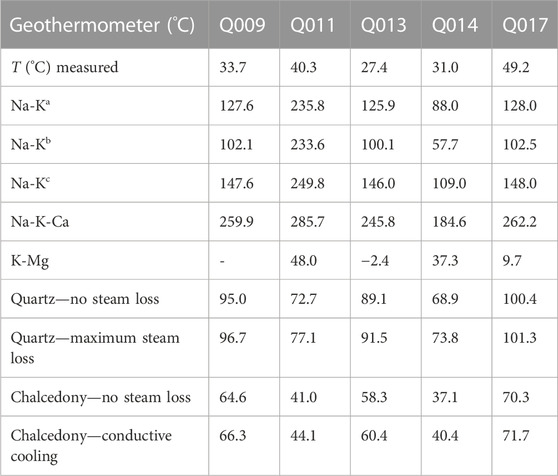
TABLE 5. Results of chemical geothermometer measurements for the study area.
Cation geothermometers are used to determine reservoir temperature based on the relationship between temperature and cation ratios, such as the ratios of Na, K, Ca, and Mg, in geothermal fluids. All cation geothermometers provide empirical approximations. Commonly used cation geothermometers include the Na-K geothermometer (Fournier, 1979; Arnórsson et al., 1983; Giggenbach, 1988), the Na-K-Ca geothermometer (Fournier and Truesdell, 1973), and the K-Mg geothermometer (Giggenbach, 1988). The Na-K geothermometer is based on the equilibrium between sodium and potassium feldspar and is suitable for reservoir temperatures ranging from 180°C to 350°C (Ellis, 1979). In geothermal reservoirs with lower temperatures (<120 °C), the Na/K ratio is affected by other minerals (e.g., clay), meaning that the Na-K geothermometer gives erroneous results (Chatterjee et al., 2019). In addition, in Ca2+-rich geothermal water, the Na-K geothermometer gives high estimates and must be constrained by Ca2+; for this reason, Fournier and Truesdell proposed the Na-K-Ca geothermometer (Fournier and Truesdell, 1973). The K-Mg geothermometer is based on the ion exchange reaction of potassium feldspar with muscovite and clinochlore. Equilibrium is reached quickly in this reaction, and this method is primarily utilized in low-temperature geothermal systems with a high concentration of Mg2+ (Guo et al., 2016).
The use of a cation geothermometer to calculate the temperature of a thermal reservoir presupposes that the ions in the geothermal water have reached equilibrium with the rock. According to the Na-K-Mg equilibrium triangle diagram (Figure 3), because water samples Q011 and Q014 fell within the immature water region, the cation thermometer was not suitable for use. Water samples Q013 and Q017 fell within the partial equilibrium region, with less mixing of shallow cold water; thus, the cation thermometer could be used. Giggenbach’s Na-K-Mg triangle diagram could not be used to determine the water–rock equilibrium state of Q009, but according to the calculated SI of each mineral at the discharge temperature of Q009, most of the minerals were in the unsaturated state (SI < 0), indicating that Q009 had not reached the equilibrium state, and a cation geothermometer may give unreliable results.
The reservoir temperatures of the Q013 and Q017 water samples, as obtained by three Na-K geothermometers, were 100.1°C–146.0°C (average 123.9°C) and 102.5°C–148.0°C (average 126.2°C), respectively. Because the Na-K geothermometer is affected by re-equilibration for a longer period of time after the cold water mixing effect, the maximum ionic information at the time of cold water mixing is retained (Niu et al., 2022). Therefore, the results estimated by the geothermometer represent the instantaneous temperature when the geothermal fluid was mixed with cold water. In contrast, the K-Mg geothermometer is more influenced by cold water mixing, and the thermal reservoir temperatures calculated using this method were low, even giving one result below 0 (Q013), so the K-Mg geothermometer is not suitable for the geothermal system where Q013 and Q017 are located.
Silica geothermometers are based on variation in the solubility of silica with temperature and pressure. The advantages of using silica as a thermometer are as follows: SiO2 is widely available; natural water–dissolved SiO2 is not easily affected by ordinary ionic effects, complex formation, and volatile component dissipation; and there is little or no precipitation of SiO2 as geothermal water rises, even though the temperature decreases (Fournier, 1977). However, in practical applications, due to the variety in silica minerals, including quartz, chalcedony, and amorphous silica, it is difficult to identify which silica mineral controls the dissolution of silica in geothermal water, which increases the difficulty of using a silica geothermometer (Zhang et al., 2021).
The range of reservoir temperatures obtained by the quartz geothermometers was 68.9°C–101.3°C, and the reservoir temperature range given by the chalcedony geothermometers was 41.0°C–71.7°C, which was lower than that calculated using the quartz geothermometers (Table 5). A logarithmic equilibrium plot of K2/Mg versus SiO2 can be used to evaluate which SiO2 mineral controls the dissolved SiO2 content in geothermal water (Figure 4), along with solubility curves for quartz, chalcedony, and amorphous SiO2 (Giggenbach and Glover, 1992). All data points for the geothermal water samples tested in the present study, with the exception of Q011, were distributed near the quartz mineral indicator line. This suggests that quartz is a prevalent silica species in the geothermal water of the study area and may control the dissolved silica content. In addition, the reservoir temperatures of the Q011 and Q014 water samples as estimated by the chalcedony geothermometers were close to the measured wellhead temperatures, which is not reasonable. Therefore, the thermal reservoir temperature estimated by the quartz geothermometers is more reliable than that estimated by the chalcedony geothermometers.
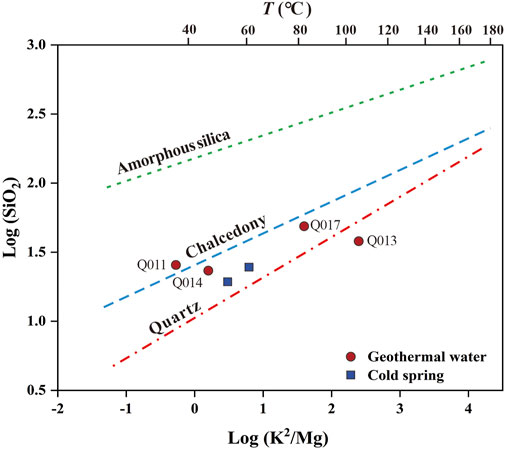
FIGURE 4. Plot of log (SiO2) against log (K2/Mg), concentration in mg/L. Lines are drawn using log SiO2 (quartz) = 5.19 - [1,309/(T [°C] + 273.15)]; log SiO2 (chalcedony) = 4.69 - [1,032/(T [°C] + 273.15)]; log SiO2 (amorphous silica) = 4.52 - (731/(T [°C] + 273.15)) (Henley et al., 1984); and log K2/Mg = 14 − [4,410/(T [°C] + 273.15)] (Giggenbach et al., 1994).
The state of equilibrium between geothermal groundwater and surrounding minerals can be identified as a temperature-dependent function, and this state is generally characterized by an SI; hence, the SI can be a highly useful method for evaluating reservoir temperature (Belhai et al., 2022; Jeong et al., 2022). The SIs of 14 minerals (albite, anhydrite, aragonite, calcite, celestite, chalcedony, serpentine, dolomite, fluorite, gypsum, K-feldspar, K-mica, pyrolusite, and quartz) at different temperatures were calculated using the geochemical simulation software package PHREEQC, and SI-T equilibrium diagrams for each water sample were plotted (Figure 5).
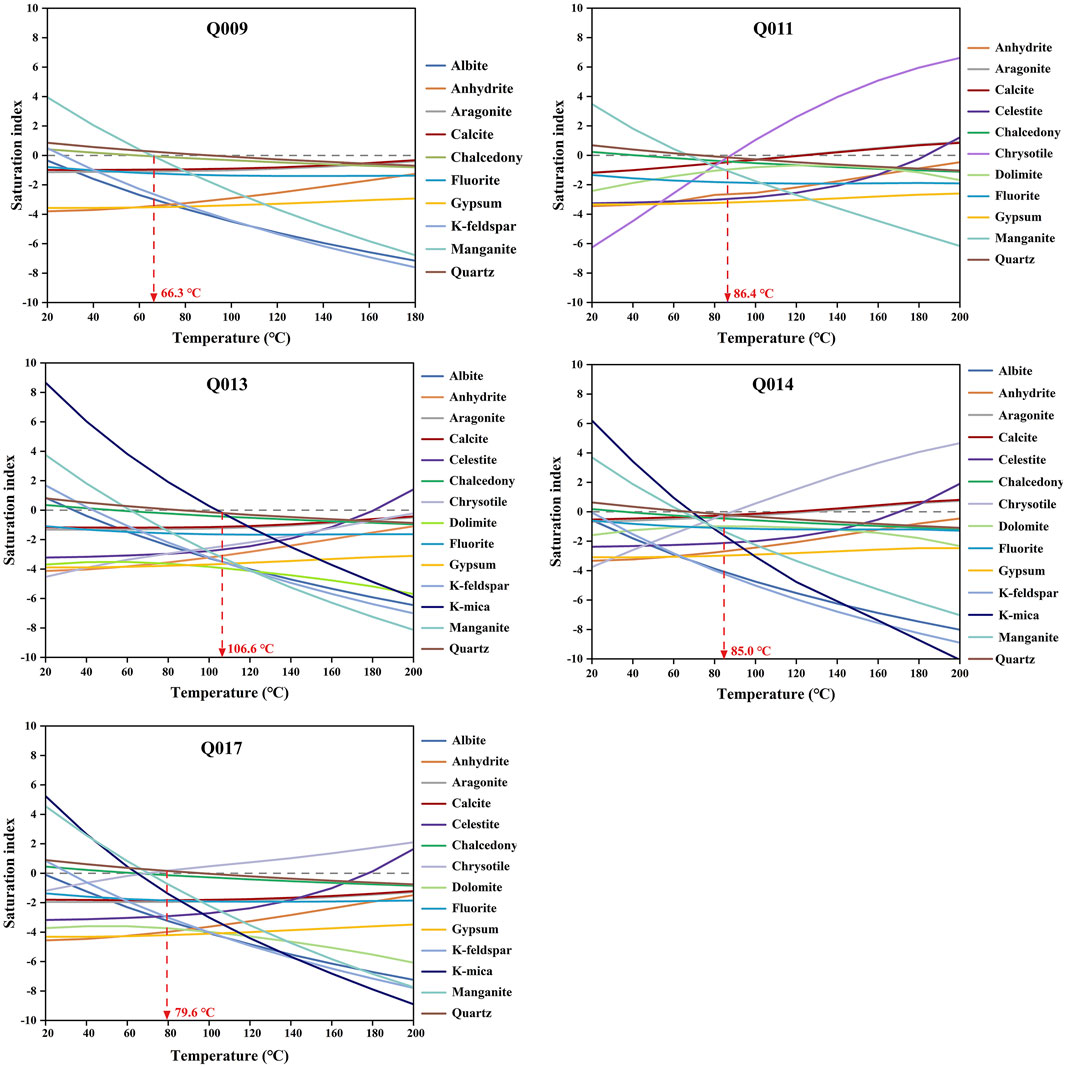
FIGURE 5. SI-T equilibrium diagrams for geothermal water samples in the study area.
The results showed that, for sample Q009, chalcedony and magnetite were close to saturation at 66.3°C. In the equilibrium diagrams, for sample Q011, quartz and serpentine tended to be saturated at approximately 86.4°C; for sample Q013, quartz and potassium mica were saturated at 106.6°C; for sample Q014, quartz and serpentine were saturated at 85°C; and for sample Q017, quartz and serpentine were saturated at approximately 79.6°C. The thermal reservoir temperature range of the western Wugongshan area was thus calculated using multi-component geothermometry as 66.3°C–106.6°C, which was similar to the thermal reservoir temperature range estimated by the quartz geothermometers, demonstrating the reliability of the quartz geothermometers.
In general, deep geothermal fluids are often diluted by mixing with cold water from shallow sources as they ascend to the surface, resulting in geothermal water that is cooling and has a different chemical composition, thus producing large errors in the estimations of thermal reservoir temperatures produced by conventional chemical geothermometers. To evaluate and eliminate the effects of mixing processes, Fournier and collaborators (Fournier and Truesdell, 1974; Truesdell and Fournier, 1977) proposed a silicon-enthalpy mixing model (the silicon-enthalpy equation and a silicon-enthalpy graphical method), which is often used to estimate the proportion of cold water mixing with geothermal water and can indicate the original temperature of the geothermal water.
The silicon-enthalpy equation method was used to estimate the thermal reservoir temperature and the ratio of cold water mixing in the five geothermal water samples collected in the study area. The relationship between saturation water enthalpy and SiO2 content and temperature is presented in Table 6. When the temperature is below 100°C, the values of saturation water enthalpy and temperature are approximately equal. The deep reservoir temperatures of water samples Q011, Q014, and Q017 in the study area were calculated to be 102.9, 126.0, and 164.4°C, respectively, and the cold water mixing ratios were 80%, 94%, and 81%, respectively, based on the Si-enthalpy equation (Figure 6). However, the Si-enthalpy curves for water samples Q009 and Q013 did not intersect on the graph, making it impossible to determine the corresponding reservoir temperatures and cold water mixing ratios. The main characteristics of these two geothermal water samples were low temperature and high SiO2 content, which are mainly attributable to steam loss before the ascent of the deep thermal water to mixing, or the presence of non-adiabatic conduction leading to heat loss.
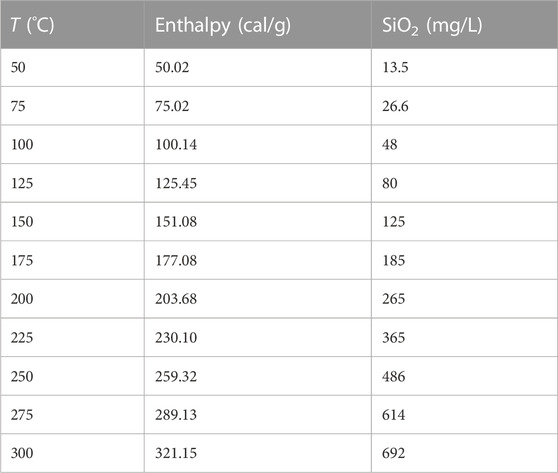
TABLE 6. Relationship between water temperature, enthalpy, and SiO2 content.

FIGURE 6. Relationship between cold water ratio and temperature in the mixing models for the geothermal water samples.
Because the thermal reservoir temperature and cold water mixing ratio of water samples Q009 and Q013 could not be derived using the silicon-enthalpy equation method, the silicon-enthalpy model as improved by Truesdell and Fournier (1977), that is, the silicon-enthalpy graphical method, was used to estimate the temperature of the thermal reservoir and the ratio of cold water mixing with geothermal water at these two sites. There are two versions of this method: one used in cases in which the geothermal water undergoes no steam or heat loss, and the other in cases in which the geothermal water does undergo steam or heat loss. If the water sample rises rapidly to cool adiabatically (via boiling) before sampling, a maximum steam loss curve is utilized to correct for the possible maximum steam loss. If the water sample is primarily cooled through conduction, a quartz dissolution curve is required.
Under the assumption that steam loss occurs prior to the initial mixing of thermal water and shallow cold water, the enthalpy and SiO2 content of the shallow cold water in the study area were plotted on the Si-enthalpy diagram as point A, and those of the geothermal water samples were plotted as point B. A straight line was drawn between points A and point B, representing the mixing line of the shallow cold water and geothermal water, and line AB was extended to intersect with the T = 100°C line at point C. A line parallel to the enthalpy axis was drawn through point C to intersect with the quartz maximum steam loss line at point D, and the corresponding horizontal coordinate value at point D thus represents the initial enthalpy of the geothermal water before boiling. The vertical line of the enthalpy axis made through point D intersects with the quartz solubility curve at point E, corresponding to the value of the vertical coordinate which represents SiO2 content before the loss of steam or heat. The ratio of shallow cold water mixed into geothermal water is X = 1 − (AB/AC).
According to Figure 7, the thermal reservoir temperature of the Q009 water sample was 193.5°C, and the cold water mixing ratio was 88.2%. However, the extension of straight line AB2 plotted for the cold water and sample Q013 does not intersect with the T = 100°C line, indicating that the silicon-enthalpy graphical solution method considering the maximum steam loss cannot be used to calculate the thermal reservoir temperature and cold water mixing ratio at this location. Furthermore, the straight line AB, obtained from the cold water point and the hot water point, does not intersect with the quartz dissolution curve (no steam loss), suggesting that steam loss occurred before the initial hot water and shallow cold water mixing.
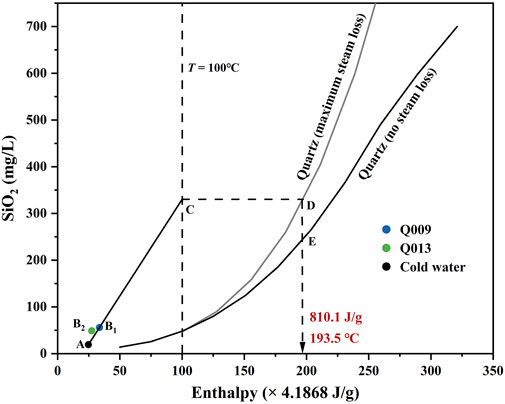
FIGURE 7. Silicon-enthalpy diagram for geothermal water samples Q009 and Q013.
The temperature of the thermal reservoir, as determined using the silica-enthalpy model method, was considerably higher than the values calculated using the quartz geothermometers. This difference arises because the premise of the silica-enthalpy mixing model is that the dissolved SiO2 in deep groundwater is in a saturated state and is mixed with cold water without the secondary equilibrium of a water–rock reaction. In contrast, the fracture zone in the study area is filled with many rock silicification zones, resulting in the geothermal water dissolving more silica-bearing minerals again during the rising process, thereby increasing the thermal reservoir temperature estimated using the silica-enthalpy model (Yu et al., 2022).
By analyzing the existing temperature data measured at boreholes in the Shixi and Qianshan areas, it was found that the temperature of the Shixi geothermal well (Q013) at a depth of 1640 m was 75°C. Similarly, the bottom temperature of borehole ZK04 (located near Q017) in the Qianshan area was measured at 57.2°C at a depth of 1175 m. Among the geothermometers mentioned above, only the quartz geothermometer and the multi-component geothermometer achieved a small margin of error relative to the actual temperature measured in the borehole when used to calculate the reservoir temperature. Therefore, the quartz geothermometer and multi-component geothermometer are the most suitable methods for determining thermal reservoir temperature in the study area.
The circulation depth of geothermal water is an important parameter in analyzing the mechanism underlying its formation and in the evaluation of potential geothermal reservoirs (Fan et al., 2019). Eq. 8 was used to calculate the circulation depth of geothermal water. In the equation, the arithmetic mean of the calculated values of the quartz and multi-component geothermometers was taken as the thermal reservoir temperature in the study area; the local annual mean temperature of 17°C was taken as the temperature of the thermostatic zone (T0); the geothermal gradient (G) was 3.6°C/100 m (Yu et al., 2022); and the average depth of the thermostatic zone in Jiangxi Province of 30 m was taken as the depth of the thermostatic zone (H0). The geothermal water circulation depth in the study area was calculated to be 1729.3–2,292.5 m, with an average value of 1938.7 m.
When deep groundwater reaches the surface as mixed water, recognition of different components/end-members may be difficult, and this is especially true if water–rock re-equilibration occurs after mixing (e.g., if residence times are long) (Han et al., 2010). To simplify the calculation of the mixing fraction, it can be assumed that the collected geothermal water is a mixture of a deep thermal groundwater and a shallow cold water end-member. A binary mixing model is then established between the two end-members using Sr and 87Sr/86Sr (Xu et al., 2019; Xu et al., 2021). In this study, the cold water sample (Q012) taken near the geothermal water was selected as the cold water end-member (87Sr/86Sr = 0.7229, Sr = 0.022 mg/L), and the sample with the highest Sr content among the geothermal water samples (Q014) was selected as the thermal water end-member (87Sr/86Sr = 0.7345, Sr = 0.343 mg/L). The calculation results are shown in Table 7. Sample Q013 was found to have the highest mixing ratio (91%), whereas sample Q011 had the lowest mixing ratio (41%).
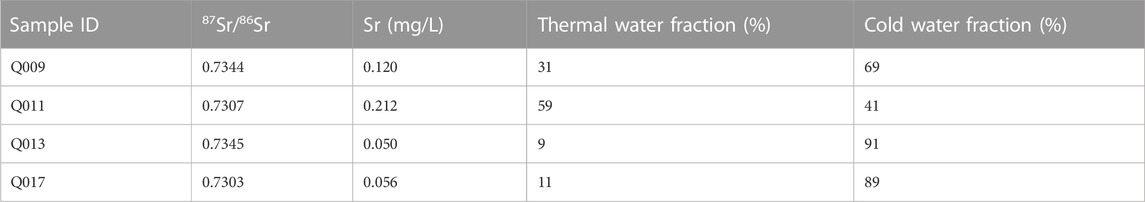
TABLE 7. Results of the mixing fraction calculation for geothermal water samples based on the Sr and87Sr/86Sr mixing models.
Chloride is widely used to evaluate the mixing process of thermal and cold water due to its conservative behavior (Syah et al., 2019). A shallow cold water sample with Cl = 1.91 mg/L (Q012) and a geothermal water sample with Cl = 16.7 mg/L (Q009) were considered as the two end-members for this purpose. The mixing ratios of the other geothermal water samples were calculated using the above mixing model, and the results are shown in Table 8. Sample Q011 was found to have the highest mixing ratio (94.3%), and sample Q017 the lowest (41%).
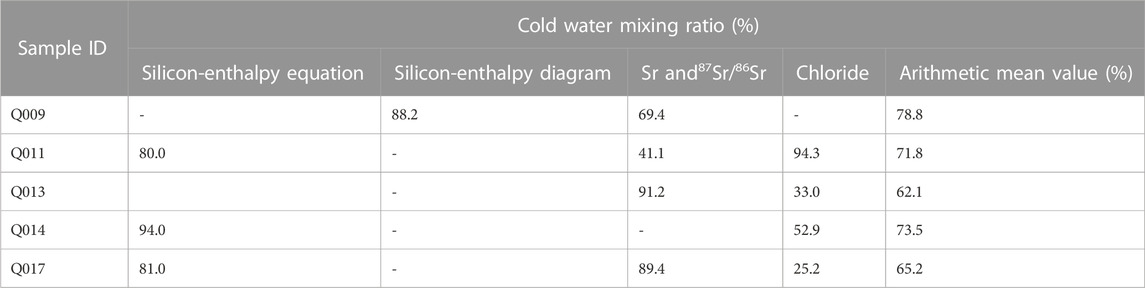
TABLE 8. Mixing ratio of cold water for geothermal water samples in the study area.
In general, there were differences between the cold water mixing ratios calculated using each of the three mixing models. To reduce the error, the arithmetic mean of the three methods was used, producing a mixing ratio of 62.1%–78.8% cold water in the geothermal water of the study area (Table 8).
Stable isotope oxygen (18O) and deuterium (D) compositions are widely used to identify the recharge source of geothermal water (Liu et al., 2017; Qiu et al., 2018). In the present study, all the sample points were close to the global meteoric water line (GMWL) (Craig, 1961) and the local meteoric water line (LMWL) (Li, 2018) without shifting, indicating that both geothermal and cold water in the study area are recharged by atmospheric precipitation (Figure 8).
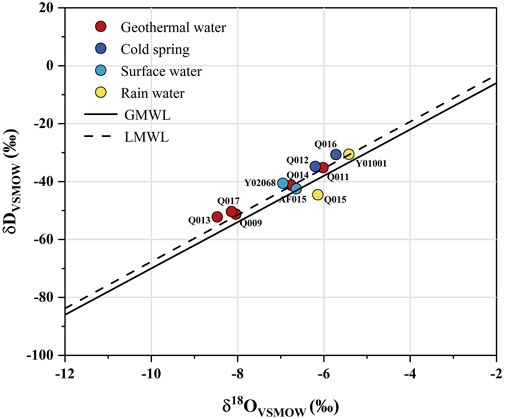
FIGURE 8. δD-δ18O plot of all water samples from the study area. The GMWL (δD = 8δ18O+ 10) and LMWL (δD = 8.06δ18O+ 12.93) are shown for reference.
The recharge elevation of geothermal water can be estimated using the elevation effect of hydrogen and oxygen isotopes; the calculation formula for this method is shown in Eqs. 9–11. For Eq. 9, the δD and δ18O values of atmospheric precipitation (Y01001) in the town of Wentang, Yichun, were selected as the reference values for the calculation; the elevation gradient value of δD was −2‰/100 m (Li, 2018), and that of δ18O was −0.3‰/100 m (Yu et al., 1987).
The results of calculations of the geothermal water recharge elevations in the study area are listed in Table 9. The recharge elevation ranges obtained using δD and δ18O with Eq. 9 were generally consistent, whereas the recharge elevation ranges calculated using δD and δ18O in Eqs. 10, 11 were associated with large errors. Here, to reduce errors, the average of the results calculated using Eq. 9 (using δD and δ18O) and Eq. 10 (using δD) was adopted as the final result. The range of geothermal water recharge elevation in the study area was calculated at 503.1–1,375.6 m. Because all the geothermal water was affected by mixing with shallow cold water, the actual recharge elevation may be higher. Baihe Peak (JinDing), in the western part of Wugongshan, is the main peak in Wugongshan, with an elevation of 1918.3 m, slightly higher than the maximum supply elevation we calculated. Combined with the regional topography and hydrogeological conditions, it can be concluded that the geothermal water originates from the mountains or hills near JinDing on the western side of Wugongshan.
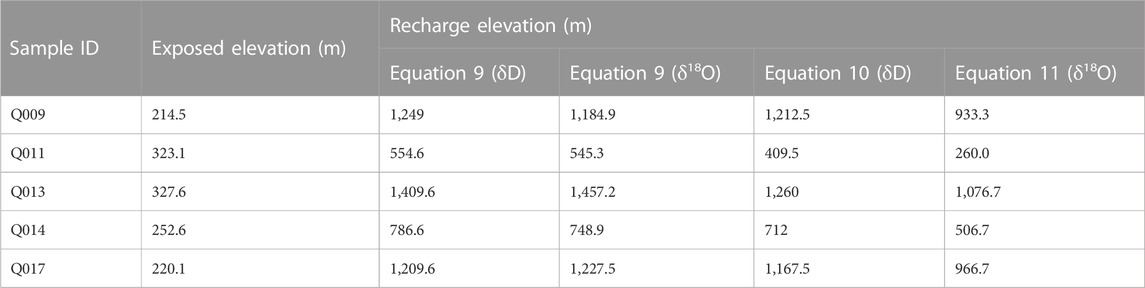
TABLE 9. Geothermal water recharge elevation in the study area.
According to a regional geological and tectonic survey, there are no additional heat sources in the western Wugongshan geothermal area, such as shallow magma chambers or thermogenic active faults. According to the heat source mechanism in the Wugongshan area as established by Zhang et al. (2022a), the heat source of the geothermal system is deep geothermal heat from the Earth’s crust, and the quartzite in the fracture zone facilitates the conduction of deep heat to the shallow area and the surface.
The distribution of thermal anomalies in the area is mainly controlled by the northeast-trending main fracture, which extends farther than others and is large in scale; its cutting depth is also deeper and communicates with the deep part of the Earth’s crust, providing favorable conditions for heat up-conduction in the deep part of the crust and playing a leading role in the formation of geothermal resources. The secondary, northwest- and east-west-trending extensional fracture structures or rift zones of the Neogene period provide favorable channel conditions for the rise of geothermal groundwater. The hanging wall location where these two groups of fractures intersect is broken, and fracture development has occurred; this creates good permeability and water-richness, providing space for geothermal water to be stored and constituting a thermal reservoir. The sediments of the Quaternary system are the primary cap rock of the thermal reservoir in the study area, with tight structure and poor permeability, which allows them to provide heat insulation and prevent water from seeping through. As a result, thermal energy can be effectively preserved and stored. In addition, the presence of thermal water sediments and hydrothermal alteration seals the tectonic fractures, making the fracture system self-sealing and enhancing the completeness of the cap rock.
According to the results of the hydrogen and oxygen isotope analysis, the recharge source of geothermal water in the study area is atmospheric precipitation. The recharge elevation ranges from 503.1 m to 1,375.6 m. Considering the regional topography and hydrogeological conditions, this indicates that the geothermal water is recharged from the mountains or hills near the Jinding Peak on the west side of Wugongshan. The circulation depth ranges from 1729.3 to 2,292.5 m.
In summary, the mechanism of origin of the geothermal water in the western Wugongshan area can be described as follows (Figure 9). Atmospheric precipitation infiltrates deep into the fracture network created by weathering and tectonic activity in the rocks. This water is then heated by the heat flow from the Earth’s crust, causing it to warm up and expand. As a result, the thermal fluid rises due to buoyancy and creates convective circulation with shallow, low-temperature thermal fluid. Since the thermal reservoir in the study area is a strip (fracture-type) thermal reservoir that is strictly influenced and controlled by fracture tectonics of the Neogene period, its convective circulation is mainly vertical convection. The deep circulation of geothermal water is mainly along the runoff of tectonic fracture zone, and it is exposed as a natural hot spring when it encounters water-blocking fractures in low-lying areas or deep canyons such as those of rivers and streams During the process of deep circulation, as the surrounding rocks are mainly Late Jurassic granite, the main mineral composition is potassium feldspar, sodium feldspar, quartz, black mica, etc.,; the geothermal groundwater reacts strongly with the thermal reservoir surrounding rocks to form geothermal water mainly of the Na-HCO3 type and containing additional trace elements, such as F− and H2SiO3.
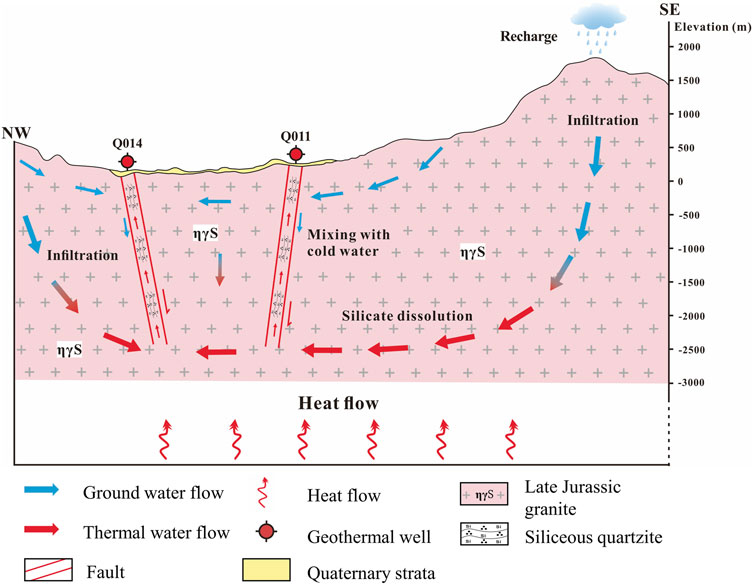
FIGURE 9. Conceptual model of geothermal fluid genesis in western Wugongshan.
Hydrogeochemistry methods, isotope analysis, and geothermometry methods were used to estimate the temperature and analyze the mechanisms of origin of a thermal reservoir in the western part of the Wugongshan area. The hydrochemical results showed that the hydrochemical characteristics of most geothermal water samples were Na-HCO3 and Na-SO4; all cold spring samples were Na-HCO3; and surface water samples were Ca-HCO3. The use of different geothermometers to estimate the thermal reservoir temperature demonstrated that the quartz geothermometers and multi-component geothermometers were more reliable than other options; the thermal reservoir temperature in the study area fell within the range of 80.7°C–98.5°C, and the circulation depth was 1729.3–2,292.5 m.
Based on an analysis of Sr-87Sr/86Sr and chloride, the silicon-enthalpy model and the end-member mixing model revealed that cold water accounted for 62.1%–78.8% of the geothermal groundwater in the western part of the Wugongshan area. The results of isotopic analysis suggested that the geothermal water originated from atmospheric precipitation with a recharge elevation of 503.1–1,375.6 m, and that the recharge area was the JinDing area in the western part of the Wugongshan region.
A conceptual model for the origin of geothermal fluids in the western part of the Wugongshan area was proposed. Under this model, the geothermal water originates from atmospheric precipitation, which seeps down along rock-weathering fractures and tectonic fractures under the influence of gravity. During deep circulation, the water is heated by deep crustal heat flow and then upwells along the faults to the surface in the valley topography.
The original contributions presented in the study are included in the article/Supplementary Material, further inquiries can be directed to the corresponding authors.
LW: investigation, methodology, data curation, visualization, writing–original draft, writing–review and editing. KL: funding acquisition, methodology, supervision, validation, writing–review and editing. SZ: investigation, data curation, writing–review and editing. YZ: investigation, data curation. WJ: investigation, data curation. TY: investigation, data curation. JG: investigation, data curation. All authors contributed to the article and approved the submitted version.
This research was supported by the China Geological Survey (No. DD20221677-2 and DD20201165) and by the Central Public Interest Scientific Institution Basal Research Fund (No. JKY202004 and JKYQN202307).
We thank TY from the China University of Geosciences (Beijing) and JG from the Chinese Academy of Geological Sciences for their help in fieldwork and data collation. We are also grateful to the reviewers and the Associate Editor for their valuable and constructive comments.
The authors declare that the research was conducted in the absence of any commercial or financial relationships that could be construed as a potential conflict of interest.
All claims expressed in this article are solely those of the authors and do not necessarily represent those of their affiliated organizations, or those of the publisher, the editors and the reviewers. Any product that may be evaluated in this article, or claim that may be made by its manufacturer, is not guaranteed or endorsed by the publisher.
Alçiçek, H., Bülbül, A., Brogi, A., Liotta, D., Ruggieri, G., Capezzuoli, E., et al. (2018). Origin, evolution and geothermometry of the thermal waters in the gölemezli geothermal field, denizli basin (SW anatolia, Turkey). J. Volcanol. Geotherm. Res. 349, 1–30. doi:10.1016/j.jvolgeores.2017.07.021
Alqahtani, F., Ehsan, M., Aboud, E., Abdulfarraj, M., and El-Masry, N. (2023). Integrated approach using petrophysical, gravity, and magnetic data to evaluate the geothermal resources at the Rahat Volcanic Field, Saudi Arabia. Front. Earth Sci. 11, 1135635. doi:10.3389/feart.2023.1135635
Arnórsson, S., Gunnlaugsson, E., and Svavarsson, H. (1983). The chemistry of geothermal waters in Iceland. III. Chemical geothermometry in geothermal investigations. Geochimica Cosmochimica Acta 47 (3), 567–577. doi:10.1016/0016-7037(83)90278-8
Bagheri, R., Karami, G. H., Jafari, H., Eggenkamp, H., and Shamsi, A. (2020). Isotope hydrology and geothermometry of the thermal springs, Damavand volcanic region, Iran. J. Volcanol. Geotherm. Res. 389, 106745. doi:10.1016/j.jvolgeores.2019.106745
Belhai, M., Fujimitsu, Y., Barragan-Reyes, R. M., Iwanaga, T., Maeno, M., Ayad, B., et al. (2022). Insights into geochemical characteristics of the geothermal fluids of northwestern Algeria: an updated conceptual model. Geothermics 99, 102304. doi:10.1016/j.geothermics.2021.102304
Chatterjee, S., Sinha, U., Biswal, B., Jaryal, A., Patbhaje, S., and Dash, A. (2019). Multicomponent versus classical geothermometry: applicability of both geothermometers in a medium-enthalpy geothermal system in India. Aquat. Geochem. 25, 91–108. doi:10.1007/s10498-019-09355-w
Chen, H., He, L., Chen, J., Yuan, B., Huang, T., and Cui, Q. (2019). Impacts of clean energy substitution for polluting fossil-fuels in terminal energy consumption on the economy and environment in China. Sustainability 11 (22), 6419. doi:10.3390/su11226419
Craig, H. (1961). Isotopic variations in meteoric waters. Science 133 (3465), 1702–1703. doi:10.1126/science.133.3465.1702
Deng, J., Lin, W., Xing, L., and Chen, L. (2022). The estimation of geothermal reservoir temperature based on integrated multicomponent geothermometry: a case study in the jizhong depression, north China plain. Water 14 (16), 2489. doi:10.3390/w14162489
Duo, J. (2003). The basic characteristics of the yangbajing geothermal field—A typical high temperature geothermal system. Strategic Study CAE 1, 42–47. doi:10.3969/j.issn.1009-1742.2003.01.008
Ellis, A. (1979). Chemical geothermometry in geothermal systems. Chem. Geol. 25 (3), 219–226. doi:10.1016/0009-2541(79)90143-8
Fan, Y., Pang, Z., Liao, D., Tian, J., Hao, Y., Huang, T., et al. (2019). Hydrogeochemical characteristics and genesis of geothermal water from the Ganzi geothermal field, eastern Tibetan Plateau. Water 11 (8), 1631. doi:10.3390/w11081631
Fournier, R. (1977). Chemical geothermometers and mixing models for geothermal systems. Geothermics 5 (1-4), 41–50. doi:10.1016/0375-6505(77)90007-4
Fournier, R. O. (1979). A revised equation for the Na/K geothermometer. Trans. Geotherm. Resour. Counc. 3, 221–224.
Fournier, R. O., and Truesdell, A. (1974). Geochemical indicators of subsurface temperature: part 2, estimation of temperature and fraction of hot water mixed with cold water. J. Res. U. S. Geol. Surv. 2 (3), 263–270.
Fournier, R., and Truesdell, A. (1973). An empirical Na-K-Ca geothermometer for natural waters. Geochimica Cosmochimica Acta 37 (5), 1255–1275. doi:10.1016/0016-7037(73)90060-4
Fowler, A. P., Ferguson, C., and Cantwell, C. A. (2018). A conceptual geochemical model of the geothermal system at Surprise Valley, CA. J. Volcanol. Geotherm. Res. 353, 132–148. doi:10.1016/j.jvolgeores.2018.01.019
Gao, S., Liu, K., Sun, W., and Guo, C. (2022). Chemical characteristics of banded thermal water storage and strontium isotope geochemistry of granites. Yangtze River 53 (08), 36–42+49. doi:10.16232/j.cnki.1001-4179.2022.08.006
Giggenbach, W. F. (1988). Geothermal solute equilibria. derivation of Na-K-Mg-Ca geoindicators. Geochimica Cosmochimica Acta 52 (12), 2749–2765. doi:10.1016/0016-7037(88)90143-3
Giggenbach, W., and Glover, R. (1992). Tectonic regime and major processes governing the chemistry of water and gas discharges from the Rotorua geothermal field, New Zealand. Geothermics 21 (1-2), 121–140. doi:10.1016/0375-6505(92)90073-i
Giggenbach, W., Sheppard, D., Robinson, B., Stewart, M., and Lyon, G. (1994). Geochemical structure and position of the Waiotapu geothermal field, New Zealand. Geothermics 23 (5-6), 599–644. doi:10.1016/0375-6505(94)90022-1
Goswami, S., Rai, A. K., and Tripathy, S. (2022). Re-visiting geothermal fluid circulation, reservoir depth and temperature of geothermal springs of India. J. Hydrology 612, 128131. doi:10.1016/j.jhydrol.2022.128131
Guo, J., Mao, X., Tong, S., and Feng, L. (2016). Using hydrochemical geothermometers calculate exchange temperature of deep geothermal system in west coastal area of guangdong province. Earth Sci. 41 (12), 2075–2087. doi:10.3799/dqkx.2016.144
Guo, Q. (2012). Hydrogeochemistry of high-temperature geothermal systems in China: A review. Appl. Geochem. 27 (10), 1887–1898. doi:10.1016/j.apgeochem.2012.07.006
Han, D., Liang, X., Jin, M., Currell, M., Song, X., and Liu, C. (2010). Evaluation of groundwater hydrochemical characteristics and mixing behavior in the Daying and Qicun geothermal systems, Xinzhou Basin. J. Volcanol. Geotherm. Res. 189 (1-2), 92–104. doi:10.1016/j.jvolgeores.2009.10.011
Henley, R. W., Truesdell, A., Barton, P., and Whitney, J. (1984). Fluid-mineral equilibria in hydrothermal systems. Soc. Econ. Geol. Yale 1.
Jeong, C., Lee, Y., Lee, Y., Ahn, S., and Nagao, K. (2022). Geochemical composition, source and geothermometry of thermal water in the bugok area, South Korea. Water 14 (19), 3008. doi:10.3390/w14193008
Jia, W., Liu, K., Zhang, Y., Zhang, S., He, Q., Sun, J., et al. (2022). Quality evaluation of dome-controlled geothermal fluid. Acta Geosci. Sin., 1–11. Available at: https://kns.cnki.net/kcms/detail//11.3474.P.20221201.0911.001.html.
Karimi, S., Mohammadi, Z., and Samani, N. (2017). Geothermometry and circulation depth of groundwater in Semnan thermal springs, Northern Iran. Environ. Earth Sci. 76, 659–724. doi:10.1007/s12665-017-6983-0
Keesari, T., Chatterjee, S., Kumar, M., Mohokar, H., Sinha, U. K., Roy, A., et al. (2022). Tracing thermal and non-thermal water circulations in shear zones of Eastern Ghats Mobile Belt zone, Eastern India-inferences on sustainability of geothermal resources. J. Hydrology 612, 128172. doi:10.1016/j.jhydrol.2022.128172
Li, J., Zhang, L., Ruan, C., Tian, G., Sagoe, G., and Wang, X. (2022). Estimates of reservoir temperatures for non-magmatic convective geothermal systems: insights from the Ranwu and Rekeng geothermal fields, western Sichuan Province, China. J. Hydrology 609, 127668. doi:10.1016/j.jhydrol.2022.127668
Li, L. (2018). Hydrogeochemistry of hot springs in Yichun area of Jiangxi province. [Master Thesis]. China: East China University of Technology.
Liu, K., Wang, S., Sun, Y., Sun, W., and Zhu, D. (2017). Characteristics and regionalization of geothermal resources in Beijing. Geol. China 44 (6), 1128–1139. doi:10.13544/j.cnki.jeg.2017-047
Liu, K., Zhang, Y., He, Q., Zhang, S., Jia, W., He, X., et al. (2023). Characteristics of thermophysical parameters in Wugongshan area of South China and their insights for geothermal genesis. Front. Environ. Sci. 11, 467. doi:10.3389/fenvs.2023.1112143
Liu, X., Yang, X., Nie, L., and Lei, T. (2016). Baiic characteristics of the magma core complex at Wugongshan, Jiangxi. Acta Geol. Sinica-English Ed. 90 (03), 468–474. doi:10.3969/j.issn.0001-5717.2016.03.004
Lou, F., Shu, L., Yu, J., and Wang, D. (2002). Petrological and geochemical characteristics and origin of the Wugongshan dome granite, Jiangxi Province. Geol. Rev. 1, 264–269. doi:10.16509/j.georeview.2002.01.014
Mao, X., Zhu, D., and Ndikubwimana, I. (2021). The mechanism of high-salinity thermal groundwater in Xinzhou geothermal field, South China: insight from water chemistry and stable isotopes. J. Hydrol. 593, 125889. doi:10.1016/j.jhydrol.2020.125889
Niu, Z., Niu, X., Zhang, C., Chen, D., and Deng, Z. (2022). Hydrochemical characteristics and circulation depth of 8kiigeothermal water in coastal area of Tangshan City. Geol. Surv. China 9 (06), 84–92. doi:10.19388/j.zgdzdc.2022.06.11
Pang, Z. H., and Reed, M. (1998). Theoretical chemical thermometry on geothermal waters: problems and methods. Geochimica Cosmochimica Acta 62 (6), 1083–1091. doi:10.1016/s0016-7037(98)00037-4
Qiu, X., Wang, Y., Wang, Z., Regenauer-Lieb, K., Zhang, K., and Liu, J. (2018). Determining the origin, circulation path and residence time of geothermal groundwater using multiple isotopic techniques in the Heyuan Fault Zone of Southern China. J. Hydrology 567, 339–350. doi:10.1016/j.jhydrol.2018.10.010
Reed, M., and Spycher, N. (1984). Calculation of pH and mineral equilibria in hydrothermal waters with application to geothermometry and studies of boiling and dilution. Geochimica Cosmochimica Acta 48 (7), 1479–1492. doi:10.1016/0016-7037(84)90404-6
Spycher, N., Peiffer, L., Finsterle, S., and Sonnenthal, E. (2016). GeoT user’s guide, A computer program for multicomponent geothermometry and geochemical speciation. Version 2.1.
Sun, J., Liu, K., He, Q., Yu, T., and Deng, Y. (2022). Thermal infrared remote sensing and soil gas radon for detecting blind geothermal area. Geothermics 105, 102534. doi:10.1016/j.geothermics.2022.102534
Sun, W., Liu, K., Bai, J., and Zhang, Y. (2022). Sustainability utilization of the fault-controlled Wentang geothermal field with hydrogeological numerical model at site scale. Front. Earth Sci. 10, 57. doi:10.3389/feart.2022.805129
Syah, B. Y. C. S. S., Itoi, R., Taguchi, S., Saibi, H., and Yamashiro, R. (2019). Hydrogeochemical and isotope characterization of geothermal waters from the Cidanau geothermal field, West Java, Indonesia. Geothermics 78, 62–69. doi:10.1016/j.geothermics.2018.11.003
Truesdell, A., and Fournier, R. (1977). Procedure for estimating the temperature of a hot-water component in a mixed water by using a plot of dissolved silica versus enthalpy. J. Res. U. S. Geol. Surv. 5 (1), 49–52.
Wang, K., and Wang, D. (2002). Applicatin of environmental istopes of the origin and recharge mechanism of geothermal water. Geol. Rev. 48 (S1), 203–209. doi:10.16509/j.georeview.2002.s1.042
Wang, X., Wang, G., Gan, H., Liu, N., Nan, D., and Liu, Z. (2022a). Genetic mechanisms of sinter deposit zones in the Yangyi geothermal field, Tibet: evidence from the hydrochemistry of geothermal fluid. Geothermics 103, 102408. doi:10.1016/j.geothermics.2022.102408
Wang, Y., and Guo, Q. (2010). The yangbajing geothermal field and the Yangyi geothermal field: two representative fields of Tibet in China. Proc. World Geotherm. Congr. 2010, 25–29.
Wang, Y., Li, L., Wen, H., and Hao, Y. (2022b). Geochemical evidence for the nonexistence of supercritical geothermal fluids at the Yangbajing geothermal field, southern Tibet. J. Hydrology 604, 127243. doi:10.1016/j.jhydrol.2021.127243
Wei, Z. A., Shao, H., Tang, L., Deng, B., Li, H., and Wang, C. (2021). Hydrogeochemistry and geothermometry of geothermal waters from the pearl river delta region, south China. Geothermics 96, 102164. doi:10.1016/j.geothermics.2021.102164
Xu, C., Yu, D., and Luo, Z. (2021). Recharge sources and genetic model of geothermal water in Tangquan, Nanjing, China. Sustainability 13 (8), 4449. doi:10.3390/su13084449
Xu, P., Li, M., Qian, H., Zhang, Q., Liu, F., and Hou, K. (2019). Hydrochemistry and geothermometry of geothermal water in the central guanzhong basin, China: a case study in xi’an. Environ. Earth Sci. 78, 87–20. doi:10.1007/s12665-019-8099-1
Yang, P., Luo, D., Hong, A., Ham, B., Xie, S., Ming, X., et al. (2019). Hydrogeochemistry and geothermometry of the carbonate-evaporite aquifers controlled by deep-seated faults using major ions and environmental isotopes. J. Hydrology 579, 124116. doi:10.1016/j.jhydrol.2019.124116
Yu, J., Yu, F., and Liu, D. (1987). The oxygen and hydrogen isotopic compositions of meteoric waters in the eastern part of China. Geochimica 1, 22–26.
Yu, T., Liu, K., Sun, J., Wang, L., and Wang, S. (2022). Hydrochemical Characteristics of Geothermal Water in Anfu Area, Jiangxi Province. Acta Geosci. Sin., 1–13. Available at: https://kns.cnki.net/kcms/detail//11.3474.p.20221221.1243.001.html.
Yuan, J., Xu, F., and Zheng, T. (2022). The genesis of saline geothermal groundwater in the coastal area of Guangdong Province: insight from hydrochemical and isotopic analysis. J. Hydrology 605, 127345. doi:10.1016/j.jhydrol.2021.127345
Zhang, G., Liu, C. Q., Liu, H., Jin, Z., Han, G., and Li, L. (2008). Geochemistry of the Rehai and ruidian geothermal waters, yunnan province, China. Geothermics 37 (1), 73–83. doi:10.1016/j.geothermics.2007.09.002
Zhang, Y., Li, X., Xu, M., Duo, J., Wu, Y., Xiao, Y., et al. (2021). Hydrogeochemical characteeristics of geothermal waters in the daofu area of the xianshuihe geothermal belt. Saf. Environ. Eng. 28 (03), 42–51. doi:10.19826/j.cnki.1009-3850.2023.04005
Zhang, Y., liu, K., He, Q., Hao, M., Guo, C., Bai, J., et al. (2022a). Zircon U-Pb ages, Hf isotopic characteristics, and geological significance of the Mesozoic granites in Wugong Mountains area, Jiangxi. Geol. Rev. 68 (04), 1301–1319. doi:10.16509/j.georeview.2022.05.031
Zhang, Y., Liu, K., Tong, J., He, Q., He, X., Jia, W., et al. (2022b). Characteristics and heat source mechanism of geothermal resources in qianshan area of ji'an, Jiangxi province. Acta Geosci. Sin. 2022, 1–15. Available at: https://kns.cnki.net/kcms/detail//11.3474.p.20221227.1523.001.html.
Keywords: geothermal resources, reservoir temperature, geothermometers, mechanism of origin, Wugongshan area
Citation: Wang L, Liu K, Zhang S, Zhang Y, Jia W, Yu T and Guo J (2023) Estimation of reservoir temperature and analysis of the mechanism of origin of a granite dome-controlled geothermal system in the western Wugongshan area, southeast China. Front. Earth Sci. 11:1226074. doi: 10.3389/feart.2023.1226074
Received: 22 May 2023; Accepted: 18 July 2023;
Published: 11 August 2023.
Edited by:
Ali Abedini, Urmia University, IranReviewed by:
Muhsan Ehsan, Bahria University, PakistanCopyright © 2023 Wang, Liu, Zhang, Zhang, Jia, Yu and Guo. This is an open-access article distributed under the terms of the Creative Commons Attribution License (CC BY). The use, distribution or reproduction in other forums is permitted, provided the original author(s) and the copyright owner(s) are credited and that the original publication in this journal is cited, in accordance with accepted academic practice. No use, distribution or reproduction is permitted which does not comply with these terms.
*Correspondence: Kai Liu, acaner@163.com; Shouchuan Zhang, zhangsc@cags.ac.cn
Disclaimer: All claims expressed in this article are solely those of the authors and do not necessarily represent those of their affiliated organizations, or those of the publisher, the editors and the reviewers. Any product that may be evaluated in this article or claim that may be made by its manufacturer is not guaranteed or endorsed by the publisher.
Research integrity at Frontiers
Learn more about the work of our research integrity team to safeguard the quality of each article we publish.