 Douzhong Zhang1,2*
 Kongquan Chen2Jiguang Tang1Ming Liu3Peixian Zhang3Guisong He3Jun Cai1Xiusong Tuo1,2
- 1School of Geosciences, Yangtze University, Wuhan, China
- 2Cooperative Innovation Center of Unconventional Oil and Gas, Yangtze University, Wuhan, China
- 3Sinopec East China Oil and Gas Company, Nanjing, China
The in-situ stress and formation pressure are important parameters in shale gas development. They directly affect the well wall stability, the direction of horizontal well drilling, and the fracturing effect during the shale gas development process. There are abundant shale gas resources in the southeastern Chongqing-Sichuan area, but the structure in the area is complex, and it is difficult to predict the in-situ stress and formation pressure. Therefore, in this paper, a finite element simulation model was established based on a large number of seismic, logging, and experimental rock mechanics data and the prediction accuracy of the stress field simulation was effectively improved. The construction of the stress field was based on the combined spring model, as well as the data related to the measured in-situ stress and the formation pressure obtained during drilling. The coupling relationship between the in-situ stress, the formation strain, and the formation pressure were derived to carry out the prediction of the distributions of the formation pressure and the formation pressure coefficient. The prediction results showed that the present-day maximum principal stress direction in the study area was about NE65°–110°, and the present-day maximum principal stress was 56.12–93.79 MPa. The present-day minimum principal stress direction was about NE335°–20°, and the present-day minimum principal stress was 48.06–71.67 MPa. The formation pressure was 2.8–88.25 MPa, and the formation pressure coefficient was 0.74–1.55. The formation pressure distribution was greatly affected by fault, tectonic location, in-situ stress and rock petrophysical properties, and the overpressure areas of the formation were distributed in the synclines and the deeply buried areas. This study shows that the finite element based formation pressure prediction method is effective.
1 Introduction
Formation pressure is the reflection of the environmental stress of formation pore fluids, in which vertical load plays a leading role. For shale gas reservoirs, the variation of formation pressure is very large, often manifested as abnormal pressure (Chen et al., 2020; Sun et al., 2023). Abnormal pressure includes abnormal high pressure and abnormal low pressure. The measured formation pressure results are discrete, but the prediction of shale gas sweet spots requires a continuous formation pressure distribution. At this time, the conventional methods based on logging data, such as the Eaton method and the equivalent depth method, make the forecasting strategy of formation pressure further developed (Zhang, 2013). It is obvious that conventional logging method is an indirect method to predict formation pressure. Generally, the response of abnormal high pressure on logging curve is high porosity, low density, low wave velocity and low resistivity; while the abnormal low pressure shows the increase of density and resistivity, and the decrease of acoustic time difference (Sun et al., 2023). However, there are many factors that affect the change of rock porosity, density and acoustic wave time difference, such as undercompaction, temperature, diagenesis and structure (Xiong et al., 2016; Ma et al., 2020). Therefore, the formation pressure obtained by conventional methods often fails in complex structural areas. From the formation mechanism of formation pressure, it is affected by the superposition of overlying load and difference of horizontal tectonic stresses. Therefore, the finite element method based on geomechanics is a more direct method to predict formation pressure.
The Sichuan Basin and its surrounding areas contain rich reserves of shale gas resources, and the proven reserves exceed 2 × 10¹² m3 (Guo et al., 2014; Nie et al., 2021). As the main horizontal section for shale gas exploration and development in southern China, the Silurian Longmaxi Formation has entered a stage of commercial shale gas development (Guo et al., 2014). The Nanchuan Area is another shale gas production area in the Sichuan Basin except for the Jiaoshiba Area (He et al., 2021). The Wufeng-Longmaxi Formation shale gas reserves have reached 1700 × 108 m3, and the Pingqiao Anticline has a shale gas production capacity of 6.5 × 10⁸ m3. The testing production of a single well was 7.1 × 10⁴ to 29.1 × 10⁴ m3/d, and the production varies greatly (He et al., 2021). Since the Mesozoic and Cenozoic, the Sichuan Basin has experienced multiple periods of tectonic movement, resulting in a complex distribution of the magnitude and direction of the in-situ stresses in the Longmaxi Formation (Chen et al., 2020; Ma et al., 2020; Wang, 2020; Luan et al., 2022). The Nanchuan Area is located at the edge of the Sichuan Basin and is a high-pressure–normal-pressure transition zone for shale gas. The pressure coefficient is distributed between 0.8 and 1.5. Therefore, the research on the prediction of the distributions of the in-situ stress and formation pressure plays an important role in the exploration and development of shale gas in this area.
Because of the low porosity and low permeability properties of shale gas reservoirs, horizontal well drilling and hydraulic fracturing technology have been widely adopted worldwide in recent decades to improve shale gas recovery. However, the selection of borehole direction of horizontal wells and the fracture propagation of hydraulic fracturing, are inseparable from the in-situ stress. Numerous previous studies have been conducted on how to predict the in-situ stress field, and relatively mature research methods have gradually been developed, such as the logging interpretation method and the core testing method (Kingdon and Fellgett, 2016; Xing et al., 2018; Zhang et al., 2023). These methods can accurately obtain the in-situ stress data of single wells, but it is impossible to predict the in-situ stress field of an area with no wells. With the continuous progress of research, some researchers have conducted numerical simulation studies on in-situ stress based on finite element principles combining logging calculation and core testing method (Chatterjee and Pal, 2010; Wang et al., 2017; Chen et al., 2018). The reservoir pressure while drilling tester can directly measure the formation pressure of the target zone. The Schlumberger’s Pressure Xpress and Pressure XPresS-HT instruments have also used the Quartzdyne quartz pressure sensors to measure formation pressure (Xue et al., 2023). The core component of these instruments is the quartz pressure sensor, which calculates the real pressure and temperature values through the solution algorithm, and then gets the accurate measurement results of the dynamic response of the formation pressure. In addition, the formation pressure prediction based on logging algorithm depends on the high resolution of logging data. The common interpretation models include effective stress method, Bowers method, empirical statistical model method, equivalent depth method, Eaton method, etc., which determine formation pressure through the compaction characteristics of rocks in the depth domain (Shi et al., 2020). The mechanical modeling method used by most researchers in the process of numerical modeling is to simulate the stress field of the formation outside the fault as an isotropic body (Higgins et al., 2008; Huang et al., 2019; Li et al., 2020). In a complex tectonic zone, the distributions of the mechanical parameters of the rocks within a layer vary considerably (Li et al., 2023; Peng et al., 2023). If the stress field simulation is carried out using an isotropic mechanical model, the accuracy of the simulation results will be greatly affected. Therefore, in this study, we divided the mechanical parameters into different regions based on the distributions of mechanical parameters of rocks, which could effectively improve the accuracy of the simulation results (Yang et al., 2021; Si et al., 2023).
The formation pressure, also known as the formation pore fluid pressure, is one of the important indicators in the evaluation of shale gas preservation. It is an indispensable parameter for determining the safety of drilling operations during the development of shale gas. Its ratio to the hydrostatic pressure, being called the formation pressure coefficient, is also one of the important parameters in the evaluation of shale gas reservoirs. Currently, the method of predicting the formation pressure in a well and the surrounding areas still includes the use of resistivity and sonic logging data (Mouchet and Mitchell, 1989; Sun, 2017; Chen et al., 2021; Li et al., 2021). For the prediction of the formation pressure in an area, the relationship between the acoustic wave time difference of the effective stress equation and the pore pressure can be used (i.e., the Eaton method) (Eaton, 1972; Fillippone, 1979; Carpenter, 2015). The Eaton method can also be used to establish different calculation models for different regions. Therefore, many researchers have used the Eaton method as the basis and have combined the actual geological conditions of each study area to modify the model parameters, which can effectively improve the prediction accuracy of the formation pressure. The application of these methods, however, is inseparable from the development of the layer velocity field model. With continuous research progress, the sampling accuracy of the layer velocity data points must be greater than 12 ms, in order to obtain formation pressure prediction results that meet the accuracy requirements (Xu et al., 2015; Huo et al., 2021). The accuracy of the layer velocity modeling in complex tectonic zones cannot meet the requirement for formation pressure prediction. The method of predicting the formation pressure is mainly to use logging data to predict the values in the wells and surrounding areas. It is difficult to predict the formation pressure in areas between wells.
Using the principle of finite element numerical simulation, in this study, we used the seismic data and logging data and the ANSYS Software to predict the in-situ stress field of the Longmaxi Formation in the Nanchuan Area. Additionally, considering the characteristics of the lateral isotropy and longitudinal anisotropy of the shale reservoirs, the formation pressure and formation pressure coefficient were predicted based on the combined spring model. The prediction results of the formation pressure distribution obtained in this study can provide a reference for the deployment, exploration, and development of a shale gas well networks in similar areas.
2 Geological background
The study area is located in the southeast part of the Sichuan Basin (southwest of the Jiaoshiba Area) (Figure 1). The Silurian Longmaxi Formation in this area was deposited in a deep-water shelf sedimentary environment (He et al., 2021). The shale of the Longmaxi Formation have three main lithofacies: siliceous shale, mixed shale and clay shale (Ju et al., 2019). The deposition environment was characterized by a high paleo-productivity and an anoxic environment (Wang et al., 2017), resulting in the enrichment of organic matter and providing the area with a rich source material (Figure 2). In terms of the tectonic location, the area is located in the tectogene on the southeastern margin of the Sichuan Basin. The surface undulates greatly in this area. The Jurassic strata are exposed in the northwest, and the Silurian strata are exposed in the southeast. Overall, the burial depth of the target layer gradually decreases from northwest to southeast, and the burial depths are 500–5,800 m. Most of the faults in the Nanchuan Area have a strike of the north-east direction. The causal mechanism in these faults was the long-distance conduction of the intracontinental orogeny in the Jiangnan Uplift. In the Mid-Yanshanian, the study area was subjected to a thrusting stress from the south-east, causing the faults to be mainly north-east trending. In the Late Yanshanian, a small number of nearly south-north trending faults were formed under a east-west trending stress (Wang et al., 2017). Currently, because of the influence of the compression of the Indian and Eurasian Plates, the main body of the Qinghai-Tibet Plateau has moved eastward, producing an eastward compressive stress. After transmission, a southwest-northeast compressive stress field was formed in this area (Wang and Shen, 2020).
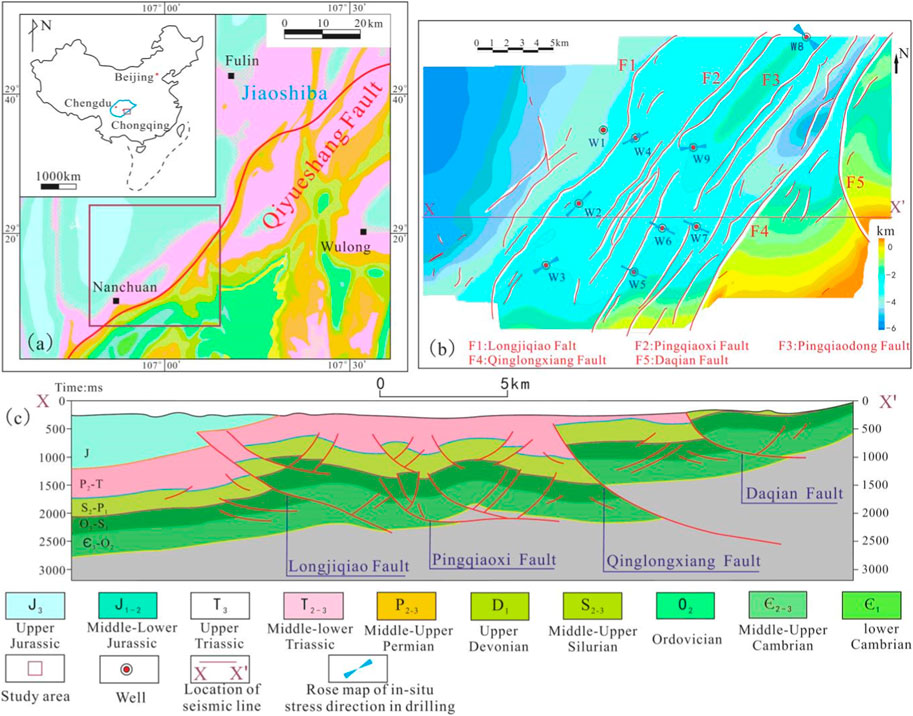
FIGURE 1. (A) Location of the study area; (B) basal boundary tectonic map of the Silurian Longmaxi Formation in the Nanchuan Area; and (C) structural profile of a survey line XX’.
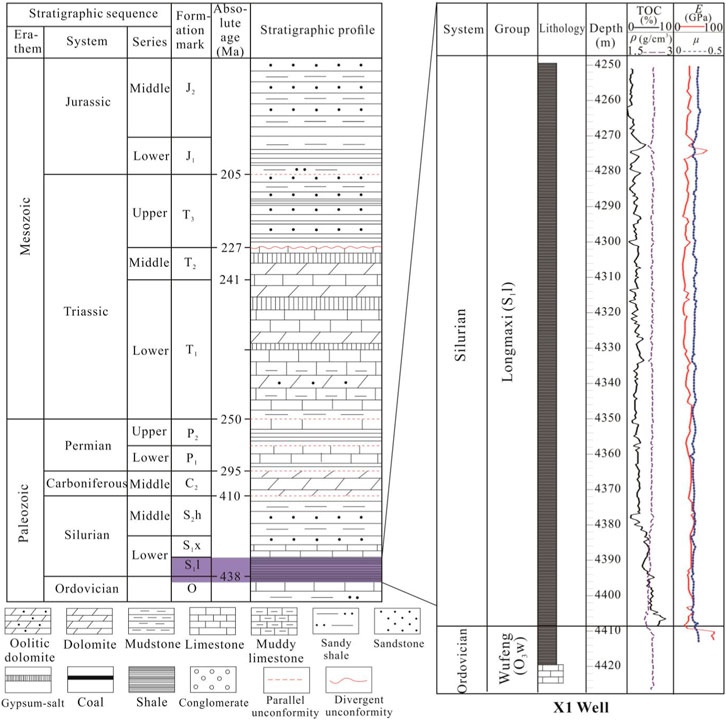
FIGURE 2. Comprehensive stratigraphic units of the Nanchuan area, eastern Sichuan Basin.
The tectonic deformation on the boundary of the study area is mainly controlled by the Qinglongxiang Fault, and the internal tectonic deformation is controlled by the Pingqiaoxi, Longjiqiao, and Yangchungou Faults (Figure 1). The Qinglongxiang Fault is a basement thrust fault that thrusts upward to the surface. The fault runs through the entire study area from north to south and has a large fault dips to the northeast. The Permian upper-plate is exposed and a Cambrian detachment has developed, causing the Daqian Fault to slip along the Middle Cambrian strata. The development of a fault-propagation fold resulted in the formation of the Baima Syncline. In addition, the southern section of the Daqian Fault changes from northeast to north-northwest because of the change in the direction of tectonic stress. Affected by the Daqian Fault and the Qinglongxiang Fault, the northward dipping Shiqiao Nasal Shape Structure was formed. The Precambrian detachment at the bottom is strong. The basement fault extends farther, crossing the Qinglongxiang Fault, and the upper Silurian strata contains almost no detachment. The tectonic deformation to the west of the Qinglongxiang Fault and the east of the Longjiqiao Fault is relatively strong. The Precambrian basement fault detachment gradually weakens and eventually disappears at the bottom of the Longjiqiao Fault. The upper cap rocks are mainly controlled by the Cambrian detachment and the development of the fault-related folds, such as the Dongsheng Anticline and the Pingqiao Anticline. They all plunge to the northeast and disappear. To the west of the Longjiqiao Fault, the deformation progressively weakens. Therefore, there is no strong faulting and folding in the forward belt of the thrust nappe structure, and only detachment occurs. For the tectonic deformation in eastern Sichuan, the Cambrian is the main detachment surface of the along-bedding detachment. The stratigraphic angle of the lower plate of the fault is relatively small, and the overall low-angle slope transitions to an open syncline in the basin. In some areas, the north-northwest trending fault cuts the early small northeast-trending fault because of the later transformation. In the southern areas, a nearly south-north trending fault-propagation fold has formed because of the nearly east-west compression in the late period.
3 Methods
3.1 Numerical simulation of in-situ stress
The present-day stress field is the in-situ stress field caused by the present-day tectonic stress. This stress directly affects the core technologies used in shale gas development, including the horizontal well drilling and hydraulic fracturing technology. Carrying out research on the present-day stress field in complex tectonic transform areas is conducive to finding favorable areas for shale gas production. The factors that affect the distribution of in-situ stress field mainly include the characteristics of structural development, rock mechanical properties, fault distribution characteristics, boundary stress environment (the direction and size of tectonic stress), etc. In this study, the simulation study of in-situ stress field in the Nanchuan area of the Eastern Chongqing is carried out based on the finite element method.
In-situ stress field simulation mainly includes the following steps: 1) Geological model; 2) Mechanical model; 3) Determination of boundary conditions; 4) Numerical simulation results; 5) Computer calculations and analyses of the simulation results.
3.1.1 Geological model
The geological model is the basic model of the numerical simulation of the in-situ stress field, which directly affects the mechanical model, mathematical model, the division of boundary elements, and the gap of finite elements (Kaiser et al., 2005; Barba et al., 2010; Ju and Wang, 2018; Wu et al., 2021). On the basis of seismic data and the basal boundary tectonic map of the present-day Longmaxi Formation in the Nanchuan area, a basic geological model was established. To establish a geological model that fully reflects the main geological characteristics of the study area, the model considered all the faults that control the tectonics (Jiu et al., 2013; Ju et al., 2017; Liu et al., 2022). The geological data revealed that for the major faults in the area (i.e., the Longjiqiao Fault, Pingqiaoxi Fault, Pingqiaodong No. 1 Fault, Qinglongxiang Fault, and Daqian Fault), the cutting horizon is generally the Cambrian-Permian, which extends upward to the surface and downward to the Precambrian basement.
3.1.2 Mechanical model
The simulation scheme used in this study adopted the finite element analysis method to treat the research area as an ideal elastic body, and the simulation was carried out under this state. The strain was produced on the plane as a result of the action of the stress, and the stress and strain in each finite element were assumed to be uniform.
The reasonable selection of the mechanical parameters of the rocks directly affects the accuracy of the numerical simulation. Therefore, in this study, the overall characteristics of the rock series were considered when selecting the regional mechanical parameters of the rocks. The geological model used in this study was mainly divided into two units: the fault unit and the surrounding rock unit. The values of the physical parameters of these two units were different, but each was regarded as an isotropic elastic body. According to the compressional wave time difference, shear wave time difference, and density data for the Longmaxi Formation in the study area, the following equations were used to calculate the elastic modulus and Poisson’s ratio of the formation (Xu, 2014):
Where Ed is dynamic Young’s modulus (GPa); μd is dynamic Poisson’s ratio; ρ is rock density (kg/m3); △tp is compressional wave time difference (μs/m); and △ts is shear wave time difference (μs/m).
The dynamic-static conversion equation for the mechanical parameters of the rocks was used for the mechanical property interpretation (Xiong et al., 2016). The conversion equations for the mechanical parameters of the rocks in the study area are as follows (Eqs 3, 4):
Where Ed and Es are dynamic and static Young’s modulus (GPa); μd and μs are dynamic and static Poisson’s ratio.
3.1.3 Determination of boundary conditions
Affected by the compression of the Indian Plate and the Eurasian Plate, a southwest-northeast compressive stress field has formed in the southeastern margin of the Sichuan Basin. The direction of the drilling-induced fractures in the Nanchuan Area was statistically analyzed, and the results showed that the present-day maximum principal stress direction is NE65°–150° (Figure 1). It represents the range of a clockwise rotation from NE65° to 150°. The range of angles covered by this result is 85°. For complex structural zones, deflection in the direction of principal stress exceeding 90° is common (Higgins et al., 2008; Ju et al., 2019). The large deflection in the direction of the principal stress is due to a well-developed faults in the study area (Figure 1). Therefore, fault is the factor that cause the disturbance of local stress and its direction deflection. There are many methods for obtaining in-situ stress, such as the triaxial rock mechanics experiments, the logging data calculation method, the hydraulic fracturing method, and the borehole stress relief method. In this study, we mainly use the logging data to calculate the in-situ stress data for the drilled wells in the area. The calculation results revealed that the maximum principal stress in the study area is 63.3–78.39 MPa, and the minimum principal stress is 54–68.16 MPa. The simulation experiment was repeated to obtain the most suitable loading data.
Because the in-situ stress situation is relatively complex and it is not clear how the stress acts on the boundary, in this study, we assumed the stress on the boundary to be uniform. A geological model was established using the ANSYS Software, and the corresponding mechanical parameters were assigned to the geological units. In the model developed in this study, a three-node triangular element was used for the grid division. According to the principle of finite element division, the grid units of the fault and its surrounding area were small, with a high grid density; and the grids in the other areas were large, with a small density. After the division, the grid of the model contained 59,363 nodes and 29,632 elements in total. After several simulations, the optimal simulation results were obtained when the maximum principal stress (75 MPa) and the minimum principal stress (65 MPa) were applied at 45° northeast and 135° northwest from the boundary, respectively (Figure 3).
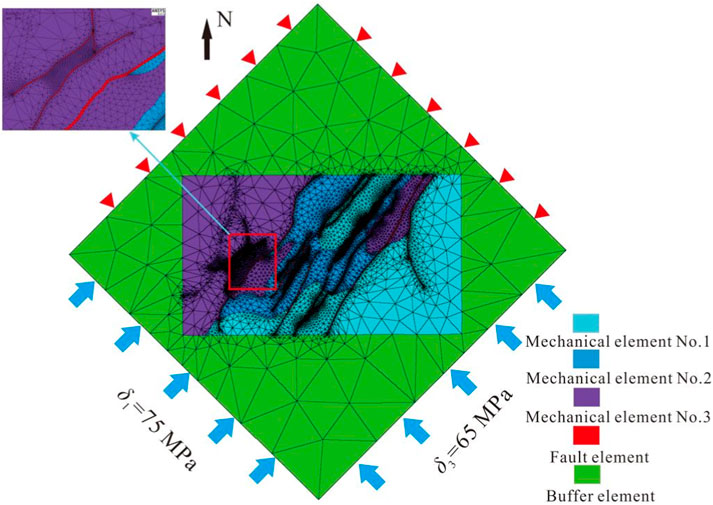
FIGURE 3. Model grid division using ANSYS. δ1 and δ3 represent the horizontal maximum and minimum principal stresses respectively.
In the finite element method, the geological body is regarded as a finite continuous element connected by nodes. By endowing the geological body with mechanical parameters and imposing boundary stress conditions, the changes of stress, strain and displacement of each node in the region under the stress environment are calculated, which never reflects the change characteristics of the stress field of the geological body.
The displacement of any node (x, y) in the model can be expressed as:
Where w and v are the displacement in the X and Y direction, respectively.
Based on geometric equations, the relationship between strain and displacement is presented.
Strain matrix is expressed as:
Where [b] is geometric matrix, [δ] is nodal displacement matrix.
According to the principle of virtual displacement, The derived node load matrix is:
Where [P] is integral nodal load matrix, [K] is integral stiffness matrix, [δ] is node displacement matrix.
Based on the elastic mechanics equation, the relationship between stress and strain is:
Where [D] is elasticity matrix.
3.2 Method of predicting formation pressure
Formation pressure is the pressure of fluids in the pores of an underground rock mass on the rock’s skeleton, and it interacts with the in-situ stress. In particular, in strongly deformed tectonic zone, the deformation of the underground formation is complex, and the relationship between the in-situ stress and the formation pressure also becomes more complex. Therefore, the shale formation in the study area is considered to be a transversely isotropic medium and a longitudinally anisotropic medium based on the linear isotropic combined spring model (Thiercelin and Plumb, 1994). According to the theory of solid mechanics, we derived the relationship between the formation pressure and the in-situ stress under formation deformation. Logging data can accurately reflect the downhole formation pressure. Because of the complexity of the underground formation and the impacts of multiple factors, such as the tectonics and burial depth (Wang et al., 2010; Brooke-Barnett et al., 2015; Rajabi et al., 2017; Zeng et al., 2019), it can be difficult to predict the planar distribution characteristics of the formation pressure from the drilling data. Accurate prediction of the formation pressure distribution can effectively guide the deployment of the well networks for shale gas development. The technical process of this study is shown in Figure 4.
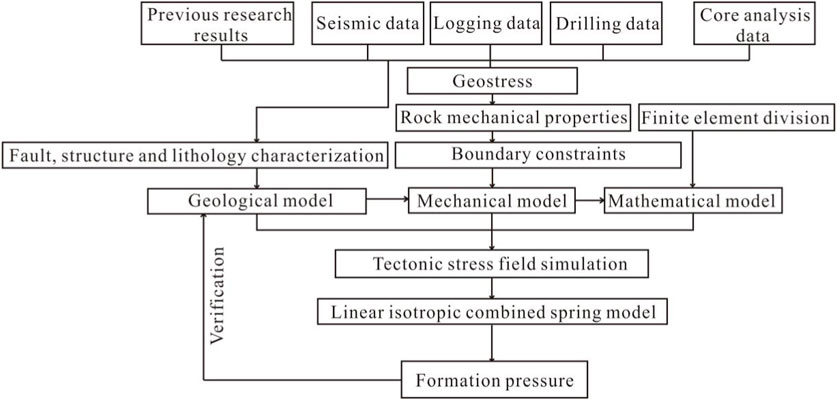
FIGURE 4. Technical process of this study (modified after Ding et al., 2016).
3.2.1 Linear isotropic combined spring model
Based on the generalized Hooke’s law, the linear isotropic combined spring model of various systems comprehensively considers the influences of various factors, such as the formation’s elasticity, the tectonic pressure, and the tectonic deformation. In addition, this law has been applied widely in the prediction of the in-situ stress in shale formations (Thiercelin and Plumb, 1994; Ostadhassan et al., 2012; Najibi et al., 2017).
Therefore, various factors, such as the horizontal stress, the tectonic deformation of the formation, and the overlying formation pressure, are used as the basic information to determine the coupling relationship between the stress, strain, and formation pressure based on the linear isotropic combined spring model (Eqs 10, 11) and the geological characteristics in the Nanchuan Area. Then, a formation pressure prediction equation suitable for the strong tectonic deformation (Eq. 12 in the study area is established. The equation is as follows:
Where α is Biot coefficient; Pp is formation pore pressure (MPa); μ is Poisson’s ratio; σv is overlying formation pressure (MPa); σH is horizontal maximum principal stress (MPa); σh is horizontal minimum principal stress (MPa); E is Young’s modulus (MPa); εH is maximum principal strain in the horizontal direction; and εh is minimum principal strain in the horizontal direction.
In this study, the Biot coefficient was obtained according to the differential equivalent medium model (Zou and Chen, 2018; Zhou et al., 2022). There is a positive correlation between Biot coefficient and porosity. The calculated results show that the average Biot coefficient of the Longmaxi shale is 0.76.
3.2.2 Formation strain
The formation strain (i.e., the formation’s linear strain) is the ratio of the length increment caused by the deformation of a small line segment of the formation in a certain direction to the original length. The formation strain directly affects the correlation between the horizontal stress and the vertical stress (Lv et al., 2022). In the horizontal area of the formation, the interaction between the horizontal stress and the vertical stress was almost nonexistent (Lv et al., 2022). As the degree of formation deformation increased, the mutual influence of the horizontal stress and the vertical stress also increased. The Petrol Software was used to extract the maximum and minimum curvature values (KH and Kh, respectively) of the strata in the Longmaxi Formation tectonic map (Figure 5). Using the thin plate theoretical Eqs 13, 14 (Sun, 2017), the horizontal maximum and minimum structural strains εH and εh in the horizontal direction are calculated:
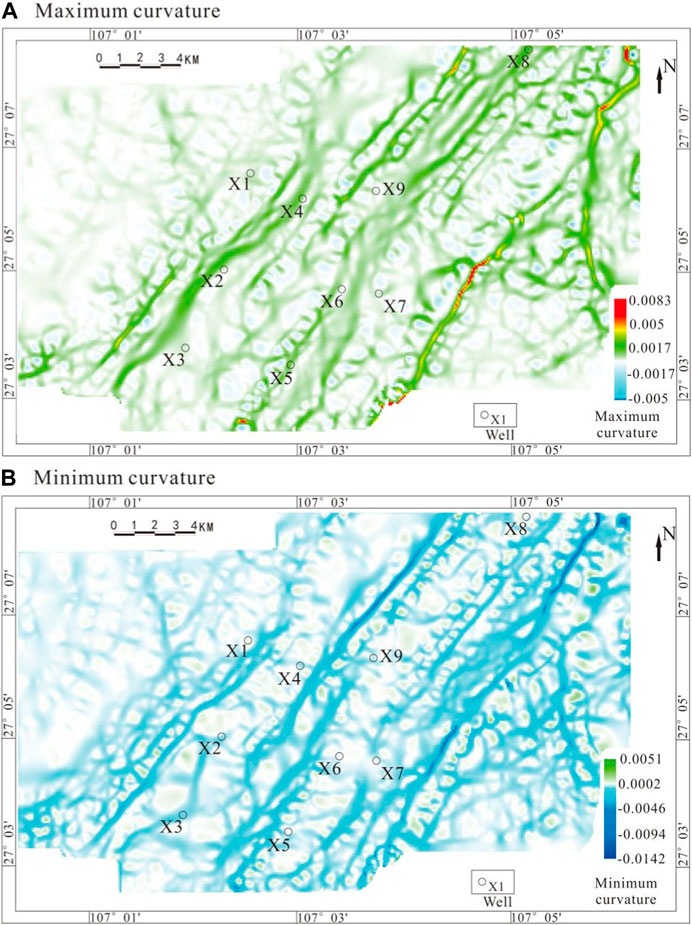
FIGURE 5. Curvature distribution of Silurian Longmaxi Formation in the Nanchuan area: (A) Maximum curvature; and (B) Minimum curvature.
Where εH is horizontal maximum strain; εh is horizontal minimum strain; h is burial depth of tectonic curved surface (m); KH is maximum curvature in horizontal direction; and Kh is minimum curvature in horizontal direction.
3.2.3 Overburden pressure
The overburden pressure is the gravity of the overlying formation, and it was calculated according to the basic gravity calculation equation:
where σv is pressure of overlying formation (MPa); h is buried depth (m); ρ(h) is the function of change in formation density with increasing depth (g/cm3); and g is acceleration of gravity (m/s2).
Because of the density of the overlying formation, it is not an isotropic body and is greatly affected by the burial depth of the formation. According to the density logging data for wells X1, X2, and X4 in the Nanchuan Area, the relationship between the density of the overlying formation and the depth was fitted as follows (Figure 6; Eq. 16):

FIGURE 6. Fitting of density logging data from wells in the Nanchuan Area.
The fitted equation for the density of the overlying formation (Eq. 16) was substituted into the equivalent overlying formation pressure equation (Eq. 12), and the overlying formation pressure for the wells with drilling data in the area was calculated. The fitting results are given in Table 1. The deviations of the calculation results were all less than 1%, which was within the allowable deviation range. These results show that the calculation results of this equivalent equation can effectively reflect the pressure distribution of the formation overlying the Longmaxi Formation in the Nanchuan Area.
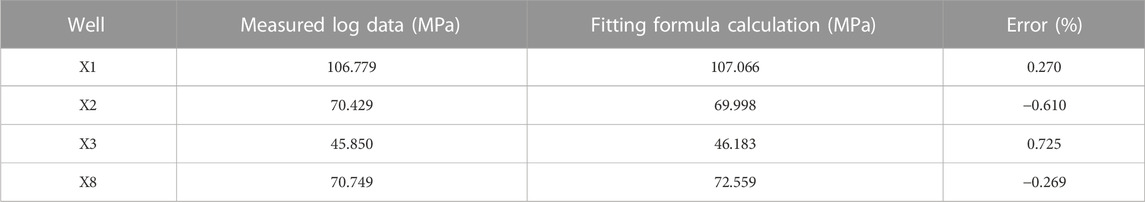
TABLE 1. Fitting of overlying formation pressure.
4 Results
4.1 Interpretation results of rock mechanics parameters
To verify the accuracy of the calculation results of the mechanical parameters, rock samples were collected from wells X1 and X2 in the Longmaxi Formation in the study area.
The data from the triaxial stress tests were fitted with the seismic calculation data (Table 2; Figure 7). The rock mechanics parameters shown in Figure 2 include Young’s modulus and Poisson’s ratio. These values are obtained from the linear elastic section in the middle segment of the curve in Figure 7, which represents the stable mechanical state of the rock underground (Yin et al., 2018). The fitting results showed that the deviation of the Young’s modulus was less than 1%, and the deviation of the Poisson’s ratio was less than 8%. These deviations were within the acceptable range, so the calculation results were reliable.
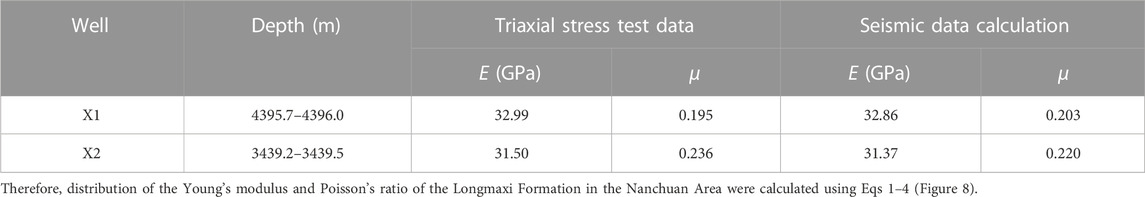
TABLE 2. Fitting of the mechanical parameters of the Silurian Longmaxi Formation in the Nanchuan Area.
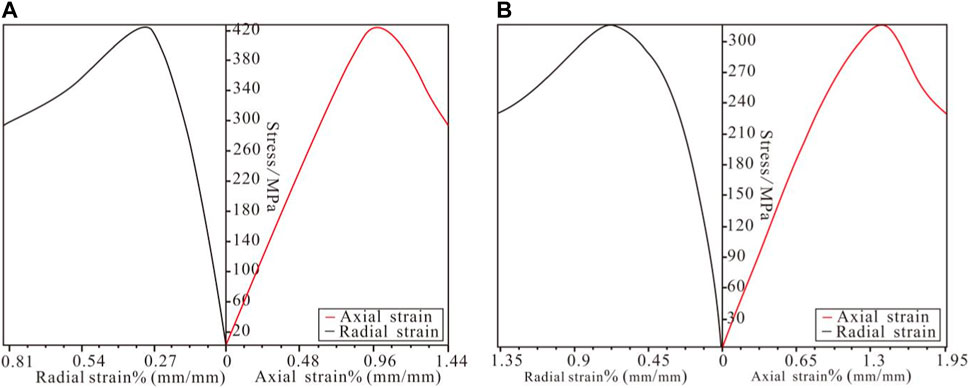
FIGURE 7. Stress-strain curves for the Longmaxi Formation shale in the Nanchuan Area: (A) sample from Well X1; and (B) sample from Well X2.
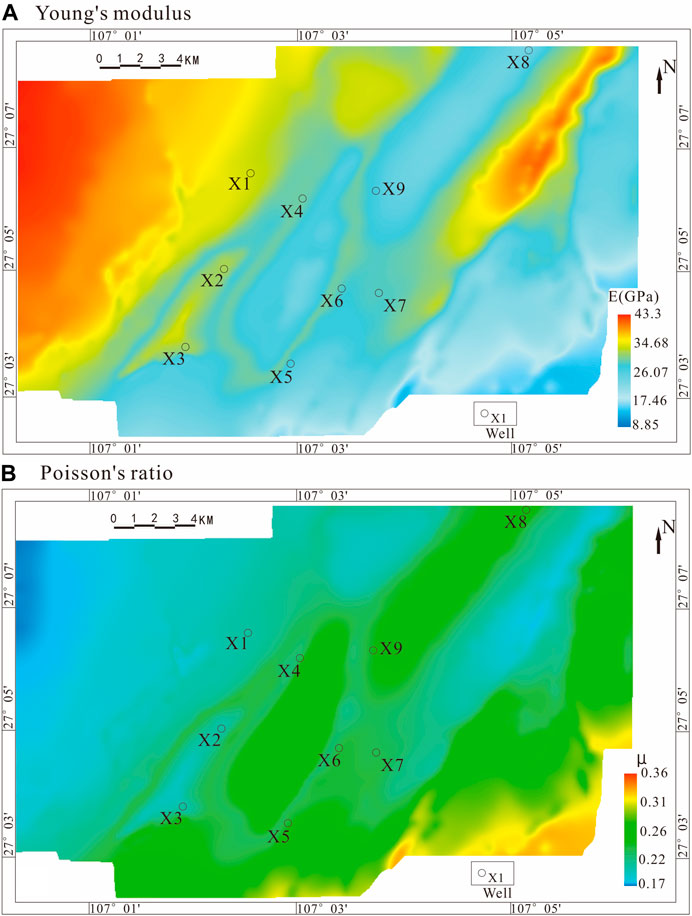
FIGURE 8. Distribution of mechanical parameters of the Silurian Longmaxi Formation in the Nanchuan Area: (A) Young’s modulus; and (B) Poisson’s ratio.
According to the differences in the distributions of the Young’s modulus and Poisson’s ratio, different mechanical units were defined, and the average values of the Young’s modulus and the equivalent Poisson’s ratio of the rock in the different regions were calculated (Table 3). The mechanical parameters of faults were generally selected to be 50%–70% of the Young’s modulus of the surrounding rock. In contrast, the Poisson’s ratio of the fault was larger than that of the normal sedimentary strata, and the difference between the two was usually between 0.02 and 0.1. The values for the buffer area were generally selected as the average Young’s modulus and Poisson’s ratio values of the simulated area (except for the fault area).
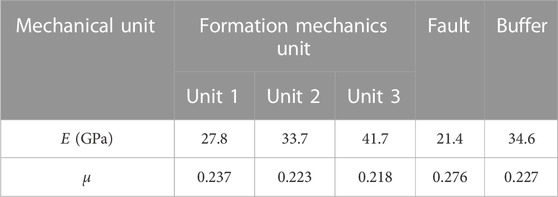
TABLE 3. Mechanical parameters used in the simulation of the stress field in the Nanchuan Area.
4.2 Numerical simulation of in-situ stress
The comparison results of the measured values of the in-situ stress obtained by drilling in the study area show that the deviations between the simulated horizontal maximum principal stress and the actual measured in-situ stress were all less than 3 MPa, and the stress deviation rate was less than 2% (Table 4). The deviations between the simulated minimum horizontal principal stress and the measured in-situ stress were all less than 4 MPa, and the deviation rate was mostly less than 5%. The deviation rate of the horizontal differential stress (the difference between the horizontal maximum principal stress and the horizontal minimum principal stress) was slightly higher, but most of the values were less than 15%, and the deviations were less than 2 MPa. After comprehensive analysis, we concluded that the deviation of the simulation results was within a reasonable range and that they generally conformed to the actual geological law.
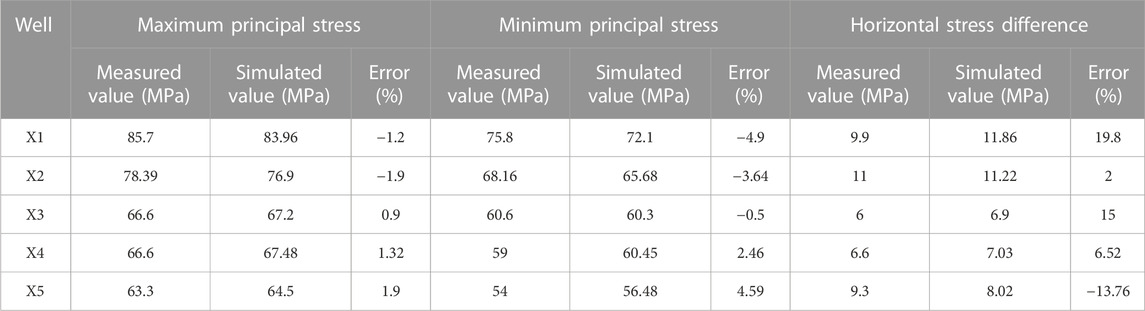
TABLE 4. Comparison of present-day in-situ stress field data.
(1) Present-day maximum principal stress
The simulation results revealed that the study area is in a compressive stress field environment, and the present-day maximum principal stress direction is NE65°–110°, which is consistent with the direction of the drilling-induced fractures. Because of the impact of the pre-existing faults, when the in-situ stress acts on the fault, component forces will be generated along the fault direction, causing the direction of the maximum horizontal principal stress to deflect to the east (Figure 9A).
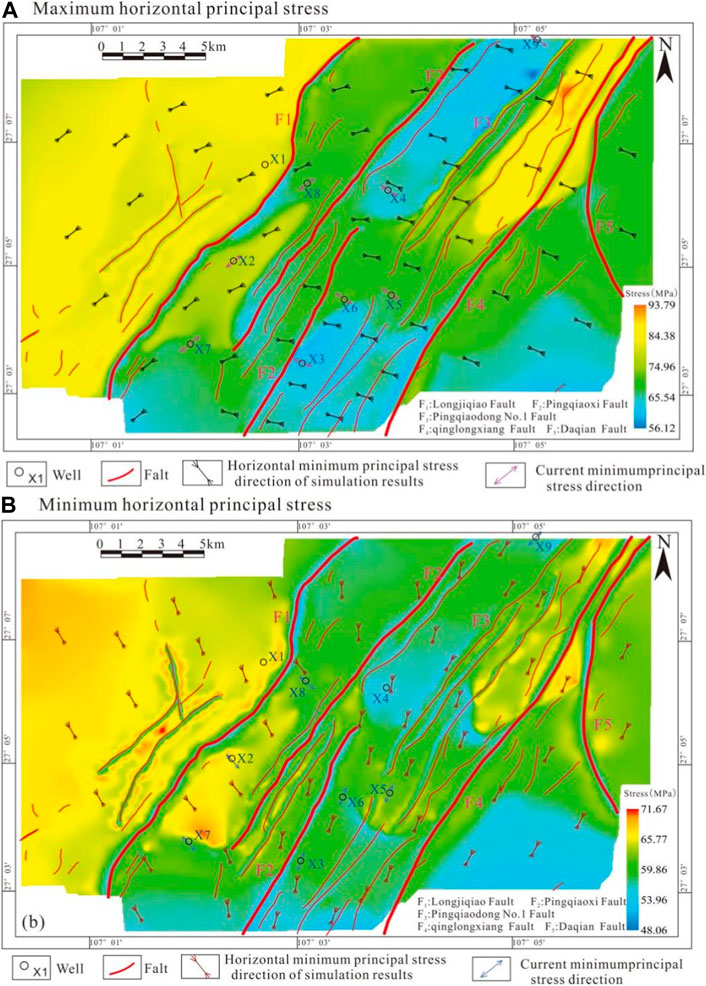
FIGURE 9. In-situ stress field of the Silurian Longmaxi Formation in the Nanchuan Area: (A) maximum horizontal principal stress; and (B) minimum horizontal principal stress.
The difference between the directions of the maximum horizontal principal stress on the east and west sides was approximately 45°. The range of the maximum principal stress was 56.12–93.79 MPa. The maximum principal stress values in the anticline and the fault zone were the smallest (52.32–68.5 MPa), and they were in the low-stress area. However, the stress values at the tip of the extension of the fault zone and the bend area of the fault were relatively large, and stress concentration occurred in these areas. The region can be regarded as being in a critical state, in which the fracture has been about to penetrate and form a fault, but this penetration has not yet occurred.
The high- and low-stress areas of the faults with different strikes and the nearby areas also were different. The stress values of the southwest-northeast trending faults in the study area were slightly smaller than those of the southeast-northwest trending faults. For example, for the faults in the west, when the tectonic stress was transmitted in the areas containing faults with different strikes, the difference in the strike of the fault caused a change in the equivalent physical parameters of the rocks near the fault, resulting in a change in the fault stress and also a change in the stress value in the surrounding areas. The present-day maximum principal stress in the area to the left of the Longjiqiao Fault (F1) in the study area was relatively large. The burial depth of the stratum in this area was greater than 4500 m, and the confining pressure was relatively large, which affected the mechanical parameters of the rock to a certain extent. The burial depth in the area on the right of the Longjiqiao Fault (F1) was relatively shallow, and the present-day maximum principal stress value was relatively small. The stress value in the syncline area in this zone was higher than that in the nearby flat area. Excluding the influence of the faults, the core area of the anticline was significantly larger than its wing area. However, the situation was the opposite in the anticline area, and the stress value in this area was relatively low. The compressive stress in the core area of the anticline was the smallest, and it has gradually increased toward the two wings.
(2) Present-day minimum principal stress
The present-day minimum principal stress of the Longmaxi Formation in the Nanchuan Area, Eastern Chongqing, is also compressive stress, and the direction of the stress is NE335°–20°, which is consistent with the direction of the well wall collapse during drilling. The present-day minimum principal stress value is in the range of 48.06–71.67 MPa (Figure 9B).
The distribution of the minimum principal stress throughout the entire area was uneven. The distribution of the low-value area was obviously controlled by the faults and depth. The fault zone area was a low-value area with values of 48–55 MPa. Similarly, with the Longjiqiao Fault (F1) as the boundary, the minimum horizontal principal stress values to the west of the fault were relatively large (69.3–71.3 MPa), and the values to the east of the fault were relatively small (50.6–68.1 MPa). They also were affected mainly by the distribution of the mechanical parameters of the rocks.
5 Discussion
5.1 Distribution law of formation pressure
The formation pressure prediction equation (Eq. 5) is used to obtain the distribution of the formation pressure in the study area (Figure 8). The results were fitted using the measured formation pressure data (Table 5). The formation pressure of the target zone is obtained through pressure measurement while drilling, and the mud pulse signal is used to measure formation pressure in real time. The equipment used is SDC-I pressure gauge while drilling.
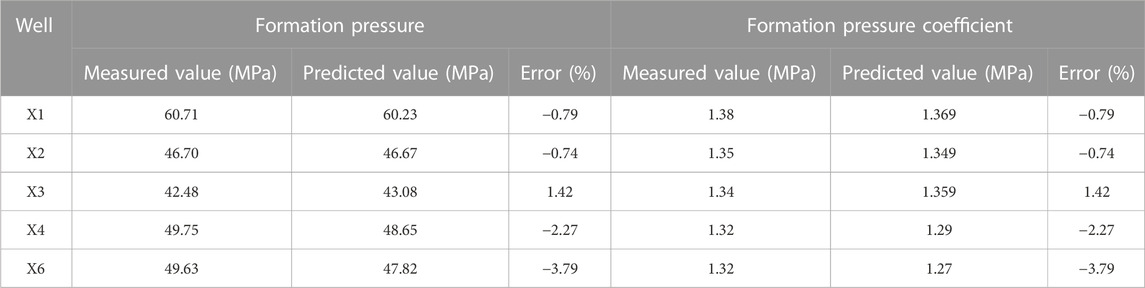
TABLE 5. Fitting of the formation pressure and formation pressure coefficient.
The predicted values were compared with the actual measured data. The results revealed that the deviations between the predicted values of the formation pressure and the measured values were less than 3 MPa, the deviation percentage was less than 4%, and the deviation of the formation pressure coefficient results was also less than 0.05 (Table 5). The deviations were within the allowable range, the results were generally consistent with the actual geological laws, and the simulation results were reliable. The results show that the coupling relationship between ground stress, formation strain and formation pressure can be well applied in complex deformation area, and the accuracy of formation pressure prediction can be improved.
Based on the formation pressure prediction results (Figure 10), the range of the formation pressure in the area was 2.8–88.25 MPa. The distribution of formation pressure is affected by many factors such as fault, in-situ stress, tectonic location and petrophysical parameters. The distribution of the formation pressure was greatly affected by the burial depth of the formation and the tectonic position (Chatterjee, 2008). The areas with high formation pressures were distributed mainly to the west of the Longjiqiao Fault (F1) and in the syncline area between the Pingqiao No. 1 Fault (F3) and the Qinglongxiang Fault (F4). The formation pressures are in these areas were between 55.78 MPa and 88.25 MPa. Additionally, the burial depths of the formation in these two areas were large (>3500 m). The area with a low formation pressure was distributed mainly in the southeastern part of the study area. The burial depth of formation in this area (<1,000 m) was the shallowest in the study area, and the formation pressure was less than 20 MPa. The main reason for this was that in the shallow buried area, the overlying strata pressure is low, the positive pressure on the shale bedding surface of Longmaxi Formation is reduced, the fracture is in the open state, resulting in the shale gas escape. In the area where the degree of formation deformation was large, the formation pressure gradient was relatively large, about 12 MPa/km. In the areas with a small degree of formation deformation, the formation pressure gradient was relatively small, about 3 MPa/km.
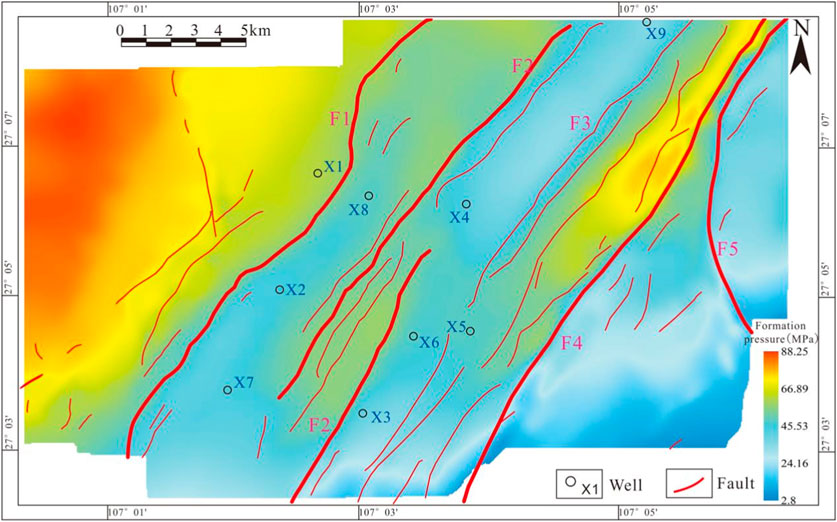
FIGURE 10. Formation pressure distribution of the Silurian Longmaxi Formation in the Nanchuan Area.
The coefficient of formation pressure is the ratio of formation pressure to hydrostatic pressure at the same depth, which can directly reflect the change of formation pressure system in the area, and plays an important role in drilling safety and well pattern layout. The Eq. 17 is used to calculate the distribution of the formation pressure coefficient (Figure 11).
where αp is formation pressure coefficient; Pp is formation pressure (MPa); and Ph is hydrostatic pressure (MPa).
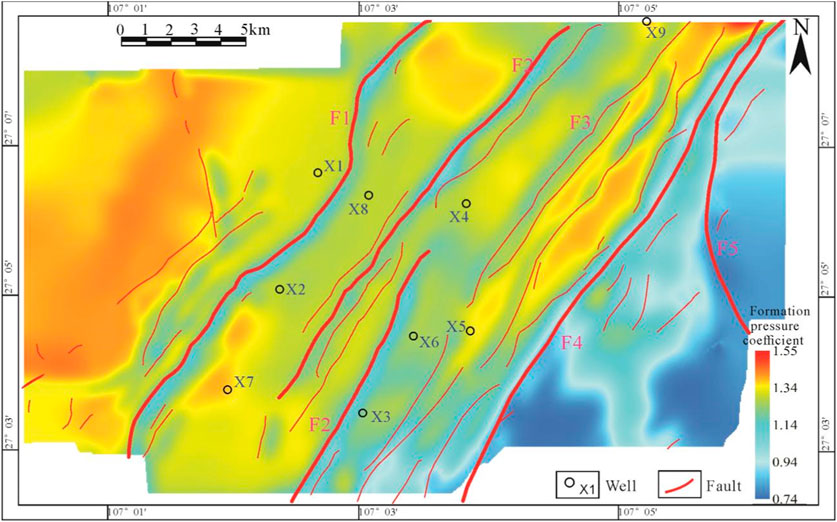
FIGURE 11. Distribution of formation pressure coefficient of the Silurian Longmaxi Formation in the Nanchuan Area.
The formation pressure coefficient ranged from 0.74 to 1.55 (Figure 11), and most of the areas exhibited formation overpressure (pressure coefficient >1.1), the formation pressure in the areas near the basin (the western part of the F1 Fault) is above 1.4. The normal-pressure zone (0.9 < pressure coefficient <1.1) was distributed around the fault. The low-pressure zone (pressure coefficient <0.9) was distributed in the fault zone area and the shallow-buried area in the southeastern part of the study area.
5.2 Factors affecting formation pressure
The results show that the formation pressure in complex tectonic deformation area is controlled by multiple factors such as formation deformation, in-situ stress and petrophysical parameters. Therefore, considering the influence of various factors on formation pressure, the prediction accuracy of formation pressure in complex tectonic deformation areas can be improved (Guo and Zhang, 2014; Fang et al., 2018).
(1) Faults
In the faults and surrounding areas, the formation pressure was low. The high formation pressure areas occurred in the regions far from the faults. This was mainly due to the development of through-going fractures in the faults and surrounding areas during the formation of the faults, leading to the escape of shale gas. As the distance from the fault increased, the stress concentration phenomenon weakened, and a set of areas where fractures developed but were unconnected gradually formed at distances far from the faults (Shen et al., 2015; Zheng et al., 2019). This area has been conducive to the accumulation and storage of shale gas, resulting in an increase in the formation pressure and the formation of a high-value area.
As shown in Figure 11, the formation pressure on the southeast side of the fault is slightly greater than that on the northwest side. This phenomenon has been confirmed by the formation pressure test results of various wells. This is because the faults in the study area have left-lateral characteristics, which will aggravate the plane heterogeneity of tectonic stress (He, 2021). It causes the southeast side of the fault to be under strong compression conditions, while the northwest side is under weak compression conditions. Thus, the southeast side of the fault has relatively low formation pressure, while the northwest side has relatively high formation pressure (Figure 11).
(2) Structural position
Generally, the more intense the structural deformation is, the higher the degree of fracture development is. The fracture development density is within the appropriate range, which is conducive to shale gas reservoir. Therefore, the formation pressure distribution in different structural locations is quite different. In addition to the fault area, the most intense deformation is in the back and syncline area. The results show that the formation pressure in the synclinal core is high (70–76.2 MPa) and gradually decreases toward the two wings, while the formation pressure in the anticlinal core is low (33.6–42 MPa) and gradually increases toward the two wings. The main reason is that with the formation deformation and bending, the inverted “V” type tensile fracture with downward opening is formed in the synclinal core area with the increase of deformation degree, which is conducive to shale gas accumulation and high formation pressure. On the other hand, the anticlinal area is easy to form the “V” tensile fracture with the opening up, which is easy to cause the shale gas escape and the formation pressure is relatively reduced.
(3) Petrophysical property
Rock physical properties mainly refer to rock mechanical parameters (Young’s modulus and Poisson’s ratio). The research results show that formation pressure in rock strata is positively correlated with Young’s modulus and negatively correlated with Poisson’s ratio. The main reason is that the larger Young’s modulus is and the smaller Poisson’s ratio is in the formation, the more difficult deformation is to occur in the region. When tectonic stress is received, the change of formation pore space can be reduced, so that these regions can maintain high formation pressure. Strata with small Young’s modulus and large Poisson’s ratio are prone to deformation under the influence of tectonic stress, forming new fractures and gradually connecting with other previous fractures, resulting in shale gas escape and formation pressure reduction.
Hydrocarbon generation can promote the formation of secondary pores, thus improving the petrophysical properties and formation pressure of shale reservoirs. In the hydrocarbon generation period, the paleooverpressure was formed under the action of hydrocarbon generation. However, whether the ancient overpressure can be preserved depends on the sealing properties of the overlying layer. If the overburden layer is destroyed, the paleooverpressure environment will change to normal pressure or even negative pressure (Ju et al., 2019). According to the formation pressure evaluation results of the Longmaxi Formation in the study area, overpressure is extremely common (Figure Figure11), and its formation is due to the expansion and pressurization mechanism of hydrocarbon generation (Tang et al., 2022).
(4) In-situ stress
The present geostress includes overlying strata pressure and horizontal stress. The overlying formation pressure is the gravity of the overlying formation, which depends on the depth of the formation. The influence of overlying formation pressure on formation pressure (formation pore pressure) mainly includes two aspects. First, in the area with a large burial depth, with the increase of overlying formation pressure, the confining pressure of the formation increases, so does the Young’s modulus of the rock, thus affecting the formation pressure. Second, as the burial depth decreases, the overlying formation pressure gradually decreases, so does the positive pressure of the bedding surface of the Longmaxi shale. When the pore pressure of the local layer is greater than the breakthrough pressure, a large number of micro-fractures will be formed, forming new storage space and providing a channel for the shale gas to escape, resulting in the decrease of formation pressure.
The influence of horizontal geostress is mainly manifested in the squeezing effect of horizontal geostress on formation pores. The greater the horizontal in-situ stress is and the greater the angle between it and crack strike, the stronger the squeezing effect on formation pores and the stronger the restraint effect on gas in pores, and the better the formation pressure can be maintained. On the contrary, the smaller the horizontal stress is, the smaller the angle between it and the fracture strike is, the smaller the binding force on the gas in the pores is. When it is greater than the breakthrough pressure, the pore space of the formation will increase and the formation pressure will decrease.
Through this study, we found that four factors (fault, structural position, petrophysical property, in-situ stress) affect formation pressure. Since formation pressure is caused by overlying load and in-situ stress, therefore, in-situ stress is the primary factor affecting formation pressure. For faults, structural position and petrophysical property, they will play a certain role in regulating formation pressure, so they are secondary factors. On the whole, in-situ stress belongs to external factor, while faults, structural position and petrophysical property belong to internal factor. The external factor has a greater influence on formation pressure.
Compared with the traditional methods, the interpretation method of formation pressure adopted in this paper is based on its genetic mechanism. Therefore, it has advantages in the prediction of formation pressure compared with the traditional methods. However, this method is still a static model. In fact, the formation pressure of shale reservoirs can change continuously during the development of hydrocarbons. Therefore, how to construct a dynamic model of shale formation pressure is a scientific problem worth further exploration in the future.
6 Conclusion
On the basis of this study, the following conclusions can be drawn.
1. The direction of the present-day maximum horizontal principal stress in the Nanchuan Area is about NE65°–110°, and the magnitude is 56.12–93.79 MPa. The direction of the present-day horizontal minimum principal stress is about NE335°–20°, and the magnitude is 48.06–71.67 MPa. The in-situ stress direction is greatly affected by the faults, and slight deflection occurs in the fault area. The present-day distribution of the in-situ stress is greatly affected by the tectonic position and burial depth, and the distribution exhibits a northeast-southwest trend. The stress values in the fault area are small, and stress concentration occurs at the tip and bend of the fault.
2. The formation pressure in the Nanchuan Area is between 2.8 MPa and 88.25 MPa, and the pressure coefficient is 0.74–1.55. The burial depth and formation position have relatively large influences on the distribution of the formation pressure. The fractures in the fault zone area are dense and connected, which makes it easy for the shale gas to escape, leading to a low formation pressure. The formation pressure values in the syncline area are greater than those in the anticline area. The formation pressure gradient in the fold area is larger than that in the flat area. The in-situ stress in the anticline area is relatively small, the formation pressure is less than 40 MPa, and the pressure coefficient is 1.33–1.38.
3. In this study, the prediction accuracy of the in situ stress field was effectively improved by dividing the geological model into mechanical units. In addition, based on the linear isotropic combined spring model, the influences of the formation’s deformation and the in-situ stress on the formation pressure were considered, and the accuracy of the formation pressure prediction was improved. A technique for predicting the formation pressure distribution of shale gas reservoirs in complex structural areas was developed, and it is not only applicable to the Nanchuan area, but also to shale gas reservoirs in other complex tectonic transformation areas worldwide.
Data availability statement
The original contributions presented in the study are included in the article/Supplementary material, further inquiries can be directed to the corresponding author.
Author contributions
DZ is responsible for the idea and writing of this paper and KC, JT, ML, PZ, GH, JC, and XT are responsible for the data interpretation. All authors contributed to the article and approved the submitted version.
Funding
This research was funded by the project “Fine Structural Analysis and Shale Gas Preservation Evaluation in Nanchuan-Wulong Area” (No. P21087-6) of the Ministry of Science and Technology of Sinopec.
Conflict of interest
Authors ML, PZ, and GH were employed by the Sinopec East China Oil and Gas Company.
The remaining authors declare that the research was conducted in the absence of any commercial or financial relationships that could be construed as a potential conflict of interest.
Publisher’s note
All claims expressed in this article are solely those of the authors and do not necessarily represent those of their affiliated organizations, or those of the publisher, the editors and the reviewers. Any product that may be evaluated in this article, or claim that may be made by its manufacturer, is not guaranteed or endorsed by the publisher.
References
Barba, S., Carafa, M. M. C., Mariucci, M. T., Montone, P., and Pierdominici, S. (2010). Present-day stress-field modelling of southern Italy constrained by stress and GPS data. Tectonophysics 482, 193–204. doi:10.1016/j.tecto.2009.10.017
Brooke-Barnett, S., Flottmann, T., Paul, P. K., Busetti, S., Hennings, P., Reid, R., et al. (2015). Influence of basement structures on in situ stresses over the Surat Basin, southeast Queensland. Geophys. Res. Solid Earth. 120, 4946–4965. doi:10.1002/2015JB011964
Carpenter, C. (2015). Seismic-Frequency-vs. Seismic interval velocity based porepressure prediction. J. Pet. Technol. 67, 141–144. doi:10.2118/0315-0141-jpt
Chatterjee, R. (2008). Effect of normal faulting on in-situ stress: A case study from mandapeta field, krishna-godavari basin, India. Earth Planet Sci. Lett. 269, 458–467. doi:10.1016/j.epsl.2008.02.040
Chatterjee, R., and Pal, P. K. (2010). Estimation of stress magnitude and physical properties for coal seam of Rangamati area, Raniganj coalfield, India. Raniganj Coalf. India Int. Coal Geol. 81, 25–36. doi:10.1016/j.coal.2009.10.006
Chen, J., Gao, J., Pu, Y., Yang, D., Qi, Q., Wen, Z., et al. (2021). Machine learning method for predicting and warning of rockbursts. J. Min. Strata Control Eng. 3 (1), 013026. doi:10.13532/j.jmsce.cn10-1638/td.20200922.001
Chen, K., Zhang, D., and Tuo, X. (2020). Relationship between geological structure and marine shale gas preservation conditions in the western Middle Yangtze Block. Nat. Gas. Ind. B 7 (6), 583–593. doi:10.1016/j.ngib.2020.04.002
Chen, S., Tang, D., Tao, S., Xu, H., Li, S., Zhao, J., et al. (2018). Characteristics of in-situ stress distribution and its significance on the coalbed methane (CBM) development in fanzhuang zhengzhuang block, southern qinshui basin, China. Petrol. Sci. Eng. 161, 108–120. doi:10.1016/j.petrol.2017.11.042
Ding, W., Zeng, W., Wang, R., Jiu, K., Wang, Z., Sun, Y., et al. (2016). Method and application of tectonic stress field simulation and fracture distribution prediction in shale reservoir. Earth Sci. Front. 23 (2), 63–74. doi:10.13745/j.esf.2016.02.008
Eaton, B. A. (1972). The effect of overburden stress on geopressure prediction from well logs. J. Petroleum Technol. 24 (8), 929–934. doi:10.2118/3719-PA
Fang, H. H., Sang, S. X., Wang, J. L., and Ju, W. (2018). Pore characteristics and its significance on shale gas reservoir: A case study of the Longmaxi shale in the nanchuan region, chongqing, south China. Int. Oil Gas. Coal Technol. 18 (3‒4), 512–536. doi:10.1504/IJOGCT.2018.093127
Fillippone, W. R. (1979). “On the prediction of abnormally pressured sedimentary rocks from seismic data,” in 49th ann. Internat mtg (Houston, Texas: Soc. Expi. Geophys. Expanded Abstracts), 2667–2676. doi:10.4043/3662-MS
Guo, T. L., and Zhang, H. R. (2014). Formation and enrichment mode of Jiaoshiba shale gas field, Sichuan Basin. Petrol. Explor Dev. 41 (1), 31–40. doi:10.1016/s1876-3804(14)60003-3
Guo, X., Hu, D., Li, Y., Liu, R., and Wang, Q. (2014). Geological features and reservoiring mode of shale gas reservoirs in Longmaxi Formation of the Jiaoshiba area. Acta Geol. Sin. Engl. Ed. 88 (61), 1811–1821. doi:10.1111/1755-6724.12347
He, L. (2021). Study on the influence of structural deformation characteristics of wujiang fault zone on shale gas reservoirs area of fuling. Master's thesis. Yangtze: Yangtze University, 44–48. doi:10.26981/d.cnki.gjhsc.2021.000044
He, X., He, G., and Gao, Y. (2021). Geological characteristics and enrichment laws of normal-pressure shale gas in the basin-margin transition zone of SE Chongqing. Nat. Gas. Ind. 41 (1), 59–71. doi:10.3787/j.issn.1000-0976.2018.12.001
Higgins, S., Goodwin, S., Donald, A., Bratton, T., and Tracy, G. (2008). Anisotropic stress models improve completion design in the Baxter shale. SPE 115736, 11. doi:10.2118/115736-MS
Huang, S., Liu, D., Cai, Y., and Gan, Q. (2019). In situ stress distribution and its impact on CBM reservoir properties in the Zhengzhuang area, southern Qinshui Basin, North China. J. Nat. Gas Sci. Eng. 61 (1), 83–96. doi:10.1016/j.jngse.2018.11.005
Huo, J., Shi, J., and Shen, X. (2021). Pore pressure prediction methods for new blocks and undrilled deep strata: A case study of the high pressure gas wells along the southern margin of the junggar basin. Nat. Gas. Ind. 41 (3), 104–111. doi:10.3787/j.issn.1000-0976.2021.03.012
Jiu, K., Ding, W. L., Huang, W. H., Zhang, Y., and Zhao, S. (2013). Fractures of lacustrine shale reservoirs, the zhanhua depression in the bohai bay basin, eastern China. Mar. Petrol. Geol. 48, 113–123. doi:10.1016/j.marpetgeo.2013.08.009
Ju, W., Wang, J., Fang, H., and Sun, W. (2019). Paleotectonic stress field modeling and prediction of natural fractures in the Lower Silurian Longmaxi shale reservoirs, Nanchuan region, South China. Mar. Petroleum Geol. 97, 20–30. doi:10.1016/j.marpetgeo.2018.10.052
Ju, W., and Wang, K. (2018). A preliminary study of the present-day in-situ stress state in the Ahe tight gas reservoir, Dibei Gasfield, Kuqa Depression. Mar. Petrol. Geol. 96, 154–165. doi:10.1016/j.marpetgeo.2018.05.036
Ju, W., Wu, C. F., Wang, K., Sun, W., and Chang, X. (2017). Prediction of tectonic fractures in low permeability sandstone reservoirs: A case study of the Es3 m reservoir in the block shishen 100 and adjacent regions, dongying depression. Petrol. Sci. Eng. 156, 884–895. doi:10.1016/j.petrol.2017.06.068
Kaiser, A., Reicherter, K., Hübscher, C., and Gajewski, D. (2005). Variation of the present-day stress field within the north German basin—Insights from thin shell FE modeling based on residual GPS velocities. Tectonophysics 397 (1-2), 55–72. doi:10.1016/j.tecto.2004.10.009
Kingdon, M. W., Fellgett, J. D. O., and Williams, J. D. (2016). Use of borehole imaging to improve understanding of the in-situ stress orientation of Central and Northern England and its implications for unconventional hydrocarbon resources. Mar. Petrol. Geol. 73, 1–20. doi:10.1016/j.marpetgeo.2016.02.012
Li, C., Guo, P., and Ren, D. (2020). The advent of precision epigenetics for medulloblastoma. Petroleum Geol. Recovery Effic. 19 (6), 47–48. doi:10.18632/oncoscience.507
Li, J., Zhang, P., and Zhou, Z. (2023). Quantitative characterization on dynamic methane flow in Chinese marine shales: an experimental study. Unconv. Resour. 3, 44–53. doi:10.1016/j.uncres.2022.11.005
Li, S., Liu, G., Jia, R., Jia, F., and Wang, K. (2021). Study on friction effect and damage evolution of end face in uniaxial compression test. J. Min. Strata Control Eng. 3 (3), 033014. doi:10.13532/j.jmsce.cn10-1638/td.20210325.001
Liu, Z., Shi, B., Ge, T., Sui, F., Wang, Y., Zhang, P., et al. (2022). Tight sandstone reservoir sensitivity and damage mechanism analysis: A case study from ordos basin, China and implications for reservoir damage prevention. Energy Geosci. 3 (4), 394–416. doi:10.1016/j.engeos.2021.05.001
Luan, He., Cao, Y., Jiang, Y., Guan, Y., Li, C., Zhang, S., et al. (2022). Implementation of tension-shear coupling failure mode of rock bolts in FLAC3D and its application. J. Min. Strata Control Eng. 4 (6), 063029. doi:10.13532/j.jmsce.cn10-1638/td.20220727.002
Lv, J., Yin, S., Sun, Y., Liu, L., Li, W., Tao, D., et al. (2022a). A new method for predicting injection multiples of extreme displacement in waterflood reservoirs. Energy Geosci. 3 (4), 465–472. doi:10.1016/j.engeos.2022.01.002
Lv, X., Fu, M., Zhang, S., Liu, Y., Ding, X., Meng, X., et al. (2022b). The effect of thermal fluid derived from mud diapir on sandstone reservoirs in the Yinggehai Basin, South China Sea. Energy Geosci. 3 (4), 473–484. doi:10.1016/j.engeos.2021.10.001
Ma, X., Xie, J., Yong, R., and Zhu, Y. (2020). Geological characteristics and high production control factors of shale gas reservoirs in Silurian Longmaxi Formation, southern Sichuan Basin, SW China. Petroleum Explor. Dev. Online 47 (5), 901–915. doi:10.1016/s1876-3804(20)60105-7
Mouchet, J. P., and Mitchell, A. (1989). Abnormal pressure while drilling. Paris: Editions Technip, 45–48. doi:10.1016/S0140-6701(97)83234-1
Najibi, A. R., Ghafoori, M., Lashkaripour, G. R., and Asef, M. R. (2017). Reservoir geomechanical modeling: in-situ stress, pore pressure, and mud design. Petrol. Sci. Eng. 151, 31–39. doi:10.1016/j.petrol.2017.01.045
Nie, H., Chen, Q., Zhang, G., Sun, C., Wang, P., and Lu, Z. (2021). An overview of the characteristic of typical Wufeng–Longmaxi shale gas fields in the Sichuan Basin, China. Nat. Gas. Ind. B 8 (3), 217–230. doi:10.1016/j.ngib.2021.04.001
Ostadhassan, M., Zeng, Z., and Zamiran, S. (2012). “Geomechanical modeling of an anisotropic formation-bakken case study,” in 46th US rock mechanics/geomechanics symposium (American Rock Mechanics Association), 1–6. doi:10.1016/j.petrol.2018.02.059
Peng, J., Liu, X., Zhuang, X., Ma, Z., Pan, W., Fan, Z., et al. (2023). Geochemical characteristics and sedimentary environment of source rocks in the qiangtang basin: new discoveries from the upper triassic xiaochaka formation in the woruoshan mountain. Unconv. Resour. 3, 103–110. doi:10.1016/j.uncres.2022.12.001
Rajabi, M., Tingay, M., King, R., and Heidbach, O. (2017). Present-day stress orientation in the clarence moreton basin of new south wales, Australia: A new high density dataset reveals local stress rotations. Basin Res. 29, 622–640. doi:10.1111/bre.12175
Shen, G., Clemmons, C., and Shen, X. (2015). “Integrated 1-D workflow for pore-pressure prediction and mud-weight window calculation for subsalt well sections,” in The 49th US rock mechanics/geomechanics symposium (SanFrancisco, California, USA: ARMA).
Shi, M., Liu, Z., Yang, X., Yang, J., Chen, X., Liu, H., et al. (2020). Review and prospect prediction technology for formation pore pressure by geophysical well logging. Well Logging Technol. 35 (5), 1845–1853. doi:10.6038/pg2020DD0435
Si, S., He, J., Zhao, Y., Chuang, E., Bai, Y., and Wu, W. (2023). Diagenesis of tight sandstone and its influence on reservoir properties: A case study of fuyu reservoirs in songliao basin, China. Unconv. Resour. 3, 84–92. doi:10.1016/j.uncres.2022.12.002
Sun, J. (2017). Mechanics criterion and factors affecting overburden stability in solid dense filling mining. Int. J. Min. Sci. Technol. 27 (3), 407–413. doi:10.1016/j.ijmst.2017.03.010
Sun, J., Zhang, Y., Wang, Y., Wu, Y., and Chen, H. (2023). Research progress in Formation Pressure prediction methods based on logging data. Well Logging Technol. 47 (2), 119–126. doi:10.16489/j.issn.1004-1338.2023.02.001
Tang, L., Song, Y., Zhao, Z., Jiang, Z., Jiang, S., Chen, X., et al. (2022). Origin and evolution of overpressure in shale gas reservoirs of the upper ordovician wufeng formation–lower silurian Longmaxi Formation in the Sichuan Basin. Nat. Gas. Ind. 42 (10), 37–53. doi:10.3787/j.issn.1000-0976.2022.10.004
Thiercelin, M. J., and Plumb, R. A. (1994). Core-based prediction of lithologic stress contrasts in east Texas formations. SPE Form. Eval. 9 (4), 251–258. doi:10.2118/21847-pa
Wang, H. (2020). Formation pressure prediction technology of infill point in low permeability oil field. J. Phys. Conf. Ser. 1549, 042014. doi:10.1088/1742-6596/1549/4/042014
Wang, K., Zhang, H., and Zhang, R. (2017). Analysis and numerical simulation of tectonic stress field in the dabei gas field, tarim basin. Aata Geolofica Sin. 91 (11), 2557–2572. doi:10.13278/j.cnki.jjuese.20210002
Wang, M., Shen, Z., Wan, L. H., Mo, M. M., Wu, Z., Li, L. L., et al. (2020). Effects of a comprehensive reminder system based on the health belief model for patients who have had a stroke on health behaviors, blood pressure, disability, and recurrence from baseline to 6 Months: A randomized controlled trial. J. Geophys. Res. Solid Earth 125 (2), 156–164. doi:10.1097/JCN.0000000000000631
Wang, X., Liu, Y. H., and Zhang, M. (2010). Conditions of formation and accumulation for shale gas. Nat. Gas. Geosci. 21 (2), 350–356. doi:10.1016/S1876-3804(11)60008-6
Wu, Z., Tang, M., Zuo, Y., Lou, Y., Wang, W., Liu, H., et al. (2021). Acoustic emission-based numerical simulation of tectonic stress field for tectoclase prediction in shale reservoirs of the northern Guizhou area, China. Energy Geosci. 3 (4), 436–443. doi:10.1016/j.engeos.2021.10.005
Xing, R., Liu, Y., and Wang, C. (2018). Geostress prediction and comprehensive evaluation based on logging information in coalbed methane block. Coal Sci. Technol. 46 (10), 216–221. doi:10.13199/j.cnki.cst.2018.10.034
Xiong, L., Wang, S., and Xu, F. (2016). An approach to locate optic disc in retinal images with pathological changes. Pet. Drill. Techques 44 (5), 40–50. doi:10.1016/j.compmedimag.2015.10.003
Xu, J., Chang, X., and Wang, Y. (2015). Sensitivity analysis of the residual depth about the residual velocity in the angle domain. Chin. J. Geophys. 58 (8), 2927–2934. doi:10.6038/cjg20150825
Xu, R. (2014). The analysis of tectonic stress field of lishu fault depression in northeast China. Xian: Xi’an Shiyou University, 1–6. doi:10.7666/d.Y2619727
Xue, Y., Zhi, H., Zhang, C., Yu, Q., Gao, T., and Zhang, H. (2023). Accurate measurement of dynamic response of Formation Pressure. Well Logging Technol. 47 (2), 224–229. doi:10.16489/j.issn.1004-1338.2023.02.015
Yang, J., Luo, M., Zhang, X., Huang, N., and Hou, S. (2021). Mechanical properties and fatigue damage evolution of granite under cyclic loading and unloading conditions. J. Min. Strata Control Eng. 3 (3), 033016. doi:10.13532/j.jmsce.cn10-1638/td.20210510.001
Yin, S., Lv, D., and Ding, W. (2018). New method for assessing microfracture stress sensitivity in tight sandstone reservoirs based on acoustic experiments. Based Acoust. Exp. 18 (4), 1–10. doi:10.1061/(ASCE)GM.1943-5622.0001100
Zeng, L. B., Lyu, W. Y., Li, J., Guo, Y., Yang, Y., Dong, S., et al. (2019). Variation in the orientation of the maximum horizontal stress in thick channel-fill sandstones with low-permeability: A case of the bonan oilfield in the bohai bay basin, eastern China. Mar. Petrol. Geol. 107, 32–40. doi:10.1016/j.marpetgeo.2019.04.041
Zhang, J. C. (2013). Effective stress, porosity, velocity and abnormal pore pressure prediction accounting for compaction disequilibrium and unloading. Mar. Petroleum Geol. 45, 2–11. doi:10.1016/j.marpetgeo.2013.04.007
Zhang, S., Wang, L., Yang, H., and Lu, L. (2023). Construction and numerical simulation research of functional supporting in deep roadways. J. Min. Strata Control Eng. 5 (1), 013012. doi:10.13532/j.jmsce.cn10-1638/td.20230201.001
Zheng, W., Zhang, P., and Yuan, D. (2019). Basic Characteristics of active tectonics and associated geodynamic processes in continental China. J. Geomechanics 25 (5), 699–721. doi:10.12090/j.issn.1006-6616.2019.25.05.062
Zhou, L., Zhang, D., Sun, J., Gu, Y., Zhang, C., and Zhang, C. (2022). Status-quo of proved oil/gas initially-in-place in China as of 2020 and its variation trend in the past decade. Energy Geosci. 3 (4), 343–348. doi:10.1016/j.engeos.2022.05.001
Keywords: shale gas, numerical simulation, in-situ stress field, formation pressure, coupling relationship, complex tectonic transition area. 1
Citation: Zhang D, Chen K, Tang J, Liu M, Zhang P, He G, Cai J and Tuo X (2023) Prediction of formation pressure based on numerical simulation of in-situ stress field: a case study of the Longmaxi formation shale in the Nanchuan area, eastern Chongqing, China. Front. Earth Sci. 11:1225920. doi: 10.3389/feart.2023.1225920
Received: 20 May 2023; Accepted: 11 September 2023;
Published: 28 September 2023.
Edited by:
Hu Li, Southwest Petroleum University, ChinaReviewed by:
Guanxiong Ren, Southwest Petroleum University, ChinaShuai Yin, Xi’an Shiyou University, China
Copyright © 2023 Zhang, Chen, Tang, Liu, Zhang, He, Cai and Tuo. This is an open-access article distributed under the terms of the Creative Commons Attribution License (CC BY). The use, distribution or reproduction in other forums is permitted, provided the original author(s) and the copyright owner(s) are credited and that the original publication in this journal is cited, in accordance with accepted academic practice. No use, distribution or reproduction is permitted which does not comply with these terms.
*Correspondence: Douzhong Zhang, emR6MTM1N0AxNjMuY29t