
95% of researchers rate our articles as excellent or good
Learn more about the work of our research integrity team to safeguard the quality of each article we publish.
Find out more
ORIGINAL RESEARCH article
Front. Earth Sci. , 27 July 2023
Sec. Environmental Informatics and Remote Sensing
Volume 11 - 2023 | https://doi.org/10.3389/feart.2023.1225714
This article is part of the Research Topic Advanced Methods for Interpreting Geological and Geophysical Data View all 36 articles
 Meriem Lghoul1*
 Hany F. Abd-Elhamid2,3
 Martina Zeleňáková4*
 Kamal Abdelrahman5
 Mohammed S. Fnais5
 Karim Sbihi6
Gravity-based imaging of the subsurface has increased worldwide recently. Improvements in the processing and analysis of gravity data have allowed us to locate the basement surface, map geologic basins, and define structural patterns. In this study, gravity data were analyzed to study the Bahira basin’s underlying geology. The Bahira basin is very important economically. The Ganntour plateau is distinctive due to the importance of the phosphate mining resources. Using gravity data, we mapped the subsurface and determined the underlying structural patterns that affect the study area. In this study, we used several techniques to edge detection including Total horizontal derivative (THDR), first vertical derivative (FVD), tilt derivative (TDR), and its horizontal derivative (THDR_TDR) methods. Accordingly, the geological history of the Bahira basin suggests that the main lineaments/faults trends are NE-SW, NW-SE, ENE-WSW, and WNW-ESE. The 3D Euler deconvolution showed the depth and location of lineaments/faults, and matched edge detection results. The eastern Bahira basin’s sedimentary layer is 2–8 km deeper according to the Euler technique. Two-dimensional forward modeling along three profiles in the Bahira basin revealed a horst-graben basement structure. The outcomes of this study improved the subsurface topographical variations of the Bahira Basin. The information collected so far can help future studies in the area.
When dealing with a sedimentary basin that lacks geological and structural information, exploring and understanding the subsurface of the basin can be challenging. However, there are several approaches that can be employed to overcome this limitation and gain insights into the basin’s geology. The exploration of sedimentary basins is a critical endeavor in understanding the geological subsurface and unlocking its vast resources. Geoscientists and geophysicists use a wide array of tools and techniques to unravel the complex geological structures and stratigraphy hidden beneath the surface. Among these tools, gravity has emerged as a valuable geophysical method for investigating sedimentary basins. By integrating gravity data with geological and others geophysical information, we can estimate the thickness and depth of sedimentary sequences, identify fault systems and basement structures (Ekwok SE. et al., 2022; Frifita et al., 2020; Saada et al., 2022; Nzeuga et al., 2022; El-Sehamy et al., 2022; Eldosouky et al., 2022b).
Under sedimentary basins and structural frameworks, the gravity method is ideally suited for basement mapping (Saleh et al., 2018; Frifita et al., 2020; Araffa et al., 2021; Kebede et al., 2021; Pham LT. et al., 2022; Zaghdoudi et al., 2020; Elabouyi et al., 2022; Mohamed et al., 2022a; Eldosouky et al., 2022b; Saada et al., 2021). Several field studies estimated sediment thickness and geological and stratigraphical structure. Using magnetic and gravity data analysis, Saleh et al. (2018) investigated the basement complex beneath the Barramiya region in Egypt’s Eastern Desert. Frifita et al. (2020) analyzed a sedimentary basin (Mejerda, Tunisia) using gravity and seismic reflection to establish the foundation form. Gravity data showed subsurface structures and basement depth in El Moghra, Egypt by Araffa et al. (2021). Using gravity and magnetic data, Kebede et al. (2021) created a 2D/3D model for groundwater implication in the Ziway-Shala Lakes Basin in Ethiopia. Pham LT. et al. (2022) conducted research to evaluate filtering methods’ contributions to mapping Phu Khanh basin, Vietnam’s subsurface features using gravity data. Zaghdoudi et al. (2021) employed gravity and seismic data to map Tunisia’s Bizerte geology. Elabouyi et al. (2022) examined buried granite masses and structures in Morocco’s High Moulouya basin using gravity measurements. Alqahtani et al. (2023a) performed a study to identify the potential geothermal resources in Rahat Volcanic field (kingdom of Saudi Arabia) using gravity and magnetic data. The finding showed that, in the western part, three geothermal anomalies associated with high density and magnetic susceptibility are located. These geothermal anomalies are identified beneath the historical eruption, fissure eruption and north of the swarm area. Ikirri et al. (2023) used gravity measurements to characterize Morocco’s Western Anti-Atlas Ifni Inlier. Alqahtani et al. (2023b) employed remote sensing, surface temperature and geophysical data for geothermal exploration in Lunayyir Volcanic Field (Saudi Arabia). The analysis of gravity and magnetic data show subsurface geologic structures that may be interpreted as potentially geothermal system. The land surface temperature indicates a volcanic activity in the subsurface. This study improves the assessment of the Lunayyir volcanic field in the western part of Saudi Arabia for geothermal energy.
Over the last few years, there has been a growing interest in potential field data analysis using edge detection methods. The application of edge detection methods in gravity and magnetic data plays a crucial role in geophysical exploration and geological mapping. Moreover, the application of edge detection methods has witnessed a significant expansion in specific studies encompassing subsurface geological structure, mining exploration, geothermal investigations and hydrogeological studies (Melouah et al., 2021; Eldosouky et al., 2022a; Ekwok SE. et al., 2022; Mohamed et al., 2022b; El-Sehamy et al., 2022; Kharbish et al., 2022; Mahdi et al., 2022; Saada et al., 2022; Abdelrahman et al., 2023).
Different and efficient upgraded approaches have been employed for mapping the subsurface geological structure. A more accurate geological model and stronger visualization of data are two goals of using enhancement approaches. 3D Euler deconvolution locates anomalies and estimates depth, phase derivatives locate source body edges (contact/fault), and power spectrum analysis separates regional and residual potential field components. Rabii et al. (2018) used these methods to study the upper crustal structure of the Utica-Mateur area in northern Tunisia. Horizontal gravity gradients, 2D power spectrum analysis, and Euler deconvolution determined the depths of major density discrepancies and structural lineaments. Okpolin and Akingboye (2019) used gravity data to characterize the lithostructural and depth properties of Igabi (Northwestern Nigeria). Satyakumar et al. (2022) used improved gravity data to map structural and tectonic features in the Mahanadi basin (eastern India). Ayoola and Osinowo (2022) interpreted potential field data for hydrocarbon development (Southern Nigeria) to create a novel structure that better understood the research region’s tectonic and structural outline. According to enhanced gravity and magnetic data used to assess petroleum potential, the basement beneath the sedimentary basin is 10–15 km deep. Pham et al. (2023) applied gravity data to map the western Gulf of Guinea’s structural framework.
Recently, new improved edge detection methods have been introduced to accurately highlight the geological underground and to delineate structural lineaments originating from both shallow and deep geological sources (Pham L. T. et al., 2021; Pham L. T. et al., 2021; Ekwok S. E. et al., 2022; Ekwok et al., 2022a; Pham L. T. et al., 2022; Eldosouky et al., 2022b; 2022c; 2022d; Eldosouky et al., 2022 A. M.; 2022f; Pham LT. et al., 2022; Nzeuga et al., 2022; Prasad et al., 2022; Pham et al., 2023). The use of high-precision filters, such as the enhanced horizontal gradient amplitude, improved tilt angle, tilt angle of total horizontal gradient, improved theta map, softsign function, logistic function, have emerged (Pham L. T. et al., 2021; Pham et al., 2021 L. T.; Ekwok S. E. et al., 2022; Eldosouky et al., 2022c; 2022d). Through the application of these filters on potential field data, their remarkable efficiency and precision in qualitatively delineating and interpreting geological structures have been demonstrated (Ekwok S. E. et al., 2022; Eldosouky et al., 2022c; 2022d; Nzeuga et al., 2022; Prasad et al., 2022; Pham et al., 2023).
The Bahira basin is one of the most important sedimentary basins in western Moroccan Meseta (Michard, 1996). It has been noticed that limited research has been performed to assess the whole Bahira basin, they are some works mainly focused on the western part of the basin where Ganntour phosphatic plateau is located. Er-rouane (1996) offered hydrogeological attention to the Bahira basin’s subsurface structure using electrical resistivity tomography and gravity techniques. Karroum et al. (2014) explored the Bahira basin. Findings agree with those of Er-rouane (1996) research and provided data for outlining the plain’s many significant geological formations. Jaffal et al. (2022) used gravity data to study the western Bahira basin geology.
Due to the limited availability of geological data and restricted drilling that provide only shallower geological information, we resorted to analyzing gravity data as a valuable resource to gain a deeper understanding of the internal structure of the Bahira basin. The primary aim of this ongoing research is to offer new insights into the subsurface geological structure of the Bahira basin through the utilization of diverse gravity data analysis methods. To that end, a new strategy with better techniques was implemented. Bahira Basin’s key features and structural trends were characterized utilizing power spectrum analysis, total horizontal derivatives, first vertical derivative, tilt derivative, and its horizontal derivative. To estimate the properties of these structures, the 3D Euler deconvolution was used. Two-dimensional forward modeling was developed using three intersecting profiles to identify the Bahira basin’s form and structure. The finding of this study allowed to illuminate the Bahira Basin’s structure and essential features.
The Bahira basin is a huge syncline depression between the southern Jebilet Paleozoic basement and the northern Rehamna basement. It covers 5,000 square kilometers in northern Morocco, 30 km from Marrakech (Figure 1). Specifically, it is located between 31° 55′ and 32° 20′ North and between 7°15′ and 8°50’ West. The western Ganntour plateau rises to heights of 531 m above sea level, while the eastern Bahira region features lower elevations of 404 m. The climate is classified as semi-arid. The predicted potential evapotranspiration is greater than 1000 mm/year (Er-rouane, 1996; Karroum et al., 2014), while annual precipitation averages 206 mm.
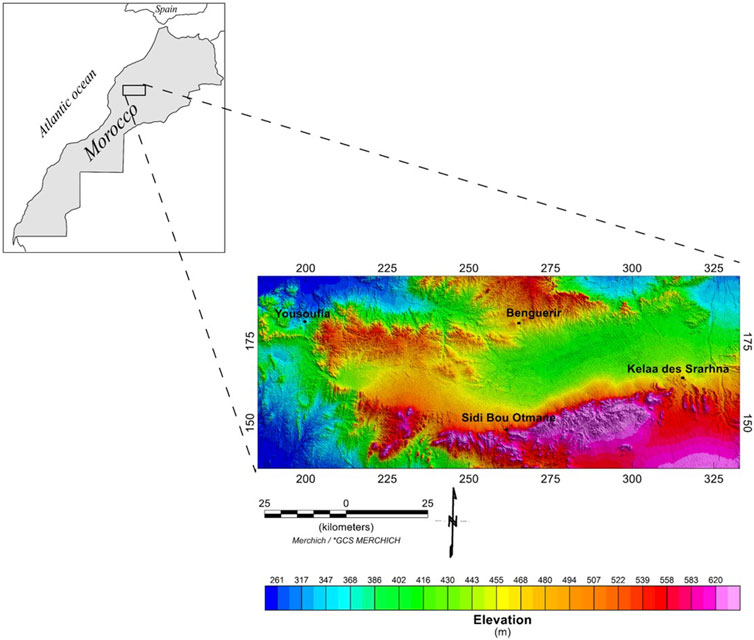
FIGURE 1. Geographic situation and elevation map of Bahira basin.
The Bahira basin is situated within the Western Meseta domain (Michard, 1996) and represents an expansive closed depression oriented in an Est-West direction. It lies between two Hercynian massifs, namely, the Jbilet and Rehamna. The primary massif of Rehamna forms its northern boundary, while the Jbilet defines the southern limit. The Tessaout river serves as its eastern boundary, and the secondary plateau of Mouissate marks its western extent (Figure 2). Geologically, the Bahira basin is a synclinal trough characterized by a Paleozoic basement overlain by secondary and tertiary formations. The sedimentary units comprising the basin extend from the Permo-Triassic to the Quaternary periods, with a particular emphasis on the Maastrichtian to Eocene phosphatic layers of Ganntour (Figure 2) (Er-rouane, 1996; Michard, 1996). These formations are exposed in the northern part of the plain, dip and taper off towards the south, and are covered by continental Neogene sedimentary infill. The majority of the plain’s surface is occupied by Quaternary deposits.
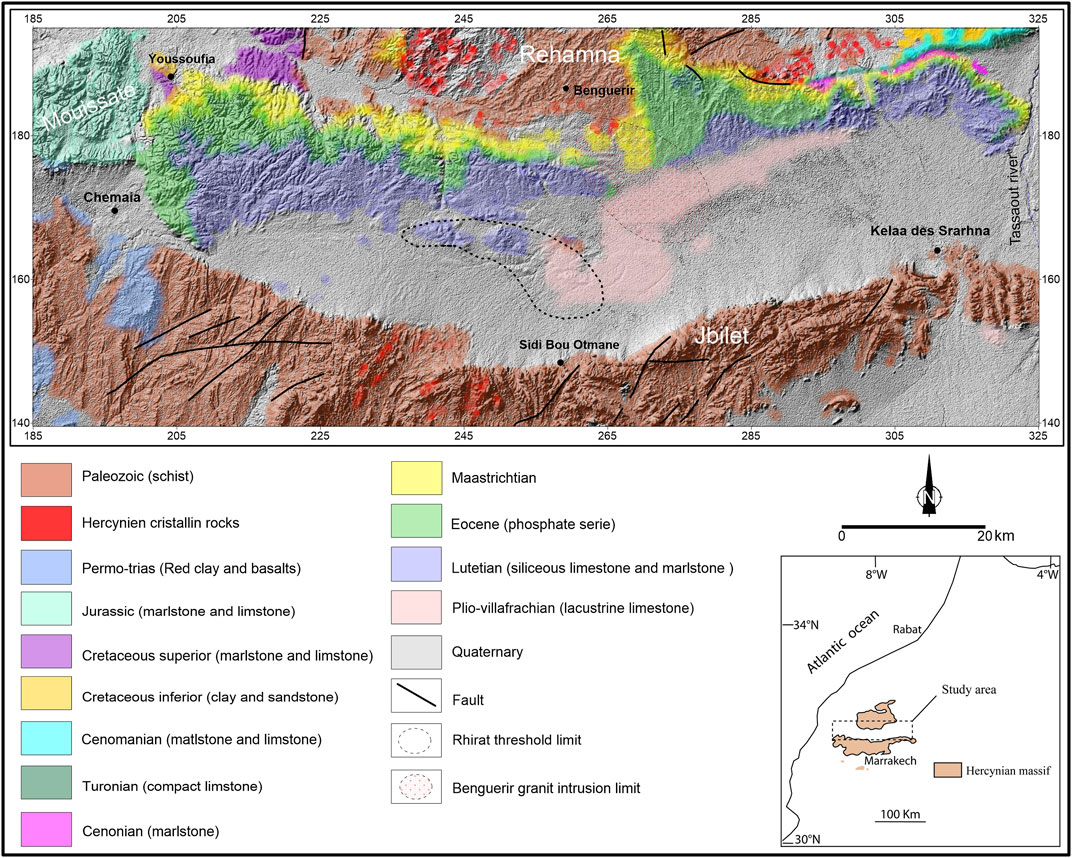
FIGURE 2. Geological map of Bahira basin.
The Palaeozoic basement has a significant thickness spanning several thousand meters. It outcrops in the Rehamna massif to the North and the Jbilet massifs to the South. In the Rehamna massif, the Paleozoic section comprises Cambrian schists, sandstones, micaschists, Hercynian granites, and Westphalo-Autunian molasse conglomerates. The Jbilet massif exhibits massive limestones, shales with intercalated sandstones, and carbonate shales of Middle Cambrian age (Huvelin, 1977). The entire region is characterized by folding and fracturing, resulting in north-south trending folds. Small outcrops of the Hercynian basement consisting of Sarhlef schists can also be observed in the study area near of Rhirat Village (Figure 2) (Er-rouane, 1996).
The Bahira basin is part of the western Moroccan Meseta, which is one of the five structural domains in Morocco. This domain has been affected by various deformation events related to different orogenies that have occurred over time, including the Hercynian orogeny and the Atlasic (alpine) orogeny. During the Hercynian orogeny, the Cretaceous terrains were extensively covered by secondary, tertiary, and Plio-Quaternary deposits. Recognizing pre-Cretaceous tectonic movements is only feasible along the edges, particularly in the Jbilet massif. Studies conducted by Huvelin (1977) indicated that the primary basement experienced extensive folding and undulation, characterized by highly curved folds, faults in multiple orientations, and localized schistosity near Hercynian granite intrusions. The Triassic movements followed the Hercynian orogeny, controlling the Permo-Triassic deposits preserved in grabens bounded by NE-SW faults. Post-Triassic movements involved reactivation of Hercynian faults, following the vertical movements initiated during the Triassic period (Huvelin, 1977). During the Atlas orogeny, faults with varying degrees of displacement affected the Eo-Cretaceous formations. The main phase occurred during the Eocene, resulting in large ENE-WSW-oriented flexures observed in the Jurassic cover of the Mouissate region, along with low-amplitude undulations (Er-rouane, 1996). The most recent tectonic movements encompass post-Miocene and Plio-Villafranchian deformations, which have resulted in the formation of significant faults. These faults are particularly prominent along the Jbilet-Bahira boundary and are manifested by fault planes with a displacement of approximately a thousand meters.
Following the Hercynian orogeny, the Paleozoic basement experienced an extended period of continental conditions. During this phase, the basement was strongly leveled, and the Triassic deposits were preserved in pull-apart basins formed due to Triassic movements. In the Jurassic period, marine sedimentation resumed with the transgression. In the Lower Cretaceous, marine conditions returned, particularly in the Youssoufia region. The end of the Lower Cretaceous is characterized by the presence of red clay layers, indicative of sea regression. The transgressions of the Middle Cretaceous (Cenomanian, Turonian, Senonian) appear to be limited to the eastern part of the region. However, the most significant transgressions occurred during the Maastrichtian-Eocene period. These transgressions affected almost the entire basin and are characterized by the deposition of phosphate series.
The Department of Mines and Geology created a Bouguer anomaly map used in this investigation. The Italian firm “Fondazione Lerici” launched the gravity prospection mission in 1964. Good coverage of the investigated region was achieved by the gravimetric density measurements, which included 2372 locations with an average of roughly 0.5 station/km2. The lower density of 2.2 g/cc was used to create the Bouguer anomaly map. The Geosoft Oasis Montaj software is applied to process and analyze gravity data.
By interpolating, filtering, and modeling the gravity data, we are able to gain comprehensive information on the underlying geology. Several steps of interpretation make use of data processing to give the results a structural and geological context. Figure 3 gravitational data has been analyzed intuitively and quantitatively. Power spectrum analysis and FFT were used to differentiate deep and shallow anomalies. Maximum Total Horizontal Derivatives (THDR), First Vertical Derivatives (FVD), Tilt Derivatives (TDR), and Total Horizontal Derivatives of Tilt Derivatives (THDR_TDR) were all used to identify edges. The three-dimensional Euler deconvolution was utilized for the purpose of depth estimation of sources. 2D gravity forward modeling was used to perform the quantitative interpretation.
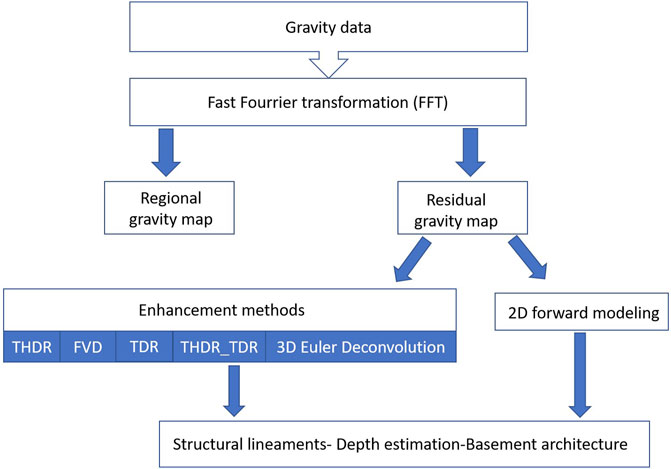
FIGURE 3. Flow chart of the adopted methodology.
To examine the residual (shallow) and regional (deep) sources, as well as to compute the energy spectrum curves, the FFT was used for the gravity data. Several researchers, including Spector and Grant (1970), Bhattacharyya (1996), and others, have applied this technique to the study of gravity data. The strategy depends on how the frequential energy created by the differences between the densities of surface and subsurface materials is distributed. This filter can either pass or reject a range of frequencies based on its cut-off frequencies. It varies with wavelengths in both the X and Y-axes. The Fourier transform of the periodic function f () is given by (Bhattacharyya, 1996):
where (x) and (y) are the spatial coordinates in the x and y directions respectively.
Potential field data edges can be created using the THDR technique. Finding the highest point of the sum of the horizontal derivatives allows one to identify the steepest gradient. The THDR establishes the limit on the number of structural boundaries (contacts and faults). THDR is defined as follows (Cordell & Grauch, 1985):
where the orthogonal coordinates of the gravity field (f) are represented by x and y.
Automatically locating the maximum of the horizontal gradient was first proposed by Blakely and Simpson (1986). When applied to a gravity map, this method reveals that the local maximum of horizontal gradients creates ripples and constricts above sudden changes in density. Inflection spots can also be identified by the horizontal gradient modulus’s highest magnitude. Bouguer’s map shows contact/fault dip directions as it rises. The horizontal gradient and upward continuation of faults can define their location and dip (Archibald and Bochetti, 1999). Whereas faults are represented by linear contacts, the borders of intrusive bodies are represented by circular contacts. Each successive level-up topographies a maximum horizontal gradient. The biggest overlap occurs in vertical constructions. When the extension is made upwards, however, the maximum shifts, revealing the slope’s orientation.
If you take the FFT transformation of the potential field signal with height, you get the first-order vertical derivative (FVD), which acts as an enhancement filter (Milligan and Gunn, 1997). The FVD filter emphasized anomalies at shorter wavelengths. It is a crucial filter for distinguishing subsurface features and boundaries. The FVD can be expressed mathematically as:
Miller and Singh (1994), followed by Verduzco et al. (2004), Salem et al. (2008), and Fairhead et al. (2004), all contributed to the advancement of the tilt derivative (TDR) filter. Salem et al. (2008) and Fairhead et al. (2004) provide the following definition for this filter:
Where; FVD is the vertical derivative, while THDR is the total horizontal derivative.
Tilt derivative amplitudes range from - π/2 to π/2 (radians). Salem et al. (2008) used TDR map contours to estimate source depth. Miller and Singh (1994) find that the zero-contour tilt derivative (TDR) defines structure limits. The total horizontal derivative of tilt angle provides a well-defined maximum centered over the source boundaries (Verduzco et al., 2004). The total horizontal derivative of tilt angle (THDR_TDR) can measure the body source’s uppermost edge depth. THDRTDR amplitude is inversely related to source top depth.
TDR in the x and y directions is equal to the square root of the sum square (Fairhead et al., 2004).
The Euler deconvolution technique generates automated localization and depth estimation of potential field data sources. According to Al-Badani and Al-Wathaf (2018); Thompson (1982), we can write the Euler equation as follows:
As defined by (Reid et al., 1990), where B is the overall field, f is the measured field at a specific position (x, y, z), and SI is the structural index. The structural index (SI) characterizes source type and the rate at which field amplitude falls with distance from the source. Finding the values for x0, y0, z0 (the origin’s coordinates), and B in the above-mentioned equation.
Grid spacing, structural index, and window size help solve the Euler equation. To find the thin sheet’s edge, the Euler solutions used a structural index of SI=0; to find the horizontal cylinders/faults, SI=1; and to find the sphere’s shape, Supporting Material=2 (Reid, et al., 2013). Selecting an appropriate structural index and window size is crucial to accurate depth estimation. In this study, we employed a grid size of 500 m × 500 m, a window size of 10 × 10, and a structural index of SI = 1.
Potential field data is subjected to 2D forward modeling in order to obtain a geological image of the basement, integrating depth and density. There have been a number of research (Mickus, 2008; Sayed and Aboud, 2012; Beshr et al., 2021; Alencar et al., 2022) that demonstrate the significance of two-dimensional modeling in the establishment of basement structures. 2D gravity modeling visualizes the Bahira basin structure in the current research. GM-SYS-2D/Oasis Montaj, which implements Talwani and Heirtzler (1964), analyzed three profiles (P1, P2, and P3) (Figure 5B). The models’ setups have been tweaked iteratively in order to obtain the best possible match between the computed and the observed gravity data.
Paleozoic schists and mica-schists make up the models’ basics, while Cretaceous and Eocene sedimentary rocks (containing rich phosphate layers) and Pliocene-Quaternary sediments make up the models’ sediment cover. Previous geological and geophysical studies (Er-rouane, 1996; Karroum et al., 2014) have given a density value of 2.67 g/cm3 to the Paleozoic basement. However, the density is calculated to be 2.45 g/cm3 for the sediment cover, which is less than that of the basement rocks.
Our qualitative and quantitative gravity data analysis is presented here. Power spectral analysis, derivatives, 3D Euler deconvolution, and 2D forward modelling contribute to these results. Data will be evaluated to create a geological model of the Bahira basin’s structure.
The FFT power spectrum curve of gravity data exhibits local, residual, and noise signals (Figure 4). The deep sources (regional component) have a frequency of zero to four cycles per unit grid. In contrast, the frequencies of the shallow sources (residual component) shift between 0.05 and 0.2 cycle/unit grid. A tangent was drawn for each component segment. Archibald and Bochetti (1999) propose using the tangent’s slope as a proxy for the mean depth. The average depth of the regional sources was found to be 7.3 km (blue line), whereas the average depth of the shallow sources was found to be 3 km (red line).
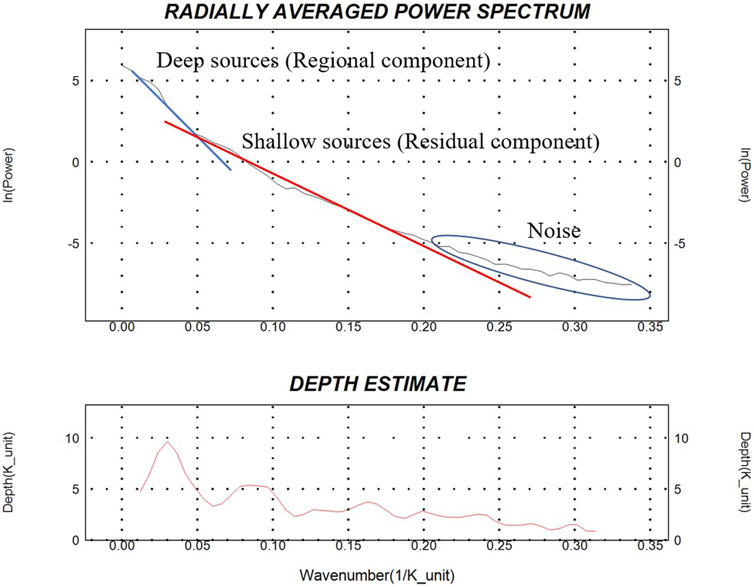
FIGURE 4. Radially averaged power spectrum of the Bouguer anomalies showing the averaging regional and residual depths of the Bahira basin.
The gravity values range laterally from −45 to 15.6 mGal, as seen on the Bouguer anomaly map (Figure 5A). West of the studied region, the Bouguer value gradient is increasing. The center and eastern regions are home to a sharps-negative anomaly. These irregularities may be low-density blocks or sedimentary basins. High-density blocks are associated with the positive anomalies seen in the west, south, and north. Different short wavelength anomalies associated with shallow causal sources can be seen in the Bahira basin’s residual gravity map (Figure 5B). The anomalies tend to move in two broad orientations: NW-SE, ENE-WSW, and WNW-ESE. The residual gravity anomaly values vary between −15 and 15 mGal. These changes are linked to underlying density shifts caused by underlying geological features. Negative anomalies trend NW-SE and NE-SW in the east. Deep sedimentary basins explain these abnormalities. The major NW-SE anomaly is the Benguerir granite intrusion beneath the cretaceous layer. A negative anomaly reflects the northern Rehamna mountain’s Hercynian granite. The northwest’s Valanginian limestones (Lower Cretaceous) has a negative anomaly.
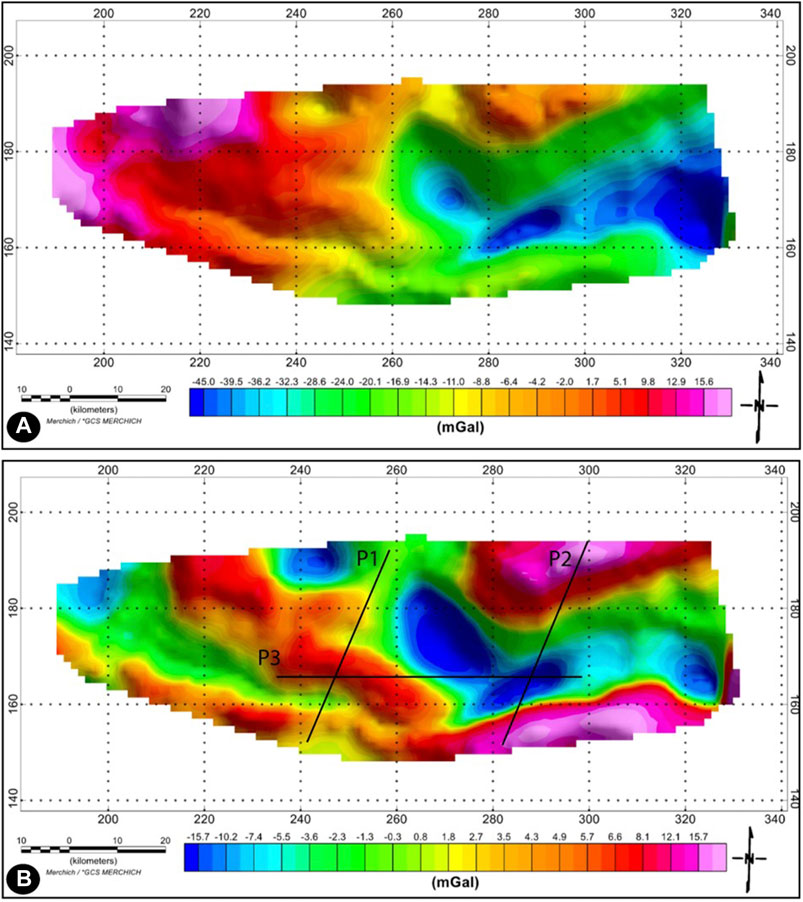
FIGURE 5. Gravity maps of the study area: (A) Bouguer anomaly, and (B) residual anomaly.
Positive anomalies have also been spotted. Both the southeast and the northeast have the highest concentrations of positive anomalies. They align with the north Hercynian basement outcrop at Rehamana and the south Paleozoic basement (schist) uplift at Jebilet. The center of the Bahira basin has an NW-SE-oriented positive anomaly. The Paleozoic massif’s Rhirat threshold causes this oddity. The deposit of secondary formations was impeded by this critical threshold. The elevation of the Hercynian massif of Rehamna is reflected by a positive anomaly in the region’s northwestern corner. A WNW-ESE positive anomaly in the southern portion of the study region indicates Paleozoic basement uplift (Jebilet massif).
Figure 6 shows the map of the horizontal gradient, highlighting various lineaments with prominent amplitudes. The local maximum horizontal gradient obtained via a series of upward continuation levels (0.250, 0.5, 1, 2, 3, 5, 8, 10, and 20 km) is superimposed on the THDR map to emphasize the lineament trend. These findings reveal the most significant structural lineament/faults trend in NE-SW, NW-SE, WSW-ENE, and ENE-WSW. The orientations of the Hercynian structure fall along these directions.
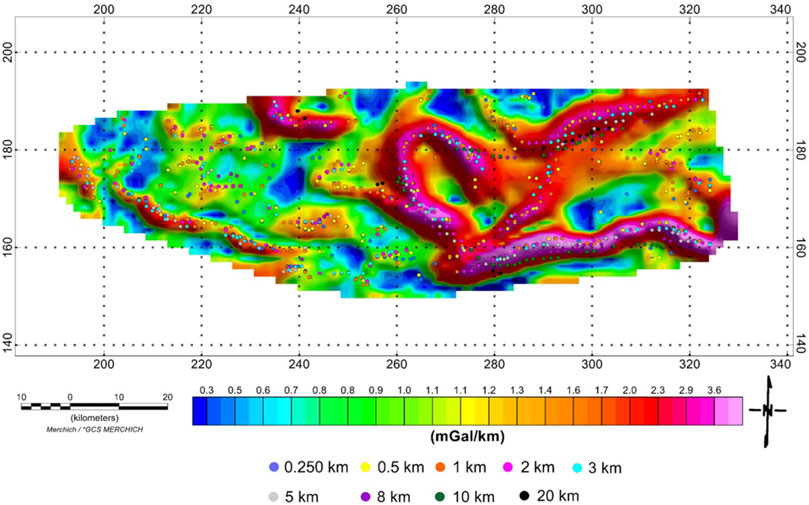
FIGURE 6. Total horizontal derivative (THDR) map with superposed upward continuation maximum.
The first vertical derivative maps show short-wavelength sources, horizontal extensions, and anomaly geometry. Figure 7 shows Bouguer gravity map FVD anomalies that match those in residual gravity map (5b). ENE-WSW, NE-SW, and NW-SE local anomaly trends match the THDR maximum.
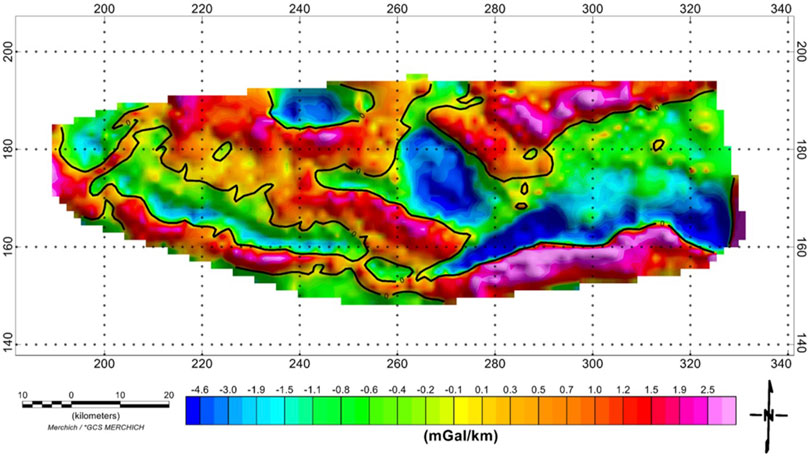
FIGURE 7. First vertical derivative map of the study area with displayed zero contour line.
Figure 8 shows the TDR map created by filtering the Bouguer anomaly map. It is clear where the negative anomaly (sedimentary basin) contacts the positive anomaly (basement). Similarities between the TDR and FVD maps may be seen in the positioning of contacts and edge features, and both are well suited for distinguishing shallow source structures. This map shows that the amplitude of Bouguer anomaly tilt derivative anomalies ranges from 1.3 to 1.2 rad. Figure 8 shows the total horizontal derivative maximum above the Tilt derivative zero outlines. The THDR maximum and zero contours often overlap, but not always. Where the maximum and zero contours intersect is where you’ll find the faults (Fairhead, 2015). The most common fault lines run in the NW–SE and ENE–WSW directions, respectively.
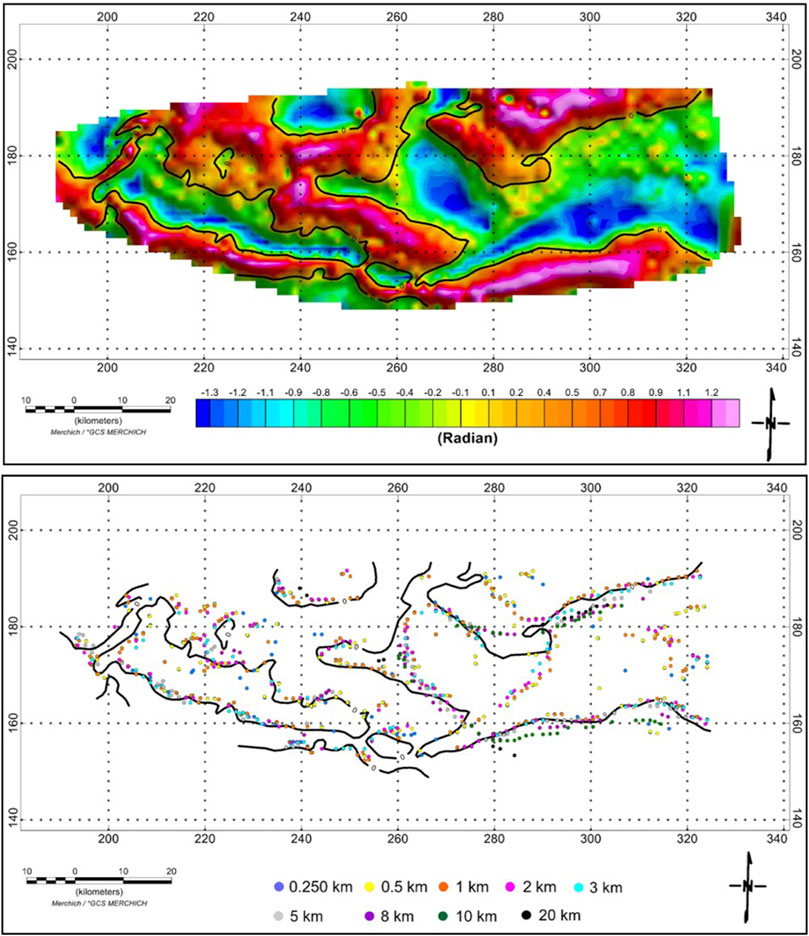
FIGURE 8. Tilt derivative map of the study area (top). The bold lines show contour: the 0 radians (black color). The map at the bottom presents the overlaying of the zero contours and maximum of the THDR.
With a peak over the bodies’ edges, THDR_TDR provides the shaped anomaly (Verduzco et al., 2004; Fairhead, 2015). In Figure 9, edges retain the THDR and FVD maps’ trend. The scale of the coloured bars estimates the source’s depth at 1.66–10 km. Bottomless source bodies east of the research region cause it. The basement uplift occurs in the central and eastern basins, while shallow cause bodies are in the southern, western, and northern basins.
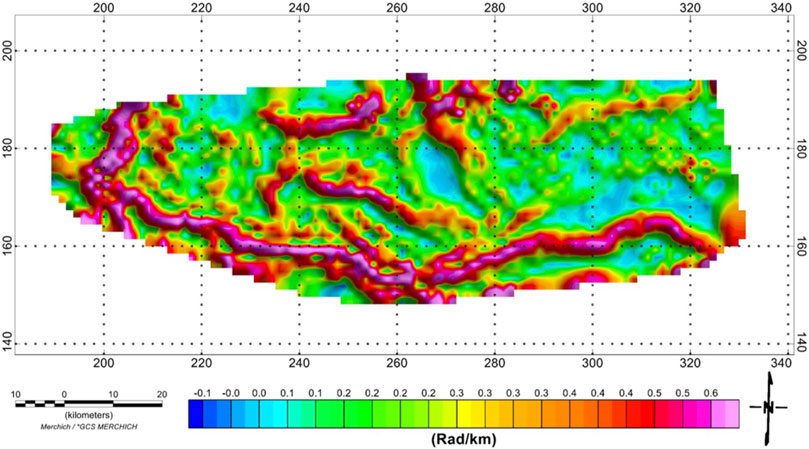
FIGURE 9. Total horizontal derivative of the Tilt derivative map.
The outcomes of edge detection methods are seen to be very close to the 3D Euler deconvolution solutions (Figure 10). The Euler solution closely follows the zero contour of the Tilt derivative (TDR). NWSE, ENEWSW, and NESW are the most common tectonic directions seen in ED output. Euler’s calculated depths extent a range of two to 8 km.
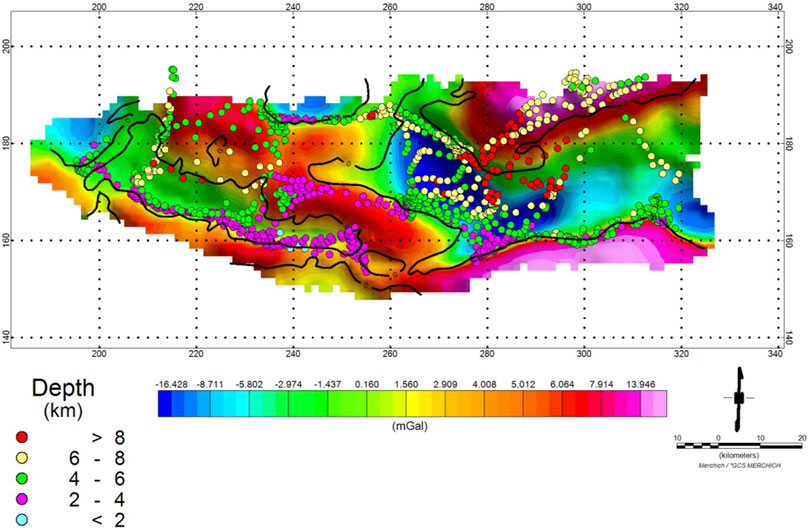
FIGURE 10. 3D-Euler Deconvolution solutions plotted on the residual gravity map. The black contour corresponds to the 0 radians of the tilt angle.
The depth to the Paleozoic basement decreases from about 1.3 km in the southwest to 0.8 km in the middle part, as seen in profile P1 (Figure 11A). It is also clear that the depth increases in the northeastern region, maintaining a consistent 1.5 km depth elsewhere. The model displays a sub-tabular basement with a raised part in the center. As demonstrated in Profile P2 (Figure 11B), the basement surface is at 0.5 km in the southwest, 3.3 km in the central area, and 0.5 km again in the northeast. Faults may cause steep residual gravity anomaly fluctuations. The simulated blocks show uplifted Paleozoic basement (horsts) in the southwest and northeast and down-faulted blocks (graben) in the center.
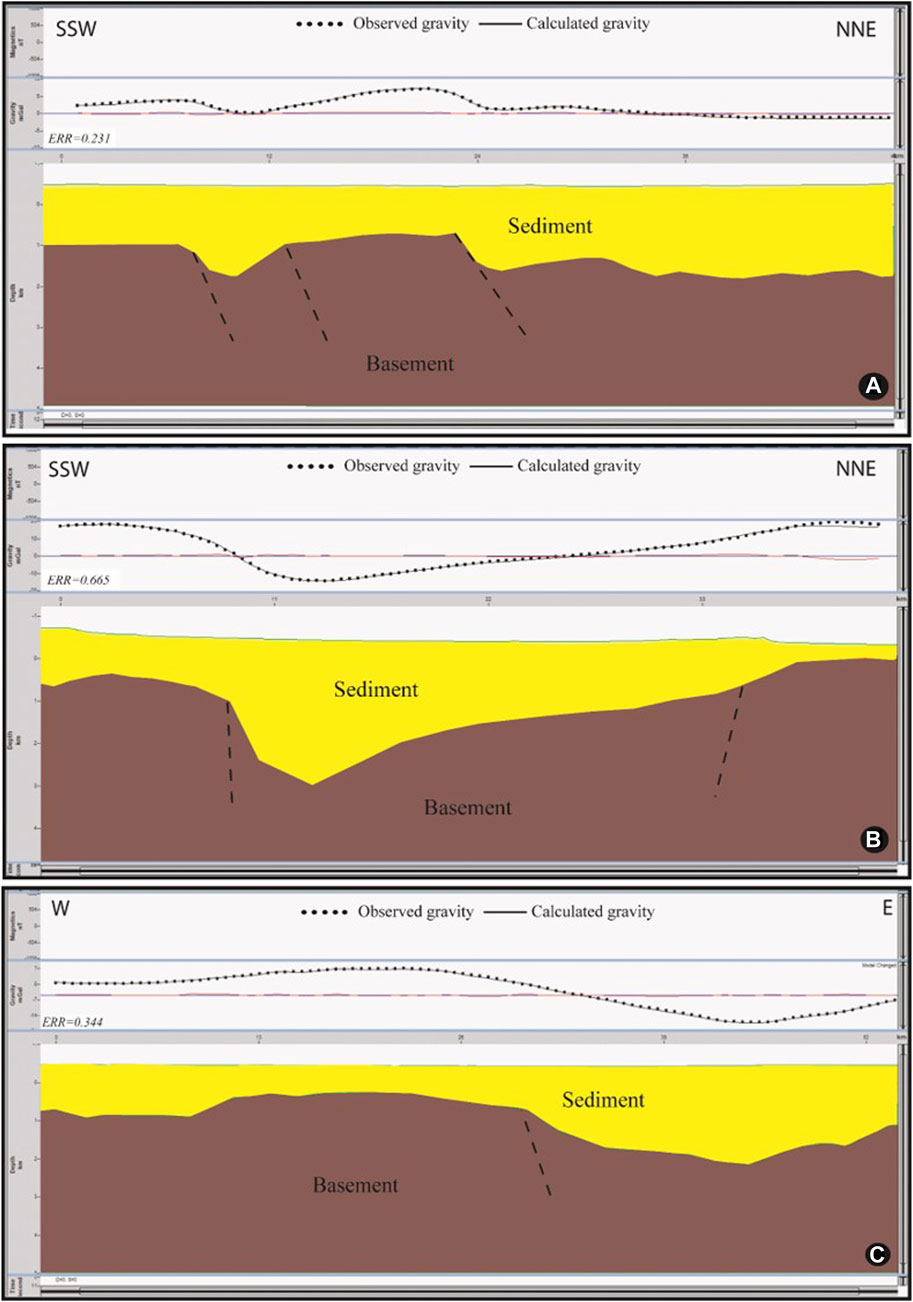
FIGURE 11. Two-dimensional interpreted gravity model along the profiles P1 (A), P2 (B), and P3 (C).
Profile P3 (Figure 11C) shows the longitudinal basement plan. The western section’s basement has a subtabulaire structure and an outcropping at the Rhirat threshold. The basement deepens towards the east. An inverted fault on the western flank of the Benguerir granite intrusion connects the two zones. Diot (1989) suggests that this structure is connected to the transformation of a westward thrusting of the Eastern Rehamna into an EW compression.
The analysis of the gravity field of the Bahira basin revealed the structures of the basin that occurs under the sequence of Cretaceous and Quaternary deposits. The various findings highlight the influence of the Paleozoic basement topography. The Hercynian substratum is exposed in the southern region of the study area in the Jebilet massif, as well as in the northern part, represented by the Rehamna massif. Total horizontal derivative (THDR) was used to identify the structural framework of the study area. The finding shows two main group of faults, oriented NE-SW and ENE–WSW direction. The first group consists of shallow faults that have the same trending as the Hercynian structures. The second group of faults is characterized by major faults that are believed to have played a crucial role in shaping the structure of the study area and may be associated with the Atlas orogeny. The overlapping of the 0 contour of Tilt derivative on the THDR map confirmed the localization of these faults.
The horizontal derivative of the tilt derivative evidenced the same major trend as showing by the THDR, FVD and TDR. Furthermore, the THDR_TDR map indicates that the uplift of the basement shallow source bodies is present in the southern, western, and northern basins. This finding matched with the Paleozoic basement topography where the major fault bounding the basin in the north and south. The Euler deconvolution (ED) was applied to enable the mapping of geological structures and to provide insights into the depth of the highlighted features. The clustering of ED solutions around the majority of the identified faults confirms the obtain results. The fault system responsible for the basin structure extends to varying depths, ranging from two to 8 km. According the ED solutions results, the source bodies are deeper in the eastern unit of the basin. These findings confirm previous research work and suggest that the basement deepens eastward (Er-rounae 1996; Karroum et al., 2014).
The structural context of the Bahira basin described by the use of the various upgraded techniques reveals distinct basement blocks, indicating a compartmentalization of the underlying geological formation. Two distinct units, eastern and western, are identified. A glacis zone gently sloping from the SSE to the north of the basin defines the eastern unit. Deep sedimentary rock forms the Paleozoic basement. The northern boundary is a locally major fault, while the southern boundary is a big bordered coincidence trending ENE-WSW. The western unit has a broad, sub-tabular Paleozoic basement. The Rhirat threshold breaks the sedimentary cover’s southerly dip towards the Jebilet from the north of the basin. Southern border accidents are far lower than Eastern ones. The estimated basement depth makes the eastern Bahira Basin more noticeable. The Hecynien orogeny was overthrust to the west in a major tectonic setting (Diot, 1989). The techniques identified the Bahira basin’s horst-graben basement structure.
The application of gravity modeling enables the determination of the trough’s geometry along three profiles. Through a 2D forward modeling approach, it is revealed that the basin corresponds to an asymmetrical syncline marked by a gradual increase in the depth of the Paleozoic basement towards eastern part of the study area. The structure reveled by the profiles agree with previous techniques result’s, they identified a Bahira basin’s horst-graben basement structure.
This study’s enhanced methods confirmed many undescribed lineaments. Our results map and model the basement structure, unlike prior 2D studies that primarily examined the western basin.
The subsurface structure, tectonic framework, and basement structure of the Bahira basin have all been mapped using gravity measurements collected in the area of interest. Incorporating the power spectrum, edge detection methods, 3D Euler deconvolution, and a gravity model, this analysis was carried out. The density and sediment thickness variations below the surface are reflected in the Bouguer gravity anomaly. The results unveiled a correlation between observed anomalies and surface geology. New subsurface structures in the study area, previously unknown, has been described with the use of upgraded techniques applied to gravity data. The FFT method was first used to isolate the remaining regional components, which allowed us to pinpoint the source’s periphery and depths. According to the power spectrum study, the average depth of the regional sources is roughly 7.3 km. Alternatively, the typical depth of shallow sources is only 3 km. Multiple structural trends (NE-SW, NW-SE, ENE-WSW, and WNW-ESE directions) were detected by the majority of the used edge detection methods (THDR, FVD, TDR, and HD_TDR). The analysis of structural lineaments reveals the presence of two predominant sets of trends, namely, NE-SW and ENE-WSW. These trends have a significant influence on the tectonic activity within the region. The fault trending in the NE-SW direction is attributed to the Hercynian orogeny, whereas the ENE-WSW fault trend is linked to the Atlasic orogeny comprising major boarded faults. These faults play a significant role in shaping the study area’s structural configuration and bedrock topography. The Euler deconvolution verified that the eastern unit’s basement depth is greater, confirming edge detection’s subsurface features. The structure of the Bahira basin may be visualized synthetically thanks to 2D forward modeling. The western half of the Bahira basin has a sub-tabular structure with a shallow basement, whereas the eastern portion has a deep sedimentary layer. The structure is attributed to a compressive phase that affecting the western Moroccan Meseta characterized by faults trending in the NE-SW and ENE-WSW directions. The grabens structuring of the study area could have resulted from this deformation.
The combining of gravity and geological data allows for the construction of a comprehensive picture of the basin structure. New techniques (improved methodologies and 2D modelling) for analyzing gravity data have revealed previously unknown aspects of the Bahira basin’s geological and structural framework. The new study provides final data, completing the work of earlier researchers, and can serve as a roadmap for future studies.
The datasets presented in this article are not readily available because upon availability. Requests to access the datasets should be directed to bWVyaWVtLmxnaG91bEB1c21zLmFjLm1h.
All authors listed have made a substantial, direct, and intellectual contribution to the work and approved it for publication.
This research was funded by the Researchers Supporting Project number (RSP2023R249), King Saud University, Riyadh, Saudi Arabia.
The authors declare that the research was conducted in the absence of any commercial or financial relationships that could be construed as a potential conflict of interest.
All claims expressed in this article are solely those of the authors and do not necessarily represent those of their affiliated organizations, or those of the publisher, the editors and the reviewers. Any product that may be evaluated in this article, or claim that may be made by its manufacturer, is not guaranteed or endorsed by the publisher.
Abdelrahman, K., El-Qassas, R. A. Y., Fnais, M. S., Andráš, P., and Eldosouky, A. M. (2023). Geological structures controlling Au/Ba mineralization from aeromagnetic data: Harrat ad danun area, Saudi Arabia. Minerals 13, 866. doi:10.3390/min13070866
Al-Badani, M. A., and Al-Wathaf, Y. M. (2018). Using the aeromagnetic data for mapping the basement depth and contact locations, at southern part of Tihamah region, Western Yemen. Egypt J. Pet. 27, 485–495. doi:10.1016/j.ejpe.2017.07.015
Alencar, C., Matos, D., Henrique, P., Marinho, M., Marangoni, Y., Araujo, J., et al. (2022). Gravity surveys and 3D integrated model with magnetic and geological data of the granite-greenstone terrane in Pitangui Synclinorium, NW of the Quadrilatero Ferrífero (MG, Brazil). J. S. Am. Earth Sci. 116, 103828. doi:10.1016/j.jsames.2022.103828
Alqahtani, F., Ehsan, M., Aboud, E., Abdulfarraj, M., and El-Masry, N. (2023a). Integrated approach using petrophysical, gravity, and magnetic data to evaluate the geothermal resources at the Rahat Volcanic Field, Saudi Arabia. Front. Earth Sci. 11, 1135635. doi:10.3389/feart.2023.1135635
Alqahtani, F., Aboud, E., Ehsan, M., Naseer, Z., Abdulfarraj, M., Abdelwahed, M. F., et al. (2023b). Geothermal exploration using remote sensing, surface temperature, and geophysical data in Lunayyir volcanic field, Saudi Arabia. Sustainability 15, 7645. doi:10.3390/su15097645
Araffa, A. S., Abdelazeem, M., Sabet, H., and Al Dabour, M. (2021). Gravity interpretation for delineating subsurface structures and depth of basement at El Moghra area, North Western Desert, Egypt. NRIAG J. Astron Geophys 10, 270–278. doi:10.1080/20909977.2021.1913364
Archibald, N., Bochetti, F., and Boschetti, F. (1999). Multiscale edge analysis of potential field data. Explor. Geophys. 30, 38–44. doi:10.1071/eg999038
Ayoola, A. H., and Osinowo, O. O. (2022). Analysis of airborne potential field data for hydrocarbon exploration in Southern Nigeria. Results Geophys. Sci. 10, 100043. doi:10.1016/j.ringps.2022.100043
Beshr, A. M., Kamel, A., Elgalladi, A., Gaber, A., and El-Baz, F. (2021). Structural characteristics of the qena bend of the Egyptian nile river, using remote-sensing and geophysics. Egypt. J. remote. Sens. 24, 999–1011. doi:10.1016/j.ejrs.2021.11.005
Bhattacharyya, B. K. (1996). Continuous spectrum of the total magnetic field anomaly due to a rectangular prismatic body. Geophysics 31, 97–121. doi:10.1190/1.1439767
Blakely, R. J., and Simpson, R. W. (1986). Approximating edges of source bodies from magnetic or gravity anomalies. Geophysics 51, 1494–1498. doi:10.1190/1.1442197
Diot, H. (1989). Mise en place des granitoïdes hercyniens de la Meseta marocaine, Étude structurale des massifs de Sebt de Brikine (Rehamna), de Zaër et d'Oulmès (Massif Central) et d'Aouli-Boumia (Haute Moulouya). Thesis. France: Paul Sabatier University.
Ekwok, S. E., Eldosouky, A. M., Ben, U. C., Alzahrani, H., Abdelrahman, K., Achadu, O.-I. M., et al. (2022a). Application of high-precision filters on airborne magnetic data: A case study of the ogoja region, southeast Nigeria. Minerals. 12, 1227. doi:10.3390/min12101227
Ekwok, S. E., Achadu, O-I. M., Akpan, A. E., Eldosouky, A. M., Ufuafuonye, C. H., Abdelrahman, K., et al. (2022b). Depth estimation of sedimentary sections and basement rocks in the bornu basin, northeast Nigeria using high-resolution airborne magnetic data. Minerals 12, 285. doi:10.3390/min12030285
Elabouyi, M., Yaagoub, D., Driouch, Y., Dahire, M., Qarqori, K., Manar, A., et al. (2022). The buried Variscan granites and associated structures in the High Moulouya basin from gravity data and their role during the Triassic-Liassic extensional tectonics (Moroccan Meseta-Atlas domain). J. Afr. Earth Sci. 193, 104597. doi:10.1016/j.jafrearsci.2022.104597
Eldosouky, A. M., El-Qassas, R. A. Y., Pham, L. T., Abdelrahman, K., Alhumimidi, M. S., El Bahrawy, A., et al. (2022a). Mapping main structures and related mineralization of the arabian shield (Saudi Arabia) using sharp edge detector of transformed gravity data. Minerals 12, 71. doi:10.3390/min12010071
Eldosouky, A. M., Elkhateeb, S. O., Mahdy, A. M., Saad, A. A., Fnais, M. S., Abdelrahman, K., et al. (2022b). Structural analysis and basement topography of Gabal Shilman area, South Eastern Desert of Egypt, using aeromagnetic data. J. King Saud. Univ.-Sci. 34, 101764. doi:10.1016/j.jksus.2021.101764
Eldosouky, A. M., Pham, L. T., Duong, V-H., Ghomsi, F. E. K., and Henaish, A. (2022c). Structural interpretation of potential field data using the enhancement techniques: A case study. Geocarto Int. 37, 16900–16925. doi:10.1080/10106049.2022.2120548
Eldosouky, A. M., Ekwok, S. E., Akpan, A. E., Achadu, O-I. M., Pham, L. T., Abdelrahman, K., et al. (2022d). Delineation of structural lineaments of Southeast Nigeria using high-resolution aeromagnetic data. Open Geosci. 14, 331–340. doi:10.1515/geo-2022-0360
Eldosouky, A. M., Pham, L. T., and Henaish, H. (2022e). High precision structural mapping using edge filters of potential field and remote sensing data: A case study from wadi umm ghalqa area, south eastern desert, Egypt. Egypt. J. remote. Sens. 25, 501–513. doi:10.1016/j.ejrs.2022.03.001
Eldosouky, A. M., Pham, L. T., Abdelrahman, K., Fnais, M. S., and Gomez-Ortiz, D. (2022f). Mapping structural features of the Wadi Umm Dulfah area using aeromagnetic data. J. King Saud. Univ.-Sci. 34, 101803. doi:10.1016/j.jksus.2021.101803
El-Sehamy, M., Abdel Gawad, A. M., Aggour, T. A., Orabi, A. H., Abdella, H. F., and Eldosouky, A. M. (2022). Sedimentary cover determination and structural architecture from gravity data: East of Suez Area, Sinai, Egypt. Arab. J. Geosci. 15, 109. doi:10.1007/s12517-021-09348-6
Er-rouane, S. (1996). Mise en œuvre d’outils informatiques pour la modélisation du système aquifère de la Bahira (Maroc Occidental). Thesis. France: Nancy I University.
Evjen, H. M. (1970). The place of the vertical gradient in gravitational interpretations. Geophysics 1, 127–136. doi:10.1190/1.1437067
Fairhead, J. D., Mackenzie, C., Green, C. M., and Verduzco, B. (2004). A new set of magnetic field derivatives for mapping mineral prospects. ASEG Ext. Abstr. 1, 1–4. doi:10.1071/aseg2004ab042
Huvelin, P. (1977). Etude géologique et gîtologique du massif hercynien des Jebilet (Maroc Occidental). Note et Mémoires du Service Géologique du Maroc, 307.
Ikirri, M., Jaffal, M., Rezouki, I., Echogdali, F. Z., Boutaleb, S., Abdelrahman, K., et al. (2023). Contribution of gravity data for structural characterization of the Ifni inlier, western anti-atlas, Morocco: Hydrogeological implications. Appl. Sci. 13, 6002. doi:10.3390/app13106002
Jaffal, M., Charbaoui, A., Kchikach, A., El Ghorfi, M., Khaldoun, A., Safhi, A. M., et al. (2022). Gravity study of the western Bahira Basin and the gantour phosphatic plateau, central Morocco: Interpretation and hydrogeological implications. J. Afr. Earth Sci. 193, 104581. doi:10.1016/j.jafrearsci.2022.104581
Karroum, M., Mandour, A., Khattach, D., Himi, M., Cassas, A., Rochdane, S., et al. (2014). Fonctionnement hydrogéologique du bassin de la Bahira (maroc central): Apport de l’analyse des données géologiques et gravimétriques. Can. J. Earth Sci. 51, 517–526. doi:10.1139/cjes-2013-0130
Kebede, H., Alemu, A., Nedaw, D., and Fisseha, S. (2021). Depth estimates of anomalous subsurface sources using 2D/3D modeling of potential field data: Implications for groundwater dynamics in the ziway-shala Lakes Basin, central main Ethiopian rift. Heliyon 7, e06843. doi:10.1016/j.heliyon.2021.e06843
Kharbish, S., Eldosouky, A. M., and Amer, O. (2022). Integrating mineralogy, geochemistry and aeromagnetic data for detecting Fe–Ti ore deposits bearing layered mafic intrusion, Akab El-Negum, Eastern Desert, Egypt. Sci. Rep. 12, 15474. doi:10.1038/s41598-022-19760-x
Mahdi, A. M., Eldosouky, A. M., El Khateeb, S. O., Youssef, A. M., and Saad, A. A. (2022). Integration of remote sensing and geophysical data for the extraction of hydrothermal alteration zones and lineaments; Gabal Shilman basement area, Southeastern Desert, Egypt. J. Afr. Earth Sci. 194, 104640. doi:10.1016/j.jafrearsci.2022.104640
Melouah, O., Eldosouky, A. M., and Ebong, W. D. (2021). Crustal architecture, heat transfer modes and geothermal energy potentials of the Algerian Triassic provinces. Geothermics 96, 102211. doi:10.1016/j.geothermics.2021.102211
Michard, A. (1996). “Eléments de géologie marocaine,” in Note et mémoire du service géologique du Maroc, 252–399.
Mickus, K. (2008). Regional gravity analysis of Burkina Faso: Implications for the location of metallic ore deposits. J. Afr. Earth Sci. 50, 55–66. doi:10.1016/j.jafrearsci.2007.09.016
Miller, H. G., and Singh, V. (1994). Potential field tilt—A new concept for location of potential field sources. Appl. Geophys 32, 213–217. doi:10.1016/0926-9851(94)90022-1
Milligan, P. R., and Gunn, P. J. (1997). Enhancement and presentation of airborne geophysical data. J. Aust. Geol. Geophys 17, 63–75.
Mohamed, A., Al Deep, M., and Abdelrahman Kabdelrady, A. (2022a). Geometry of the magma chamber and curie point depth beneath Hawaii island: Inferences from magnetic and gravity data. Front. Earth Sci. 10, 847984. doi:10.3389/feart.2022.847984
Mohamed, A., Abdelrahman, K., and Abdelrady, A. (2022b). Application of time-variable gravity to groundwater storage fluctuations in Saudi Arabia. Front. Earth Sci. 10, 873352. doi:10.3389/feart.2022.873352
Nzeuga, A. R., Ghomeshi, F., Pham, L. T., Eldosouky, A. M., Aretouyap, Z., Kana, J. D., et al. (2022). Contribution of advanced edge-detection methods of potential field data in the tectonic-structural study of the southwestern part of Cameroon. Front. Earth Sci. 10, 1–15.
Okpolin, C. C., and Akingboye, A. S. (2019). Application of high-resolution gravity data for litho-structural and depth characterisation around Igabi area, Northwestern Nigeria. Egypt. NRIAG J. Astron Geophys 8, 231–241. doi:10.1080/20909977.2019.1689629
Pham, L. T., Eldosouky, A. M., Melouah, O., Abdelrahman, K., Alzahrani, H., Oliveira, S. P., et al. (2021a). Mapping subsurface structural lineaments using the edge filters of gravity data. J. King Saud. Univ.-Sci. 33, 101594. doi:10.1016/j.jksus.2021.101594
Pham, L. T., Nguyen, D. A., Eldosouky, A. M., Abdelrahman, K., Vu, T. V., Al-Otaibi, N., et al. (2021b). Subsurface structural mapping from high-resolution gravity data using advanced processing methods. J. King Saud. Univ.-Sci. 33, 101488. doi:10.1016/j.jksus.2021.101488
Pham, L. T., Ouchchen, M., Eldosouky, A. M., Boutaleb, S., Abdelrahman, K., Gomez-Ortiz, D., et al. (2022a). Reinterpreting aeromagnetic data of the agadir melloul region (Morocco) for delineating structural lineaments: A new look. J. King Saud. Univ.-Sci. 34, 102325. doi:10.1016/j.jksus.2022.102325
Pham, L. T., Nguyen, T. X., Eldosouky, A. M., Do, T. C., and Nguyen, T. Q. (2022b). The utility of the enhancement techniques for mapping subsurface structures from gravity data. FSRT 3, 11–19.
Pham, L. T., Ghomsi, F. E., Vu, T. V., Oksum, E., Steffen, R., and Tenzer, R. (2023). Mapping the structural configuration of the Western Gulf of Guinea using advanced gravity interpretation methods. Phys. Chem. Earth. 129, 103341. doi:10.1016/j.pce.2022.103341
Prasad, K. N. D., Pham, L. T., Singh, A. P., Eldosouky, A. M., Abdelrahman, K., Fnais, M. S., et al. (2022). A novel enhanced total gradient (ETG) for interpretation of magnetic data. Minerals 12, 1468. doi:10.3390/min12111468
Rabii, F., Jallouli, C., Mickus, K., Soumaya, A., Rebai, N., and Ben Ayed, N. (2018). New insights on structures and active faults in northeastern Tunisia (Utica-Mateur region) from a gravity analysis: Geodynamic implications. J. Afr. Earth Sci. 147, 54–67. doi:10.1016/j.jafrearsci.2018.06.009
Reid, A. B., Allsop, J. M., Granser, H., Millett, A. J., and Somerton, I. W. (1990). Magnetic interpretation in three dimensions using Euler deconvolution. Geophysics 55, 80–91. doi:10.1190/1.1442774
Reid, A. B., Ebbing, J., and Webb, S. J. (2013). Avoidable euler errors – The use and abuse of euler deconvolution applied to potential fields. Geophys. Prospect. 62, 1162–1168. doi:10.1111/1365-2478.12119
Saada, S. A., Eldosouky, A. M., Kamel, M., El Khadragy, A., Abdelrahman, K., Fnais, M. S., et al. (2022). Understanding the structural framework controlling the sedimentary basins from the integration of gravity and magnetic data: A case study from the east of the qattara depression area, Egypt. J. King Saud. Univ.-Sci. 34, 101808. doi:10.1016/j.jksus.2021.101808
Saleh, A., Abdelmoneim, M., Abdelrady, M., and Deep, M. (2018). Subsurface structural features of the basement complex and mineralization zone investigation in the Barramiya area (Eastern Desert of Egypt) using magnetic and gravity data analysis. Arab. J. Geosci. 11, 676. doi:10.1007/s12517-018-3983-7
Salem, A., Williams, S., Fairhead, D., Smith, R., and Dhananjay, R. (2008). Interpretation of magnetic data using tilt-angle derivatives. Geophysics 73, L1–L10. doi:10.1190/1.2799992
Satyakumar, A., Pandy, A. K., Singh, A. P., and Tiwari, V. D. (2022). Delineation of structural and tectonic features in the Mahanadi basin, eastern India: New insights from remote sensing and land gravity data. J. Asian Earth Sci. 227, 105116. doi:10.1016/j.jseaes.2022.105116
Sayed, E., and Aboud, E. (2012). Determination of sedimentary cover and structural trends in the Central Sinai area using gravity and magnetic data analysis. J. Asian Earth Sci. 43, 193–206. doi:10.1016/j.jseaes.2011.09.010
Spector, A., and Grant, F. (1970). Statistical models for interpreting aeromagnetic data. Geophysics 35, 293–302. doi:10.1190/1.1440092
Talwani, M., and Heirtzler, J. R. (1964). “Computation of magnetic anomalies caused by two-dimensional structures of arbitrary shape,” in Computers in the mineral industries. Editor G. A. Parks (Stanford, USA: Stanford University Press), 464–480.
Thompson, D. T. (1982). Euldph: A new technique for making computer-assisted depth estimates from magnetic data. Geophysics 47, 31–37. doi:10.1190/1.1441278
Verduzco, B., Fairhead, J. D., Green, C. M., and MacKenzie, C. (2004). New insights into magnetic derivatives for structural mapping. Lead. edge 23, 116–119. doi:10.1190/1.1651454
Zaghdoudi, S., Kadri, A., Ben Alayet, M., Bounasri, M. A., Essid, E. M., and Gasmi, M. (2020). Genesis and structural arrangement of the collapsed Oued Gueniche plain and the surrounding folds (Neogene molassic basin of Bizerte, northeastern Tunisia): Insights from gravity data. J. Afr. Earth Sci. 174, 104053. doi:10.1016/j.jafrearsci.2020.104053
Keywords: enhanced methods, 3D euler deconvolution, 2D forward modeling, gravity data, bahira basin
Citation: Lghoul M, Abd-Elhamid HF, Zeleňáková M, Abdelrahman K, Fnais MS and Sbihi K (2023) Application of enhanced methods of gravity data analysis for mapping the subsurface structure of the bahira basin in Morocco. Front. Earth Sci. 11:1225714. doi: 10.3389/feart.2023.1225714
Received: 19 May 2023; Accepted: 13 July 2023;
Published: 27 July 2023.
Edited by:
Ahmed M. Eldosouky, Suez University, EgyptReviewed by:
Muhsan Ehsan, Bahria University, PakistanCopyright © 2023 Lghoul, Abd-Elhamid, Zeleňáková, Abdelrahman, Fnais and Sbihi. This is an open-access article distributed under the terms of the Creative Commons Attribution License (CC BY). The use, distribution or reproduction in other forums is permitted, provided the original author(s) and the copyright owner(s) are credited and that the original publication in this journal is cited, in accordance with accepted academic practice. No use, distribution or reproduction is permitted which does not comply with these terms.
*Correspondence: Meriem Lghoul, bWVyaWVtLmxnaG91bEB1c21zLmFjLm1h; Martina Zeleňáková, bWFydGluYS56ZWxlbmFrb3ZhQHR1a2Uuc2smI3gwMjAwYTs=
Disclaimer: All claims expressed in this article are solely those of the authors and do not necessarily represent those of their affiliated organizations, or those of the publisher, the editors and the reviewers. Any product that may be evaluated in this article or claim that may be made by its manufacturer is not guaranteed or endorsed by the publisher.
Research integrity at Frontiers
Learn more about the work of our research integrity team to safeguard the quality of each article we publish.