 Nianchun Li1,2
 Weijia Yue
94% of researchers rate our articles as excellent or good
Learn more about the work of our research integrity team to safeguard the quality of each article we publish.
Find out more
ORIGINAL RESEARCH article
Front. Earth Sci., 28 December 2023
Sec. Geohazards and Georisks
Volume 11 - 2023 | https://doi.org/10.3389/feart.2023.1224645
In the field of rock engineering, complexity of stress environment is an important factor affecting its stability. Thus, in view of fracture mechanism of rock under different loading rates within the scope of quasi-static strain rate, four groups of uniaxial compression tests with different strain rates were carried out on sandstone specimens, and strength, deformation, failure modes and acoustic emission characteristics of specimens were compared and analyzed. Furthermore, the fracture mechanism was discussed from the perspective of fracture characteristics based on fractal dimension, crack propagation law inverted through acoustic emission b-value, and micro fracture morphology. The results showed that as the strain rate increased from 10 to 5 s−1 to 10−2 s−1, the fractal dimension of rock fragments increased, and the fractal dimension of rock fragments increased by 9.66%, 7.32%, and 3.77% successively for every 10 times increase in strain rate, which means that the equivalent size of fragments was getting smaller, and the fragmentation feature was becoming increasingly prominent. The crack propagation process based on acoustic emission b-value showed that with the increase of loading rate, the specimen entered the rapid crack propagation stage earlier, in order of 68%, 66%, 29%, and 22% of peak stress. Moreover, the microscopic fracture morphology showed that with the increase of loading rate, transgranular phenomenon was clear, and the fracture morphology changed from smooth to rough. That meant that the fracture of sandstone rock at high loading rates was mainly caused by the propagation of large cracks, which was different from the slow process of initiation, convergence and re-propagation of small cracks at low strain rates.
In mining, tunnel, subway and hydropower engineering, the mechanical response (Huang et al., 2018; Zhao et al., 2018; Zhou et al., 2019; Hasan et al., 2022), seepage property (Ma et al., 2022a; Khurshid et al., 2022; Ma et al., 2023), thermal effect (Zhao et al., 2020; Dong et al., 2023) of rock are related to the effective bearing capacity and long-term stability of engineering structures. Especially, due to a series of man-made and natural conditions during the construction and use of underground rock mass engineering, such as excavation disturbance, blasting construction and occurrence conditions of rock strata, the stability of surrounding rock is often affected by unsteady and complex stress environment, which leads to the complexity and uncertainty of deformation and failure characteristics (Yin and Xie, 2019; Ji and Guo, 2020; Lv et al., 2022; Yang et al., 2023). Therefore, it is of great engineering value and practical significance to study deformation and failure characteristics of rock under variable loading rates.
When it comes to the influence of loading rate on mechanical responses of rock, scholars have carried out a lot of research work on strength, deformation and failure characteristics, and achieved fruitful research results (Hashiba and Fukui, 2015; Meng et al., 2016; Imani et al., 2017; Feng et al., 2018; Kang et al., 2019; Thongprapha et al., 2020; Tang et al., 2021; Lu et al., 2022; Tie et al., 2023). It has been proven that loading rate, as an important factor, can significantly affect the mechanical characteristics of rock. Loading process can be classified as static and dynamic, and research results showed that the ability of rock to resist deformation under dynamic conditions is much greater than that under static loading conditions (Wasantha et al., 2015; McNamara et al., 2016; Mahanta et al., 2017; Ranjith et al., 2017; Yasin et al., 2018; Zhang et al., 2019; Qiu et al., 2022; Li et al., 2023). These studies play an important role in understanding mechanical responses of rock to loading rates. In addition, considering that macroscopic mechanical responses of rock are the essence of microscopic crack initiation, propagation and ultimately penetration (Liang et al., 2015; Xu et al., 2015; Cao et al., 2019; Zhu et al., 2019), it is of great significance to further understand the deformation characteristics and fracture mechanism of rock by studying the whole process from damage initiation to overall instability in the microscopic perspective. Among them, with the continuous improvement of data acquisition accuracy, acoustic emission technology also has been widely used in monitoring development and propagation of rock cracks (Wang et al., 2018; Yang et al., 2020; Su et al., 2022; Zhao et al., 2022; Khadivi et al., 2023). It states that acoustic emission, as the earliest reflection of strain energy released in the form of pulse wave during crack propagation inside metal materials, plays an important role in analyzing damage and fracture law. Therefore, characterizing the deformation and failure process of rock based on acoustic emission parameters is of great significance for revealing the essence of rock deformation and failure from a microscopic perspective.
The instability of rock mass under dynamic impact is completed in an instant, while most rock mass engineering is under the condition of long-term bearing quasi-static loading, and the damage and instability have to undergo an obvious incubation process. In this paper, fine sandstone was selected as research object, and on the basis of previous studies, uniaxial compression tests with different strain rates of 10−5, 10−4, 10−3, and 10−2 s−1 were successively carried out within the quasi-static loading rate range, as well as real-time acquisition of acoustic emission information. The macroscopic mechanical responses, fragmentation feature, crack propagation evolution characteristic based on acoustic emission and microscopic fracture morphology of sandstone were comprehensively analyzed, aiming to reveal the difference of fracture mechanism of sandstone under different strain rate loading conditions from the macro and micro perspectives.
In this experiment, considering the widespread distribution of sedimentary rocks within the scope of human activities, sandstone blocks were derived from Linyi City, Shandong Province, China, and belong to Paleogene stratum. The component analysis showed that the size of mineral particles was relatively uniform, mainly concentrated in the 0.125–0.25 mm, and it is generally yellowish in color. In addition, its components were mainly composed of quartz and feldspar, belonging to the category of fine sandstone with dense structure, as shown in Figure 1.
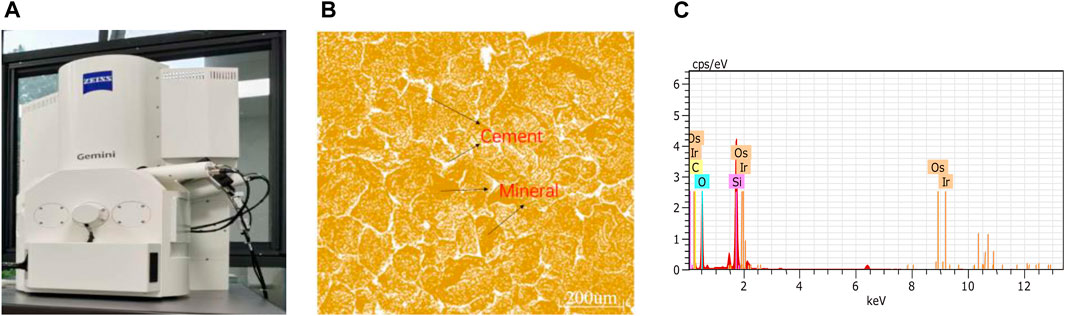
FIGURE 1. Microscopic composition of sandstone. (A) Scanning electron microscope. (B) Mineral particle distribution. (C) Element composition.
In the laboratory, rock blocks without visible defects on the surface were drilled in a direction perpendicular to the rock deposit surface. Finally, cylindrical specimens with a diameter of 50 mm and a height of 100 mm were made by coring, cutting and grinding, according to the standards of International Society for Rock Mechanics (Fairhurst and Hudson, 1999). In order to improve the reliability of testing process and reduce the discreteness of testing results, twelve specimens with machining accuracy meeting the requirements were randomly divided into 4 groups with 3 specimens in each group. The basic physical parameters of the sandstone specimens were obtained, as shown in Table 1. The average values of height to diameter ratio, density and velocity of longitudinal wave were 2.02, 2.95 g·cm−3 and 5.15 km·s−1, respectively.
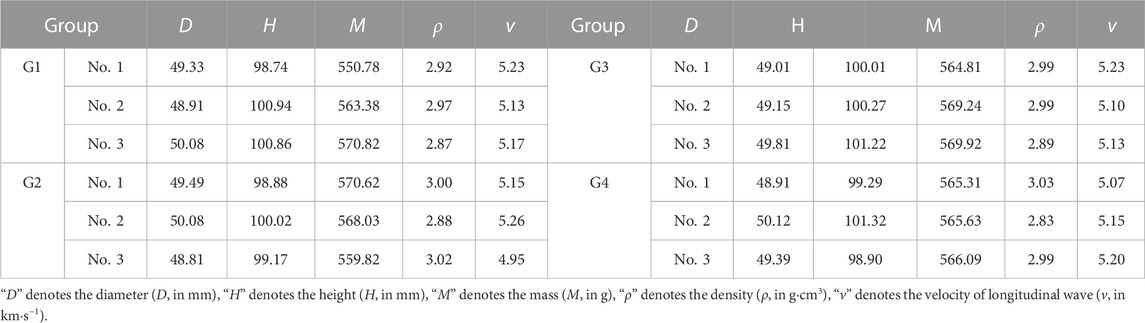
TABLE 1. Physical parameters of sandstone specimens.
In terms of loading rate, the strain rate is taken as the index, which is successively defined as creep, quasi-static and dynamic loading (Zou et al., 2016; Saeidi et al., 2017), where the quasi-static strain rate is from 1 × 10⁻⁵ to 1 × 10⁻² s−1. Therefore, the four groups of specimens were designed to be loaded within the quasi-static loading range, which were strain rates of 1 × 10⁻⁵, 1 × 10⁻⁴, 1 × 10⁻³, and 1 × 10⁻² s−1 respectively.
The experimental systems were shown in Figure 2A. Among them, the rock mechanics testing system was used to carry out loading tests at different strain rates, and in order to ensure the uniformity of strain rates in the experimental process, displacement loading method was adopted to carry out loading tests on the specimens and the corresponding loading rates is 0.001, 0.01, 0.1, and 1 mm·s−1. The mechanical response characteristics such as peak strength, peak strain and elastic modulus were obtained. Meanwhile, the acoustic emission monitoring system was simultaneously adopted to collect real-time acoustic emission information with four type R15a sensors as shown in Figure 2B. In order to ensure monitoring reliability, the preamplifier gain is set to 40 dB, the threshold 45 dB, and the sampling frequency 1 MHz.
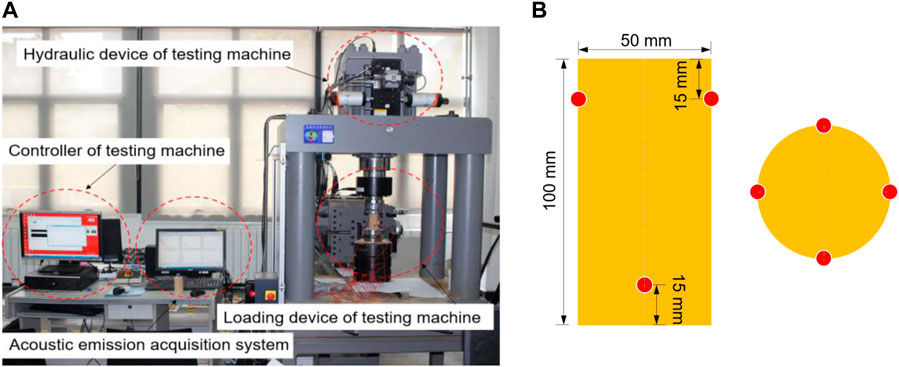
FIGURE 2. Experimental process. (A) Mechanics testing system and acoustic emission monitoring system. (B) Schematic diagram of acoustic emission sensor arrangement.
In order to analyze the mechanical characteristics of specimens under the influence of different loading rates, peak strength, peak strain and elastic modulus were obtained and statistically analyzed, as shown in Table 2.
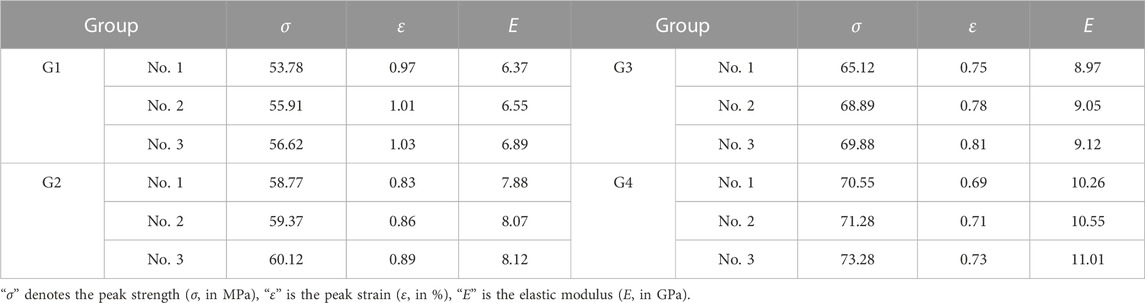
TABLE 2. Mechanical parameters of the specimens.
According to the statistical results, Figure 3 shows the variation trend of peak strength, peak strain and elastic modulus with strain rates. In general, peak strength and elastic modulus increased with the increase of strain rate in the range of quasi-static loading rates, showing a positive correlation, and the increasing trend gradually slowed down. However, there was a negative correlation between peak strain and strain rate. Different from peak strength and elastic modulus, peak strain decreased with the increase of strain rate, and the decreasing trend of peak strain also showed a gradual slowdown. In addition, the dispersion of experimental results was slightly higher than that of low strain rates at higher loading rates. The maximum dispersion of peak strength and peak strain was at a strain rate of 10−3 s−1, and elastic modulus was at a strain rate of 10−2 s−1.
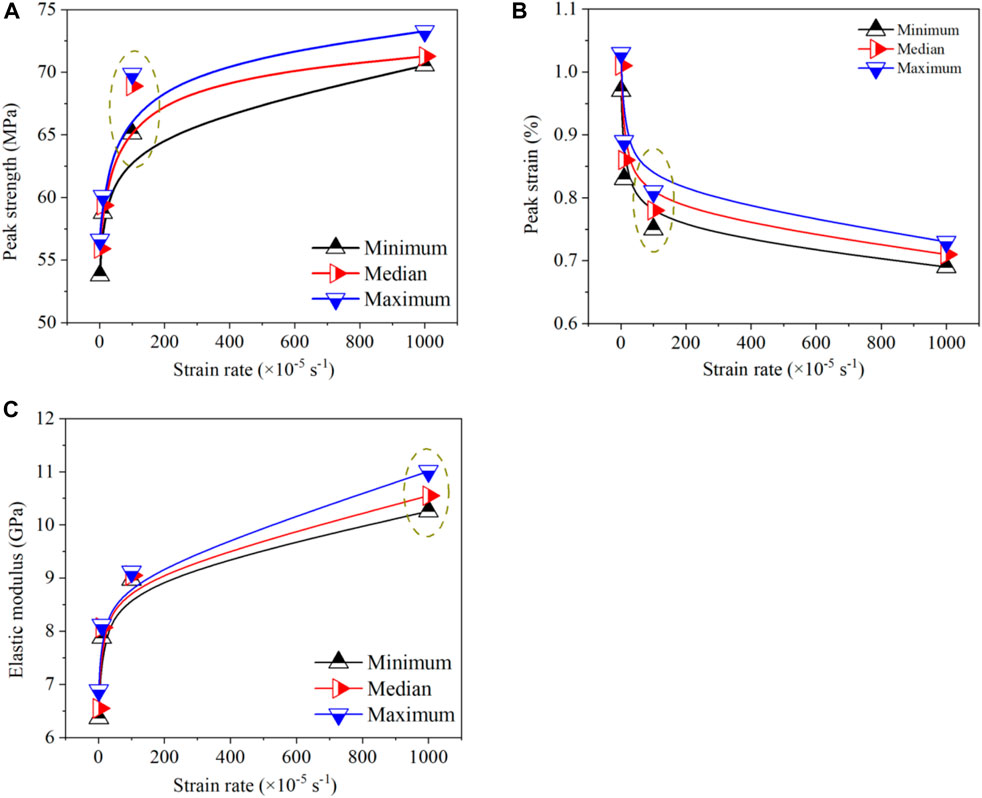
FIGURE 3. Mechanical characteristics. (A) Peak strength. (B) Peak strain. (C) Elastic modulus.
Figure 4 shows the failure characteristics of sandstone specimens under different loading rates. It can be seen that with the increase of loading rates, more macroscopic fracture surfaces appeared, showing more significant fragmentation. When the loading rate was 10−5 s−1, the macroscopic fracture surface of about 60° through the center of specimen mainly appeared, and the failure mode was relatively single. When the loading rates were 10−4 and 10−3 s−1, the number of macroscopic fracture surfaces increased, and fracture surfaces distributed along the axial loading aspect appeared. When the loading rate was 10−2 s−1, the distribution of fracture surfaces became more complex, and the specimen was broken into more small pieces, and the fragmentation of fracture was further increased.
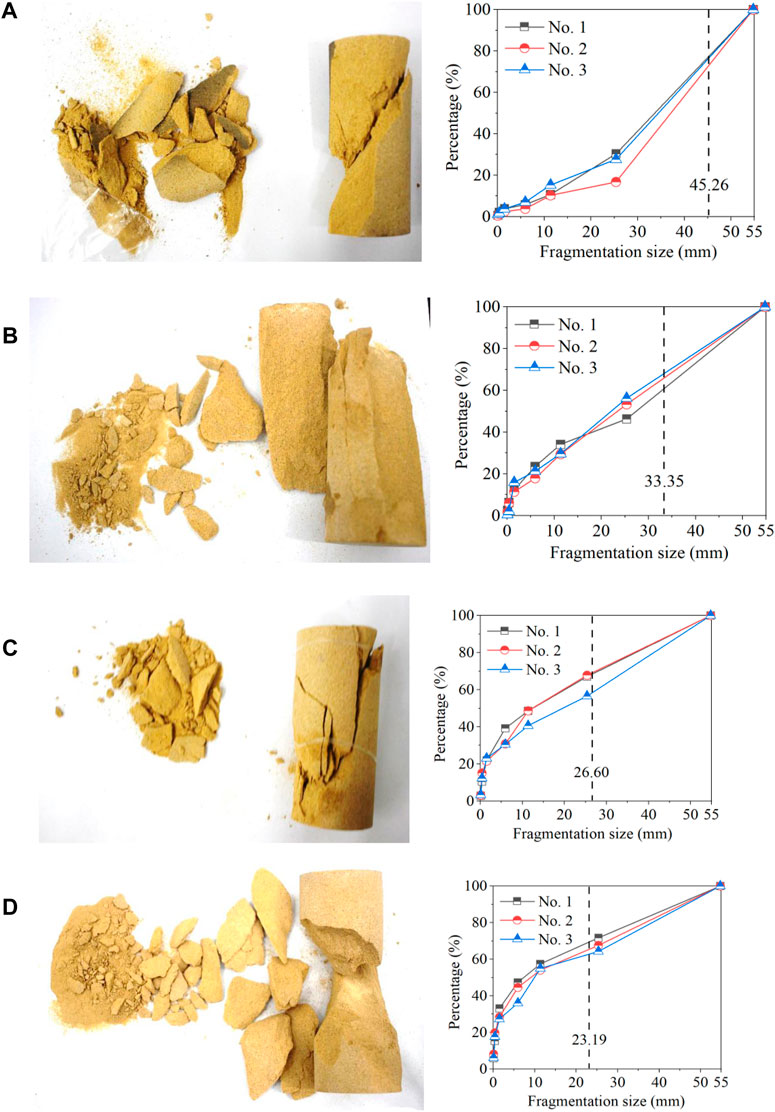
FIGURE 4. Fragmentation characteristics of rock specimens under different strain rates. (A) 10−5 s−1. (B) 10−4 s−1. (C) 10−3 s−1. (D) 10−2 s−1.
Furthermore, the fragments was counted and divided into 7 groups corresponding to different size grades, which were 0–0.15, 0.15–0.6, 0.6–2.36, 2.36–9.5, 9.5–13.2, 13.2–37.5, and 37.5–72 mm respectively. Accordingly, the equivalent size of fragments was calculated by Eq. 1.
where
To sum up, it can be seen that with the increase of strain rate, the equivalent size of fragments was 45.26, 33.35, 26.60, and 23.19 mm in turn, and the equivalent size of fragments was getting larger. In addition, the size distribution of fragments showed obvious differences. The proportion of small fragments (0–37.5 mm) increased from 16.74% to 30.32% in strain rate of 10−5 s−1 to 64.25%–71.70% in strain rate of 10−2 s−1. On the contrary, large fragments (37.5–72 mm) become smaller in proportion.
It is well known that acoustic emission events can reflect the three-dimensional location of damage inside rocks, in addition, considering that the acoustic emission amplitude, as a physical quantity reflecting the intensity of acoustic emission activities, can indirectly reflect the level of crack propagation, so two parameters, amplitude and event, are selected, as shown in Figure 5. It can be seen that, with the increase of loading rate, the density of low-amplitude acoustic emission events became smaller and smaller, and the proportion of events with larger magnitude was larger. The acoustic emission events with large amplitude were mainly concentrated in the later segment of loading process, especially at high loading rates. Although there will be large-amplitude events in the front section at high loading rates, short weak events will still occur in the middle section of loading. In addition, the three-dimensional distribution of acoustic emission events vividly reflects the whole process of damage from initiation, expansion to penetration with the loading process, and it can be inferred that with the increase of loading rates, the damage shows more and more obvious dispersion, indicating an increase in the degree of damage.
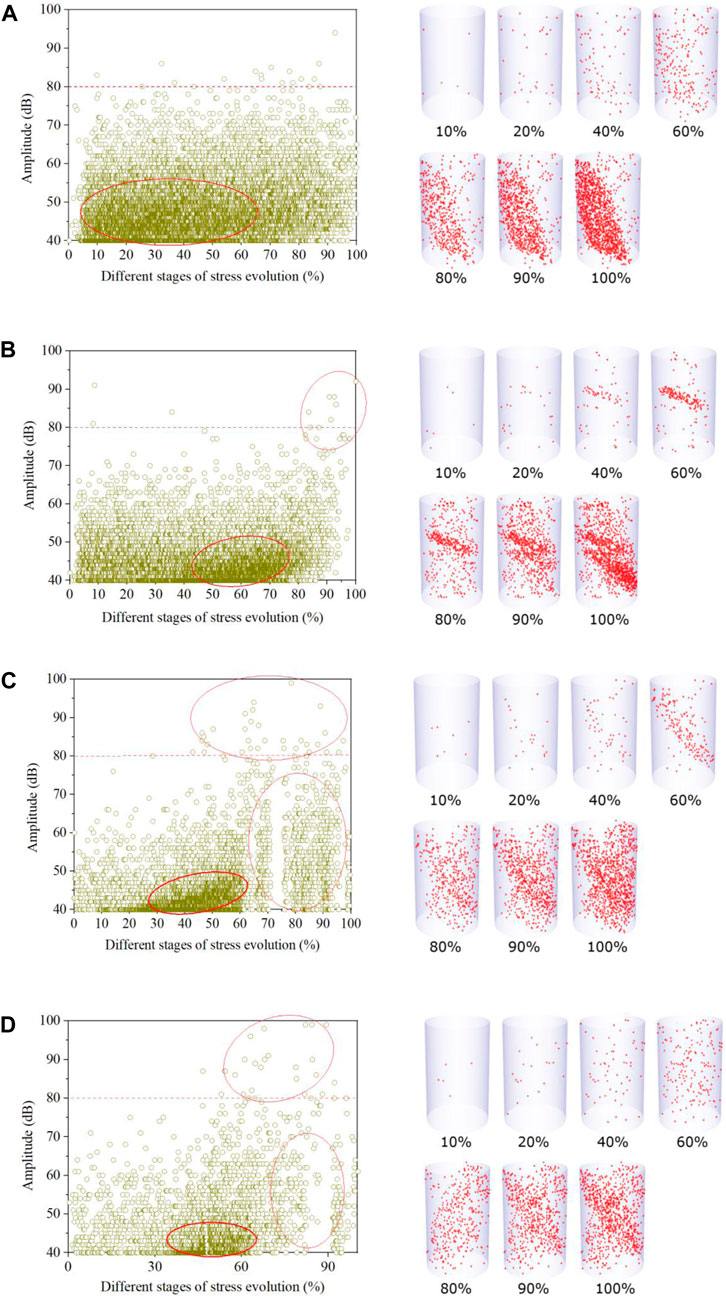
FIGURE 5. Acoustic emission amplitude and event evolution at different loading rates. (A) 10−5 s−1. (B) 10−4 s−1. (C) 10−3 s−1. (D) 10−2 s−1.
Thus, the acoustic emission amplitude varies with loading process. Further, the loading process was divided into seven stages according to 10%, 20%, 40%, 60%, 80%, 90%, and 100% of peak stress. The threshold value of acoustic emission amplitude was 40 dB, and the of intensity amplitude was divided into 6 levels with each 10 dB increase. The number distribution of acoustic emission events corresponding to different loading stages under different loading rates were respectively counted, as shown in Figure 6. It can be seen that acoustic emission events with lower amplitude were the main ones. As the loading process continued, the number of acoustic emission events with larger amplitude began to increase and the proportion increased as well as, indicating that acoustic emission activities began to intensify. However, there were differences in acoustic emission amplitude distribution under different loading rates. With the increase of loading rates, the proportion of high-amplitude acoustic emission events became larger, indicating that cracks growth was aggravated.
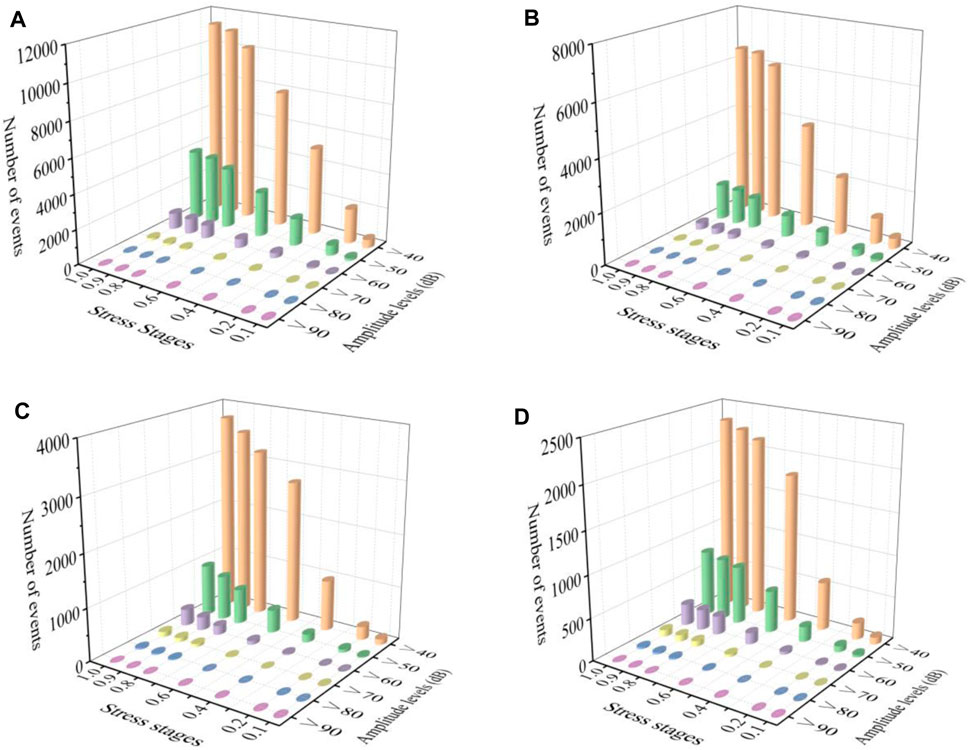
FIGURE 6. Number distribution of acoustic emission events with different amplitude levels at different stress stages. (A) 10−5 s−1. (B) 10−4 s−1. (C) 10−3 s−1. (D) 10−2 s−1.
For purpose of revealing the fracture mechanism, the fragmentation feature characterized by fractal dimension, the micro-crack propagation extracted by micro fracture morphology and acoustic emission b-value evolution were discussed from the macro and micro dimensions.
In order to establish the quantitative relationship between peak strength, peak strain, elastic modulus and strain rate, their mean values were linear fitted to logarithm of strain rate, as shown in Figure 7. The variation relationship was consistent with Eq. 2.
where m refers to the average value of peak strength, peak strain and elastic modulus under different strain rates, and k is the slope of linear fitting between average value of mechanical parameters and logarithm of strain rate indicating the absolute change value of mechanical parameters as a function of strain rate.
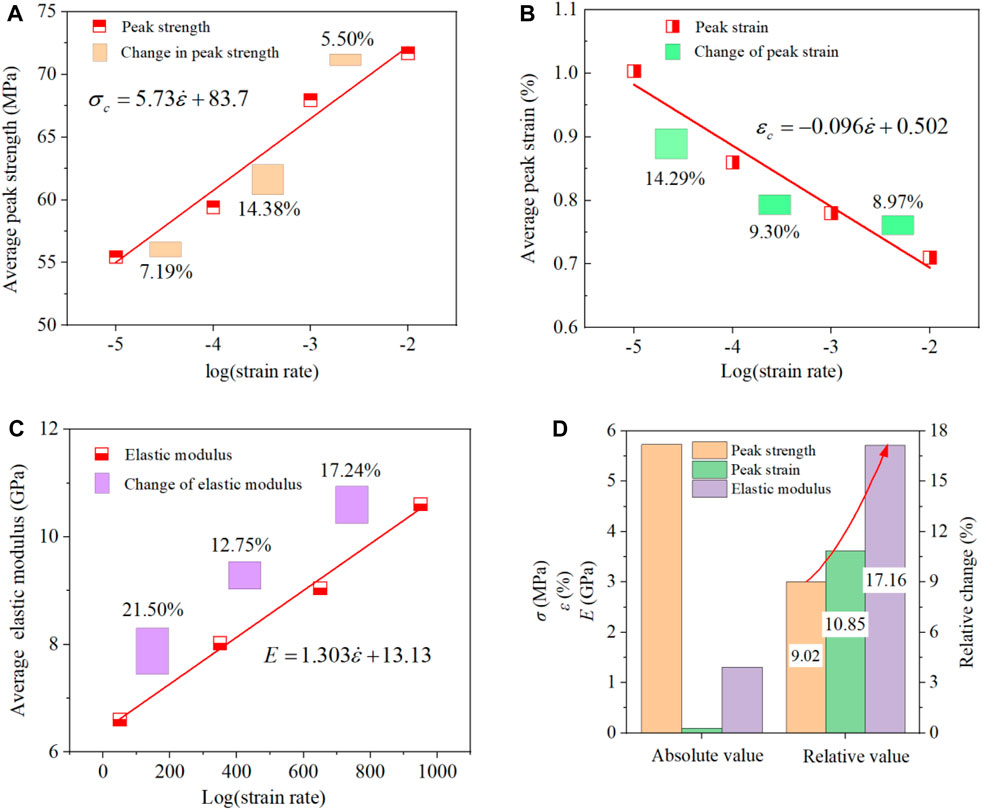
FIGURE 7. Relationship between mechanical properties and logarithm of strain rate. (A) Peak strength. (B) Peak strain. (C) Elastic modulus. (D) Sensitivity of mechanical parameters to strain rate.
Furthermore, the concept of sensitivity of mechanical parameters to strain rates was given, as shown in Eq. 3.
where d is the relative change value of peak strength, peak strain and elastic modulus among different strain rates, which is used to characterize sensitivity of mechanical parameters to strain rate.
Figures 7A–C give the fitting relationship between mechanical properties and logarithm of strain rate. In general, the peak strength and elastic modulus increased by 5.73 MPa and 1.303 GPa with the increase of strain rate by ten times, and peak strain decreased by 0.096%. However, the absolute change value can only reflect the actual value of mechanical parameters with the increase of strain rate, but the relative change value can better reflect the sensitivity of mechanical parameters to strain rate, as shown in Figure 7D. In the range of quasi-static strain rates, the growth rate of peak strength was 9.02%, the reduction rate of peak strain was 10.85%, and the growth rate of elastic modulus was 17.16%. It can be seen that the elastic modulus was more sensitive to strain rate, which increased by 90.24% and 58.16% compared with peak strain and peak strain, respectively.
Further, on the basis of results and analysis in Section 3.2, in order to quantitatively characterize the relationship between fragmentation feature and loading rate, fractal dimension of rock fragments was introduced. The relationship between mass of rock fragments and size was shown in Eq. 4 (Turcotte, 1986).
where Df is the fractal dimension of rock fragments, di is the equivalent size of fragments, dmax is the maximum equivalent size of fragments, M(di) is the cumulative mass of fragments with equivalent size smaller than di, M is the total mass of all fragments.
Take the logarithm of both sides of Eq. 4 to get Eq. 5 (Carpinteri et al., 2004).
Linear fitting of mass and size parameters was performed according to Eq. 5, as shown in Figure 8, and the fractal dimension of rock fragments under the influence of different strain rates can be obtained. It can be seen that the fractal dimension varied from 2.073 to 2.639, and on the whole, fractal dimension decreased with the increase of strain rates, indicating that the fragmentation feature was more significant at high strain rates.
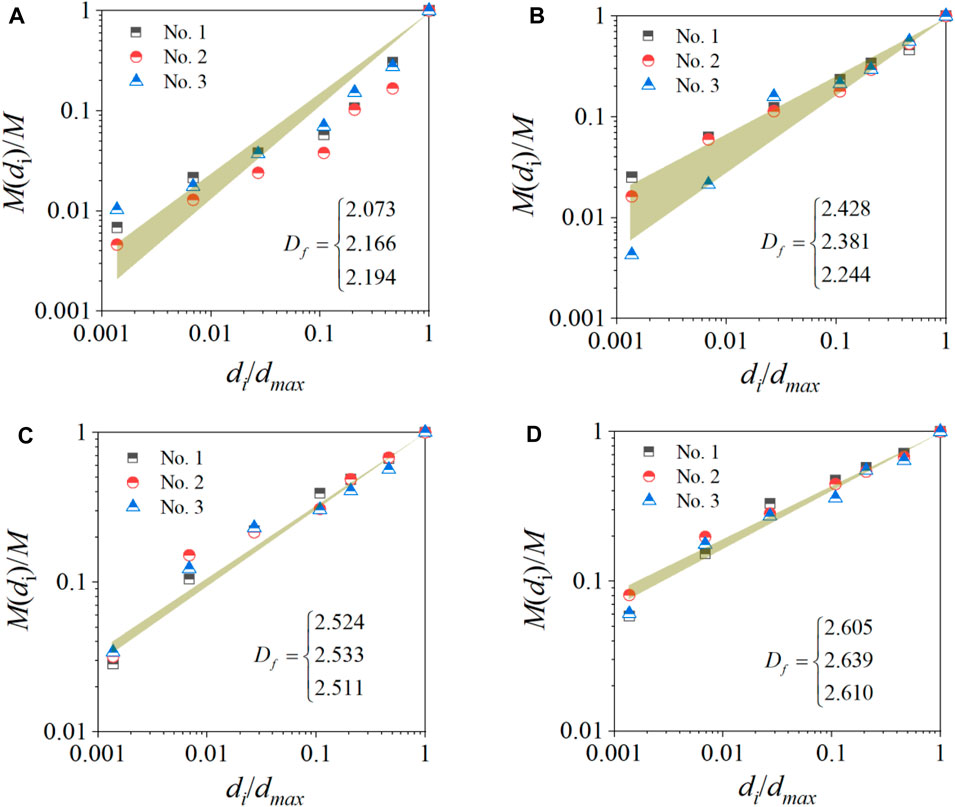
FIGURE 8. Fractal dimension of fragments with different loading rates. (A) 10−5 s−1. (B) 10−4 s−1. (C) 10−3 s−1. (D) 10−2 s−1.
Figure 9 shows the relationship between fractal dimension and logarithmic of strain rate. With the increase of loading rates, the fractal dimension increased, but its increasing trend gradually slowed down. When the strain rate was from 10−5 to 10−4 s−1, the fractal dimension growth rate was 9.66%, and the fractal dimension growth rates from 10−4 to 10−3 s−1 and from 10−3 to 10−2 s−1 were 7.32% and 3.77%, respectively. The reason was that with the increase of loading rates, within the range of quasi-static loading, the fragmentation feature experienced an initial drastic change from a lower loading rate to a higher loading rate, and with the further increase of loading rates, the influence of strain rates on the fragmentation feature gradually weakened and became stable.
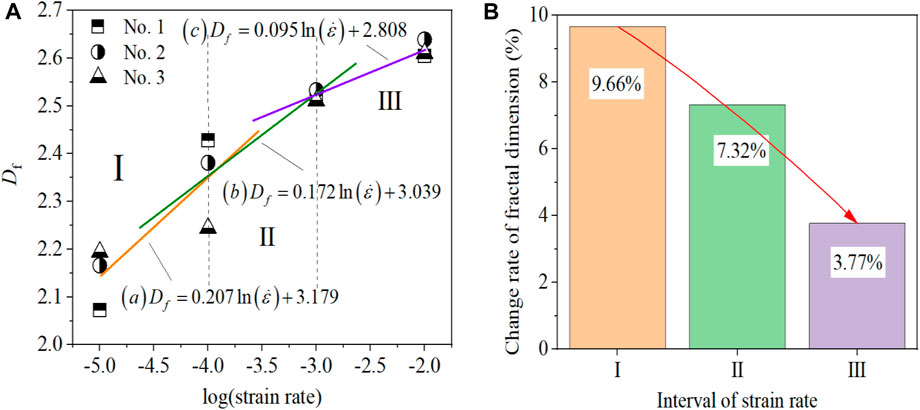
FIGURE 9. Relationship between fractal dimension and strain rate. (A) Change of fractal dimension as logarithm of strain rate. (B) Relative change rate of fractal dimension.
To reveal the damage evolution of sandstone under the influence of different loading rates, the acoustic emission b-value was selected to the study deformation and failure process, and the quantitative characterization relationship between acoustic emission b-value and micro crack propagation process was established. Acoustic emission b-value was first proposed to investigate seismicity (Gutenberg and Richter, 1944). It was used to describe the activity of earthquakes by establishing the relationship between earthquake magnitude and frequency. Further, research proved that the acoustic emission events generated during rock failure were similar to seismic activity in the underground rock stratum, and the acoustic emission amplitude was positively correlated with the scale of rock fracture. Therefore, a large number of studies have found that the relationship between acoustic emission events and amplitude can be established by dividing acoustic emission amplitude by 20 instead of the magnitude of seismic activity, expressed in Eq. 6 (Sagasta,et al., 2018; Parsons, et al., 2018; Dong, et al., 2022).
where AdB is the acoustic emission amplitude, N is the cumulative number of acoustic emission events with amplitude greater than AdB, b is the fitting slope of log10N and AdB, which represents the relative ratio of large amplitude acoustic emission events to small amplitude acoustic emission events. The smaller b-value is, the more proportion of large amplitude acoustic emission events, and the severity of rock damage is aggravated.
In Eq. 6, according to the number distribution of acoustic emission events with different amplitude levels at different stress stages given in Figure 6, the fitting relationship between log10N and AdB at different loading times was established. The variation characteristics of b-value with the deformation and fracture evolution process under the influence of different strain rates were obtained, as shown in Figure 10.
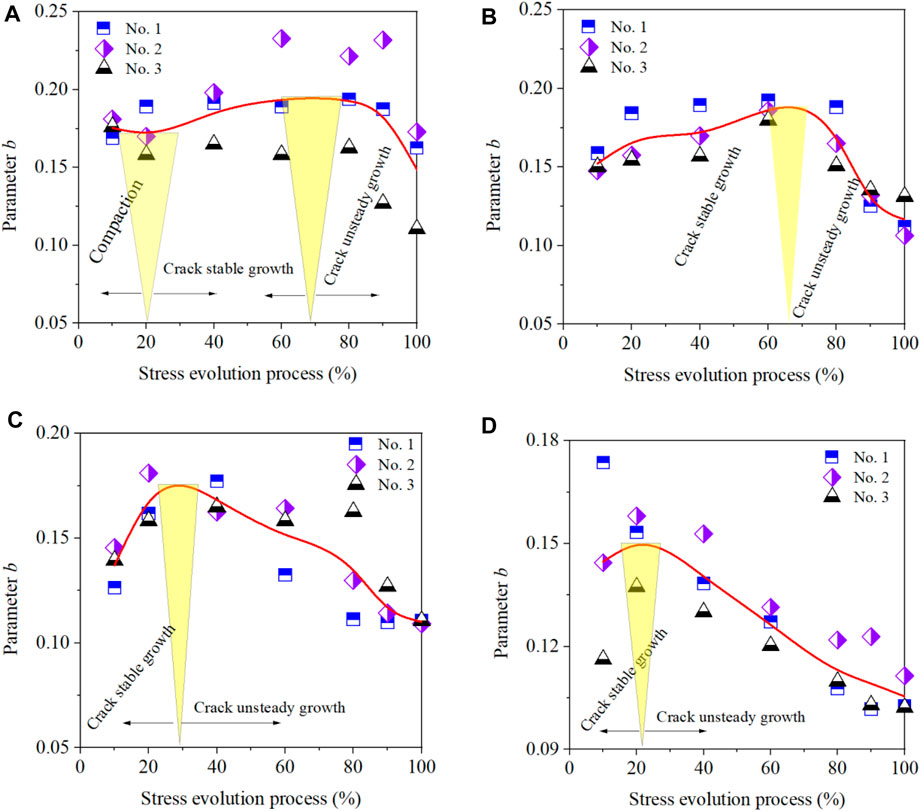
FIGURE 10. Evolution of acoustic emission b-value of sandstone under different loading rates. (A) 10−5 s−1. (B) 10−4 s−1. (C) 10−3 s−1. (D) 10−2 s−1.
It can be seen that from Figure 10, due to the influence of loading rates, the b-value showed a different trend with the evolution of stress. When the loading rate was 10−5 s−1, the evolution of b-value first went through a process of early decrease, indicating that the number of acoustic emission events with low amplitude had obvious advantages. When the stress was greater than 21%, b-value began to show a slow increase process, indicating that the initiation of micro cracks was still the main part in the process of specimen damage. When the stress reached 68%, b-value began to decrease, and the specimen entered the stages of small crack penetration and large crack propagation. The evolution processes of b-value under loading rate of 10−4, 10−3, and 10−2 s−1 were similar, but the stresses at the peak point of b-value were 66%, 29%, and 22% respectively. In addition, the range of b-value was significantly different under different loading rates, and on the whole, it decreased with the increase of loading rates, which means that acoustic emission activities with small amplitude were mainly dominated under low loading rate, while acoustic emission events with violent activity account for a larger proportion under high loading rates. It showed that with the increase of loading rates, the proportion of large cracks inside the specimen will increase in a short period of time, leading to a more serious degree of failure, thus presenting the fracture characteristics in Figure 4.
It is well known that the micro fracture morphology of rock is closely related to the macroscopic mechanical behavior. Therefore, to explore the fracture mechanism of sandstone affected by different strain rates from a microscopic perspective, scanning electron microscope was used to scan the representative area of thin sections selected from the fracture surfaces, aiming to retrieve the characteristics of micro cracks initiation and propagation by comparing the microscopic images of fracture surfaces.
Figure 11 gives the microscopic fracture morphology randomly selected from the fracture surface at different strain rates. It can be seen that at low strain rates, there were more intergranular cracks and more debris at the fracture surface, but with the increase of strain rate, there were more transgranular cracks and large mineral grains were destroyed. On the whole, with the increase of strain rates, the fracture morphology changed from smooth to rough, and the size of rock debris near the fracture was larger, showing a phenomenon of more intense damage characteristics. In Figure 11A, when the strain rate was 10−5 s−1, cracks mainly appeared on the cementation interface of mineral particles, mainly intergranular cracks, accompanied by a large number of debris generation. The micro fracture morphology was not smooth but generally regular. In Figure 11B, when the strain rate is 10−4 s−1, at the same time of the initiation of intergranular crack and the occurrence of intergranular dislocation, the transgranular crack phenomenon began to appear. In Figure 11C, when the strain rate was 10−3 s−1, the fracture morphology presented significantly different characteristics compared to the low strain rates, and the number of transgranular cracks increased significantly. Especially when the strain rate was 10−2 s−1 in Figure 11D, the fracture exhibits significant unflatness, the roughness increased, and the fracture morphology began to appear in the form of larger fragments.
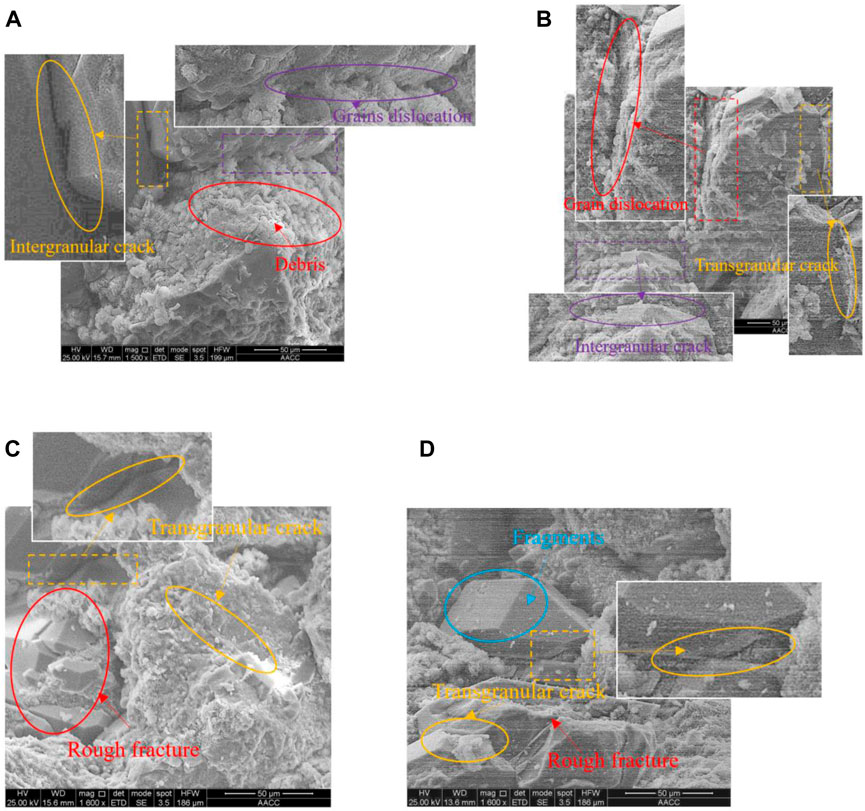
FIGURE 11. Microscopic fracture morphology at different strain rates. (A) 1 × 10⁻⁵ s−1. (B) 1 × 10⁻⁴ s−1. (C) 1 × 10⁻³ s−1. (D) 1 × 10⁻² s−1.
(1) On the whole, peak strength and elastic modulus increased by 5.73 MPa and 1.303 GPa with the increase of strain rate by ten times, and peak strain decreased by 0.096%. In addition, it can be seen that elastic modulus was more sensitive to strain rate, which increased by 90.24% and 58.16% compared with peak strain and peak strain, respectively.
(2) With the increase of strain rates, fractal dimension increased, but its increasing trend gradually slowed down. When the strain rate was from 1 × 10⁻⁵ to 1 × 10⁻⁴ s−1, fractal dimension increased was 9.66%, and fractal dimension increased were 7.32% and 3.77%, respectively for strain rate from 1 × 10⁻⁴ to 1 × 10⁻³ s−1 and from 1 × 10⁻³ to 1 × 10⁻² s−1.
(3) With the increase of strain rates, fracture morphology changed from smooth to rough showing a phenomenon of more intense damage characteristics. The number of transgranular cracks increased significantly, the fracture exhibited unflatness, the roughness increased, and the fracture morphology began to appear in the form of larger fragments.
(4) Acoustic emission b-value decreased with the increase of strain rates, which means that acoustic emission activities with low amplitude were mainly dominated under low strain rates, while violent acoustic emission activities accounted for a larger proportion under high strain rate. When the strain rate was 1 × 10⁻⁵ s−1, stress reached 68%, b-value began to decrease, and damage entered the stages of small cracks penetration and large cracks propagation. Evolution of b-value under 1 × 10⁻⁴, 1 × 10⁻³, and 1 × 10⁻² s−1 was similar, but stress corresponding to peak point of b-value were 66%, 29%, and 22% respectively.
The original contributions presented in the study are included in the article/Supplementary Material, further inquiries can be directed to the corresponding author.
Conceptualization, NL and QF; methodology, WY and QF; validation, GL and WS; writing, NL, SS, and WY; project administration, NL and YL. All authors contributed to the article and approved the submitted version.
This study was funded by the Youth Innovation Team Plan of Colleges and Universities in Shandong Province (Grant Number: 2022KJ112), China Postdoctoral Science Foundation (Grant Number: 2022M711969).
The authors declare that the research was conducted in the absence of any commercial or financial relationships that could be construed as a potential conflict of interest.
All claims expressed in this article are solely those of the authors and do not necessarily represent those of their affiliated organizations, or those of the publisher, the editors and the reviewers. Any product that may be evaluated in this article, or claim that may be made by its manufacturer, is not guaranteed or endorsed by the publisher.
Cao, A. Y., Jing, G. C., Ding, Y. L., and Liu, S. (2019). Mining-induced static and dynamic loading rate effect on rock damage and acoustic emission characteristic under uniaxial compression. Saf. Sci. 116, 86–96. doi:10.1016/j.ssci.2019.03.003
Carpinteri, A., Lacidogna, G., and Pugno, N. (2004). Scaling of energy dissipation in crushing and fragmentation: a fractal and statistical analysis based on particle size distribution. Int. J. Fract. 129 (2), 131–139. doi:10.1023/B:FRAC.0000045713.22994.f2
Dong, L. J., Zhang, L. Y., Liu, H. N., Du, K., and Liu, X. L. (2022). Acoustic emission b value characteristics of granite under true triaxial stress. Mathematics 10 (3), 451. doi:10.3390/math10030451
Dong, Y. S., Xi, B. P., He, S. X., and Chen, L. H. (2023). Experimental study on the effect of thermal shock on physical and mechanical properties of limestone. Appl. Sciences-Basel 13 (6), 3649. doi:10.3390/app13063649
Fairhurst, C. E., and Hudson, J. A. (1999). Draft ISRM suggested method for the complete stress strain curve for the intact rock in uniaxial compression. Int. J. Rock. Mech. Min. 36 (3), 279–289. doi:10.1016/S0148-9062(99)00006-6
Feng, P., Dai, F., Liu, Y., Xu, N. W., and Zhao, T. (2018). Effects of strain rate on the mechanical and fracturing behaviors of rock-like specimens containing two unparallel fissures under uniaxial compression. Soil Dyn. Earthq. Eng. 110, 195–211. doi:10.1016/j.soildyn.2018.03.026
Gutenberg, B., and Richter, C. F. (1944). Frequency of earthquakes in California. Bull. Seismol. Soc. Am. 34 (4), 185–188. doi:10.1785/bssa0340040185
Hasan, M., Shang, Y. J., Shao, P., Yi, X. T., and Meng, H. (2022). Evaluation of engineering rock mass quality via integration between geophysical and rock mechanical parameters. Rock Mech. Rock Eng. 55 (4), 2183–2203. doi:10.1007/s00603-021-02766-8
Hashiba, K., and Fukui, K. (2015). Index of loading-rate dependency of rock strength. Rock Mech. Rock Eng. 48 (2), 859–865. doi:10.1007/s00603-014-0597-6
Huang, W. P., Yuan, Q., Tan, Y. L., Wang, J., Liu, G. L., Qu, G. L., et al. (2018). An innovative support technology employing a concrete-filled steel tubular structure for a 1000-m-deep roadway in a high in situ stress field. Tunn. Undergr. Space Technol. 73, 26–36. doi:10.1016/j.tust.2017.11.007
Imani, M., Nejati, H. R., and Goshtasbi, K. (2017). Dynamic response and failure mechanism of Brazilian disk specimens at high strain rate. Soil Dyn. Earthq. Eng. 100, 261–269. doi:10.1016/j.soildyn.2017.06.007
Ji, M., and Guo, H. J. (2020). Influence of in-situ rock stress on the stability of roadway surrounding rock: a case study. J. Geophys. Eng. 17 (1), 138–147. doi:10.1093/jge/gxz097
Kang, J. Q., Zhu, J. B., and Jian, Z. (2019). A review of mechanisms of induced earthquakes: from a view of rock mechanics. Geomech. Geophys Geoenergy Georesour 5, 171–196. doi:10.1007/s40948-018-00102-z
Khadivi, B., Heidarpour, A., Zhang, Q. B., and Masoumi, H. (2023). Characterizing the cracking process of various rock types under Brazilian loading based on coupled Acoustic Emission and high-speed imaging techniques. Int. J. Rock Mech. Min. Sci. 168, 105417. doi:10.1016/j.ijrmms.2023.105417
Khurshid, M. N., Khan, A. H., Rehman, Z. U., and Chaudhary, T. S. (2022). The evaluation of rock mass characteristics against seepage for sustainable infrastructure development. Sustainability 14 (16), 10109. doi:10.3390/su141610109
Li, Y. L., Peng, J. M., Zhang, Y. L., and Yin, Q. L. (2023). Rock indentation characteristics induced by spherical button subjected to dynamic and quasi-static loads. Rock Mech. Rock Eng. 56 (7), 5253–5273. doi:10.1007/s00603-023-03339-7
Liang, C. Y., Wu, S. R., Li, X., and Xin, P. (2015). Effects of strain rate on fracture characteristics and mesoscopic failure mechanisms of granite. Int. J. Rock Mech. Min. Sci. 76, 146–154. doi:10.1016/j.ijrmms.2015.03.010
Lu, Z. G., Ju, W. J., Gao, F. Q., and Yi, K. (2022). Influence of loading rate on the failure characteristics of composite coal-rock specimens under quasi-static loading conditions. Rock Mech. Rock Eng. 55 (2), 909–921. doi:10.1007/s00603-021-02699-2
Lv, R. S., Xue, J., Zhang, Z., Ma, X. Y., Li, B., Zhu, Y. C., et al. (2022). Experimental study on permeability and stress sensitivity of different lithological surrounding rock combinations. Front. Earth Sci. 9, 762106. doi:10.3389/feart.2021.762106
Ma, D., Duan, H. Y., and Zhang, J. X. (2022a). Solid grain migration on hydraulic properties of fault rocks in underground mining tunnel: radial seepage experiments and verification of permeability prediction. Tunn. Undergr. Space Technol. 126, 104525. doi:10.1016/j.tust.2022.104525
Ma, D., Li, Q., Cai, K. C., Zhang, J. X., Li, Z. H., Hou, W. T., et al. (2023). Understanding water inrush hazard of weak geological structure in deep mine engineering: a seepage-induced erosion model considering tortuosity. J. Central South Univ. 30 (2), 517–529. doi:10.1007/s11771-023-5261-4
Mahanta, B., Tripathy, A., Vishal, V., Singh, T. N., and Ranjith, P. G. (2017). Effects of strain rate on fracture toughness and energy release rate of gas shales. Eng. Geol. 218, 39–49. doi:10.1016/j.enggeo.2016.12.008
McNamara, D., Carolan, D., Alveen, P., Murphy, N., and Ivankovic, A. (2016). Effect of loading rate on the fracture toughness and failure mechanisms of polycrystalline diamond (PCD). Int. J. Refract. metals hard Mater. 60, 1–10. doi:10.1016/j.ijrmhm.2016.06.011
Meng, Q. B., Zhang, M. W., Han, L. J., Pu, H., and Li, H. (2016). Effects of size and strain rate on the mechanical behaviors of rock specimens under uniaxial compression. Arab. J. Geosci. 9 (8), 527. doi:10.1007/s12517-016-2559-7
Parsons, T., Geist, E. L., and Carluccio, R. (2018). Characteristic earthquake magnitude frequency distributions on faults calculated from consensus data in California. J. Geophys. Research-Solid Earth 123 (12), 10761–10784. doi:10.1029/2018JB016539
Qiu, P. Q., Wang, J., Ning, J. G., Shi, X. S., and Hu, S. C. (2022). Experimental investigation on bolted rock mass under static-dynamic coupled loading. Geomechanics Eng. 29 (2), 99–111. doi:10.12989/gae.2022.29.2.099
Ranjith, P. G., Zhao, J., Ju, M. H., De Silva, R. V. S., Rathnaweera, T. D., and Bandara, A. K. M. S. (2017). Opportunities and challenges in deep mining: a brief review. Engineering 3 (4), 546–551. doi:10.1016/J.ENG.2017.04.024
Saeidi, F., Yahyaei, M., Powell, M., and Tavares, L. M. (2017). Investigating the effect of applied strain rate in a single breakage event. Min. Eng. 100, 211–222. doi:10.1016/j.mineng.2016.09.010
Sagasta, F., Zitto, M. E., Piotrkowski, R., Benavent-Climent, A., Suarez, E., and Gallego, A. (2018). Acoustic emission energy b-value for local damage evaluation in reinforced concrete structures subjected to seismic loadings. Mech. Syst. Signal Process. 102, 262–277. doi:10.1016/j.ymssp.2017.09.022
Su, G. S., Huang, J. H., Xu, H. J., and Qin, Y. Z. (2022). Extracting acoustic emission features that precede hard rock instability with unsupervised learning. Eng. Geol. 306, 106761. doi:10.1016/j.enggeo.2022.106761
Tang, Y., Zhang, H. L., Xu, J., Okubo, S. S., and Liu, X. R. (2021). Loading rate dependence of rock strength under triaxial compression. Front. Earth Sci. 9, 728366. doi:10.3389/feart.2021.728366
Thongprapha, T., Liapkrathok, P., Chanpen, S., and Fuenkajorn, K. (2020). Frictional behavior of sandstone fractures under forward-backward pre-peak cyclic loading. J. Struct. Geol. 138, 104106. doi:10.1016/j.jsg.2020.104106
Tie, J. H., Meng, W. Z., Wei, M. D., and Wu, W. (2023). Loading rate and mineralogical controls on tensile strength of rocks: a machine learning view. Rock Mech. Rock Eng. 56 (8), 6119–6125. doi:10.1007/s00603-023-03354-8
Turcotte, D. L. (1986). Fractals and fragmentation. J. Geophys. Research-solid Earth 91 (B2), 1921–1926. doi:10.1029/JB091iB02p01921
Wang, X., Wen, Z. J., Jiang, Y. J., and Huang, H. (2018). Experimental study on mechanical and acoustic emission characteristics of rock-like material under non-uniformly distributed loads. Rock Mech. Rock Eng. 15 (3), 729–745. doi:10.1007/s00603-017-1363-3
Wasantha, P. L. P., Ranjith, P. G., Zhao, J., Shao, S. S., and Permata, G. (2015). Strain rate effect on the mechanical behaviour of sandstones with different grain sizes. Rock Mech. Rock Eng. 48 (5), 1883–1895. doi:10.1007/s00603-014-0688-4
Xu, N. W., Li, T. B., Dai, F., Li, B., Zhu, Y. G., and Yang, D. S. (2015). Microseismic monitoring and stability evaluation for the large scale underground caverns at the Houziyan hydropower station in Southwest China. Eng. Geol. 188, 48–67. doi:10.1016/j.enggeo.2015.01.020
Yang, B. B., He, M. M., Wang, H. T., Zhang, Z. Q., Zhu, J. W., and Li, N. (2023). Experimental investigation on brittleness characteristics of rock based on the ubiquitiformal complexity: strain rate effect and size effect. Bull. Eng. Geol. Environ. 82 (8), 306. doi:10.1007/s10064-023-03327-9
Yang, J., Mu, Z. L., and Yang, S. Q. (2020). Experimental study of acoustic emission multi-parameter information characterizing rock crack development. Eng. Fract. Mech. 232, 107045. doi:10.1016/j.engfracmech.2020.107045
Yasin, Q., Du, Q. Z., Sohail, G. M., and Ismail, A. (2018). Fracturing index-based brittleness prediction from geophysical logging data: application to Longmaxi shale. Geomech. Geophys Geoenerg Georesour 4 (4), 301–325. doi:10.1007/s40948-018-0088-4
Yin, S., and Xie, R. C. (2019). Experimental analysis of dynamic and static mechanical properties of deep thick anhydrite cap rocks under high-stress conditions. Carbonates Evaporites 34 (3), 807–823. doi:10.1007/s13146-018-0450-1
Zhang, S. C., Li, Y. Y., Shen, B. T., Sun, X. Z., and Gao, L. Q. (2019). Effective evaluation of pressure relief drilling for reducing rock bursts and its application in underground coal mines. Int. J. Rock Mech. Min. Sci. 114, 7–16. doi:10.1016/j.ijrmms.2018.12.010
Zhao, K., Ma, H. L., Yang, C. H., and Daemen, J. J. K. (2022). The role of prior creep duration on the acoustic emission characteristics of rock salt under cyclic loading. Int. J. Rock Mech. Min. Sci. 157, 105166. doi:10.1016/j.ijrmms.2022.105166
Zhao, T. B., Guo, W. Y., Tan, Y. L., Lu, C. P., and Wang, C. W. (2018). Case histories of rock bursts under complicated geological conditions. Bull. Eng. Geol. Environ. 77 (4), 1529–1545. doi:10.1007/s10064-017-1014-7
Zhao, Z. L., Jing, H. W., Wu, J. Y., Shi, X. S., Gao, Y., and Yin, Q. (2020). Experimental investigation on damage characteristics and fracture behaviors of granite after high temperature exposure under different strain rates. Theor. Appl. Fract. Mech. 110, 102823. doi:10.1016/j.tafmec.2020.102823
Zhou, Z. L., Cai, X., Ma, D., Du, X. M., Chen, L., Wang, H. Q., et al. (2019). Water saturation effects on dynamic fracture behavior of sandstone. Int. J. Rock Mech. Min. Sci. 114, 46–61. doi:10.1016/j.ijrmms.2018.12.014
Zhu, Q. Q., Li, D. Y., Han, Z. Y., Li, X. B., and Zhou, Z. L. (2019). Mechanical properties and fracture evolution of sandstone specimens containing different inclusions under uniaxial compression. Int. J. Rock Mech. Min. Sci. 115, 33–47. doi:10.1016/j.ijrmms.2019.01.010
Keywords: loading rate, mechanical characteristic, fragmentation feature, acoustic emission, micro morphology
Citation: Li N, Feng Q, Yue W, Sun S, Li Y, Li G and Shi W (2023) Experimental study on mechanical and acoustic emission characteristics of sedimentary sandstone under different loading rates. Front. Earth Sci. 11:1224645. doi: 10.3389/feart.2023.1224645
Received: 18 May 2023; Accepted: 07 November 2023;
Published: 28 December 2023.
Edited by:
Beata Orlecka-Sikora, Polish Academy of Sciences, PolandReviewed by:
Dan Ma, China University of Mining and Technology, ChinaCopyright © 2023 Li, Feng, Yue, Sun, Li, Li and Shi. This is an open-access article distributed under the terms of the Creative Commons Attribution License (CC BY). The use, distribution or reproduction in other forums is permitted, provided the original author(s) and the copyright owner(s) are credited and that the original publication in this journal is cited, in accordance with accepted academic practice. No use, distribution or reproduction is permitted which does not comply with these terms.
*Correspondence: Weijia Yue, d2VpamlheXVlMDUzMUAxMjYuY29t
Disclaimer: All claims expressed in this article are solely those of the authors and do not necessarily represent those of their affiliated organizations, or those of the publisher, the editors and the reviewers. Any product that may be evaluated in this article or claim that may be made by its manufacturer is not guaranteed or endorsed by the publisher.
Research integrity at Frontiers
Learn more about the work of our research integrity team to safeguard the quality of each article we publish.