 Yuhao Guo
 Liqiang Sima1
 Liang Wang
- 1School of Geoscience and Technology, Southwest Petroleum University, Chengdu, China
- 2College of Energy, Chengdu University of Technology, Chengdu, Sichuan, China
- 3Southwest Measurement and Control Company of Sinopec Jingwei, Chengdu, Sichuan, China
- 4China Petroleum Qinghai Oilfield Exploration and Development Research Institute, Qinghai, China
Tight sandstone reservoirs are characterized by poor physical properties, strong heterogeneity, and complex pore structures, resulting in low reservoir saturation calculation accuracy, and the log interpretations do not match the gas test results. In response to the aforementioned problems, the tight sandstone reservoir of the third member of the Xujiahe Formation of the Dayi structure in the Western Sichuan Depression was investigated through a series of experiments on petrophysical properties, casting thin-section identification, rock resistivity, nuclear magnetic resonance, and high-pressure mercury intrusion. Then, after a systematic analysis of the influence of different factors, including physical properties, mineral composition, and pore structure, on the rock-electric parameters, the parameters of the Archie model were appropriately corrected. The results showed that, for tight sandstone reservoirs, the cementation exponent was mainly affected by the physical properties and clay content, and the saturation exponent was controlled by the proportion of relatively large pore components in the total pore system. Therefore, the non-linear least squares method was used to construct the variable cementation index model; the pseudo-capillary pressure curve was constructed, and a new parameter “the large-pore proportion,” which is used to optimize the saturation exponent, was proposed in combination with the fractal theory. Finally, an Archie model with variable parameters was used to process the actual logging data in the study area. The results show that this method can obtain more accurate gas saturation, providing a new idea and method for fine sandstone saturation logging evaluation.
1 Introduction
Tight sandstone gas reservoirs are globally considered important for exploring and exploiting unconventional gas reservoirs, and accurately evaluating the saturation of reservoirs is crucial in this process (Jia et al., 2012; Zou et al., 2015; Zhao et al., 2016; Jia et al., 2022). In 1942, Archie, an expert at the Shell Company, published Archie’s formula and proposed the first model for well logging to calculate the saturation of oil and gas in reservoirs (Archie G E, 1942). However, with the progressive deepening of exploration and exploitation, scholars have found that Archie’s formula has poor applicability to unconventional reservoirs, as indicated by the mismatch between the log interpretation of the saturation and gas test results. The following are the causes of this situation: compared with conventional sandstone reservoirs, tight sandstone reservoirs are characterized by poor physical properties, strong heterogeneity, diverse pore types, complex pore structure, etc., complicating the conductivity law of core and making the rock–electric relationship “non-Archie” (Sun, 2007; Li et al., 2015; Yan et al., 2015). To enhance the accuracy of calculating tight sandstone reservoir saturation, many scholars have conducted research that can be broadly categorized into the following two methods. First, a series of new saturation model based on the complex conductance mechanism of tight sandstone have been established (Zhang et al., 2010; Zhang et al., 2011; Tang et al., 2016; Hu et al., 2017). The second tunes the rock electric parameters of Archie’s formula to improve its applicability to tight sandstone reservoir evaluations. In comparison, creating a new saturation model is more complicated, with many parameters to be determined, several of which are difficult to determine in practical applications, thereby challenging its applicability. Therefore, the Archie model with optimized parameters remains widely used in the evaluation of tight sandstone reservoir saturation (Xia et al., 2020).
The Upper Triassic Xujiahe Formation in Sichuan Basin is a key stratum for tight sandstone gas exploration and exploitation in China. For a long time, the Xu 2, 4, and 6 members have been the main focus, while the Xu 1, 3, and 5 members, as source rocks, have received less attention (Zhang and Yang, 2022). Recent studies have shown that the gas reservoir fullness of the Xu 2, 4, and 6 members is low, and gas-bearing abundance only increases in the structurally high part (Zhao et al., 2011; Bian et al., 2012). In contrast, the source rock strata in the Xu 1, 3, and 5 members are developed with continuously distributed thick massive sandstone, with a sufficient gas supply for its coexistence with the source rock, which likely forms under suitable conditions, leading to their high exploration potential (Qin et al., 2007; Fan et al., 2018; Fu et al., 2020).
Taking tight sandstone reservoirs of the third Member of the Xujiahe Formation as the research object, the conductivity law of tight sandstone was systematically analyzed through petrophysical properties, cast thin section identification, nuclear magnetism, rock resistivity, and high-pressure mercury intrusion. A saturation model with variable rock electric parameters was constructed based on the analysis to improve the accuracy of tight sandstone saturation logging evaluation.
2 Methodology
2.1 Geological setting
Geographically, the Sichuan Basin, located in Southwest China with an area of approximately 260,000 km2 is composed of a low and gentle uplift, a southern folded area, a highly folded southeast area, and a western depression area (Figures 1A, B), which is situated southwest of the West Sichuan Depression. The regional structure is the frontal hidden structural belt within the Longmenshan thrust belt in western Sichuan, adjacent to the Chengdu Depression in the southeast, the Wuzhongshan structural belt in the northwest, the Yazihe structure in the north obliquely, and the Qiongxi structure in the south (Figure 1C). The Dayi structure is a northwest-dipping monocline with traps controlled by local structures, faults, and trough faults as the main developed faults (Chen et al., 2013; Liu et al., 2014; Chen et al., 2016). Based on regional geological data, the Dayi structure of the Xujiahe Formation is a mega-thick continental coal-bearing clastic rock series, deposited in the Xu 2, 3, 4, and 5 members from the bottom up (Figure 1D); the sandstone reservoir of the Xu 3 member is one of the main gas-producing reservoirs.
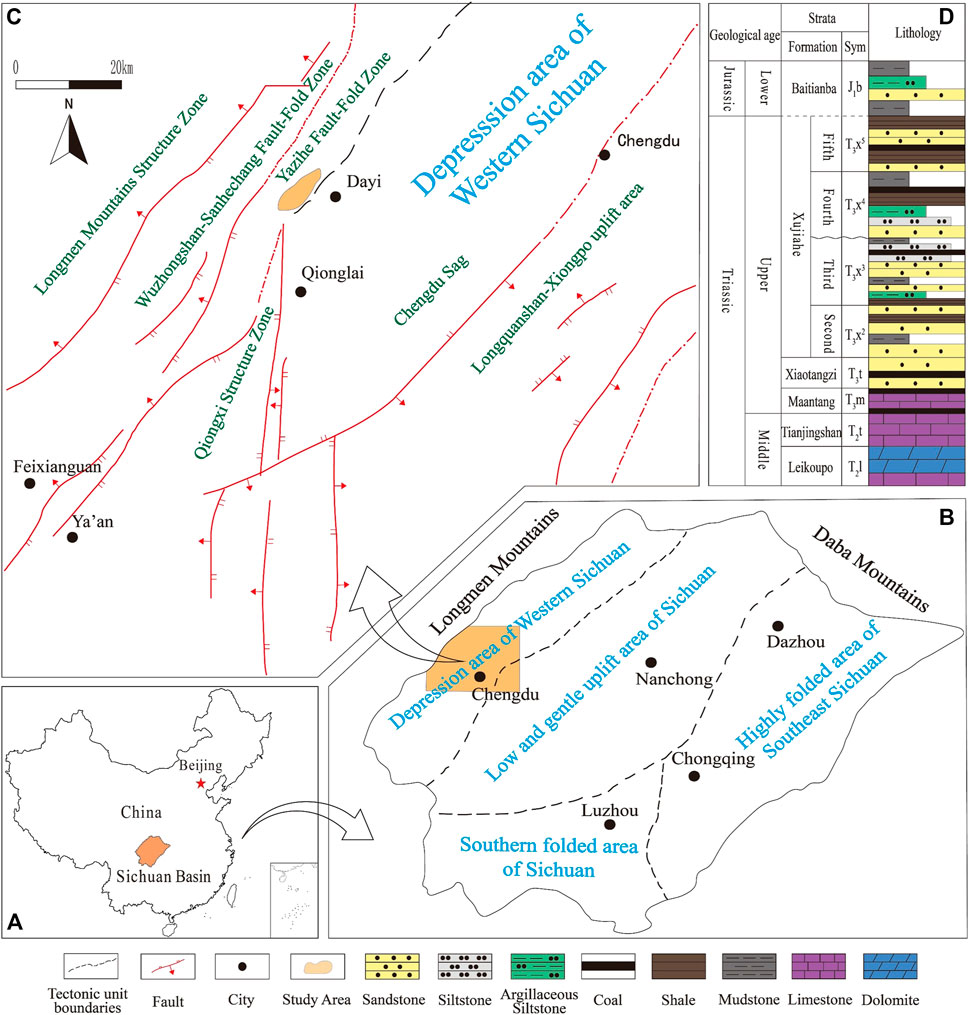
FIGURE 1. (A) Location of the Sichuan Basin in China. (B) Location of the Depression area of Western Sichuan in Sichuan Basin. (C) Location of Dayi structure in Depression area of Western Sichuan. (D) The stratigraphic division of Xujiahe Formation sequence (modified by Yang et al., 2021).
Research has indicated that the tight sandstone in the Xu 3 Member underwent three stages of evolution. In the early diagenetic stage, because of the large burial depth, the porosity decreased significantly under compaction, and the primary porosity decreased from 30% to nearly 10%. In the middle diagenetic stage, the Anxian orogenic movement provided abundant carbonate cement for the Xujiahe Formation, leading to a further decrease in porosity, and tight reservoirs exhibited ultralow porosity, which dropped below 2%. In the late diagenetic period, the porosity of tight reservoirs increased under dissolution, but was still below 5% (Zhang, 2009; Luo, 2015; Liu et al., 2018; Liu et al., 2020).
2.2 Samples and experimental measurements
2.2.1 Sample source
The experimental cores were obtained from tight sandstone reservoirs in the study area. While collecting core samples, considering the length of the cores and the planar distribution of the core wells, 25 cores were drilled from five wells to ensure that the cores represented the characteristics of the block.
2.2.2 Experimental methods
To ensure the comparability of measurements between different experiments, each core sample was cut into plugs and chips, and the designed experimental procedure was strictly followed. The chips were grounded into powder for X-ray diffraction analysis, parts of the plugs were cut for casting thin section identification and the remaining plunger samples were used for petrophysical properties, nuclear magnetic resonance (NMR), rock resistivity, and high-pressure mercury intrusion (HPMI) experiments. The experiments were conducted in the following steps. (1) Before the experiment, both sides of the core samples were polished and cleaned to remove remnants of the reservoir fluids or drilling mud inside the sample. (2) The core was dried at 100°C until the quality of core samples remained stable, and the helium porosity and permeability were tested after cooling. (3) The core was placed in a vacuum dryer and vacuumized for 8 h under a vacuum of 133.3 Pa. Then, distilled water was added to the dryer, and external pressure was applied to the core and distilled water to fully saturate the core. (4) Fully water-saturated NMR T2 spectra and porosities were obtained from core NMR experiments. A centrifuge was used to displace the mobile water in the core, and NMR measurements were performed again to obtain the centrifuge T2 spectrum and porosity of the bound fluids. (5) After the NMR experiment, the core was dried again, and then vacuum and pressurization of a saturated formation water solution were performed to conduct the desaturated rock–electric experiment. (6) Finally, ten cores were screened for high-pressure mercury intrusion experiments.
3 Results
3.1 Petrophysical parameters of core sample
The results of the core physical property experiments indicated that the reservoir in the study area was highly dense, and the values of core porosity and permeability were small (Table 1). The porosity is between 2% and 4%, with an average value of 3.16%; permeability ranges from 0.01 × 10⁻³ to 0.1 × 10⁻³ μm2, with an average value of 0.0235 × 10⁻³ μm2. Porosity and permeability are positively correlated. With similar porosity values, the relative difference in permeability values was significant, implying strong heterogeneity of the reservoir pore structure (Figure 2).
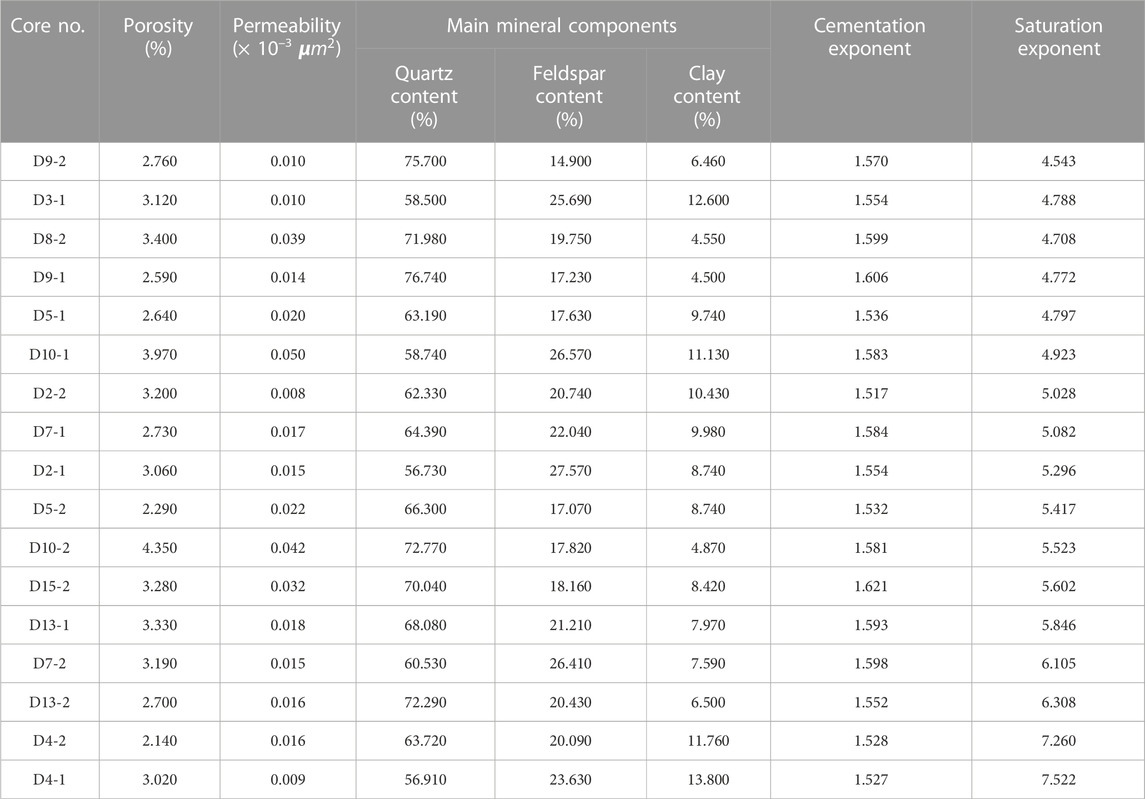
TABLE 1. Petrophysical properties of core plug and their corresponding lithological components of chips.
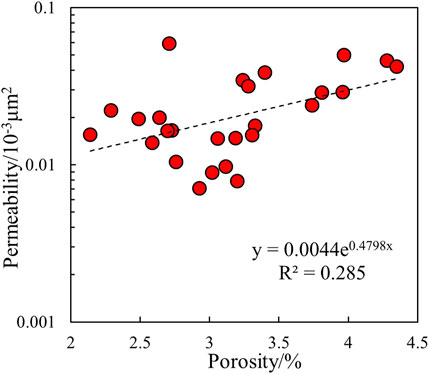
FIGURE 2. Cross-plots of porosity vs. permeability for all core samples.
3.2 Mineral components X-ray obtained from diffraction analysis
Whole-rock X-ray diffraction analysis of the core revealed that the mineral composition of the reservoir cores was mainly quartz (average value: 66.4%), followed by feldspar (average value: 20.77%) and clay minerals (average value: 8.24%), with minor amounts of dolomite and calcite (Table 1).
3.3 Pore structure parameters of core samples derived from HPMI and water-saturated NMR experiments
The HPMI curves of the ten core samples with different porosities and permeability are shown in Figure 3A. The mercury intrusion curves indicate that the maximum mercury intrusion saturations for all core samples are less than 65%, that is, mercury cannot enter most of the pore systems when the injection pressure reaches 200 MPa. Moreover, the maximum relaxation time of the saturated T2 spectrum exceeds 20,000 ms and presented a bimodal distribution, indicating strong core heterogeneity (Figure 3B).
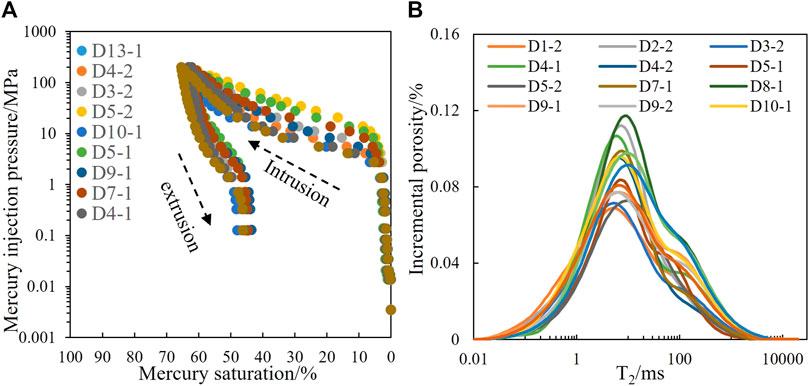
FIGURE 3. (A) Characteristics of HPMI curves and (B) water-saturated NMR T2 spectra of core samples.
Based on the HPMI curves and NMR T2 spectra aforementioned displayed, quantitative pore structure parameters, such as maximum pore radius (Ra), average pore radius (Rp), median pore radius (R50), structure coefficient (Ф), relative sorting coefficient (D), characteristic structural parameters (C), homogeneity coefficient (ɑ), maximum mercury intrusion saturations (Shgmax), displacement pressure (Pd), median pressure (P50), and saturated T2 mean value (T2LM), are calculated and shown in Table 2. The data show that the average pore radius of the reservoir core was between 22 and 96 nm, and the displacement pressure mainly ranged from 1.354 to 8.263 MPa. The maximum throat radius of the corresponding core was between 89 and 543 nm, indicating that the reservoirs of the Xu 3 Member in the study area were developed with nanoscale pore throats with a large difference in size.
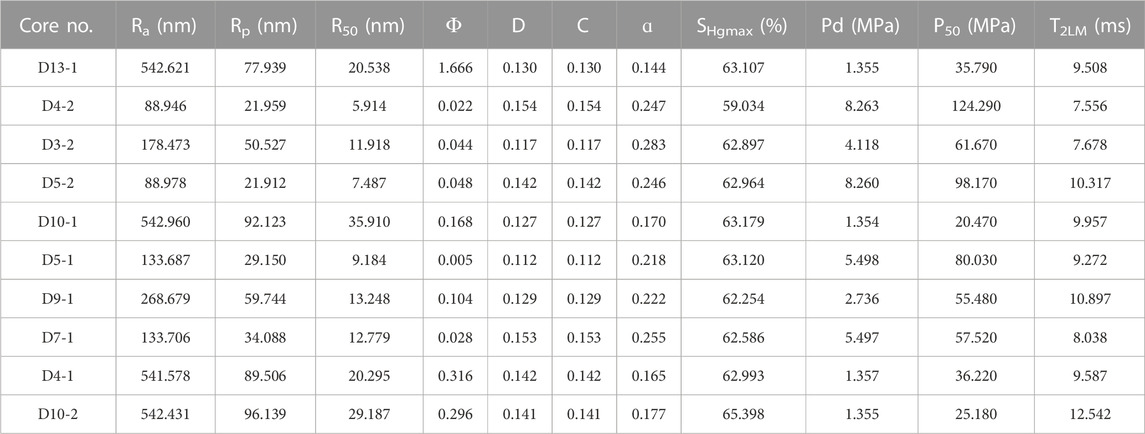
TABLE 2. Pore structure parameters of the core samples derived from the HPMI test and the NMR experiment.
3.4 Rock–electric parameters obtained from rock resistivity experiment
Twenty-five cores from the Xu 3 Member in the study area were selected as experimental samples, with porosity ranging from 2.298% to 4.153% and permeability ranging from 0.0071 × 10⁻³ to 0.0591 × 10⁻³
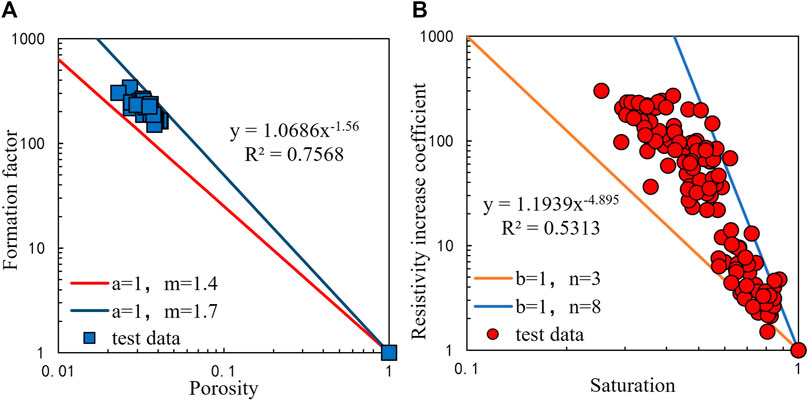
FIGURE 4. Results of rock resistivity experiment. (A) Cross-plots of porosity vs. formation factor and (B) Cross-plots of saturation vs. resistivity increase coefficient.
4 Discussion
By applying Archie’s formula to tight sandstone reservoirs, the parameters in the model must be collected, provided that a systematic and in-depth analysis of the response law of rock resistivity is conducted. Therefore, based on rock–electric experimental data analysis combined with petrophysical property analysis, casting thin section identification, and HPMI experiments, the influences of physical properties, mineral composition, and pore structure on the resistivity law of the core were analyzed.
4.1 Influence of mineral components on rock–electrical parameters
Although the absolute contents of both quartz and feldspar have no significant correlation with the rock–electrical parameters (Figures 5A, B), the clay content has a good negative correlation with the cementation exponent (Figure 5C), that is, the higher the clay content, the smaller the value of m. The analysis suggests that owing to the adsorption of clay minerals on water, a water film is easily formed on the surface of the particles, increasing the conductivity of the core and reducing the value of the formation factor. This results in a decrease in the fitted m value. Figure 5D shows that there was no significant correlation between the clay content and the saturation exponent.
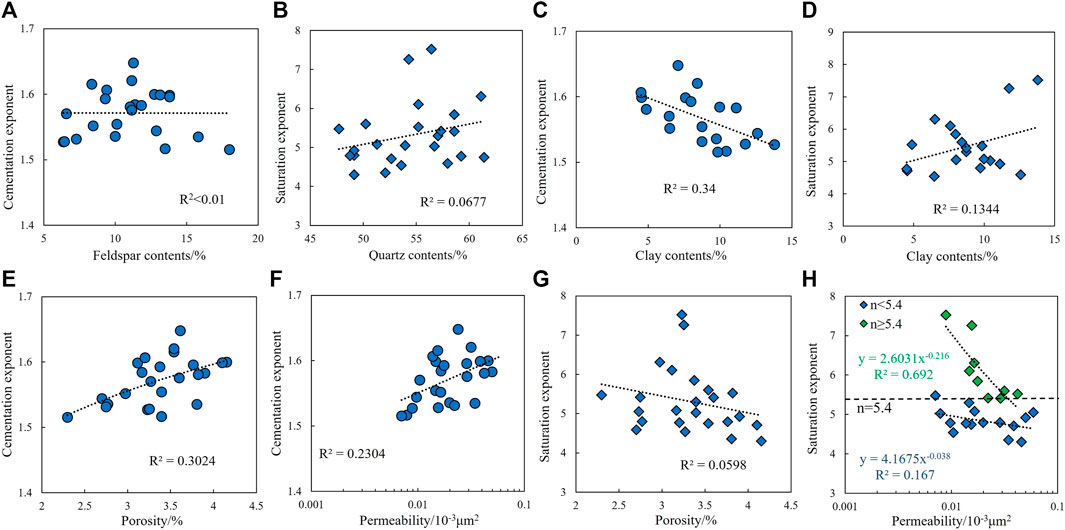
FIGURE 5. (A) Cross-plots of feldspar content vs. cementation exponent. (B) Cross-plots of quartz contents vs. saturation exponent. (C) Cross-plots of clay contents vs. cementation exponent. (D) Cross-plots of clay contents vs. saturation exponent. (E) Cross-plots of porosity vs. cementation exponent. (F) Cross-plots of permeability vs. cementation exponent. (G) Cross-plots of porosity vs. saturation exponent. (H) Cross-plots of permeability vs. saturation exponent.
4.2 Influence of physical properties on rock–electrical parameters
The cross-plot of the cementation exponent and physical property parameters shows that the value of m increases with an increase in porosity and permeability and is more correlated with porosity, indicating that the cementation index is more affected by porosity (Figures 5E, F). Similarly, the cross-plot of the saturation exponent and physical parameters indicated that the saturation exponent was negatively correlated with the porosity and permeability (Figures 5G, H). Further analysis revealed that the fitting trend between the saturation exponent and permeability exhibited two patterns. (1) When n > 5.4, n decreases rapidly with increasing permeability and (2) when n < 5.4, n decreases slowly with increasing permeability. In theory, the saturation exponent reflects the degree of uniformity of the fluid distribution in the core; the larger the n value, the more uneven the fluid distribution. The relationship between the saturation index and permeability reveals that, in an extremely complex fluid distribution, if there are preferential seepage channels, the fluid is distributed quickly and evenly, whereas when the fluid distribution is uniform, the change in permeability has no obvious effect (Gao, 2012; Cong and Hu, 2016; Zhang et al., 2017).
4.3 Influence of pore structure on rock–electrical parameters
The pore structure of the cores can be characterized quantitatively by HPMI experiments, but with limited pressure in the laboratory mercury intrusion apparatus, it is difficult to inject mercury into every pore of the cores; therefore, the capillary pressure curve cannot reflect the total pore system (Yakov V and Win L S, 2001; Liu et al., 2008; Li et al., 2015). However, the NMR experiment can measure the attenuation signal of all hydrogen nuclei of water-saturated core pores; therefore, the pore structure of tight sandstone cores was evaluated using pseudo-capillary pressure curves constructed through NMR (Figure 6A). Yudan et al. (2005) suggested that the relationship between the capillary pressure (Pc) and relaxation time (T2) can be expressed as follows (He et al., 2005):
where σ represents the fluid interface tension, θ is the wetting contact angle, ρ2 is the transverse surface relaxation time, and Fs is a geometry factor. The value of Fs was 2 for the cylindrical throat and 3 for the spherical throat. After non-linear interpolation of the T2 spectrum, the relationship between the capillary pressure and pore radius (Rc) was fitted, and the results showed that a piecewise fitting relationship exists between the two variables, implying that the pore system can be divided into two parts (Figure 6B).
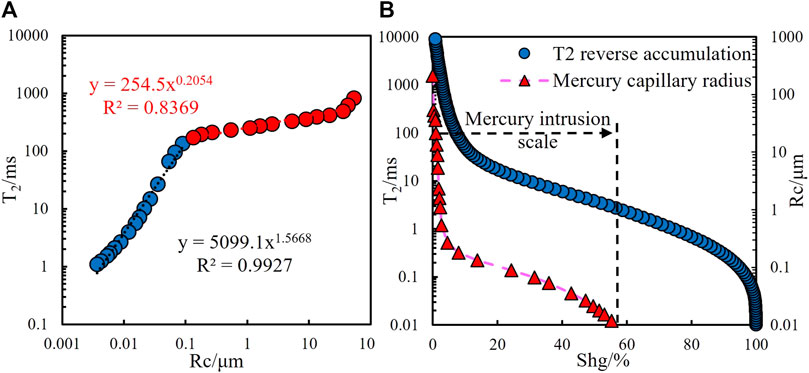
FIGURE 6. (A) Cross-plot of Rc vs. T2 and (B) difference in measurement scales between NMR and mercury intrusion experiments.
Finally, the characteristic pore structure parameters of the cores in the study area were extracted based on the construction of a pseudo-capillary pressure curve (Table 3).
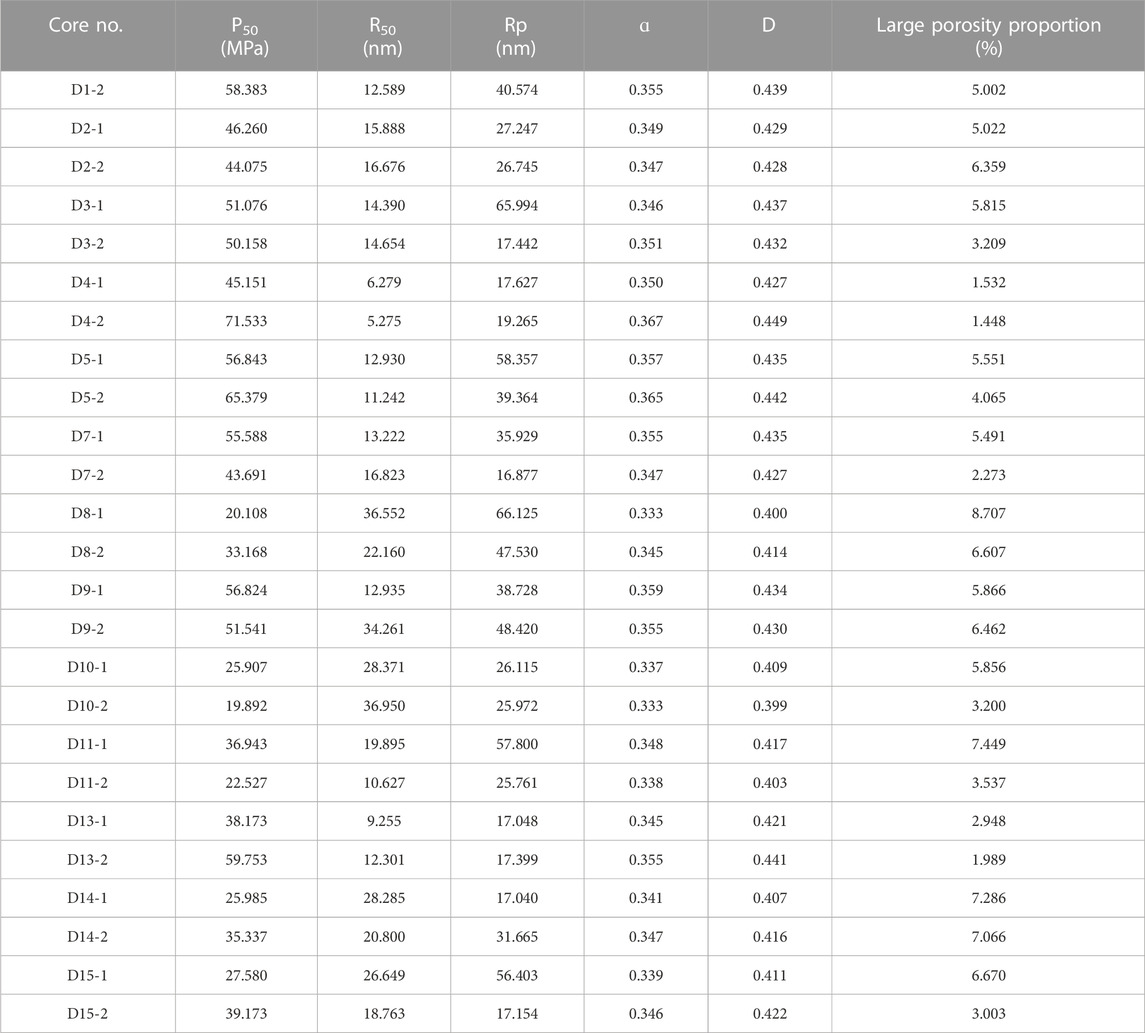
TABLE 3. Pore structure parameters derived from the pseudo-capillary curve and their corresponding large porosity proportion.
The cross-plot of the cementation exponent and mercury intrusion characteristic parameters shows that, overall, the cementation exponent decreases with the increase of the relative sorting and homogenization coefficients, indicating that the stronger the throat homogeneity, the smaller the value of m (Figures 7A, B). The cross-plot of saturation exponent and mercury injection characteristic parameters shows that, in the overall trend, the saturation exponent has a strong negative correlation with the median radius and the average radius, suggesting that the larger the radius of the pore and throat, the more uniform the fluid saturation distribution (Figures 7C, D). The correlation analysis between the rock–electrical parameters and mercury intrusion characteristic parameters also showed that, compared with the cementation exponent, the correlation coefficient between the saturation exponent and mercury intrusion characteristic parameters was greater, indicating that the saturation exponent was more influenced by the pore structure.
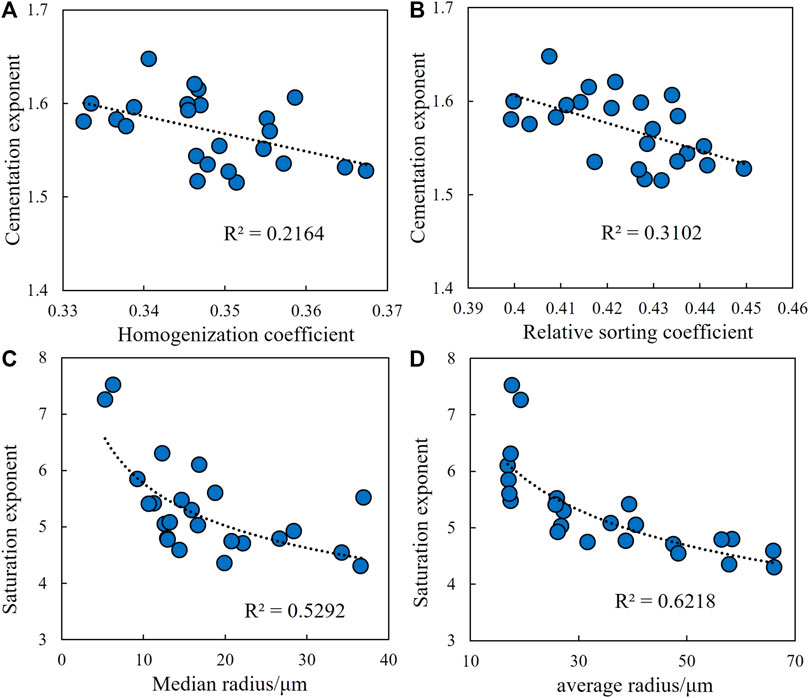
FIGURE 7. Relationship between pore structure parameters and rock–electrical parameters. (A) Cross-plots of homogenization coefficient vs. cementation exponent. (B) Cross-plots of relative sorting coefficient vs. cementation exponent. (C) Cross-plots of median radius vs. saturation exponent. (D) Cross-plots of average radius vs. saturation exponent.
A diagram of the saturation exponent and pseudo-capillary pressure curve characteristic parameters revealed that the index was controlled by the core–pore structure. Therefore, the influence of the pore structure on the index was further analyzed by combining it with the data from casting thin section identification, physical property analysis, and NMR experiments.
Four cores (D4-1, D7-1, D9-1, and D9-2) with similar porosities and different saturation exponents were selected for comparative analysis of the water-saturated NMR T2 spectrum (Figure 8A).The saturation exponent is related to the signal amplitude at 100 ms of the T2 spectrum, and the larger the signal amplitude at 100 ms, the smaller the value of n (Figure 8B), and a comparison of the casting thin sections from the four cores shows that, in general, the larger the maximum pore size and main pore size distribution interval, the smaller the saturation exponent (Figure 9). Therefore, in tight sandstone reservoirs, the saturation exponent is controlled by the pore structure, particularly by the development of large-size reservoir pores, that is, the more developed the large-size pores, the more uniform the core fluid saturation distribution and the smaller the saturation exponent. To describe the development of large-sized pores, the fractal dimension theory of pore throats was used to quantitatively evaluate the pore structure.
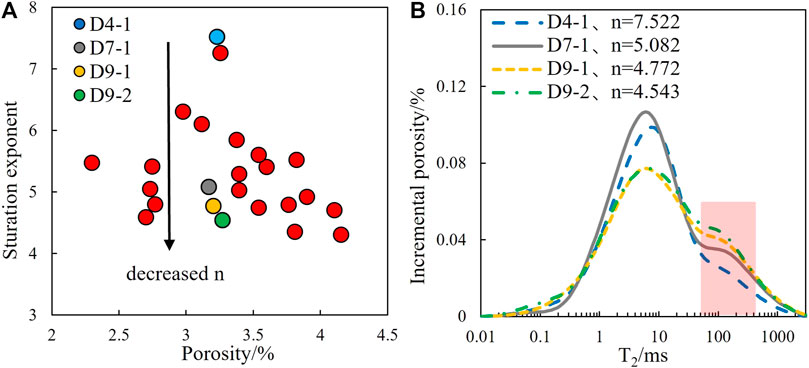
FIGURE 8. When the porosity is similar, the value of n decreases with the proportion of large pores increase. (A) Cross-plots of porosity vs. saturation exponent and (B) water-saturated NMR T2 spectra of selected four cores.
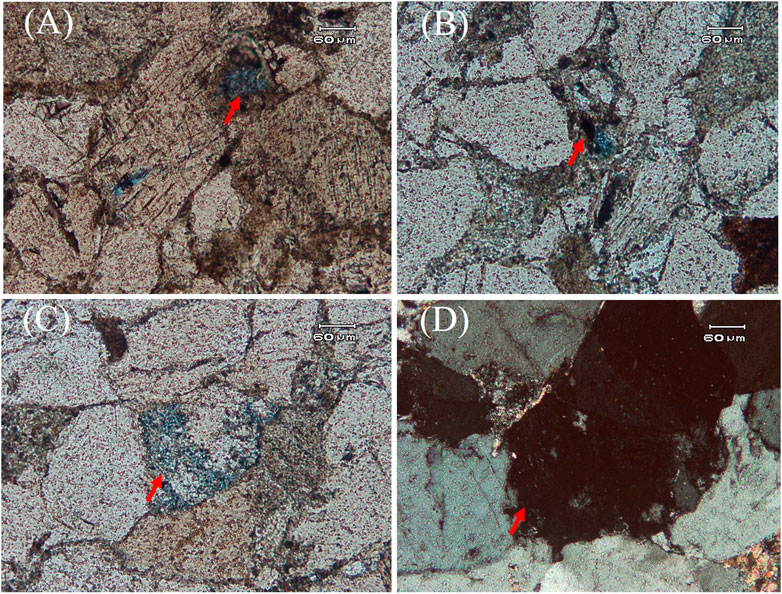
FIGURE 9. Casting thin section identification of cores with different saturation exponents. (A) Well-DY102, 4 585.605 m, fine lithic sandstone, maximum pore size is 0.2 mm, main pore size ranges from 0.05 to 0.1 mm. (B) Well-DY1, 4 590.375 m, feldspar lithic sandstone, maximum pore size is 0.1 mm, main pore size ranges from 0.01 to 0.05 mm. (C) Well-DY102, 4 597.865 m, medium lithic sandstone, maximum pore size is 0.26 mm, main pore size ranges from 0.02 to 0.21 mm. (D) Well-DY7, 4 597.875 m, medium feldspar lithic sandstone, maximum pore size is 0.38 mm, main pore size ranges from 0.02 to 0.22 mm.
4.3.1 Determination of fractal dimension by high-pressure mercury injection experiment
The fractal theory is used to study the internal structure of an object based on self-similarity (Xie et al., 2010; Huang et al., 2018; Xia et al., 2018). Numerous studies have shown that the pore structure of tight sandstone has fractal features, and the complexity and heterogeneity of the pore structure can be characterized by the fractal dimension. In general, D in the fractal dimension is distributed between 2 and 3; the closer it is to 2, the smoother the pore surface and the more regular the pore throat structure.
Typically, the fractal dimension of a pore structure is obtained through HPMI experiments in the laboratory. According to the capillary model and the fractal geometry theory, the fractal dimension of a pore with a radius larger than r (a specific value) can be represented by the following function:
where rmax is the maximum pore–throat radius in (µ)m and D is the fractal dimension.
Taking both sides of Eq. 2, we obtain
Eq. 3 shows that fractal dimension D can be calculated using the relationship between log [1−SHg (≥r)] and log r.
Figure 10 shows the fitting results for the two reservoir cores in the study area obtained using Eq. 3. The relationship between
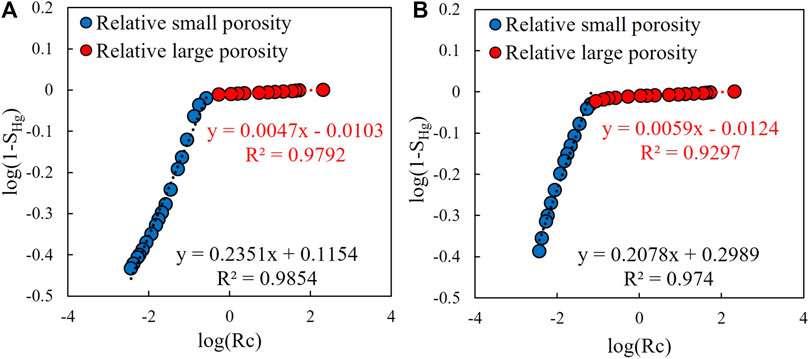
FIGURE 10. Fractal dimension fitting diagram of capillary mercury intrusion curves of core samples. (A) Cross-plot of log(Rc) vs. log(1−SHg) of D2-2 and (B) cross-plot of log(Rc) vs. log(1−SHg) of D3-2.
4.3.2 Determination of the proportion of large pores and optimization of the saturation exponent
Based on the relationship between permeability, relatively large pores, and saturation exponent, the development of large pores is shown to lead to a more uniform fluid distribution and a decrease in the saturation index. Thus, a relatively large pore size is a crucial factor affecting the saturation coefficient. To describe the development of large pores, the concept of large-pore proportion was introduced and defined as the ratio of large-pore components to the total pore system, denoted as p.
The steps to determine the proportion of large pores in the lab are as follows: (1) determine the threshold pore radius of relatively large and small pores by the two-segment structure of capillary pressure curves; (2) calculate the ratio of large-pore components to the total pore system and construct the pseudo-capillary pressure curve with the water-saturated NMR T2 spectrum; and (3) convert the threshold pore radius of relatively large and small pores into corresponding T2 values, denoted as T2_C, based on the fitting relationship between pore radius and T2 distribution. Subsequently, the peak envelope area larger than T2_C in the T2 spectrum was divided by the entire spectrum envelope area, and a large pore proportion was obtained. In processing the actual well data, because no NMR logging data were collected in the study area, a calculation model of the large-pore proportion was indirectly constructed using the permeability scale (Figure 11A)
where P represents the proportion of large pores in % and Perm is permeability in 10–3 μm2.
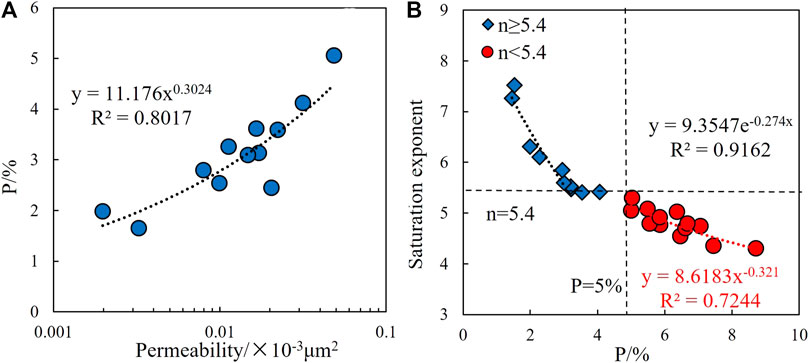
FIGURE 11. (A) Cross-plot of permeability vs. large porosity proportion and (B) cross-plot of large porosity proportion vs. saturation exponent.
The cross-plot of the large-pore proportion and the saturation exponent shows that the proportion is negatively correlated with the index, that is, the saturation exponent decreases as the proportion increases (Figure 11B). With n = 5.4 and p = 5% as limits, the fitting trends of the proportion and index can be roughly divided into two segments: when the proportion is less than 5%, the index was high, indicating that the cores contain mainly small pores, and the fluid saturation distribution is highly uneven. However, the distribution became rapid even with a slight increase in the number of large pores. When the proportion was greater than 5%, the saturation index was small, indicating that large pores developed well in the cores, resulting in a uniform fluid saturation distribution. However, with an increase in the proportion, the index decreased slowly, suggesting that the distribution did not change significantly.
5 Archie parameter model and application
5.1 Fixed rock–electrical parameters
Based on the basic theory of the Archie model, the relationships between porosity and formation factors as well as water saturation and electrical resistivity increase coefficients were fitted, and the fixed rock–electrical parameter values were obtained as a1=1.0686, b1=1.1939, m1=1.56, and n1=4.895.
5.2 Variable cementation index model
An analysis of the factors influencing the cementation exponent showed that m was controlled by the porosity and clay content. Therefore, the porosity and clay content were selected as independent variables, and linear multiple regression was used to construct the variable cementation index calculation model with a correlation coefficient R2 of 0.7591. The variable cementation exponent is denoted as m2, and the calculation model is as follows:
where m2 is the variable cementation exponent and Vclay is the clay content in percentage.
5.3 Variable saturation exponent model
Previous studies have shown that the saturation exponent is primarily controlled by the proportion of large pores in the core relative to the total pore system. The distribution of the core fluid saturation presented different rules, with a threshold proportion of large pores of 5%. Hence, the proportion-dependent variable saturation index model was constructed and denoted as n2. The calculation model was
5.4 Applications
Based on Archie’s model with variable parameters, the reservoir saturation of the Xu 3 Member in Well X of the Dayi structure in the West Sichuan Depression was quantitatively evaluated. The green curve in the nine sections (Sw1) represents the saturation calculation results for the fixed rock electrical parameters, and the red curve represents the saturation calculation results for the variable Archie parameter model (Sw2).
Analysis of the comprehensive evaluation result map of the well logging data obtained from 4750 to 4775 m of this well suggests that this interval is an industrial gas reservoir, as determined by the gas testing results. The conventional logging curve shows that the natural gamma rays in the perforated interval are low, the well diameter is relatively stable, and the spontaneous potential curve presents an overall negative anomaly, indicating the good permeability of this interval. All three porosity curves show that the values of acoustics and neutrons increase, whereas the density value decreases, and the deep and shallow lateral resistivity has a slight positive difference. A comparison of the saturation calculation results in the perforated interval suggests that (1) the calculated water saturation from the fixed rock-electric parameter model is large and overlaps the bound water saturation, indicating that there is a large amount of mobile water, and the calculation is inconsistent with the gas testing result and (2) the calculated water saturation from the variable Archie’s model ranges from 40% to 70%, which is consistent with the bound water saturation. The overlapping results indicate the presence of gas in the interval, which is consistent with the gas test results (Figure 12A).
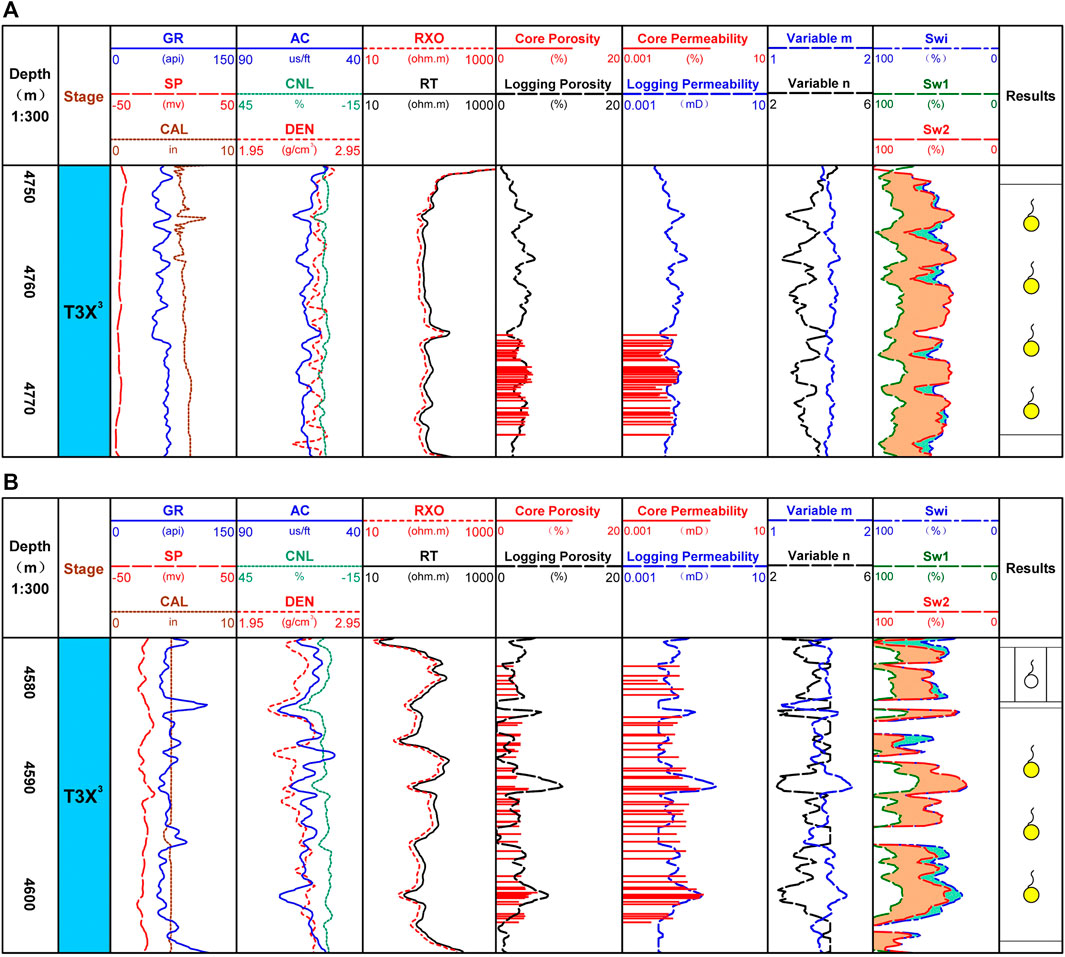
FIGURE 12. Comprehensive logging interpretation of wells of the Dayi structure. (A) Logging interpretation at 4 750 m–4 775 m and (B) logging interpretation at 4 580 m–4 605 m.
Based on the analysis of the comprehensive evaluation result map of well-logging data obtained from 4580 to 4605 m in this well, the calculated bound water saturation from the fixed rock–electric parameter model overlaps with the water saturation in the interval, indicating a large amount of mobile water, which is inconsistent with the gas testing result. However, the water saturation calculated from Archie’s model was similar to the bound water saturation, which was consistent with the gas testing results, further proving the effectiveness of Archie’s model with variable parameters in the application (Figure 12B).
6 Conclusion
The reservoir lithology of the Xu 3 Member in the West Sichuan Depression is dominated by the feldspar lithic sandstone, followed by lithic sandstone. The average porosity and permeability are 3.16% and 0.0235 × 10⁻³
The conductivity law of tight sandstone reservoirs in the study area shows that the cementation exponent is controlled by porosity and clay content, and the main factor affecting the saturation exponent is the ratio of the large-pore components to the total pore system. In this study, the fractal dimension was used, and through formula derivation, an obvious boundary was observed between the fractal dimensions of relatively large and small pores in tight sandstone. Therefore, the “large-pore proportion” concept is proposed, and the segmentation calculation model of saturation index is established.
Applying the saturation calculation model with variable Archie parameters to the actual well data processing in the study area shows that the calculation accuracy of tight sandstone reservoir saturation can be effectively improved, and the logging interpretation is made more consistent with the gas testing results.
Data availability statement
The original contributions presented in the study are included in the article/Supplementary material; further inquiries can be directed to the corresponding author.
Author contributions
All authors listed have made a substantial, direct, and intellectual contribution to the work and approved it for publication.
Conflict of interest
XM was employed by Southwest Measurement and Control Company of Sinopec Jingwei.
The remaining authors declare that the research was conducted in the absence of any commercial or financial relationships that could be construed as a potential conflict of interest.
Publisher’s note
All claims expressed in this article are solely those of the authors and do not necessarily represent those of their affiliated organizations, or those of the publisher, the editors, and the reviewers. Any product that may be evaluated in this article, or claim that may be made by its manufacturer, is not guaranteed or endorsed by the publisher.
References
Archie, G. E. (1942). The electrical resistivity log as an aid in determining some reservoir characteristics. Trans. AIME 146, 54–62. doi:10.2118/942054-g
Bian, C., Wang, H., Wang, C., et al. (2012). Exploration status and resource potential evaluation of tight sandstone gas reservoirs in the Sichuan Basin. Petroleum Eng. Sci. 7, 74–80. doi:10.3969/j.issn.1009-1742.2012.07.011
Chen, Y., Hu, Y., Wang, Y., et al. (2016). Natural gas accumulation conditions of the 4th member in Leikoupo Formation of Dayi structure. Special Oil Gas Reservoirs. 2016(3), 25–29. doi:10.3969/j.issn.1006-6535.2016.03.006
Chen, Y., Zheng, B., Yuan, D., et al. (2013). Characteristics and main controlling factors of fractures in gas reservoir of Xujiahe Formation. Dayi Struct. Petroleum Geol. Exp. 35 (1), 30–35. doi:10.11781/sysydz201301029
Cong, Y., and Hu, K. (2016). Saturation model for tight sandstone based on complex pore structure and additional shaliness conductivity. Well Logging Technol. 40 (4), 466–471. doi:10.16489/j.issn.1004-1338.2016.04.016
Fan, Z., Liu, S., Fan, C., et al. (2018). Analysis of typical seismic profile and balanced cross-section recovery and tectonic evolution in the Longmenshan Fold – thrust Belt. Geol. Rev. 64 (2), 347–360. doi:10.16509/j.georeview.2018.02.004
Fu, Z., Dai, R., Wang, X., et al. (2020). The characteristics and main controlling factors of high quality tight sandstone reservoir in the 3th member of Xujiahe Formation in West Sichuan Depression. Geol. China 49 (1), 298–310. doi:10.12029/gc20220119
Gao, J. (2012). Influencing factors of rock-electrical parameters alternation causes after polymer flooding in high porosity and high permeability sand rock. J. Southwest Petroleum Univ. Sci. Technol. Ed. 34 (5), 114–118.
He, Y., Mao, Z., Xiao, L., et al. (2005). An improved method of using NMR T2 distribution to evaluate pore size distribution. Chin. J. Geophys. 48 (2), 373–378. doi:10.3321/j.issn:0001-5733.2005.02.020
Hu, F., Zhou, C.;, Xia, L., et al. (2017). A tight sandstone trapezoidal pore oil saturation model. Petroleum Explor. Dev. 44 (5), 827–836. doi:10.11698/PED.2017.05.19
Huang, H., Lei, C., Sun, W., et al. (2018). Pore-throat structure and fractal characteristics of Shihezi Formation tight gas sandstone in the Ordos basin, China. World Sci. 26 (2), 1–22. doi:10.1142/S0218348X18400054
Jia, A., Yunsheng, W., Guo, Z., et al. (2022). Development status and prospect of tight sandstone gas in China. Nat. Gas. Ind. 42 (1), 83–92. doi:10.3787/j.issn.1000-0976.2022.01.008
Jia, C., Zou, C., Li, J., et al. (2012). Assessment criteria, main types, basic features and resource prospects of the tight oil in China. Acta Pet. Sin. 33 (3), 343–350. doi:10.7623/syxb201203001
Li, A., Ren, X., Wang, G., et al. (2015). Characterization of pore structure of low permeability reservoirs using a nuclear magnetic resonance method. J. China Univ. Petroleum 39 (6), 93–98. doi:10.3969/j.issn.1673-5005.2015.06.012
Liang, X., Shi, Y., Li, G., Guo, H., and Li, J. (2021). A method to predict the resistivity index for tight sandstone reservoirs from nuclear magnetic resonance data. AAPG Bull. 105 (5), 1009–1032. doi:10.1306/05222018269
Liu, C., Yan, D., and Li, S. (2014). Types and controlling factors of fractures for the third member of Xujiahe Formation in Dayi structure, West Sichuan depression. Fault-Block Oil Gas Filed 21 (1), 29–31. doi:10.6056/dkyqt201401006
Liu, S., Ren, X., Yao, S., et al. (2018). Relationship between gas reservoir distribution and structural system of upper triassic Xujiahe Fm in the Sichuan Basin. Nat. Gas. Ind. 38 (1), 1–14. doi:10.1016/j.ngib.2018.11.014
Liu, X., Liang, X., and Zhang, W. (2008). Construction method and application of reservoir capillary pressure curve. J. Southwest Petroleum Univ. Sci. Technol. Ed. 30 (6), 126–130. doi:10.3863/j.issn.1000-2634.2008.06.030
Liu, Z., Xu, S., Liu, J., et al. (2020). Enrichment laws of deep tight sandstone gas reservoirs in the Western Sichuan Depression, Sichuan Basin. Nat. Gas. Ind. 40 (2), 31–40. doi:10.3787/j.issn.1000-0976.2020.02.004
Luo, N. (2015). Characteristics and genetic mechanism of tight reservoir in the second member of the upper triassic Xujiahe Formation in the middle part of western sichuan depression. Chengdu: Chengdu University of Technology.
Qin, S., Tao, S., Tu, T., et al. (2007). Characteristics of natural gas geochemistry and accumulation in Western Sichuan Depression. Petroleum Explor Dev. 34(1), 34–38. doi:10.1016/S1872-5813(07)60034-6
Qu, Y., Sun, W., Tao, R., et al. (2020). Pore-throat structure and fractal characteristics of tight sandstone in Yanchang Formation, Ordos Basin. Mar. Petroleum Geol. 120, 2–15. doi:10.1016/j.marpetgeo.2020.104573
Sun, J. (2007). Archie’s formula: Historical background and earlier debates. Prog. Geophys. 22 (2), 472–484. doi:10.3969/j.issn.1004-2903.2007.02.020
Tang, X., Song, Y., Fu, J., et al. (2016). Conductance mechanism and conduction model for tight shale-rich and calcite-rich sands. Prog. Geophys. 31 (4), 1660–1669.
Xia, L., Li, C., Bo, Li, Liu, X., and Yuan, C. (2020). Response laws of rock electrical property and saturation evaluation method of tight sandstone. Petroleum Explor. Dev. 47 (1), 214–224. doi:10.1016/s1876-3804(20)60020-9
Xia, Y., Cai, J., Wei, Wei, Hu, X., Wang, X., and Ge, X. (2018). A new method for calculating fractal dimensions of porous media based on pore size distribution. World Sci. 26 (1), 1850006–1850012. doi:10.1142/s0218348x18500068
Xie, S., Cheng, Q., Ling, Q., Li, B., Bao, Z., and Fan, P. (2010). Fractal and multifractal analysis of carbonate pore-scale digital images of petroleum reservoirs. Mar. Petroleum Geol. 27, 476–485. doi:10.1016/j.marpetgeo.2009.10.010
Yakov, V., and Win, L. S. (2001). A practical approach to obtain primary drainage capillary pressure curves from NMR core and log data. Petrophysics 42 (4), 334–343.
Yan, J;, Wen, D., Li, Z., et al. (2015). The influence of low permeable sandstone pore structure on rock electrical parameters and its application. Nat. Gas. Geosci. 26 (12), 2227–2233.
Yang, P;, Zhang, L., Liu, k., Cao, B., Gao, J., and Qiu, G. (2021). Diagenetic history and reservoir evolution of tight sandstones in the second member of the Upper Triassic Xujiahe Formation, Western Sichuan Basin, China. J. Petroleum Sci. Eng. 201, 108451. doi:10.1016/j.petrol.2021.108451
Zhang, D., and Yang, Y. (2022). Exploration potential and development direction of continental tight sandstone gas in the Sichuan Basin. Nat. Gas. Ind. 42 (1), 1–11. doi:10.3787/j.issn.1000-0976.2022.01.001
Zhang, F., Yan, J., Li, Z., et al. (2017). Analysis of rock electrical parameters and rw in arichie formula for clastic roch. Well Logging Technol. 41 (2), 127–134. doi:10.16489/j.issn.1004-1338.2017.02.001
Zhang, L, Pan, B, Li, Z., et al. (2010). New three-water conduction model and its application in evaluation of low porosity and low permeability reservoir. Oil Geophys. Prospect. 45 (3), 431–435. doi:10.13810/j.cnki.issn.1000-7210.2010.03.025
Zhang, L., Pan, B., Ning, L., et al. (2011). Reservoir classification method based on three-water model to evaluate low porosity and low permeability reservoir. Well Logging Technol. 35 (1), 31–35.
Zhang, S. (2009). Discussion on the diagenesis and timing of tight sandstone reservoir in Xujiahe Formation, western Sichuan Basin. J. Mineralogy Petrology 29 (4), 33–38. doi:10.19719/j.cnki.1001-6872.2009.04.005
Zhao, J., Cao, Q., Bai, Y., et al. (2016). Petroleum accumulation from continuous to discontinuous: Concept, classification and distribution. Acta Pet. Sin. 37 (2), 145–159. doi:10.7623/syxb201602001
Zhao, i, Bian, C., Xu, C., Wang, H., Wang, T., and Shi, Z. (2011). Assessment on gas accumulation potential and favorable plays within the xu-1, 3 and 5 members of the Xujiahe Formation in the Sichuan Basin. Petroleum Explor. Dev. 38 (4), 385–393. doi:10.1016/s1876-3804(11)60041-4
Keywords: Western Sichuan Depression, tight sandstone, petrophysics, fractal theory, saturation model
Citation: Guo Y, Sima L, Wang L, Miao X, Li A and Su S (2023) Saturation evaluation of tight sandstone in the Dayi structure, West Sichuan Depression. Front. Earth Sci. 11:1223997. doi: 10.3389/feart.2023.1223997
Received: 17 May 2023; Accepted: 29 June 2023;
Published: 13 July 2023.
Edited by:
Lidong Dai, Chinese Academy of Sciences, ChinaReviewed by:
Lingyun Kong, China University of Geosciences Wuhan, ChinaPeiqiang Zhao, China University of Petroleum, Beijing, China
Copyright © 2023 Guo, Sima, Wang, Miao, Li and Su. This is an open-access article distributed under the terms of the Creative Commons Attribution License (CC BY). The use, distribution or reproduction in other forums is permitted, provided the original author(s) and the copyright owner(s) are credited and that the original publication in this journal is cited, in accordance with accepted academic practice. No use, distribution or reproduction is permitted which does not comply with these terms.
*Correspondence: Liang Wang, d2FuZ2xpYW5nX3N3cHVAMTYzLmNvbQ==