 Xiao Ding
 Xianghui Deng1,2
95% of researchers rate our articles as excellent or good
Learn more about the work of our research integrity team to safeguard the quality of each article we publish.
Find out more
ORIGINAL RESEARCH article
Front. Earth Sci. , 21 July 2023
Sec. Environmental Informatics and Remote Sensing
Volume 11 - 2023 | https://doi.org/10.3389/feart.2023.1223419
This article is part of the Research Topic Advances in Development and Utilization of Underground Space, volume II View all 13 articles
On the basis of the Zhonghe Tunnel project of the An-Lan Expressway, the objective of this study was to determine the appropriate method of calculating the steel arch load and stress release rate during numerical simulation. First of all, based on the monitoring results of six similar tunnel sections where the surrounding rock exerts pressure on the steel arch, using time functions, the rock pressure time history curve could be fitted, two formulas for calculating stable rock pressure in deep tunnels were compared, and the calculation model suitable for the Zhonghe Tunnel project was constructed. Then, a simulation of the Zhonghe Tunnel was performed using Flac3D, and stress release was simulated using the Mana method. By comparing the surrounding rock characteristic curves and the initial support characteristic curves under different stress release rates, the impact pattern of the stress release rate on the support load was summarized, and an appropriate excavation stress release rate was determined based on the stable rock pressure value calculation. It was found that the Zhonghe Tunnel rock pressure calculation model could better depict the change in rock pressure over time based on the empirical formula and Weibull time function. A prediction of the steel arch load of the Zhonghe Tunnel could be made using this method, and the stress release rate of the numerically simulated rock excavation was determined to be 0.5. This study thus provides a basis for the future internal force analysis and support parameter design of support systems.
The tunnel engineering industry plays a vital role in transportation. Recent years have seen tunnel engineering develop vigorously in China’s vast engineering construction projects, which are leading to deeper, longer, and larger tunnels. In the case of deep soft rocks, analyzing the stress characteristics of supporting structures and the pressure distribution in surrounding rock plays a critical role in the safe construction and operation of tunnels.
During the early construction of a deep soft rock tunnel, the steel arch is the main structure supporting its weight. In support design, the load acting on the support is an essential parameter. To reasonably design and construct a tunnel support system, the surrounding rock pressure must be determined first (Sakurai, 1978). A rapid development of rock mechanics theory and practice has been achieved through the continuous efforts of researchers (Liu et al., 2020; Liu et al., 2022; Xue et al., 2023a; Xue et al., 2023b; Liu et al., 2023). At present, the field test, indoor model test, numerical simulation, and limit theory are among the main research methods for determining surrounding rock pressure (Lei et al., 2014). The Platts theory, Caquot formula, Terzaghi theory and formulas recommended in China’s codes for railway and highway tunnels design are commonly used for calculating tunnel rock pressure (JTG 3370. 1-2018, 2018; Shen and Chen, 2015; TB 10003-2016, 2016). Noteworthily, in the complex and diverse environment of rock pressure, many theories have different conditions and scopes for application (Tong, 2020).
Many scholars have studied rock pressure evolution characteristics by means of field measurement and numerical simulation. Sakurai (1978) pointed out that rock pressure generally increases over time, and the change in the pressure is caused by the time-dependent changes in materials’ mechanical properties and also by the advance of the tunnel working face. Three typical stages of surrounding rock pressure evolution were identified by Zhou et al. (2021): rapidly growing, decelerating, and basically stable. The measured data of Tian et al. (2022) showed that surrounding rock pressure evolved with time, and the construction stage would cause the fluctuation of its time history curve, which finally tended to a stable value. Liang et al. (2020) explored the overall distribution characteristics of pressure on rock tunnels by statistically analyzing 71 monitoring sections of 39 tunnels in the past 20 years. The authors believed that the tunnel surrounding rock pressure had an obvious time effect, and its time history curve mainly presented a three-stage feature of “rapid growth—slow growth—gradual stabilizing,” which generally stabilized about 40 days following tunnel excavation.
In order to determine the tunnel rock pressure, a number of factors need to be considered: the depth of burial, the span, the length of the tunnel, and the formation mechanics (Tong, 2021). For this reason, a project similar to the Zhonghe Tunnel was selected by this paper for research. The three-step construction method was employed to build the six tunnels surrounded by grade IV (V) rock. It was buried about 200 m deep with a span of 12–15 m and a height-to-span ratio of about 0.80 (Zhu, 2008; Wang, 2016; Ye et al., 2019; Chen et al., 2020; Han et al., 2021; Wang et al., 2021). This study analyzed the rock pressure distribution of the selected tunnels, calculated the stable pressure value using the normative empirical formula and Platts formula, introduced the logistic and Weibull time functions to fit the time history curve of the measured wall rock pressure, and compared and determined a more suitable fitting formula. Then, the load distribution pattern of the initial support under different excavation stress release rates was simulated by Flac3D, and the stress release rate of the Zhonghe Tunnel was determined according to the theoretically calculated value, thus providing a basis for the subsequent internal force analysis and support parameter design of tunnel structures.
Time functions are a type of dimensionless function with time as the independent variable and the [0, 1] interval as the value range, controlling the curve shape and variation characteristics of the functions through relevant parameters (Dun et al., 2022). Once the research section has achieved stability, q can be used to represent the stability pressure value on tunnel rock, and
The time function is often used to predict surface settlement. Common time functions include Knothe (Knothe, 1952), Sroka–Schober (Kwinta et al., 1996), normal distribution (Gonzalez-Nicieza et al., 2007), the Weibull model (Weibull, 1951), logistic model (Verhulst, 1838), and MMF model (Morgan et al., 1975). Among them, the logistic model can fully describe the occurrence, development, maturity, and stable growth process; Weibull models are widely used in many fields due to their ability to adapt to a variety of sample data types (Almalki and Nadarajah, 2014). Therefore, these two commonly used time functions were substituted into Eq. 1 to fit the measured data:
1. Logistic model:
where x0 and p are influencing parameters related to geological mining conditions.
2. Weibull model:
where a and h are model parameters related to the properties of overlying rock and soil layers.
The calculation formulas for the deep single-hole tunnel arch rock pressure are provided in the Highway Tunnel Design Code (JTG/, 2010; Gao et al., 2019) as follows:
1. Empirical formula:
where
2. Platts formula:
Specifically,
Among them,
According to the Platts formula, rock pressure surrounding the tunnel is primarily determined by its span and height, its cohesion, and its internal friction angle. In empirical calculations, only the excavation span and rock grade are taken into account. There is no consideration of tunnel depth in the formulas above. The depth of tunnels and rock pressure are related in practical engineering.
Based on similar engineering profiles, measurements of surrounding rock pressure at the vault position were collected under conditions of grade IV (V) surrounding rock and step method construction. The constant value after section excavation and support was chosen as the stable rock pressure value. Using the above two formulas, the pressure value of surrounding rock can be determined and then compared to the measured stability value. As can be seen in Table 1, the rock pressure was statistically analyzed.
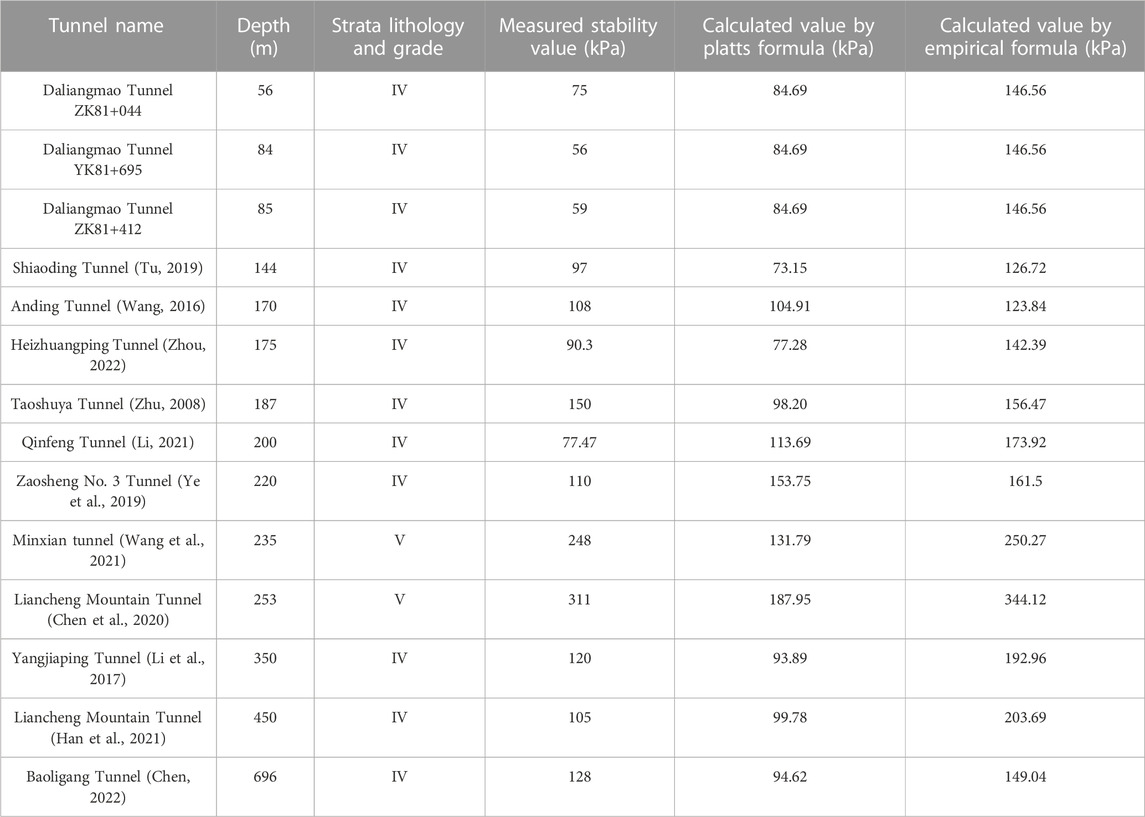
TABLE 1. Results of surrounding rock pressure calculation compared.
In Table 1, the measured rock pressure is compared with the theoretical calculation results. The result shows that the Platts’ formula calculates rock pressure values that are smaller than the empirical formula calculations. In comparison with the surrounding rock’s pressure stability value, the calculated value of the Platts formula is closer to the measured stability value with a smaller buried depth, and the calculated value of the empirical formula is more consistent with the measured stable value with greater buried depth.
Six groups of surrounding rock pressure data from five tunnels were selected, and a summary of the tunnels’ basic parameters can be found in Table 2. Firstly, the rock pressure value in comparison to the measured value following stabilization was calculated, and an appropriate calculation formula for the convergence value of the pressure curve was selected. Then, time-dependent changes in rock pressure were fitted using two time functions. The fitting curves are shown in Figure 1.
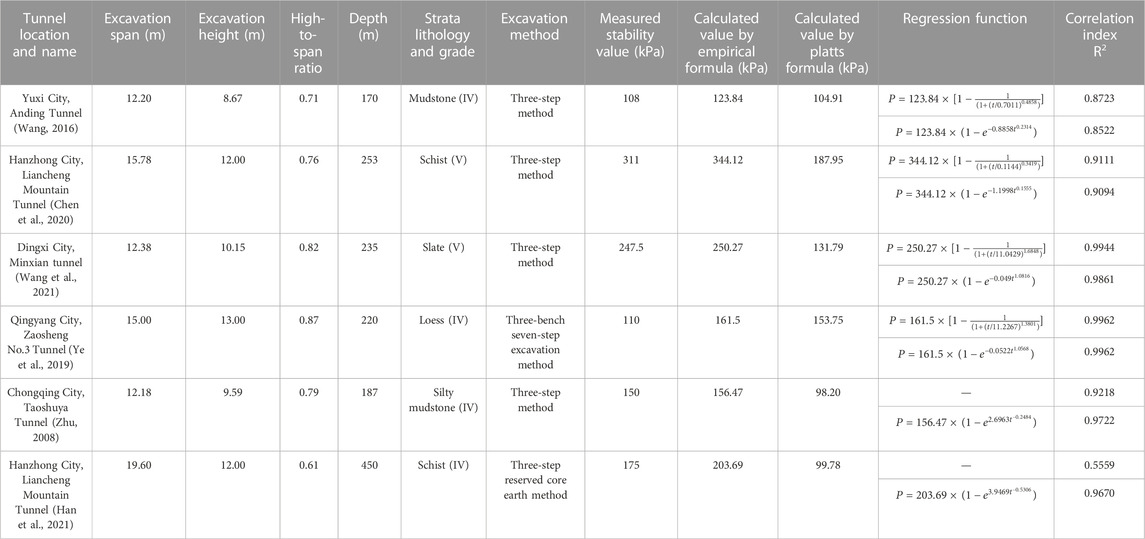
TABLE 2. Surrounding rock pressure and time fitting parameters.
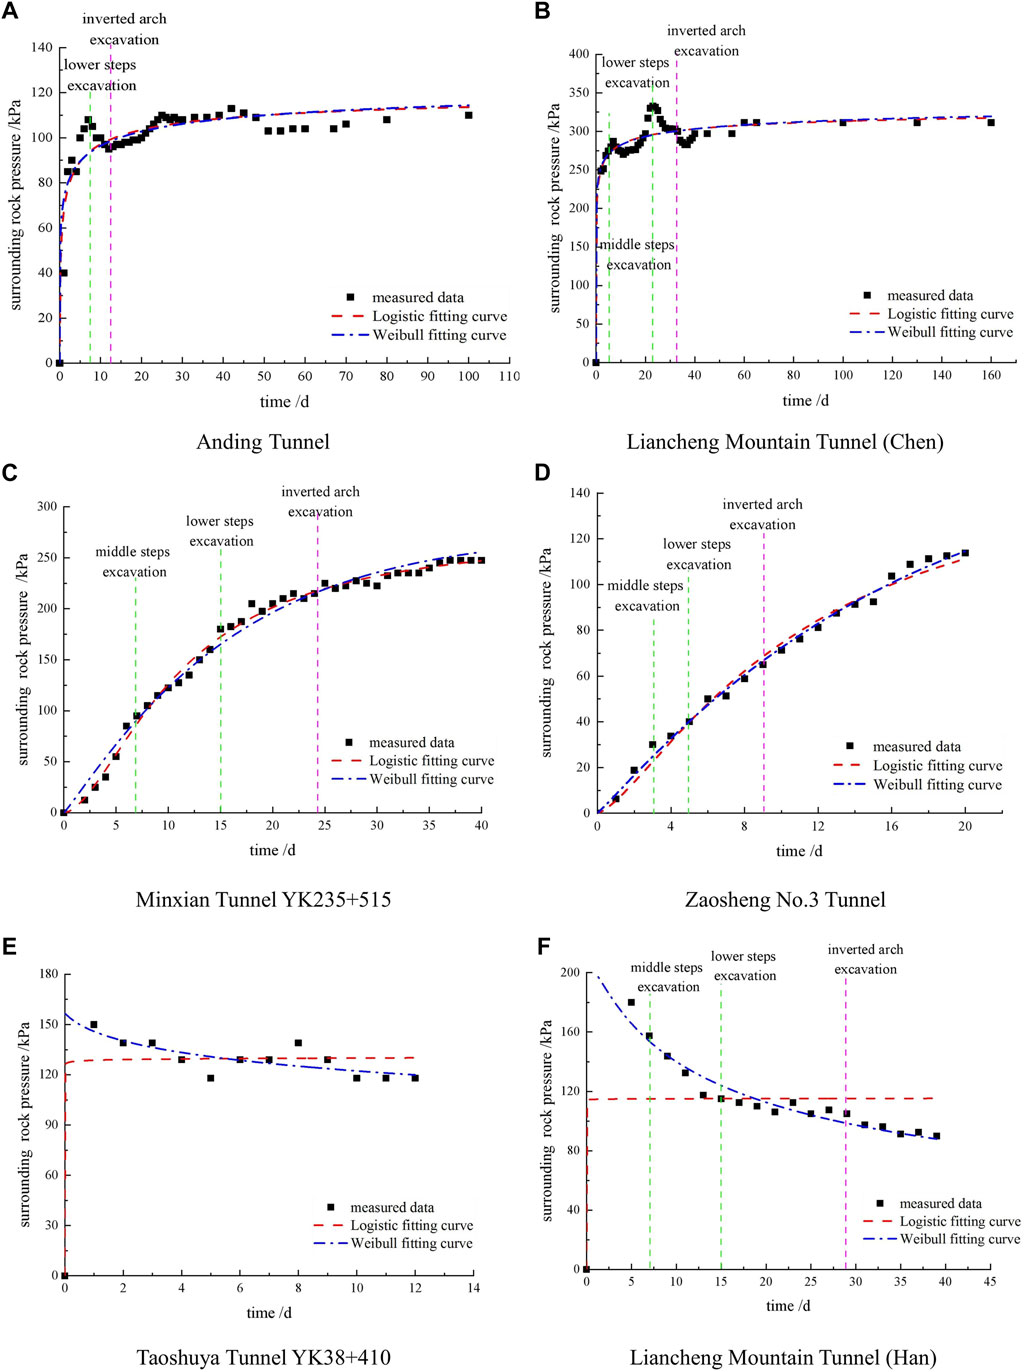
FIGURE 1. Time functions fitting curve of surrounding rock pressure.
Based on Table 1, the normative empirical formula produces a greater agreement between the measured and calculated rock pressure, so Eq. 4 was selected to calculate q in the model. As can be seen from Figure 1, pressure–time curves around surrounding rocks can be categorized into three types: the “steep increase—gentle” type (see Figures 1A, B), the “slow increase” type (see Figures 1C, D), and the “slow decrease” type (see Figures 1E, F). Both the logistic and Weibull models could well fit the first two types of surrounding rock pressure curves, while the third type (see Figures 1E, F) could only be fitted by the Weibull model; thus, the Weibull model has a wider scope of application. Consequently, Eq. 3 was selected for calculating
The Zhonghe Tunnel is located near Yanba Town, Hanbin District, Ankang City, Shaanxi Province. It belongs to the fourth section of the An-Lan Expressway, passing through several mountains. The surrounding rocks are classified as grade IV and V. The tunnel burial depths are approximately 300 m, and end-wall entrances and exits are both present. The width of the excavation is 13.6 m, and the height of the excavation is 10.66 m. Excavations were conducted in three steps, with the upper step excavating at about 3.8 m high, the middle step at about 3 m, and the lower step at about 3.86 m. Specifically, the support for the lower step and the inverted arch were excavated at the same step, and the excavation schematic diagram is shown in Figure 2.
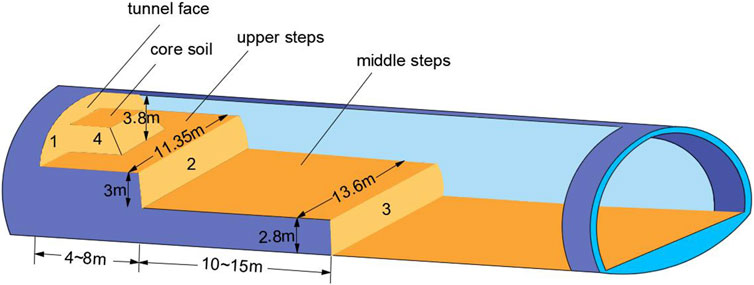
FIGURE 2. Schematic layout of the tunnel excavation with 3 steps.
The mileage section between ZK20+620 and ZK20+820 of the grade IV rock surrounding the Zhonghe Tunnel on the left, with a burial depth of 170 m, was chosen as the object of research. Several mechanical properties were determined by uniaxial testing of the nearby rock (see Table 3). In this section, an I20a steel I-shape + concrete mortar spray layer with a thickness of 26 cm and 42 m feet-lock anchor pipe setting angle of 40° provide the initial lining of the surrounding rock.
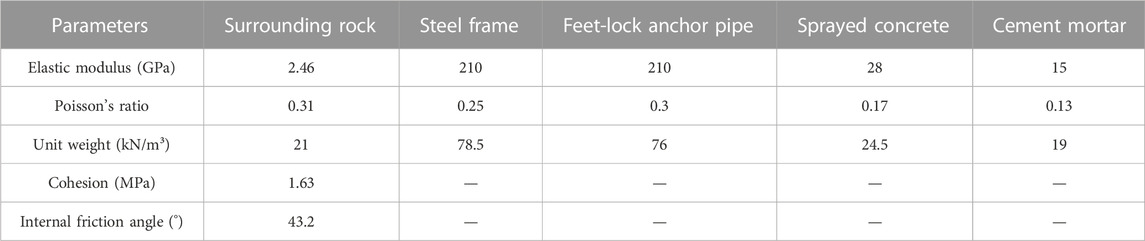
TABLE 3. Parameters of the surrounding rock and the supporting structure.
The model was 120 m × 100 m × 60 m in size, as shown in Figure 3. It was constrained horizontally at the left and right edges and vertically at the bottom, and the vertical stress of 2.45 × 10⁶ Pa was applied to the model’s surface to simulate the self-weight of overlying rock and soil. Mohr–Coulomb was selected for the rock mass calculation model, the steel arch was simulated by using the beam element, the reinforcing mesh + shotcrete was simulated by the liner element, and the secondary lining was simulated by the solid element of the elastic constitutive model. Liner and rock contact surfaces would be generated automatically, which could simulate the shear slip, closed tension, and other interactions between the liner and rock. The normal spring was set between the liner element and the wall rock to simulate the separation and closure of the support. The pressure borne by the normal spring could be regarded as the force acting on the initial support by the wall rock. The numerical simulation parameters of the rock and the supporting structures can be found in Table 3, and the contact surface parameters of the liner element can be found in Table 4.
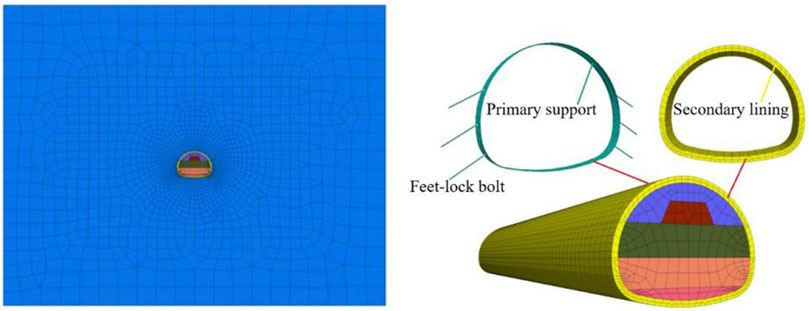
FIGURE 3. Numerical model of the Zhonghe tunnel.

TABLE 4. The contact surface parameters of the liner element.
Using a reversed stress release method, the Mana method, this study simulated the stress release process (Abi et al., 2016), as shown in Figure 4, where P0, P*, and Pc represent the self-weight stress, virtual support effect, and stable support load of the primary reinforcement, respectively. Initially, the model’s self-weight stress field was computed (see Figure 4A). Then, the tunnel was excavated, and the unbalanced force of the nodes around the tunnel was extracted to perform the stress release of the virtual support (see Figure 4B). Finally, the initial support was applied (see Figure 4C), the virtual support force was removed (see Figure 4D), and the preliminary support and wall rock interaction were calculated. With a stress release rate of 0.3, the virtual support force was set as 0.7 times the unbalanced force. All monitoring data were collected under one cycle footage. Figure 5 exhibits the characteristic curves of the wall rock and the primary reinforcement without considering the stress release and under different stress release rates. Figure 6 shows the comparison of the simulated and measured values of the vertical displacement of the steel arch roof without considering the stress release and under different stress release rates. Figure 7 shows the comparison of the axial stress of a steel arch under different stress release rates.
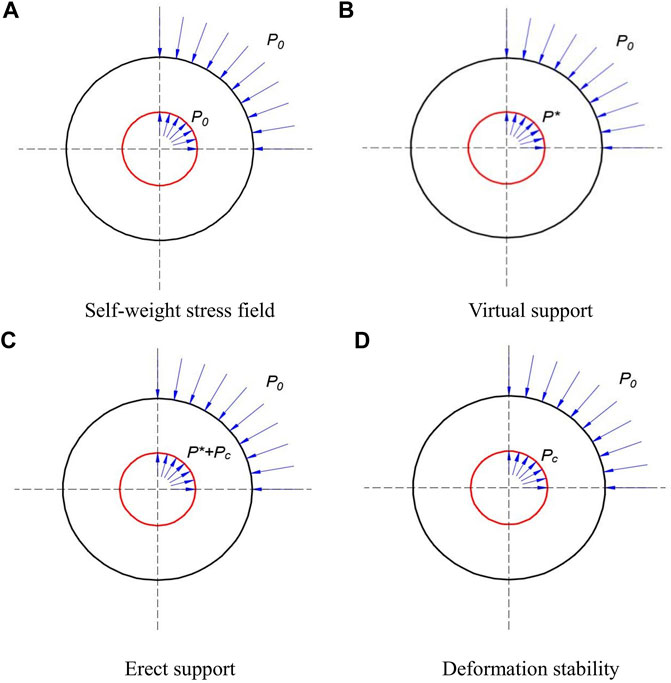
FIGURE 4. Simulation of the stress release process with the Mana method.
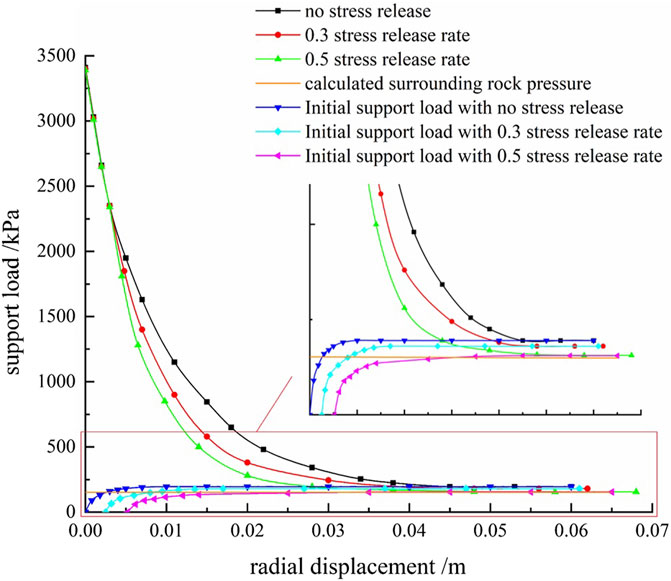
FIGURE 5. Characteristic curves of the surrounding rock and primary lining.
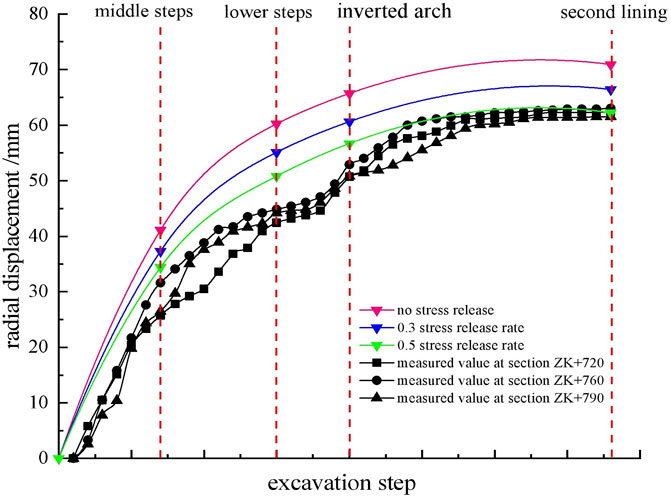
FIGURE 6. The comparison and verification of radial displacement of a steel arch roof.
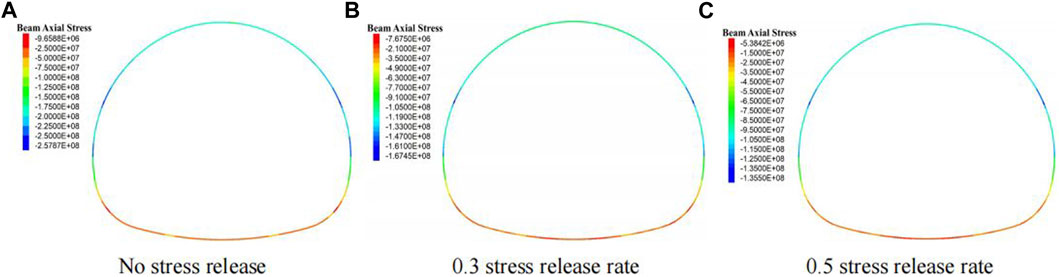
FIGURE 7. Axial stress distribution of steel arch under different stress release rates.
Figure 5 reveals that a steeper characteristic curve for surrounding rock occurs at greater stress release rates, indicating that the faster the rock stress release, the lower the final stress point. The support curves intersected with the wall rock characteristic curves at the same point, and the shapes of the initial support characteristic curves were the same under different stress release rates. The release rates increased as pressure on the initial support decreased. A load of 195 kPa was applied to the initial support without setting a stress release rate; a 0.3 stress release rate resulted in a 180 kPa support load, and a 0.5 stress release rate resulted in a 156 kPa support load, which is close to the rock pressure value of 152.24 kPa calculated by the empirical formula for highway tunnels, and this is the closest match between the vertical displacement of steel arch roofs and the measured value (see Figure 6). Therefore, the stress release rate of 0.5 should be selected for numerical simulation of the Zhonghe Tunnel.
Figure 7 illustrates the point: 1) By using the three-step method to excavate, the axial stress of the arch roof is larger, the lateral walls are smaller, and the invert is the smallest under different stress release rates. 2) There is a stress concentration at the joint point of the step arch feet caused by the step construction and anchor pipe application. 3) A comparison is made between the axial stress of the steel arch under the three stress release conditions. The arch axial stress of the arch roof is 178.44 MPa without stress release. At a 0.5 stress release rate, it decreases to 103.12 MPa, which is more economical and reasonable.
1. For deep soft rock tunnels, the monitoring data concerning surrounding rock pressure can be well fitted with time functions, of which the Weibull model is more applicable and can better simulate the time history curve of rock pressure with different trends around the rock.
2. A similar project’s rock pressure was measured and statistically analyzed, and the proximity of rock pressure has been calculated using an empirical formula and Platt’s formula as listed in the Highway Tunnel Design Code. The results show that the stable value calculated by the empirical formula matches the measured pressure more closely most of the time, thus verifying the suitability of using the normative empirical formula to estimate the rock pressure surrounding the Zhonghe Tunnel.
3. Simulating the stress release process of the surrounding rock excavation has been achieved using the Mana method. The surrounding rock characteristic curves and support characteristic curves were drawn when the stress was released at different rates, and the effects of the stress release rate on the initial support load have been discussed. Finally, the stress release rate of the Zhonghe Tunnel has been determined according to the calculated pressure and verified by the vertical displacement of a steel arch roof, thereby shedding light on the reasonable load conditions for subsequent numerical simulations of supporting structures.
The original contributions presented in the study are included in the article/Supplementary material, further inquiries can be directed to the corresponding author.
XoD: offered ideas and wrote the manuscript; XiD: revised the manuscript; XZ: analyzed the original data; RW: polished the article. All authors contributed to the article and approved the submitted version.
The research for this study was financially supported by the Science and Technology Planning Project of Shaanxi Province (2023-JC-YB-327), Shaanxi Provincial Department of Education service local special project (22JC040), and Qinchuangyuan Transportation Infrastructure Performance Perception and Intelligence Improvement “Scientists + Engineers” Team of Shaanxi Province.
The authors declare that the research was conducted in the absence of any commercial or financial relationships that could be construed as a potential conflict of interest.
All claims expressed in this article are solely those of the authors and do not necessarily represent those of their affiliated organizations, or those of the publisher, the editors and the reviewers. Any product that may be evaluated in this article, or claim that may be made by its manufacturer, is not guaranteed or endorsed by the publisher.
Abi, E., Zheng, Y., Feng, X., and Xiang, Y. (2016). Study of the safety factor for tunnel stability considering the stress release effect. Mod. Tunn. Tech. 53 (2), 70–76. doi:10.13807/j.cnki.mtt.2016.02.010
Almalki, S. J., and Nadarajah, S. (2014). Modifications of the weibull distribution: A review. Reliab. Eng. Syst. Saf. 124, 32–55. doi:10.1016/j.ress.2013.11.010
Chen, J., Liu, W., Chen, L., Luo, Y., Wu, Y., and Shi, Z. (2020). In-situ experimental study on large-deformation control and reasonable support forms for a large-span highway tunnel in chlorite schist. Chin. J. Highw. Transp. 33 (12), 212–223. doi:10.19721/j.cnki.1001-7372.2020.12.017
Chen, Y. (2022). Study on the constitutive model of carbonaceous slate and its application in tunnel engineering. Sichuan: Xihua University. doi:10.27411/d.cnki.gscgc.2022.000428
Dun, Z., Wang, W., Zou, Y., Ren, L., Dun, Z., and Guo, W. (2022). Dynamic prediction of goaf surface subsidence and calculation of residual deformation based on time function combination model. J. Chin. Coal. Soc. 47 (S1), 13–28. doi:10.13225/j.cnki.jccs.2021.1583
Gao, H., He, P., Chen, Z., and Li, X. (2019). A novel calculation method of process load for extra-large section tunnels. Symmetry 11 (10), 1228. doi:10.3390/sym11101228
Gonzalez-Nicieza, C., Alvarez-Fernandez, M. I., Menendez-Diaz, A., and Alvarez-Vigil, A. E. (2007). The influence of time on subsidence in the central Asturian coalfield. Bull. Eng. Geol. Environ. 66 (3), 319–329. doi:10.1007/s10064-007-0085-2
Han, C., Zhang, T., Xu, C., and Xia, C. (2021). Research on the deformation characteristics of soft rock tunnel with large section and the deformation control with multilayer support. Highw 66 (01), 335–339.
JTG 3370. 1-2018 (2018). Specifications for Design of highway tunnels JTG 3370 1-2018. Beijing, China: People's Communications Press.
JTG/ (2010). Guidelines for design of highway tunnel. Beijing, China: China Communications Press. JTG/T D70-2010.
Knothe, S. (1952). Time influence on a formation of a subsidence surface. Arch. Gómictwa i Hut. Kraków, 1(1):1–3.
Kwinta, A., Hejmanowski, R., and Sorka, A. (1996). A time function analysis used for the prediction subsidence. Proceeding of the Internation Symposium on Ming and Technology. Xuzhou: Balkema, 419–424.
Lei, M., Peng, L., and Shi, C. (2014). Calculation of the surrounding rock pressure on a shallow buried tunnel using linear and nonlinear failure criteria. Autom. Constr. 37 (1), 191–195. doi:10.1016/j.autcon.2013.08.001
Li, L., Tan, Z., Guo, X., Wu, Y., and Luo, N. (2017). Large deformation of tunnels in steep dip strata of interbedding phyllite under high geostresses. Chin. J. Rock. Eng. 36 (07), 1611–1622. doi:10.13722/j.cnki.jrme.2016.1475
Li, S. (2021). Study on cumulative damage law by blasting and stability of surrounding rock of large cross section tunnel. Shijiazhuang: Tiedao University. doi:10.27334/d.cnki.gstdy.2021.000361
Liang, Q., Fang, J., and He, P. (2020). Analysis on tunnel surrounding rock pressure characteristics based on field measured statistics. Chin. J. Undergr. Sp. Eng. 16 (2), 555–566.
Liu, N., Li, N., Li, G., Song, Z., and Wang, S. (2022). Method for evaluating the equivalent thermal conductivity of a freezing rock mass containing systematic fractures. Rock Mech. Rock Eng. 55 (12), 7333–7355. doi:10.1007/s00603-022-03038-9
Liu, N., Li, N., Wang, S., Li, G., and Song, Z. (2023). A fully coupled thermo-hydro-mechanical model for fractured rock masses in cold regions. Cold Reg. Sci. Technol. 205, 103707. doi:10.1016/j.coldregions.2022.103707
Liu, N., Li, N., Xu, C., Li, G., and Yang, M. (2020). Mechanism of secondary lining cracking and its simulation for the dugongling tunnel. Rock Mech. Rock Eng. 53 (10), 4539–4558. doi:10.1007/s00603-020-02183-3
Morgan, P. H., Mercer, L. P., and Flodin, N. W. (1975). General model for nutritional responses of higher organisms. Proc. Nat. Acad. Sci. USA. 72 (11), 4327–4331. doi:10.1073/pnas.72.11.4327
Sakurai, S. (1978). Approximate time-dependent analysis of tunnel support structure considering progress of tunnel face. Int. J. Num. Anal. Meth. Geomech. 2, 159–175. doi:10.1002/nag.1610020205
TB 10003-2016 (2016). Code for design of railway tunnel. TB 10003-2016. Beijing, China: China Railway Publishing House.
Tian, X., Song, Z., Wang, H., Zhang, Y., and Wang, J. (2022). Evolution characteristics of the surrounding rock pressure and construction techniques: A case study from taoshuping tunnel. Tunn. Undergr. Sp. Tech. 125, 104522. doi:10.1016/j.tust.2022.104522
Tong, J. (2020). General formulas for calculating surrounding rock pressure of tunnels and underground spaces. KSCE J. Civ. Eng. 24 (4), 1348–1356. doi:10.1007/s12205-020-0943-z
Tong, J. (2021). Research on application of multi-factor surrounding rock pressure calculation theory in engineering. KSCE J. Civ. Eng. 25 (6), 2213–2224. doi:10.1007/s12205-021-0849-4
Tu, X. (2019). Study on interaction mechanism and application of tunnel surrounding rock and supporting structure. Nanchang: East China University of Technology.
Verhulst, P. F. (1838). Notice sur la loi que la population suit dans son accroissement. Corresp. Mathématique Physique 10, 113–121.
Wang, F., Guo, Z., Qiao, X., Fan, J., Li, W., Mi, M., et al. (2021). Large deformation mechanism of thin-layered carbonaceous slate and energy coupling support technology of npr anchor cable in minxian tunnel: A case study. Tunn. Undergr. Sp. Tech. 2021, 104151. doi:10.1016/j.tust.2021.104151
Wang, K. (2016). Baoji-lanzhou high-speed railway Anding tunnel construction simulation and on-site monitoring and analysis (USA: Lanzhou Jiaotong University). Master's Thesis.
Weibull, W. (1951). A statistical distribution function of wide applicability. J. Appl. Mech. 18 (3), 293–297. doi:10.1115/1.4010337
Xue, Y., Liu, J., Liang, X., Li, X., Wang, S., Ma, Z., et al. (2023b). Influence mechanism of brine-gas two-phase flow on sealing property of anisotropic caprock for hydrogen and carbon energy underground storage. Int. J. hydrogen Energy 48 (30), 11287–11302. doi:10.1016/j.ijhydene.2022.05.173
Xue, Y., Liu, S., Chai, J., Liu, J., Ranjith, P. G., Cai, C., et al. (2023a). Effect of water-cooling shock on fracture initiation and morphology of high-temperature granite: Application of hydraulic fracturing to enhanced geothermal systems. Appl. Energy 337, 120858. doi:10.1016/j.apenergy.2023.120858
Ye, W., Wu, Y., Chen, M., and Liu, J. (2019). Surrounding rock pressure distribution law and supporting structure stress characteristics of large cross-section paleosol tunnel: A case study of zaosheng No.3 tunnel on yinchuan-xi'an high-speed railway. Tunn. Constr. 39 (03), 355–361. doi:10.3973/j.issn.2096-4498.2019.03.003o
Zhou, F. (2022). Study on over excavation control and stability of supporting structure of large section mud-sandstone tunnel. Lanzhou: Jiaotong University. doi:10.27205/d.cnki.gltec.2022.001209
Zhou, Z., Chen, Z., He, C., and Kou, H. (2021). Investigation on the evolution characteristics and transfer mechanism of surrounding rock pressure for a hard-rock tunnel under high geo-stress: Case study on the erlang mountain tunnel, China. Bull. Eng. Geol. Environ. 80, 8339–8361. doi:10.1007/s10064-021-02439-4
Keywords: deep tunnel, soft rock, surrounding rock pressure, time function, stress release rate
Citation: Ding X, Deng X, Zhang X and Wang R (2023) Surrounding rock pressure calculation based on time functions and stress release rate determination of deep soft rock tunnel: taking Zhonghe Tunnel as an example. Front. Earth Sci. 11:1223419. doi: 10.3389/feart.2023.1223419
Received: 16 May 2023; Accepted: 13 June 2023;
Published: 21 July 2023.
Edited by:
Naifei Liu, Xi’an University of Architecture and Technology, ChinaReviewed by:
Yi Xue, Xi’an University of Technology, ChinaCopyright © 2023 Ding, Deng, Zhang and Wang. This is an open-access article distributed under the terms of the Creative Commons Attribution License (CC BY). The use, distribution or reproduction in other forums is permitted, provided the original author(s) and the copyright owner(s) are credited and that the original publication in this journal is cited, in accordance with accepted academic practice. No use, distribution or reproduction is permitted which does not comply with these terms.
*Correspondence: Xiao Ding, ZHgwNDAyQHhhdHUuZWR1LmNu
Disclaimer: All claims expressed in this article are solely those of the authors and do not necessarily represent those of their affiliated organizations, or those of the publisher, the editors and the reviewers. Any product that may be evaluated in this article or claim that may be made by its manufacturer is not guaranteed or endorsed by the publisher.
Research integrity at Frontiers
Learn more about the work of our research integrity team to safeguard the quality of each article we publish.