 Xiaohu Zhang
 Jiabing Zhang
 Xin Li1
94% of researchers rate our articles as excellent or good
Learn more about the work of our research integrity team to safeguard the quality of each article we publish.
Find out more
ORIGINAL RESEARCH article
Front. Earth Sci., 01 September 2023
Sec. Environmental Informatics and Remote Sensing
Volume 11 - 2023 | https://doi.org/10.3389/feart.2023.1222959
This article is part of the Research TopicCoal and Rock Dynamic Disasters: Advances of Physical and Numerical Simulation in Monitoring, Early Warning, and Prevention, volume IIView all 29 articles
Constructing a microstructure of red clay is an important part of studying the physical and mechanical properties of red clay. The study of red clay microstructure is generalized. The red clay matrix and pores are regarded as two types of randomly moving particles, and the microstructure model of three-dimensional red clay random porous media is established from the Langevin equation of the phase separation process in stochastic dynamics, using the separation and aggregation of the two particles. The model controls the evolution process of the porous medium by artificially controlling the particle placement. Here, the trends of porosity, average pore length, Euler’s number, and the fractal dimension of the porous medium during the evolution process under different parameter conditions (smooth length Δ and rise and fall term η) are calculated, and a feasible method for surviving the microstructure of red clay is summarized. Due to the consideration of the interaction forces between the solid- and void-phase particles, the porous media generated by this model are more similar to the real porous media in nature, with connected and unconnected pore structures and tortuous pore channels. Finally, the red clay of Bijie, Guizhou, is modeled as an example to prove the feasibility of the method.
Red clay is reddish-brown, highly plastic clay formed by the weathering of carbonate rocks in a hot and humid climate. Red clay is widely distributed in Bijie, Guizhou, an area rich in karst landscapes. Red clay has strong sensitivity to water; its strength weakens when it is exposed to water and shrinks and cracks when it is dry, so water has a strong influence on red clay in terms of seasonal alternation. Rainfall and dryness can lead to the loss and destruction of the red clay surface layer, causing large economic losses and affecting the survival and safety of local residents (Tan et al., 2015).
Because of the strong sensitivity of red clay to water, the loss of water will form a large number of microscopic pores in red clay (Tang et al., 2007). At present, scholars’ research on the microscopic pore structure of red clay is mainly focused on the following two aspects: microstructure evolution law and microstructure model construction.
First, in terms of the microstructure evolution law of red clay, many scholars have studied the change law of its microstructure under different influencing factors. Pan et al. (2021) studied the effect of acidity and alkalinity on the microstructure of red clay, and acidic and alkaline solutions erode the structure of the clay matrix and destroy its internal pore structure distribution, which in turn reduces the shear strength, cohesion, and internal friction angle. Li (2021) used microorganisms to improve red clay and found that the mineral composition of red clay changed significantly under the action of microorganisms, and there was a significant amount of precipitation of calcium carbonate on the surface of the particles, which was cemented by calcium carbonate. The soil particles filled the pore spaces of soil, enhanced the connection between soil particles, and obviously improved the shear strength of red clay. Mou et al. (2021) studied the microstructural evolution pattern of red clay under alkali contamination conditions and found that ammonia contamination could change the surface of soil particles from smooth to rough, accompanied by the pattern of pore enlargement and diffusion, and explored the reasons for the occurrence of the pattern. Cai et al. (2021) studied the evolution law of red clay microstructure under dry and wet cycles and found that its pore size distribution curve showed the characteristics of bimodal and single peak distributions. Wang (2020) studied the microstructural characteristics of artificially cemented red clay and found that the size law of lateritization followed the order colloidal content >dry and wet cycles >maintenance time, and the maximum growth rate of the pore volume of these three factors in the process of red clay lateritization was 31%, 5.6%, and 0.35%, respectively. Jiaming et al. (2020) studied the microstructure of zinc-contaminated red clay and found that red clay particles under the condition of doping with zinc ions were mainly observed in the structural skeleton of stacked flakes and blocks, and the doping of zinc ions reduced the strength of red clay, increased the matrix porosity and fractal dimension, and formed an unstable structure. Ke et al. (2019) studied the effect of freezing on the microstructure of red clay and found that after freezing occurred, the ice crystal action had an extrusion effect on soil particles, leading to the destruction of the surrounding soil particles and causing an increase in large pores and reduction of small pores. Overall, the soil porosity decreases after freezing. He et al. (2018) studied the effect of an external admixture on the microstructure of red clay, prepared a comparative analysis of the microstructure via electron microscopy scanning, and established a model to quantify the brittleness index of red clay. Jun et al. (2018) found that with the increase in shear force, the particles in the soil were elongated and the pore directionality was better, while in the case of soaked alkali solution, the particles in the soil maintained their roundness, and their pore directionality was poor. Jinghe et al. (2018) found that mixing sand and fly ash in red clay can fundamentally change the soil structure and improve its stability and strength. Qi et al. (2017) found that the changes in the specific physical properties of red clay under high alkali contamination conditions were caused by a combination of microscopic pore area, particle number, new salt filling inside the microscopic pores, and the adsorption of substances in the solution by clay minerals.
Second, in terms of microstructure models, Taixu et al. (2019) used image analysis software to extract and process the SEM image of red clay soils and quantitatively analyzed the morphological characteristics of the pore structure in red clay soils using the fractal dimension. Cai et al. (2018) analyzed the relationship between evolution parameters and the pore ratio on the macroscopic and microscopic scales of red clay soils and proposed a microstructure model of unsaturated soils with a double pore structure and verified its feasibility. Tao et al. (2011) analyzed the mineral composition and microstructural characteristics of red clay, proposed a soil microstructure model, analyzed the influence of the microstructure on the physical properties of this type of red clay, and obtained a pore ratio consistent with the experimental results. Jie et al. (2021) extended the DDA algorithm to study large pores and cementation effects of clay, constructed a microstructure model with a pore ratio close to that of the as-built soil, and performed numerical calculations. Zhi-Tian Qiao established a two-dimensional microstructure model for clayey soils using the Monte Carlo random placement, which provided a prototype for studying the micromechanical behavior of clay (Ping et al., 2020). Zuo et al. (2019) used a fractal model of porous media in geotechnical bodies to reasonably predict the macroscopic physical characteristics, such as porosity, and concluded that red clay particles and their pore distributions exhibit fractal characteristics. Guo et al. (2017) established a microstructural model for the discontinuous deformation analysis of soil samples based on numerical graphical analysis and particle morphology extraction, which was verified by compression tests. Zhou et al. (2012) established a microscopic “grain collection” model of red clay, used the model to analyze and interpret the theoretical analysis results under engineering conditions, and conducted a 3-week compression simulation to prove that the model can better reflect the macroscopic mechanical effects of red clay. Liu et al. (2011) introduced structural elements describing the properties of chalky particles into the clay mineral structure model, proposed a microstructure combination element model for soft rocks, established a reformation model for soft rock softening using the reformation group method, and analyzed the critical criterion for the microstructure evolution of the soft rock softening process. Tan and Kong (2001) proposed a structural model for soil gel cementation, which reasonably explained the high water content of red clay. The contradictory phenomena of high water content, high porosity ratio, and high plasticity with high bearing capacity and low compressibility of red clay soils were explained reasonably.
The aforementioned studies on red clay microstructural models are based on the structural evolution process under the action of exogenous factors or the establishment of macroscopic physical models. Meanwhile, the theoretical construction of the physical model of red clay microstructure is universal, and however, the structural model established cannot be applied to all types of red clay. The formation of a red clay microstructure results from the joint action of microcluster particle polymerization and granulation process. To elucidate the formation characteristics of red clay microstructure, this paper aims to establish a numerical model of the microstructure of red clay porous media, describe the polymerization and separation process of red clay microclusters by using the phase separation equation, and estimate the approximation of the microstructure model of red clay by using the multi-parameter coupling method. The article also investigates the change process of the parameters such as porosity, Euler’s number, fractal dimension, and feature length during the iterative approximation process, which proves the usability of the method in constructing the red clay microstructure model.
Red clay refers to a type of red clay soil containing more clay particles and rich in iron and aluminum oxide cementation formed under hot and humid climatic conditions after a certain type of red clay soil formation. In the formation process of red clay, the carbonate rock undergoes weathering, micro-granulation, and later modification of microgranules, and when the parent rock undergoes this complete process of soil formation, red clay is formed.
In the weathering process, iron sulfide, oxide, carbonate, etc., in the rock will form free iron and acidic aqueous solution after oxidation, carbonation, and hydrolysis. In the acidic aqueous medium, free iron, aluminum colloids, kaolinite, etc., under the action of the electrostatic force, were linked to a porous, water-containing, rough surface and irregularly shaped structural units. Moreover, in the acidic aqueous solution, free iron, aluminum, and silica gel are adsorbed together to form a double electric layer, which is linked to a colloid in combination with water, and this colloid binds the structural units into larger aggregates.
In the process of micro-granulation, when red clay, which is in the overall cemented state mentioned previously, encounters high temperature and dry climate conditions, cracks appear in its internal contraction due to water loss. When it rains, water penetrates along the cracks and wedges through the transfer of water from the film, weakening the cementation bond. Certainly, it is not excluded that free iron, aluminum, silica gel, etc., that leached out due to prolonged rainwater soaking will coalesce to form a new adhesive linkage. The continuous drying and wetting cycle promoted the breakdown of the cementation of the whole red clay block into fine particles and structural units composed of bulk red clay.
In the middle-to-late Pleistocene, the bulk red clay formed through micro-cluster granulation; since there was no hot and humid climatic conditions, the leaching effect was weak, the structural unit body showed a certain degree of solidification and compaction, and a small amount of free iron, aluminum, and silica re-gelatinized, followed by the formation of the modern sense of the honeycomb red clay, with a small natural density, high water content, large pore ratio, high liquid and plastic limit, medium-to-low compression, and a medium-to-high strength of the characteristics.
The formation process of red clay involves the aforementioned three steps; weathering carries out rock decomposition and the formation of particles; the hydrolysis of these particles and metal ions is carried out under the action of the electrostatic force of the combination of aggregates. Micro-granulation further breaks down these aggregates. The soil-forming action of the free elements and the granulation and formation of particles results in the solidification and compaction under the action of re-cementation. The effect of the aforementioned three processes on the microscopic pore structure of red clay can be attributed to the polymerization and separation of the cementing compounds. The collodion can either be externally or internally added to the structure. With a fixed computational region, the porosity of the system decreases with the continuous addition of the externally added binders whereas increases if the binders are continuously reduced.
The Langevin equation can better simulate the polymerization and separation process of the two-phase or multi-phase system, and it can also better simulate the polymerization and separation process of the binder in the microstructure of red clay, so as to realize the simulation of the microporosity structure of red clay. In fact, the pore structure characteristics of various types of red clay can be simulated by modifying the control equation.
The original Langevin equation describes Brownian motion, which describes the irregular motion of particles in a liquid due to collisions of liquid molecules. The Langevin equation has many forms but is usually expressed as follows: the rate of a slow-moving physical quantity is the sum of the minimum coarse free energy F of the system and a random noise term (Zhang et al., 2019), which is mathematically expressed as follows:
where ϕ represents the computational region, M represents the kinetic energy, t represents the time, and H represents the random noise term, i.e., the rise and fall term, which satisfies the following equation:
where r,
If ϕ represents a non-conservative field, then Eq. 1 and Eq. 2 have a = 0; if ϕ represents a conservative field, then we have a = 1. The rise and fall term η is a quantity that is independent of the time space but increases with the temperature. As mentioned previously, the kinetics of Langevin depends on the form of the free energy in the form of F. Usually, the minimum free energy F consists of two components, the surface energy and the volume energy, given as follows:
where f and h denote the volume free energy and the surface free energy, respectively; the simplest form of the volume free energy and the surface free energy of a two-phase system is given as follows:
Here, μ, w, and κ denote the constants, and for a two-phase system, μ >0 and w >0.
Figure 1 shows that the function f has two energy minima corresponding to the energy equilibrium states of the two phases, and if the volume energies of the two phases are equal, the depths of the two minima are also equal. This property can be used to model the kinetic process of the transition between the disorder and order, while φ can represent the lattice density of the phase:
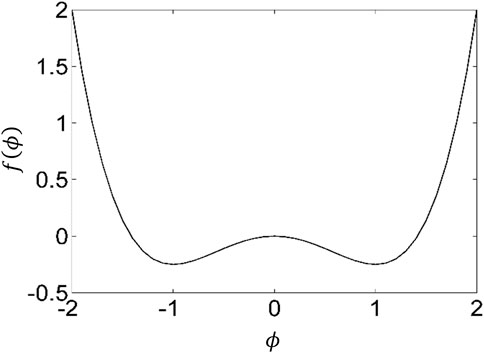
FIGURE 1. Volume free energy characterization of two-phase systems.
The aforementioned kinetic process includes the growth evolution of each phase in the region, and the values of the two phases correspond to ϕ = ±sqrt(|κ|w), respectively, while the values near the interface between the two phases vary continuously from ϕ = -sqrt(|κ|w) to ϕ = +sqrt(|κ|w), and the value of ϕ = 0 can be considered as the boundary between the two phases.
If we assume that the initial region of pore structure generation is randomly filled with pore particles and solid particles, there is only a repulsive force and no attractive force between these two particles; the volume free energy between them follows the simple form of F mentioned previously. Then, the dynamic phase separation process between pore particles and solid particles can be understood as the evolutionary process of solid skeleton and pore structure formation, in which homogeneous particles accumulate together because of the gravitational force and the heterogeneous particles separate because of the repulsive force. Therefore, to some extent, the physical characteristics of this two-phase separation process can be used to model the microstructure of the generated porous media, that is, the solid phase when ϕ >0 and the pore phase when ϕ <0.
For the aforementioned Langevin dynamics process, the statistical mean value of its noise term <H(r,t)≥0, i.e., the number of solid-phase particles and pore-phase particles applied to the computational region is equal at each iteration of the system, so that the percentage of pores will eventually converge to 50%. To obtain a smaller porosity in the dynamic evolution in order to reach the porosity range of an ordinary porous medium, the mean value of the noise is taken to be greater than zero in this paper, which means that more solid-phase noise is randomly applied to the computational region in each iteration. <H(r,t)≥0 ensures that the porosity of the system decreases continuously during the iterative process, as shown in Figure 3.
In this paper, the Box–Muller algorithm is used to generate random numbers, y1 and y2, with the mean value of 1, where the two random numbers (n1 and n2) are any numbers between 0 and 1 and are expressed as follows:
Thus, we have
In Eq. 8, Δ denotes the smooth length of the differential computation process, which is a size-dependent quantity. Substituting Eq. 8 into Eq. 6, we have
The computational area is selected to be a 100 × 100 × 100 lattice (the two-dimensional calculation area is 100 × 100), and the following simpler parameters are selected: μ= 1, kBT = 0.01, κ = 1, w = 1, and M = 1, considering Δ and η as control variables.
a. The phase function determines the distribution characteristics of the solid and pore phases in the back of the pore medium, i.e., ϕ >0 for the solid phase and ϕ <0 for the pore phase.
b. Euler’s number of the porous media: Euler’s number is a scalar quantity, numerically equal to the difference between the number of solid connected domains and the number of holes. It is a description of the spatial integrity of porous media, i.e., E = C-H, where E, C, and H denote Euler’s number, the number of connections, and the number of holes, respectively. In the geometric theory, the macroscopic form of a closed region can be measured by its topological properties. The connectivity of an image is a topological property, which is invariant after translation, rotation, stretching, compression, and torsion, so the number of holes in the region H and the number of connected regions C are the topological properties that can be measured by Euler’s number. Euler’s number is a topological measure of an image and is equal to the total number of all objects minus the number of holes in those objects. In this paper, we use the 4-neighborhood structure for calculation.
c. Pore fractal dimension: As a practical and potential tool, the fractal dimensional characteristics of porous media materials have been studied by many researchers. For a fractal structure, F(L) is the scale-dependent quantity; then, according to the scalar law, we obtain the following:
Here, F(L) denotes the surface area of the pores and D denotes the pore fractional dimensional value of this porous medium. For a three-dimensional object, when measured according to the length parameter δ0, it can be partitioned into N squares with self-similarity. Therefore, the pore fractional dimensional value D can be calculated according to the following equation:
The larger the pore fractional dimension value is, the more complex the boundary of the pore structure is.
In this numerical experiment, the evolution of the two-phase structure is calculated separately for nine parameter cases with a target porosity equal to 5% at the end of the set iteration. The topology of the two-phase structure (such as the basic size of the pores, pore fractal dimension, porosity, and Euler’s number) is analyzed using the variation law of the control parameters Δ and η of the system.
Figure 2 shows the variation in the Euler’s number of the two-phase structure with the number of iterations, and it can be seen that Euler’s number first decreases, then increases, and finally tends to 0 (Euler’s number equal to 0 means all solid phases), and the minimum Euler’s number reaches −87929 at the beginning of the iteration, which indicates that the number of pores is much larger than the number of solid objects at the beginning of the iteration. Because the solid and pore phases are randomly distributed at the beginning of the iteration, a higher Euler’s number indicates that the connectivity of the structure is poor.
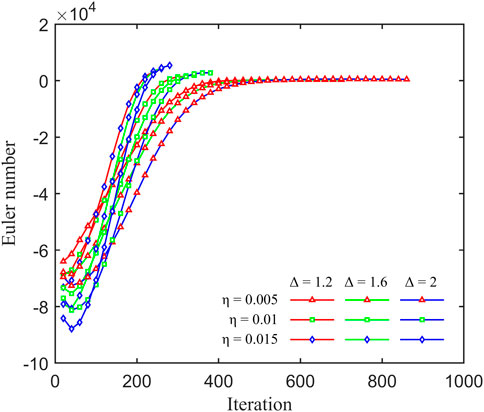
FIGURE 2. Euler’s number evaluation of the porous system.
During the iterative calculation, the two phases repel each other, while the same phases attract each other internally. Along with the applied noise (constant input of two-phase particles and more solid-phase particles when η >0), the phases separate from each other, smaller clusters are merged with larger clusters, and the number of solid objects slowly exceeds the number of pores. Because the mean value of the applied noise η is greater than 0, the pore phase shrinks continuously because of the increase in the solid-phase particles, and, finally, Euler’s number approaches 0, which means that the solid particles in the material are merged into one.
From Figure 2, it can be seen that the larger the η value is, the faster the rise in Euler’s number for Δ=1.2. This is because the larger the η value is, the more the solid-phase particles are added to the system and the faster the system evolves. When Δ = 1.6, Euler’s number of the system tends to fall and then rise rapidly at the beginning of the evolution because the larger the Δ value is, the larger the smoothing length is and the easier it is to swallow up the tiny pores or particles. It can be seen that this change is more obvious when Δ = 2. After reaching a very small value, the larger the Δ value is, the slower the rise in Euler’s number with a constant η value. In general, the smaller the smoothing length Δ, the larger the η value and the faster the approximation speed, while the larger the smoothing length Δ, the smaller the η value and the slower the approximation speed.
The variation curves of two-phase porosity with the number of iterations are given in Figure 3. The figure shows that the porosity decreases with the increase in the number of iterations, and the smaller the η value is, the slower the iteration converges, while the larger the Δ value is, the slower the porosity decreases for the same η value. Overall, it can be seen that the effect of η on porosity is greater than that of Δ.
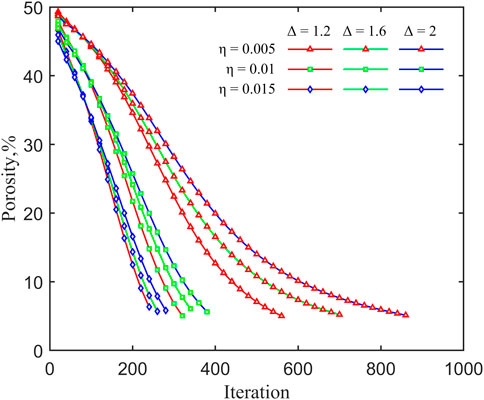
FIGURE 3. Porosity evaluation of the porous system.
Figure 4 shows the trend of the average pore length in the X-direction with the number of iterations in the 3D model. It can be seen that when η = 0.005, the average pore length in the X-direction increases with the number of iterations; when η = 0.01, the average pore length in the X-direction first decreases slowly with the number of iterations and then increases slowly after it reaches the minimum value; and when η = 0.015, the average pore length in the X-direction decreases rapidly with the number of iterations. When the target porosity is reached, the average pore length in the X-direction, corresponding to Δ = 1.2 and η = 0.005, is the largest, with a value of 3.71 μm, and the average pore length in the X-direction, corresponding to Δ = 2 and η = 0.015, is the smallest, with a value of 1.46 μm.
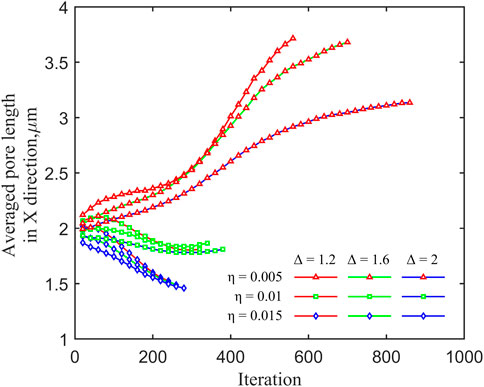
FIGURE 4. Averaged pore length in the X-direction evaluation of the porous system.
The variation curves of the 3D pore fractal dimension with the number of iterations are shown in Figure 5. It can be seen that at the beginning of the iteration, both the solid and pore phases are in the state of haphazard distribution due to the high structural Euler’s number. Therefore, the pore geometry is extremely complex, and the fractal dimension of the pore structure tends to be close to 3. When the target porosity is reached, the fractal dimension is 2.615 for a Δ value of 1.2, 2.683 for a Δ value of 1.6, and 2.766 for a Δ value of 2; when the target porosity is reached, the fractal dimension is 2.615 for a η value of 0.005.
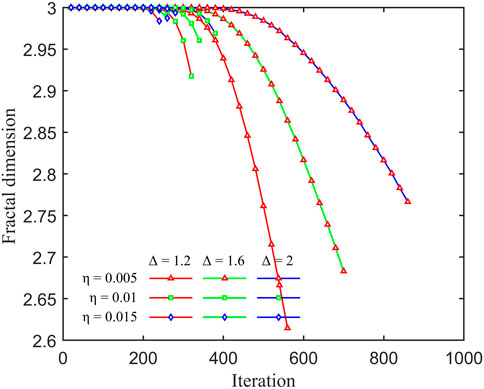
FIGURE 5. Fractal dimension evaluation of the porous system.
The relationship curves between Euler’s number and porosity are given in Figure 6. It can be seen from the figure that Euler’s number tends to decrease and then increase as the porosity decreases, and Euler’s number finally has positive values. The model with the η value of 0.005 and the Δ value of 1.2 has the slowest increase in Euler’s number, and the model with the η value of 0.015 and the Δ value of 2 has the highest increase in Euler’s number. The higher the Δ value, the slower the increase in Euler’s number with porosity when η is kept constant. The larger the η value, the slower the increase in Euler’s number with porosity when Δ is kept constant.
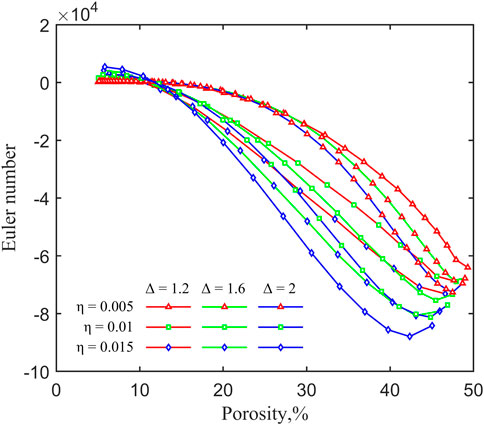
FIGURE 6. Euler’s number evaluation vs. porosity.
The curves of the variation in the average length of pores with the porosity in the X-, Y-, and Z-directions in the three-dimensional structure are given in Figure 7, Figure 8, and Figure 9, respectively. As can be seen from the figures, the trends of the average pore length in the three directions are basically the same, and the example of the X-direction is as follows: when η is 0.005, the average pore length in the X-direction decreases with the increase in the Δ value; the value is 3.72 μm when Δ is 1.2 and 3.13 μm when Δ is 2. When η is 0.015, the average pore length in the X-direction decreases with the increase in the Δ value; the value is 1.52 μm when Δ is 1.2 and 1.46 μm when Δ is 2. The average length of the pore in the X-direction decreases with the increase in the Δ value; the value is 1.46 μm when Δ is 2. In the same case, the average length of pores in the X-direction decreases essentially with increasing values of Δ, and the average length in the X-direction decreases essentially with increasing values of η.
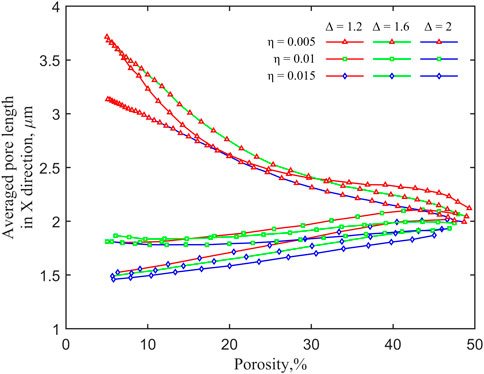
FIGURE 7. Characteristic length evaluation in the X-direction vs. porosity.
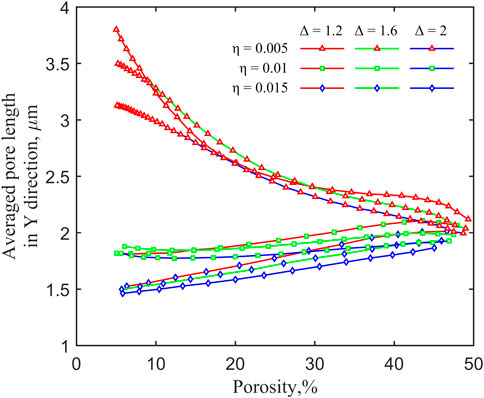
FIGURE 8. Characteristic length evaluation in the Y-direction vs. porosity.
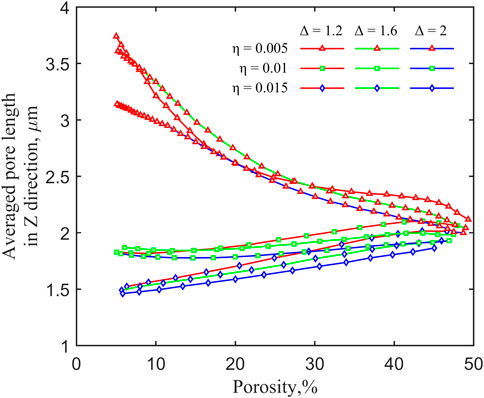
FIGURE 9. Characteristic length evaluation in the Z-direction vs. porosity.
Therefore, the generation of 2D/3D pore structures is intervened and controlled by controlling the values of η and Δ in order to obtain the complex geometrical structure of predicted red clay through mathematical iterations and image processing techniques.
Due to the lack of experimental conditions, 3D red clay microstructure data acquisition could not be carried out. In order to facilitate the aim of this study, the experiment was carried out based on the existing digital images of a certain red clay samples collected from Qixingguan, Bijie (e.g., Figure 10A), which has a more complex structural distribution. Its binarized pore structure image was obtained via the image processing technique; as shown in Figure 10B, the black part is the pore, and the white part is the clay matrix; its porosity is 9.48%, fractal dimension is 1.36, and Euler’s number is −92. Figure 10C shows that statistical histograms of pore diameters were carried out on the binarized pore image, and the pore is as long as the distribution of the pore, which is less than 4 μm. Figure 10D shows the microscopic pore structure image (Δ = 2 and η = 0.005) of red clay obtained by the simulation of the proposed method, with a simulated porosity of 9.53%, pore fractal dimension of 1.34, and Euler’s number of −85, and the histogram of its simulated microscopic pore distribution is shown in Figure 10E. Through comparisons, it is found that the method can better realize the simulation of the microscopic pore structure of red clay, and the simulated results can be well consistent with the real results obtained via electron microscope scanning and better describe its connectivity, porosity, and fractal dimension.

FIGURE 10. Pore structure of the red clay sample and the simulation result. (A) Digital photographs of red clay. (B) Microscopic pore structure of red clay (porosity = 9.48%). (C) Histogram of microscopic pore distribution. (D) Microstructure of red clay obtained by simulation (porosity = 9.53%, Δ = 2, and η = 0.005). (E) Histogram of simulated microscopic pore distribution (porosity = 9.53%, Δ = 2, and η = 0.005).
Although the microstructure of red clay is very complex and it is very difficult to obtain its real microstructural parameters, numerical modeling is a useful method. Previous modeling methods approximate the real porous medium by porosity and correlation function and do not consider other pore parameters. The proposed method can generate a micro-geometric model of the porous medium by controlling two parameters, Δ and η. Since the connectivity parameters of red clay samples are not available, this example is approximated according to a single parameter, porosity, in order to obtain an equivalent red clay microstructure model.
The numerical simulation results of the red clay microstructure are given in Figures 11–14 for four porosities (4.98%, 24.5%, 37.1, and 41.5% porosities, respectively). It can be seen that the three-dimensional red clay microstructure obtained from the simulation can be seen in green color for the red clay matrix, and the pores inside it are clearly visible. The red clay models with different microscopic pore structure characteristics can be obtained under different initial conditions as well as for different Δ and η values. The generated models better reproduce the high porosity ratio characteristics of red clay, and various mechanical calculations can be performed based on these characteristics.
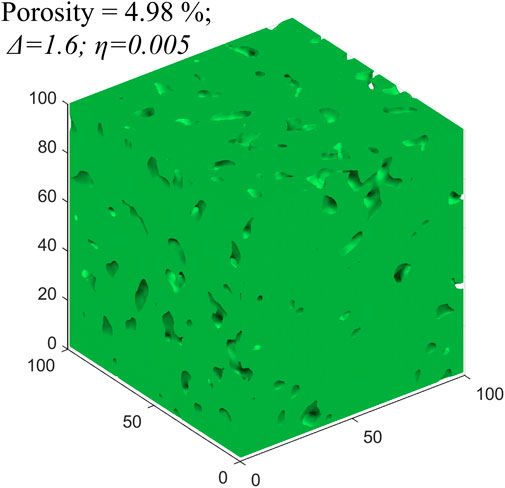
FIGURE 11. Three-dimensional simulation of the microporous structure of red clay (example 1).
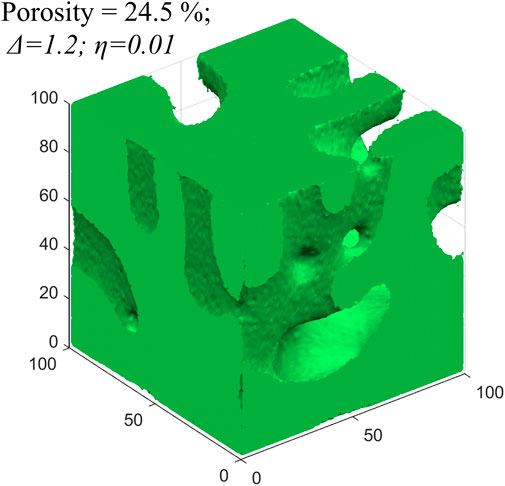
FIGURE 12. Three-dimensional simulation of the microporous structure of red clay (example 2).
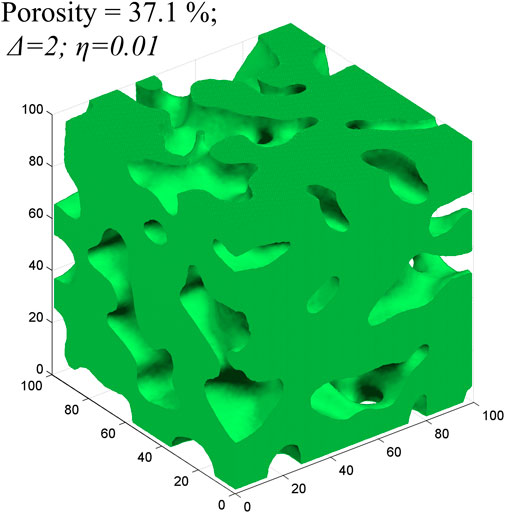
FIGURE 13. Three-dimensional simulation of the microporous structure of red clay (example 3).
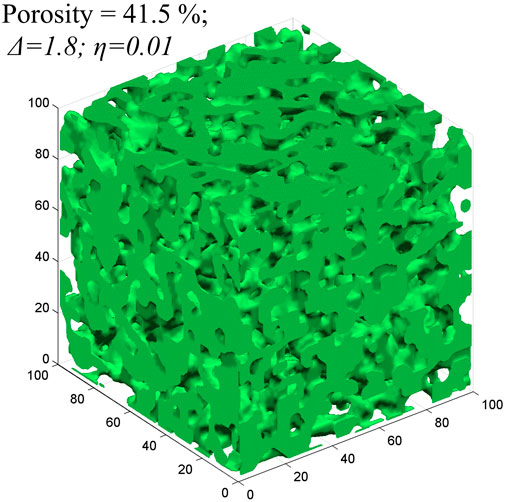
FIGURE 14. Three-dimensional simulation of the microporous structure of red clay (example 4).
It can be seen that the proposed method can better simulate the randomness of the red clay porous media structure; this method is not only limited to the simulation of a three-dimensional red clay pore structure; in fact, the smaller the η and Δ values are, the larger the size of the pore will be; in contrast, the larger the Δ and η values are, the smaller the size of the pore will be; with the increase in the number of iterations, the pore structure will gradually be replaced by the solid phase and, at the same time, because the η value itself shows a random rise and fall, it can reflect the random fractal characteristics of the pore structure. Therefore, it is possible to generate porous media models with different pore structures by controlling the magnitude of these two parameters.
The presence of the red clay terrain in Guizhou Province, China, and the inherent characteristics of red clay and the complexity of its structure have forced the development and refinement of new models to describe it. In this paper, a new stochastic dynamics method for simulating the generation of microstructures of such porous media is proposed. The conclusions are as follows:
(1) Starting from the formation process of red clay, it is found that its microstructure is the result of the joint action of aggregation and granulation of its internal microcluster particles, and its microporous structure can be described by the Langevin process, and a relevant model is established. By changing two control parameters (Δ and η), the changes in the pore structure-related parameters such as porosity, pore characteristic length, Euler’s number, and pore fractal dimension, during this stochastic kinetic process, were investigated, and their interrelationships were compared and analyzed.
(2) It is found that the reduction in porosity of the porous media can be accelerated by controlling the average value of the random rise and fall phase, and the size of the pore structure can be increased by reducing the value of Δ.
(3) Through the approximation of porosity, the microscopic pore structure of red clay in Bijie, Guizhou, was simulated numerically, and the proposed method can better simulate the microscopic structure of real samples.
The original contributions presented in the study are included in the article/Supplementary Material; further inquiries can be directed to the corresponding author.
XZ conceptualized and devised the methodology. JZ prepared the original draft. XL and XR reviewed and edited the manuscript. XZ supervised the study. All authors contributed to the article and approved the submitted version.
This work was supported by the funding from the Basic Research Program of Guizhou Province (ZK [2022] General 166), the Teaching Content and Curriculum Reform Project of Higher Education Institutions in Guizhou Province (2022304), the Technology Top Talent Support Project of the Guizhou Provincial Education Department ([2020]155), the Research and Development Project of the Guizhou University of Engineering Science (G2018016), the University Student Innovation and Entrepreneurship Training Program Project (s202210668178), the Bijie City Science and Technology Project, and the Joint Fund Project ([2023] 54).
The authors declare that the research was conducted in the absence of any commercial or financial relationships that could be construed as a potential conflict of interest.
All claims expressed in this article are solely those of the authors and do not necessarily represent those of their affiliated organizations, or those of the publisher, the editors, and the reviewers. Any product that may be evaluated in this article, or claim that may be made by its manufacturer, is not guaranteed or endorsed by the publisher.
Cai, G. Q., Wang, Y. N., Zhou, A. N., and Zhao, C. G. (2018). A microstructure-dependent hydro-mechanical coupled constitutive model for unsaturated soils. Yantu Gongcheng Xuebao/Chinese J. Geotechnical Eng. 40 (4), 618–624. doi:10.11779/CJGE201804005
Cai, G., Liu, Y., Xu, R., Li, S., and Zhao, C. (2021). Microstructural changes in red clay on drying-wetting paths. Chin. Sci. Tech. Sci. 51 (2), 221–230. doi:10.1360/sst-2020-0203
Guo, L. X., Zhang, C. L., Yang, D. G., and Li, T. L. (2017). Discontinuous deformation analysis with microstructural model for axial odometer test of loess. J. Yangtze River Sci. Res. Inst. 34 (3), 80–84. doi:10.11988/ckyyb.20151103
He, W., Xue-jun, C., Yu, S., Li-jie, C., and Xiang, H. (2018). Effect of external admixture on microstructure and brittleness index of red clay. Sci. Technol. Eng. 18 (035), 212–216. doi:10.3969/j.issn.1671-1815.2018.35.036
Jiaming, L., Xuejun, C., Xiang, H., Yicheng, C., and Sizhe, Y. (2020). Mechanical properties and microstructure tests of zinc-contaminated red clay. J. Henan Univ. Sci. Technol. Sci. 41 (2), 99–97. doi:10.15926/j.cnki.issn1672-6871.2020.02.017
Jie, Z., Changliang, Z., Ping, L., Tonglu, L., Zhitian, Q., and Qiang, L. (2021). Microscopic discontinuous deformation of structured loess under compression. J. Yangtze River Sci. Res. Inst. 38 (5), 123–128. doi:10.11988/ckyyb.20200506
Jinghe, T., Jiansen, S., and Huiqiang, L. (2018). Influence of sand and fly ash contents on the properties of guilin red clay mixtures. Soil Eng. Found. 32 (5), 524–524.
Jun, C., Qi, W., Mingyuan, Y., Minghu, W., Bin, G., and Ji, D. (2018). Laboratory tests for shear strength and fracture surface microstructure of alkali contaminated red clay. J. Eng. Geol. 26 (05), 1300–1310. doi:10.13544/j.cnki.jeg.2018158
Ke, X., Zhi, W., Xiaohan, M., Mingli, Z., Qiang, G., and Nan, S. (2019). Effect of freezing on the microstructure of Qinghai-Tibet red clay and Lanzhou silt. J. Glaciol. Geocryol. 41 (5), 1122–1128. doi:10.7522/j.issn.1000-0240.2019.0327
Li, X. (2021). Study on microstructure and mechanical properties of microbially modified expansive soils. M.S. Central South University of Forestry Science and Technology. Changsha, China.
Liu, Z., Zhou, C. Y., Zhu, F. X., Zhang, L., and Yu, R. J. (2011). Critical criterion for microstructure evolution of soft rocks in softening process. Yantu Lixue/Rock Soil Mech. 32 (3), 661–665. doi:10.3969/j.issn.1000-7598.2011.03.004
Mou, Chunmei, Zhang, Lu, Yuxi, Wei, and Fu, Qing (2021). Microstructural evolution of the red clay contaminated by NH3 ·H2 O in Guilin. J. Guangxi Univ. Nat. Sci. Ed. (2), 259–259. doi:10.13624/j.cnki.issn.1001-7445.2021.0259
Pan, Tai, Zhao, Guitao, and Huang, Ying (2021). Effect of pH value on mechanical properties and microstructure of yunnan laterite. Silic. Bull. 40 (10), 3427–3429. doi:10.16552/j.cnki.issn1001-1625.20210609.004
Ping, L., Qiang, L., Tong-lu, L., Zhi-tian, Q., Wei, S., and Jie, Z. (2020). A method for generating two-dimensional microstructure model of loess based on Monte Carlo method. J. Yangtze River Sci. Res. Inst. 37 (4), 79–84. doi:10.11988/ckyyb.20190035
Qi, W., Jun, C., Peng, Z., Pengchao, S., and Yunbin, S. (2017). Experimental study on physical properties and microstructure of red clay polluted by alkali. Tunn. Undergr. Space Technol. 13 (6), 1483–1492.
Taixu, C., Yun, C., Yunbin, S., Wensheng, B., Zhonghu, W., and Tingting, W. (2019). Study of microstructure and fractal characteristics of existing foundation red clay particles based on SEM images. Carsologica Sin. 38 (4), 635–638. doi:10.11932/karst20190424
Tan, L. R., and Kong, L. W. (2001). Fundamental property and microstructure model of red clay. Chin. Jounal Geotechnical Eng. 23 (4), 458–462. doi:10.3321/j.issn:1000-4548.2001.04.016
Tan, Y., Yu, B., Liu, X., Wan, Z., and Wang, H. (2015). Pore size evolution of compacted laterite under desiccation shrinkage process effects. Geotechnics 36 (2), 369–367. doi:10.16285/j.rsm.2015.02.010
Tang, C., Shi, B., Chun, L., Wang, B., and Gao, W. (2007). Developing law and morphological analysis of shrinkage cracks of clayey soil under different temperatures. J. Geotechnical Eng. 29 (5), 743–749. doi:10.1142/9789812709455_0004
Tao, L. I., Liu, B., Yan, L. I., and Peng, L. I. (2011). The void ratio of saturated red clay calculated from a micro-structure model. J. China Univ. Min. Technol. 40 (5), 720–725. doi:10.1007/s10565-010-9168-0
Wang, Y. (2020). Microstructure and mechanical properties of artificially cemented red clay. PhD. Guilin University of Technology. Guilin, China.
Zhang, X., Li, L., and Han, L. (2019). Microporous media model generated by using Langerin's equation. Sci. Technol. Eng. 19 (6), 222–230. doi:10.3969/j.issn.1671-1815.2019.06.035
Zhou, Y., Liu, X., Liang, Z., and Zhang, D. (2012). Study of micro-structure model of red clay and its engineering mechanical effect. Chin. J. Undergr. Space Eng. 8 (4), 726–721. doi:10.11835/j.issn.1000-582X.2014.06.003
Keywords: red clay, porosity, stochastic dynamics, numerical simulation, microstructure
Citation: Zhang X, Zhang J, Li X and Ren X (2023) Stochastic dynamics construction of a three-dimensional microstructure of red clay. Front. Earth Sci. 11:1222959. doi: 10.3389/feart.2023.1222959
Received: 23 May 2023; Accepted: 17 August 2023;
Published: 01 September 2023.
Edited by:
Chao Liu, Nanjing University of Information Science and Technology, ChinaReviewed by:
Shiwen Teng, Ocean University of China, ChinaCopyright © 2023 Zhang, Zhang, Li and Ren. This is an open-access article distributed under the terms of the Creative Commons Attribution License (CC BY). The use, distribution or reproduction in other forums is permitted, provided the original author(s) and the copyright owner(s) are credited and that the original publication in this journal is cited, in accordance with accepted academic practice. No use, distribution or reproduction is permitted which does not comply with these terms.
*Correspondence: Jiabing Zhang, empiMjJAbWFpbHMuamx1LmVkdS5jbg==
Disclaimer: All claims expressed in this article are solely those of the authors and do not necessarily represent those of their affiliated organizations, or those of the publisher, the editors and the reviewers. Any product that may be evaluated in this article or claim that may be made by its manufacturer is not guaranteed or endorsed by the publisher.
Research integrity at Frontiers
Learn more about the work of our research integrity team to safeguard the quality of each article we publish.