 Xiangdong Niu
 Huafen Sun1,2*
95% of researchers rate our articles as excellent or good
Learn more about the work of our research integrity team to safeguard the quality of each article we publish.
Find out more
ORIGINAL RESEARCH article
Front. Earth Sci. , 25 July 2023
Sec. Environmental Informatics and Remote Sensing
Volume 11 - 2023 | https://doi.org/10.3389/feart.2023.1221404
This article is part of the Research Topic Coal and Rock Dynamic Disasters: Advances of Physical and Numerical Simulation in Monitoring, Early Warning, and Prevention, volume II View all 29 articles
The nature of fine particulate matter is caused by the deterioration of the lean ore loss index and the important influence factors of a mine disaster accident. In this paper, fine moraine particles and coarse-grained ore from the Pulang Copper Mine are studied. The flow of fine particles in mixed particles under the condition of uniform ore drawing was studied by using the laboratory 3D physical model test method. This experiment explored the flow of hybrid particles in the system and characteristics of the particle size of fine particles passing through, and suggested a transit index to quantify the draining effect of fine particles. The experimental results show the following: ①Hybrid particles in the flow system of fine particulate matter under their own gravity use mixed ore particles flow in the process of formation of the pore to implement down through sports. ②The fine particles with the particle sizes of 2.5–1.25 mm, 1.25–0.63 mm, 0.63–0.315 mm, and 0.315–0.16 mm all have the flow-through characteristics, and the smaller the particle size, the more significant the flow-through degree. ③The cumulative ore drawing height of fine particles with different particle sizes increases, while the permeability index of the appropriate discharge decreases. ④The relative motion of coarse and fine particles is the internal control factor that leads to the flow of fine particles. The more significant the relative motion of coarse and finely mixed particles is, the more pores are randomly generated in the particle flow system and the larger the pores are, resulting in the more obvious fine particle flow effect. This study provides some theoretical reference value for revealing the flow-through characteristics of the fine particulate matter in the mixed particle flow system. At the same time, it has practical engineering significance for ore lean loss index control and mine disaster accident prevention and control in caving mining.
Mixed particles refer to particle aggregates composed of two-phase or multi-phase particles, and are randomly and disorderly arranged in the particle flow system (Li et al., 2021; Rong et al., 2021; Xing et al., 2022; Xu et al., 2022). The phenomenon of flow-through of mixed particles widely exists in nature and industries. It not only occupies an important position in metallurgy, ceramics, powder, and other industries (Ma et al., 2020; Ma et al., 2022; Ma et al., 2023) but also has extremely important significance in the study of mine disaster accidents and ore loss control. In the caving method, mines in some special areas have the surface covering layer composed of fine granular material. During the mine production process, the fine particles of the surface covering layer are continuously mixed into the caving ore layer to form a two-phase or multi-phase mixed particle flow system (Huang et al., 2020; Niu et al., 2020; Zhang et al., 2023). In mines that switch from open-pit to underground mining, a particulate material covering layer is often formed on the isolation pillar to form a buffer cushion. During the production process, the covering layer particulate material will also be mixed into the ore at the ore–rock interface to form a mixed particle flow system (Zhang and Cheng, 2017; Lu et al., 2021; Zhang and Gao, 2021; Li et al., 2023). The flow characteristics of the fine particles of the overburden layer in the caving ore directly affect the ore loss and dilution index, and even cause the underground debris flow disaster, which belong to the research category of mixed particles.
At present, scholars at home and abroad have paid attention to the related research on the mixed particle flow. Scholars in different research fields have carried out related research on this issue using indoor physical experiments and numerical simulation methods. Pierce et al. (1994) and Pierce et al. (2019) studied the phenomenon of small particle permeation in the ore-drawing process by the numerical simulation method. When the ore drawing is disturbed, the small particles will flow through the pores between the large particles. Hashim (2011) used Kvapil A’s physical model to study the effects of particle shape, particle size, density of states, and other factors on the particle flow. Ketterhagen et al. (2008) studied the flow-through behavior of coarse and fine particles under the action of gravity, and carried out quasi-3D model simulation-related research from factors such as particle material parameters, particle contact coefficients, and particle construction methods in the model. Based on the non-Newtonian fluid theory, Christopher (2009) studied the relationship between displacement and velocity of a fine-grained medium flowing through the ore drawing process from the perspective of theoretical mechanics. Li et al. (2016) used discrete element software to discuss the seepage law of fine particles during the overburden of waste rock during the ore-drawing process. The results show that the seepage rate of fine particles is higher than that of coarse particles. Hou et al. (2016) used indoor ore-drawing experiments to explore the flow rule of fine particles and found that the flow phenomenon of fine particles was obvious during the ore-drawing process. Jin et al. (2020) studied the flow characteristics of particles with uneven particle size distribution, and the results showed that particle inhomogeneity has a significant effect on the flow-through of fine particles. Ren et al. (2020) used high-speed camera technology to study the flow characteristics of tailings in the collapse area under the condition of ore drawing. By constructing the spatial distribution model of the particle size of overburden, the influence of rock mixing is studied by You and Zhang (2016). The downward motion of the particle is faster than that of the larger particles. Li (2020) simulated the “Cross-flow” phenomenon of fine particles in the ore-drawing process by numerical simulation software. The simulation results show that the larger the overburden block, the more obvious the fine particle migration. The application of 60 cm–80 cm waste rock overburden can effectively slow down the flow of fine particles in the ore-drawing process. Wang et al. (2019) used PFC3D discrete element software to investigate fine particle migration in the backfill. The results show that fine particle migration is more likely to occur in the 30 cm–70 cm block backfill during ore drawing. The fragmentation of overburden and backfill has a significant effect on fine particle migration, and the effect of the overburden bulk is highly significant.
Although scholars at home and abroad have achieved certain research results on the flow-through characteristics of mixed particles, most of them use numerical simulation methods, and most of the physical models are limited to the two-dimensional single-bucket ore-drawing model, which cannot fully reflect the flow-through of real particles. In addition, although scholars at home and abroad have studied the flow-through of fine particles, but also a consistent conclusion, that is, fine particles in the ore-drawing process, there are certain cross-flow phenomena. However, what is the extent of fine particles flowing through the ore during ore drawing? What is the amount of fine particles passing through? What indicators are used to measure the degree of penetration of fine particles? The problems raised by the aforementioned authors have not been studied in-depth. Therefore, in view of the deficiency of the research methods on the fine particle flow-through characteristics and the unstudied problems on the fine particle flow-through characteristics at present, this paper conducts a deep research on the fine particle flow-through characteristics. In this paper, using the indoor three-dimensional physical model test method, taking the fine-grained moraine and coarse-grained ores of various particle sizes in the surface overburden of the Pulang Copper Mine as the research object, the experimental study on the flow-through characteristics of mixed particles under the condition of multi-bucket uniform ore drawing was carried out. The characteristics and laws of the flow of fine particles of each size in the coarse and finely mixed particle flow systems were explored.
The Plan Copper Mine, which belongs to Yunnan Diqing Non-ferrous Metal Co., Ltd., is a thick, large and low-grade porphyry copper deposit. The mine uses natural caving and has an annual production capacity of 12.5 million tons. Figure 1 shows that the height of the bottom structure is 16 m, the spacing of the ore-drawing and vein-crossing roadways is 30 m, the spacing of the ore-drawing route is 15 m, and the size of the ore-drawing exit (width × height) is 4.2 m × 4.2 m. In order to avoid the moraine particles from the Quaternary system mixing into the caving ore bed prematurely, a uniform ore-drawing management model is adopted in the production process. The average thickness of the ore bed overlying the bottom structure of the mine is about 80 m, and the average thickness of quaternary moraine is about 15 m. The indoor 3D physical model was designed and fabricated using a 1:100 similarity ratio.
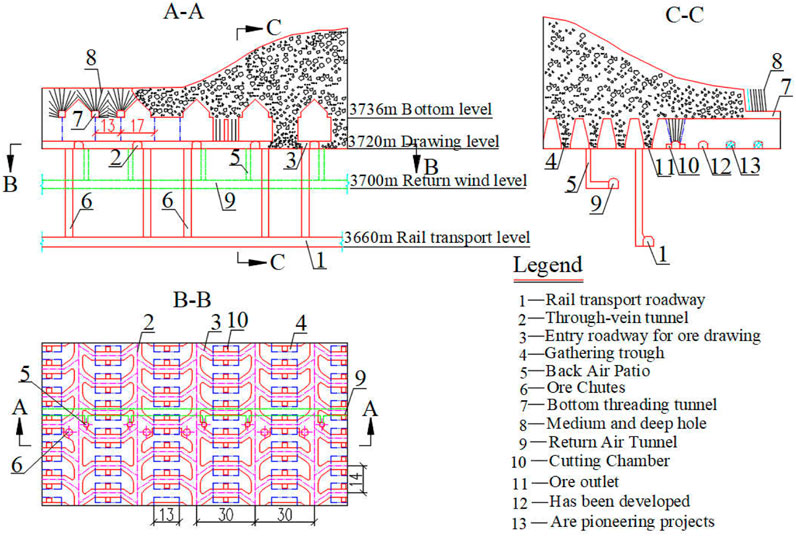
FIGURE 1. Mining method map of the Plan Copper Mine (unit: m).
In order to facilitate the observation of the flow characteristics of fine moraine particles in the mixed particle flow system during the test, the test device uses a transparent acrylic sheet material. The indoor 3D physical model test device mainly includes an acrylic plate frame, a bottom structure, and camera system, as shown in Figure 2. The size of the ore-drawing test model is 75 cm × 45 cm × 150 cm (length x width x height). The bottom structure of the model is arranged with three ore-drawing ports (1#, 2#, and 3#), and the size of the ore-drawing port is 4.2 cm × 4.2 cm.
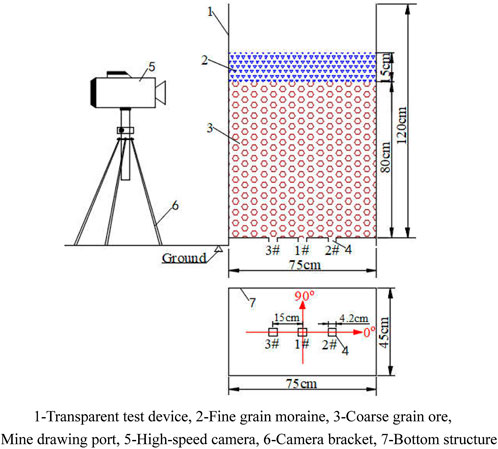
FIGURE 2. Design of the indoor 3D physical model test device.
The Pulang Copper Mine is mined by the natural caving method, and the caving ore is drawn under the Quaternary moraine particle covering layer on the surface. During the mine production process, the fine moraine particles in the surface covering layer are continuously mixed into the caving ore layer, and a two-phase or multi-phase mixed particle flow system has been formed. Therefore, the coarse- and fine-grained media (fine-grained moraine and coarse-grained ores) used in this experiment are all obtained from the sampling material at the Pulang Copper Mine site. Photographs of field sampling are shown in Figure 3.
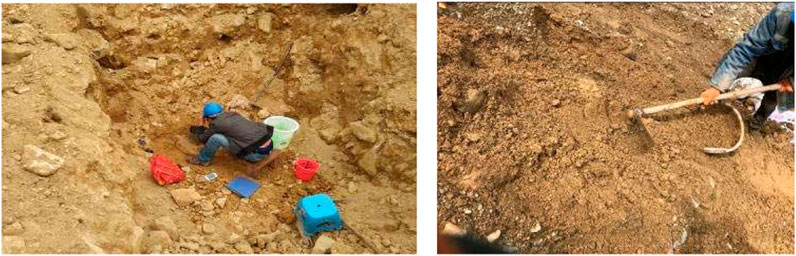
FIGURE 3. Site sampling photographs of the Pulang Copper Mine.
The particulate medium used in the test was obtained by sieving the sampled particulate matter with a standard sieve (implementation standard JGJ52-2006). Table 1; Figure 4 show the gradation of the experimental coarse and finely mixed particle media. The characteristic particle size parameters of the coarse and fine granular media are shown in Table 2. From the analysis of Table 2, it can be seen that the coefficient Cu=18.75 > 5 of the coarse and fine particles is uneven, and the curvature coefficient Cc=6.16 ∉(1,3) is discontinuous. It shows that the particles after highly discrete particles mixing belong to coarse and fine. In addition, fine moraine is easy to fill in the pores formed by the coarse ore. The mixture particles selected in the experiment can realize the cross-flow behavior.
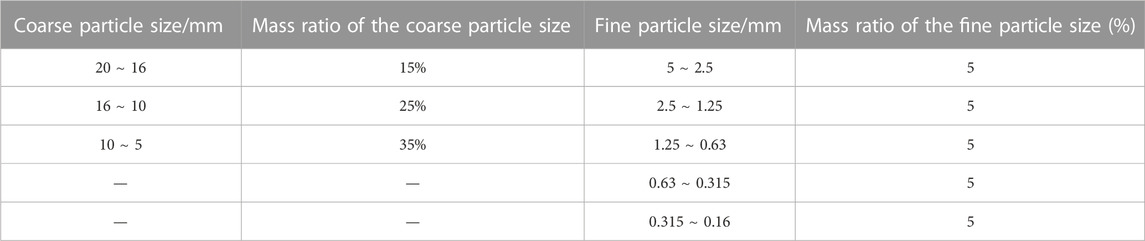
TABLE 1. Statistical table of particle size and the mass ratio of experimentally mixed granular media.
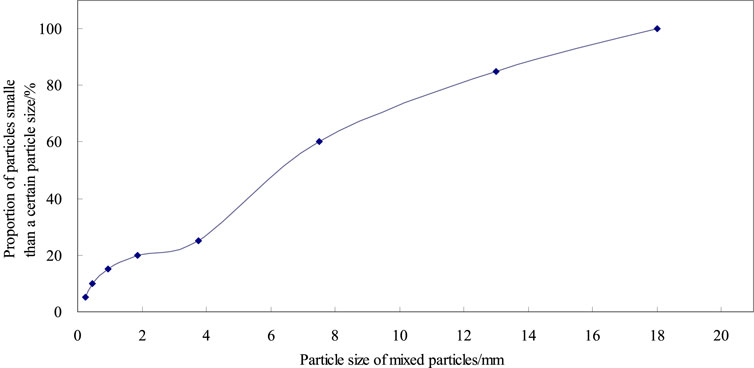
FIGURE 4. Test coarse and finely mixed particle gradation curve.
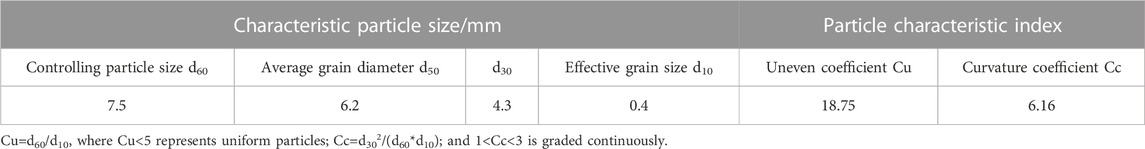
TABLE 2. Parameter table of characteristic particle size of coarse and fine granular media.
In addition, the natural angle of repose and the Water Content Index of the mixed particles used in the experiment have an important effect on the cross-flow of fine particles. The natural resting angle is the maximum angle at which the bulk can keep the natural stable state when stacked. The average natural resting angle of the mixture particles was 36°. The average moisture content of the mixture particles was 5%.
The ore-drawing process of the test is carried out in sequence according to the 1#→2#→3# ore-drawing openings. Until the mixed granular medium in the model device is completely discharged, the discharge amount of each ore-drawing port remains basically the same so as to achieve a simulated uniform ore-drawing environment. The specific test process is as follows:
①A standard sieve is used to screen the sampled particulate matter. Figure 5A shows fine moraine and coarse ore with different particle sizes after screening.
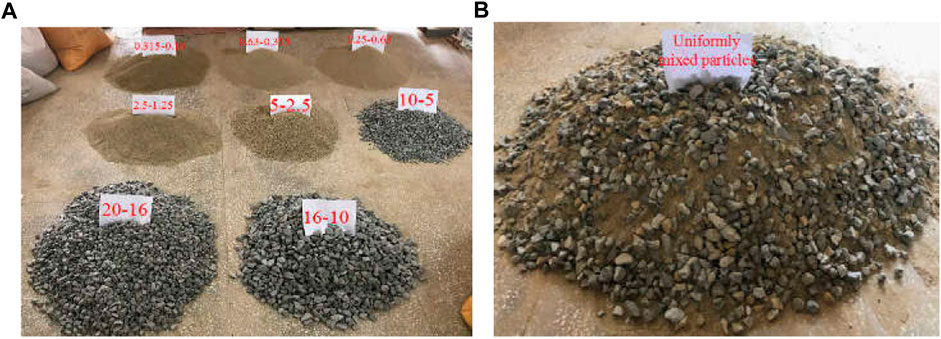
FIGURE 5. Fine-grained moraine and coarse-grained ore test media. (A) Test particle media with different particle sizes after sieving. (B) Homogeneous mixing of test particles.
②Proportion in accordance with the mass ratio of particles with different particle sizes is shown in Table 1. Moreover, fully and uniformly proportioned particles are mixed. The uniformly mixed particles are shown in Figure 5B.
③The coarse and finely mixed particles were loaded into the physical test model by the central quadrant method (Penfound, 1963; Raj and Thakur, 2016). In the filling process of mixed particles, in order to ensure the uniformity of mixed particles in each filling, a multiple-loading method is adopted. In the model test, the loading height of the mixed particles was 80 cm. The test model of the mixed particles after loading is shown in Figure 6.

FIGURE 6. Packed mixed particle test model.
④After the aforementioned test steps are completed, the ore-drawing stage begins. Then, 2# and 3# ore-drawing ports are closed, and 1# ore-drawing port and drawing ore are opened. When ore drawing at No.1 ore-drawing hole is finished, the discharged particulate matter shall be screened immediately, the screened particulate matter with different particle sizes shall be weighed, and the quality of each particle size discharged at this time shall be recorded.
⑤Then, 1# and 3# ore-drawing ports are closed, and 2# ore drawing port and draw ore are opened. When ore drawing at No.1 ore-drawing hole is finished, the discharged particulate matter shall be screened immediately, the screened particulate matter with different particle sizes shall be weighed, and the quality of each particle size discharged at this time shall be recorded.
⑥Thereafter, 1# and 2# ore-drawing ports are closed, and 3# ore-drawing port and draw ore are opened. When ore drawing at No.1 ore-drawing hole is finished, the discharged particulate matter shall be screened immediately, the screened particulate matter with different particle sizes shall be weighed, and the quality of each particle size discharged at this time shall be recorded.
⑦Then, 1#→2#→3# ore-drawing hole is called an ore-drawing cycle when all ore-drawing holes are finished once. Steps ④
During the uniform ore-drawing test, the movement of the moraine and ore particles is extremely complicated. In order to avoid the influence of other factors on the test results during the model test ore drawing, this experiment explains some possible influencing factors and makes the following assumptions: ①In order to ensure that the test particle medium has good fluidity, the moraine and ore particles used in the test have been air-dried and there is no cohesion between the particles. ②Due to the high strength of ore particles, the effect of secondary crushing is ignored in the process of uniform ore drawing. ③The cent quartering method is adopted to load the test particles in different times, and the flow of fine particles did not occur during the filling process, ignoring the influence of artificial filling.
After each release of the coarse and finely mixed particles, immediately a standard sieve is used to sieve the released mixed particles, and weigh them, respectively, to obtain the mass of the coarse and fine particles released at that time. There is a slight difference in the amount released each time. The “Normalization Method” of formula (1) is used to process the test data to obtain the mass ratio of the coarse and fine particles released in the current time (Xu and Li, 2020; Wang et al., 2023).
Formula:
In order to compare the flow-through effect of fine particles with different sizes more intuitively, a preliminary quantification method for the flow-through characteristics of fine particles with different sizes in the process of ore drawing is proposed. To quantify the significant degree of permeation of fine particles of each particle size by the permeation flow, the permeation degree is expressed as follows:
Formula:
The degree of flow through can quantify the significant degree of flow through of the fine particles of each size in the mixed particles. The larger the value of flow-through, the more obvious the flow of fine particles. When the permeation degree
The cycle of ore-drawing ore in sequence according to the 1#→2#→3# ore-drawing opening is called an ore-drawing cycle. A total of four ore-drawing cycles were carried out in the whole test process, as shown in Figure 7. Table 3 shows the current release flow-through of the fine particles of each particle size in the mixed particles. Figure 8 shows the relationship between the current discharge flow rate of fine particles of each particle size and the number of times of ore drawing.
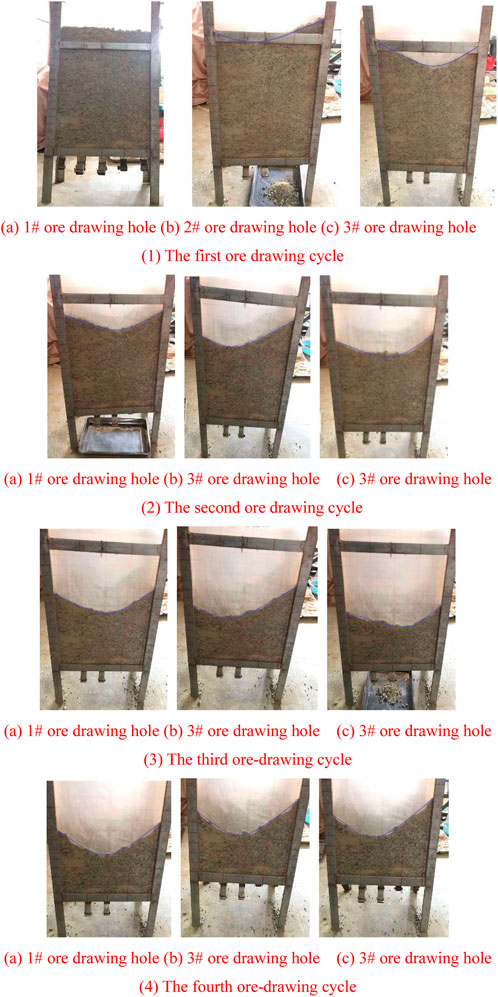
FIGURE 7. Whole test process of four ore-drawing cycles.
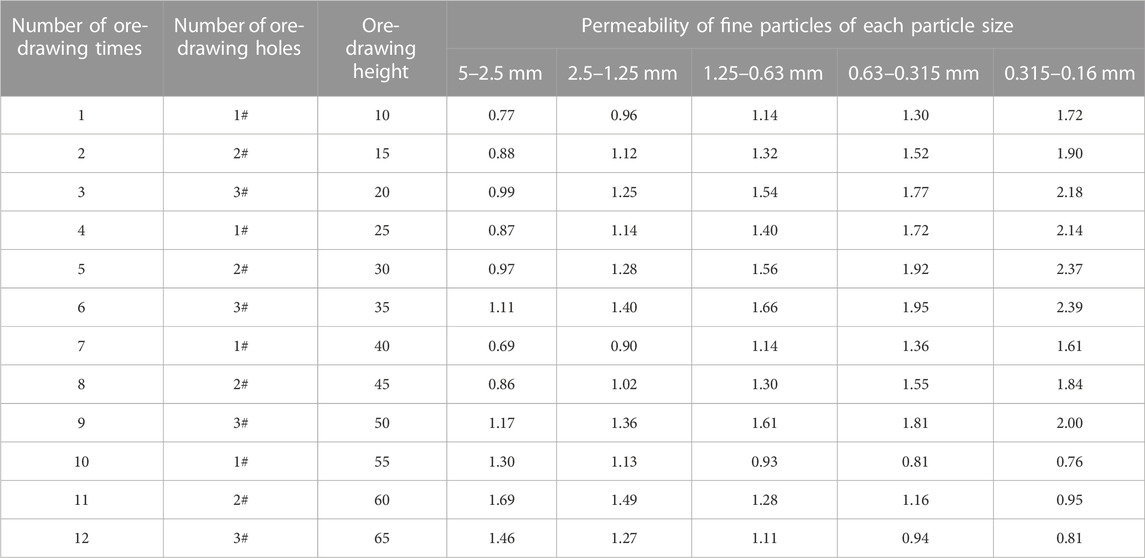
TABLE 3. Current discharge flow-through of the fine particles of each particle size in the mixed particles.
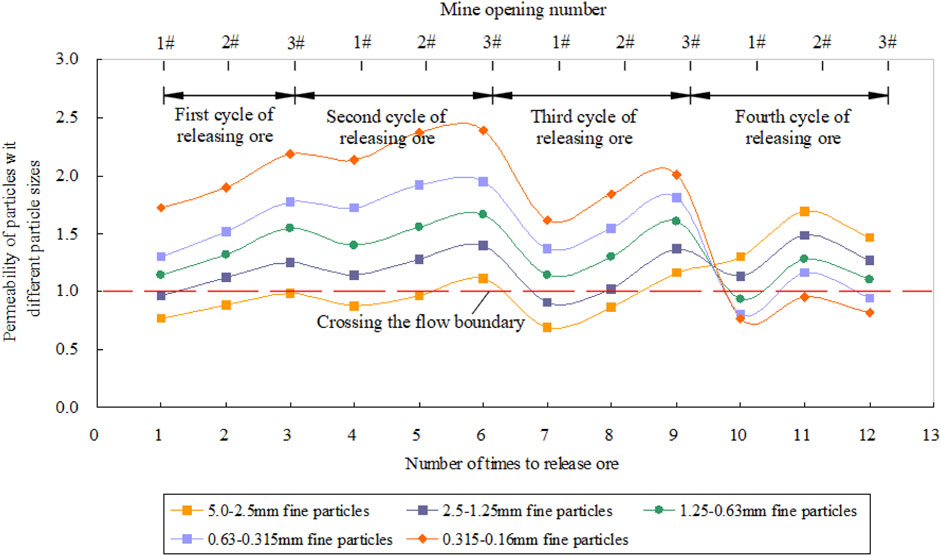
FIGURE 8. Relationship between the current penetration of fine particles of each particle size and the number of ore drawings.
Analysis of Figure 8 shows that the current penetration of fine particles of 5.0–2.5 mm in the first to the third ore-drawing cycles fluctuates around the boundary line 1 of the penetration. It is basically below the flow boundary 1, and its flow degree is less than 1. It shows that 5.0–2.5 mm fine particles do not have flow-through characteristics in the pores of 5–20 mm coarse-grained medium. For fine particles of 2.5–1.25 mm, 1.25–0.63 mm, 0.63–0.315 mm, and 0.315–0.16 mm, the current penetration values of the first ore-drawing cycle to the third ore-drawing cycle are basically at the penetrating boundary line 1 above. It shows that it has the characteristics of flow-through, and the smaller the particle size of fine particles, the larger the index of flow-through and the more obvious is the degree of flow-through.
Figure 8 also shows that 2.5–1.25 mm, 1.25–0.63 mm, 0.63–0.315 mm, and 0.315–0.16 mm are fine particles with flow-through characteristics. During the flow process of each particle size, fine particles from the first ore-drawing cycle to the third ore-drawing cycle; with the increase of the times of ore-drawing cycles, the value of cross-flow increases first and then decreases. In the fourth ore- drawing cycle, with the continuous release of the medium and fine particles in the coarse particles, the fine particles are continuously reduced and there is no continuous replenishment, resulting in a continuous increase in the amount of released coarse particles. Therefore, there is a phenomenon that when the medium with coarse particles is released, the permeability value is larger than that of fine particles.
According to the characteristics and rules of the flow of fine-grained media with different particle sizes in Figure 8, the four ore-drawing cycle test processes for uniform ore drawing are divided into the following four stages: the first ore-drawing cycle is the downward flow stage of fine particles, the second ore-drawing cycle is the fine particle flow and convergence stage, the third ore-drawing cycle is the continuous flow stage of fine particles, and the fourth ore-drawing cycle is the coarse particles’ late release stage.
Figure 9 shows the relationship between the current penetration value and the cumulative drawing height of fine particles of 2.5–1.25 mm, 1.25–0.63 mm, 0.63–0.315 mm, and 0.315–0.16 mm. It can be seen that during the flow of fine particles from the first ore-drawing cycle to the third-ore drawing cycle, the current discharge flow rate of each particle size and fine particle increases first and then decreases with the cumulative ore-drawing height changing trend. Among them, in the second ore-drawing cycle, the value of permeation is the largest and the phenomenon of permeation is the most obvious.
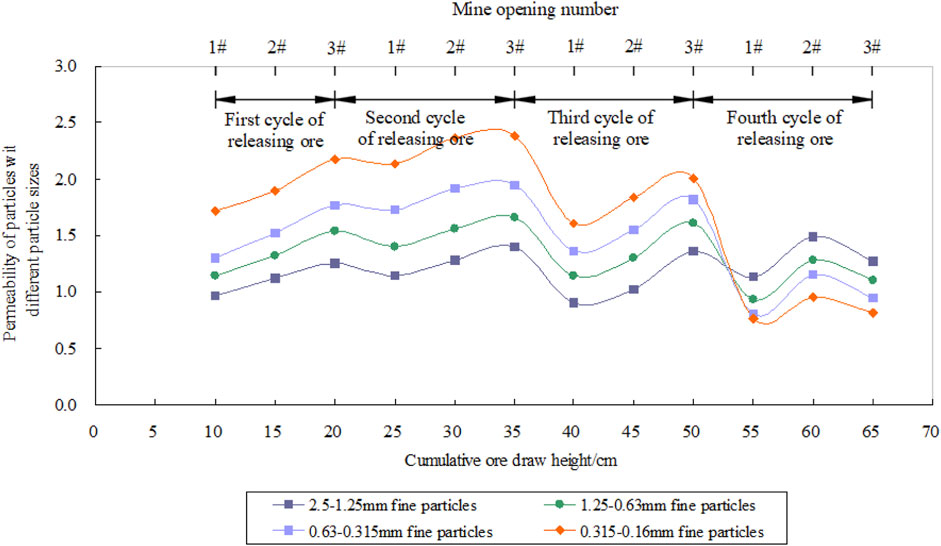
FIGURE 9. Relationship between the current penetration value of the fine particles of each particle size and the cumulative drawing height.
Before ore drawing, the coarse and fine particles in the test model are distributed uniformly in theory. With the continuous ore drawing, the cumulative height of ore drawing increases gradually. The test model of the mixture of coarse and fine particles was continuously released during the process. At first, the fine particles flew down the pores of the coarse particles, which makes the fine particles move before the bottom of the coarse particles model and converge continuously, and finally release from the ore-drawing mouth. As a result, during the first and second ore-drawing cycles, the permeability of fine particles increases with the ore-drawing height. When the third and fourth ore-drawing cycles were reached, the fine particles in the upper part of the test model were gradually reduced and no fine particles in the upper part of the test model were continuously replenished. The permeability of fine particles decreases with the increase in the ore-drawing height. The process of the aforementioned analysis is the explanation of the mechanism that the penetrability of fine particles first increases and then decreases with the cumulative ore-drawing height.
Figure 10 shows the schematic diagram of the fine particle flow mechanism in different draw cycles in the coarse and finely mixed particles. Figure 10A shows the original arrangement state of the coarse and finely mixed particles in the physical model before ore drawing. Figure 10B shows the process of the downward flow of fine particles in the first draw cycle. Figure 10C shows the process of the fine particle flow and the convergence stage of the second ore-drawing cycle. Figure 10D shows the process of the continuous flow of fine particles in the third ore-drawing cycle. Figure 10E shows the process of the later stage of coarse particles in the fourth ore-drawing cycle.
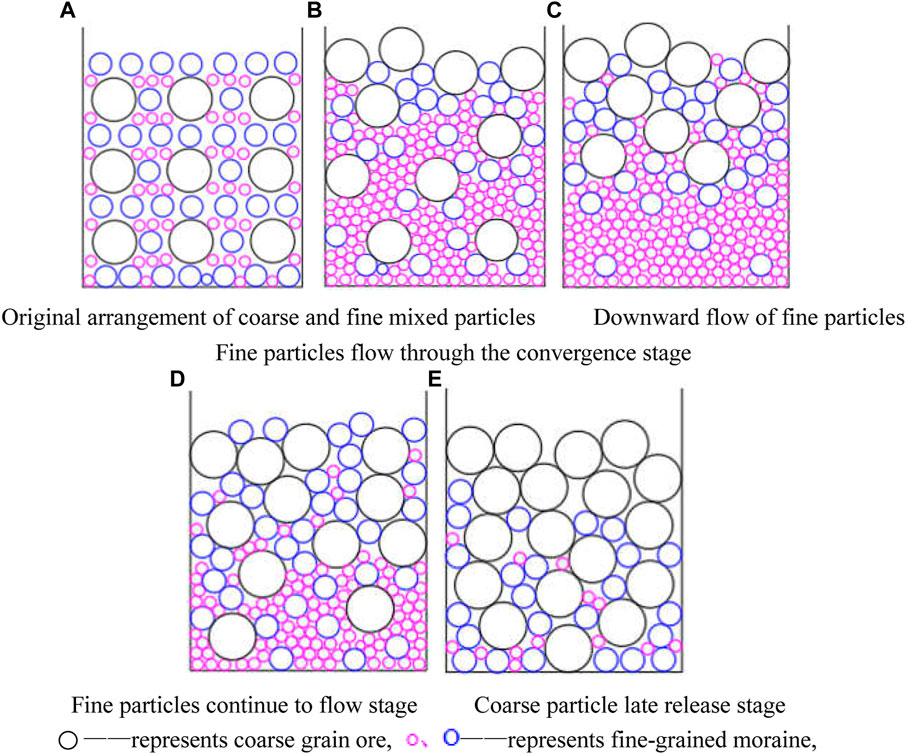
FIGURE 10. Schematic diagram of the flow mechanism of fine particles in mixed particles. (A) Original arrangement of coarse and finely mixed particles. (B) Downward flow of fine particles. (C) Fine particles flow through the convergence stage. (D) Fine particles continue to the flow stage. (E) Coarse particles in the late release stage.
Figures 10, 10A show the uniform arrangement of coarse and fine particles in the mixed particles before ore drawing. With the progress of uniform ore drawing, in the process of the first ore-drawing cycle, fine particles take precedence over coarse particles to flow downward, showing that there are more and more fine particles at the bottom of the model, as shown in Figure 10B. In the second ore-drawing cycle, a large number of fine-grained media in the upper part of the test model flowed downward and converged, and the most fine-grained medium accumulated at the bottom of the model. Moreover, in this ore-drawing stage, the current discharge amount of fine particles has the largest permeability value, as shown in Figure 10C. In the third ore-drawing cycle, most of the fine particles in the test model have flowed to the bottom to be continuously released, and only a small amount of fine particles in the pores of the coarse particles continued to flow downward. During the ore-drawing process, the upper coarse particles also moved downward, and the coarse particles at the bottom of the test model began to gradually increase, as shown in Figure 10D. In the fourth ore-drawing cycle, as the medium of coarse particles and fine particles is further discharged through the flow, and there is no replenishment of fine particles, the material released in this later stage is mainly coarse particles, as shown in Figure 10E.
In the process of uniform ore drawing, the flow of fine particles in the mixed particles of coarse and fine particles is a process in which the fine particles preferentially move downward in the flow pores of the mixed particles under certain gravity conditions. According to the results of “ore-drawing theory,” if the particle size of fine particles is 1/3–1/2 of the particle pore, the piercing behavior will occur (Penfound, 1963; Xu and Li, 2020; Wang et al., 2023). At the same time, according to the movement track of fine moraine in particle pores during the ore-drawing test, the law and characteristics of cross-flow movement of fine moraine during uniform ore drawing are revealed. The relative motion of coarse and fine particles is the intrinsic controlling factor leading to the flow of fine particles. The more significant the relative motion of coarse and fine particles is, the greater the number of randomly generated pores in the particle flow system and the larger the pores, and the more obvious the flow of fine particles.
In this paper, the indoor 3D physical model test method is used to study the fine-grained moraine and coarse-grained ores of various particle sizes in the surface overburden of the Pulang Copper Mine. The experimental study on the flow characteristics of mixed particles under the condition of uniform ore drawing was carried out, the characteristics and laws of the flow of fine particles in the mixed particle flow system were obtained, the mechanism of the flow of fine particles was briefly discussed, and the following main conclusions were obtained:
(1) The cross-flow characteristics of fine particles in mixed particles are studied. In this paper, the authors propose to quantify the cross-flow effect of fine particles by using the index of the cross-flow degree. The index can be used to measure the cross-flow degree of fine particles quantitatively.
(2) Under the action of its own gravity, the fine particle medium in the mixed particle flow uses the pores formed in the process of the mixed particle ore-drawing flow to achieve the downward flow. The fine particles of 2.5–1.25 mm, 1.25–0.63 mm, 0.63–0.315 mm, and 0.315–0.16 mm have significant permeation characteristics, and the smaller the particle size of the finer particles, the more significant the degree of permeation. The relative motion of coarse and fine particles is the intrinsic controlling factor leading to the flow of fine particles. The more significant the relative motion of coarse and fine particles is, the greater the number of randomly generated pores in the particle flow system and the larger the pores, and the more obvious the flow of fine particles.
(3) The current penetration value of fine particles of each particle size shows a variation law of first increasing and then decreasing with the number of ore-drawing times and the cumulative ore-drawing height. Among them, in the second ore-drawing cycle, the value of permeation is the largest, and the phenomenon of permeation is the most obvious. In addition, the variation regularity of fine particle penetration with a cumulative ore-drawing height is explained from the mechanism.
The original contributions presented in the study are included in the article/supplementary material. Further inquiries can be directed to the corresponding author.
Conceptualization, XN and KH; methodology, KH; software, XN and KH; validation, XN and HS; writing—original draft preparation, XN and HS. All authors contributed to the article and approved the submitted version.
The authors would like to thank all the reviewers who participated in the review, as well as MJEditor (www.mjeditor.com) for providing English editing services during the preparation of this manuscript.
The authors declare that the research was conducted in the absence of any commercial or financial relationships that could be construed as a potential conflict of interest.
All claims expressed in this article are solely those of the authors and do not necessarily represent those of their affiliated organizations, or those of the publisher, the editors, and the reviewers. Any product that may be evaluated in this article, or claim that may be made by its manufacturer, is not guaranteed or endorsed by the publisher.
Chen, Q. F., Qin, S. K., and Chen, Q. L. (2019). Stress analysis of ore particle flow behaviour under the influence of a flexible barrier. Arabian J. Geosciences 12 (15), 1–13. doi:10.1007/s12517-019-4658-8
Christopher, R. L. (2009). Development of a computational framework coupling the non-Newtonian lattice Boltzmann method and the discrete element method with application to block caving. Swansea: Swansea University.
Hashim, M. H. M. (2011). Particle percolation in block caving mines. Sydney: The University of New South Wales. School of Mining Engineering. 102–126.
Hou, K. P., Liang, W., and Wen, Y. M. (2016). Simulation experimental study on fine particles percolation in process of ore drawing. J. Kunming Univ. Sci. Technol. ( Nat. Sci. Ed. 41 (1), 25–30.
Huang, H. T., Luo, G. P., Wang, H., Zeng, X. T., and He, X. (2020). Research and application of mud inrush control in stope of Block Caving method. World Non-Ferrous Met. (10), 55–56.
Jin, A. B., Chen, S. J., Sun, H., Zhao, Y. Q., Tan, X., Ju, Y., et al. (2020). Characteristics of particle percolation based on inhomogeneous particle size distribution. J. Central South Univ. Sci. Technol. 51 (6), 1673–1680.
Ketterhagen, W. R., Curtis, J. S., Wassgren, C. R., and Hancock, Bruno. C. (2008). Modeling granular segregation in flow from quasi-three-dimension-al, wedge-shaped hoppers. Powder Technol. 179 (03), 126–143. doi:10.1016/j.powtec.2007.06.023
Li, D. F. (2020). Study on the crushing characteristics and fine particle migration law of the filling body above the caving stope. Wuhan: Wuhan University of Science and Technology.
Li, R., He, Z. H., Shen, Y. H., Yang, S. N., Han, H., Yan, D., et al. (2021). In-hospital complication-related risk factors for discharge and 90-day outcomes in patients with aneurysmal subarachnoid hemorrhage after surgical clipping and endovascular coiling: A propensity score-matched analysis. J. Hubei Univ. Educ. 38 (02), 1–12. doi:10.3171/2021.10.JNS211484
Li, T., Wu, A. X., Han, B., Feng, Y. T., and Sun, W. (2016). Discrete element method study on the percolation process of fine particles in ore drawing by the block caving method. Chin. J. Eng. 38 (11), 1509–1514. doi:10.13374/j.issn2095-9389.2016.11.001
Li, X. L., Zhang, X. Y., Shen, W. L., Zeng, Q. D., Chen, P., Qin, Q. Z., et al. (2023). Research on the mechanism and control technology of coal wall sloughing in the ultra-large mining height working face. Int. J. Environ. Res. Public Health 20 (01). doi:10.3390/IJERPH20010868
Lu, Z. Y., Li, X. J., and Xu, F. (2021). Research on air leakage control technology of overburden in an iron ore open-pit to underground mining. Mod. Min. 37 (08), 84–87.
Ma, D., Duan, H. Y., Li, W. X., Zhang, J. X., Liu, W. T., and Zhou, Z. L. (2020). Prediction of water inflow from fault by particle swarm optimization-based modified grey models. Environ. Sci. Pollut. Res. 27 (33), 42051–42063. doi:10.1007/s11356-020-10172-w
Ma, D., Duan, H. Y., Zhang, J. X., and Bai, H. B. (2022). A state-of-the-art review on rock seepage mechanism of water inrush disaster in coal mines. Int. J. Coal Sci. Technol. 9 (01), 50. doi:10.1007/S40789-022-00525-W
Ma, D., Li, Q., Cai, K. C., Zhang, J. X., Li, Z. H., Hou, W. T., et al. (2023). Understanding water inrush hazard of weak geological structure in deep mine engineering A seepage-induced erosion model considering tortuosity. J. Central South Univ. 30 (02), 517–529. doi:10.1007/S11771-023-5261-4
Mao, S. L., and Ming, J. (2019). Theory and application of ore drawing. Beijing: Metallurgical Industry Press.
Niu, X. D., Xie, J. Y., Hou, K. P., Li, Z. R., Wang, D. W., and Liang, W. (2020). Experimental study on rainfall threshold and outbreak time of downhole debris flow induced by the prang copper mine. Nonferrous Met. Eng. 10 (07), 100–106.
Penfound, W. T. (1963). A modification of the point-centered quarter method for grassland analysis. Ecology 44 (01), 175–176.
Pierce, M., Leyronas, X., and Chevy, F. (2019). Few versus many-body physics of an impurity immersed in a superfluid of spin 12 attractive fermions. Phys. Rev. Lett. 123 (8), 080403. doi:10.1103/PhysRevLett.123.080403
Pierce, M., Stuart, J., Pungor, A., Dryden, P., and Hlady, V. (1994). Adhesion force measurements using an atomic force microscope upgraded with a linear position sensitive detector. Langmuir ACS J. surfaces colloids 10 (09), 3217–3221. doi:10.1021/LA00021A053
Raj, R., and Thakur, D. G. (2016). Qualitative and quantitative assessment of microstructure in Al-B 4 C metal matrix composite processed by modified stir casting technique. Archives Civ. Mech. Eng. 16 (04), 949–960. doi:10.1016/j.acme.2016.07.004
Ren, F. Y., Liu, Y., He, R. X., and Zhang, J. (2020). Flow-through features of tailings in subsidence area under ore drawing conditions. J. Northeast. Univ. Nat. Sci. 41 (6), 858–862.
Rong, W. J., Qin, D. Y., Li, B. K., and Feng, Y. Q. (2021). Experimental study on particle mixing process in rotating drum. J. Northeast. Univ. Nat. Sci. 42 (01), 49–54.
Wang, J. R., Tang, R. L., Jiang, Y. Z., Liu, M., and Li, Z. L. (2023). A practical method for angular normalization of global MODIS land surface temperature over vegetated surfaces. ISPRS J. Photogrammetry Remote Sens. 199, 289–304. doi:10.1016/J.ISPRSJPRS.2023.04.015
Wang, P., Li, D. F., Cheng, A. P., Zeng, W. X., Zhang, Y. S., Tan, T., et al. (2019). Integrated RNA-seq and ChIP-seq analysis reveals a feed-forward loop regulating H3K9ac and key labor drivers in human placenta. Metal. Mine 76 (12), 40–50. doi:10.1016/j.placenta.2019.01.010
Xing, X., Zhang, C., Jiang, B., Sun, Y., Briens, C., and Zhang, L. (2022). A study of solids mixing in a bubbling fluidized bed using the TFM method. part I. particle travel time distribution. J. Eng. Thermophys. 31 (01), 132–143. doi:10.1134/S1810232822010106
Xu, L. M., and Li, M. J. (2020). A data preprocessing method in dynamic comprehensive evaluation. Engl. J. Manag. Sci. 28 (01), 162–169. doi:10.16381/j.cnki.issn1003-207x.2020.01.014
Xu, Y., Li, R., Xiu, W. z., Chen, Q., Sun, Q. c., and Yang, H. (2022). Six new species of aspidophorodon verma, 1967 (Hemiptera, aphididae, aphidinae) from China. Mech. Eng. 44 (01), 1–55. doi:10.3897/zookeys.1106.77912
You, X., and Zhang, G. J. (2016). Effect of particle size space distribution in coverage rocks on rocks mixture. J. Northeast. Univ. Nat. Sci. 37 (11), 1605–1608.
Zhang, J. C., Li, X. L., Qin, Q. Z., Wang, Y. B., and Gao, X. (2023). Study on overlying strata movement patterns and mechanisms in super-large mining height stopes. Bull. Eng. Geol. Environ. 82 (3), 142. doi:10.1007/S10064-023-03185-5
Zhang, X. F., Tao, G. Q., and Zhu, Z. H. (2019). A gravity flow model of fragmented rocks in longitudinal sublevel caving of inclined medium-thick ore bodies. Archives Min. Sci. 64 (03), 533–546. doi:10.24425/ams.2019.129367
Zhang, Y. G., and Gao, F. (2021). Study on reasonable gradation and thickness of overburden based on air leakage characteristics. China Min. Mag. 30 (04), 115–119.
Keywords: uniform ore drawing, mixed particle flow, cross-flow characteristics, quantification method, physical model test
Citation: Niu X, Sun H and Hou K (2023) Uniform thickness in the process of ore-mixed characteristics of particles passing through experimental research. Front. Earth Sci. 11:1221404. doi: 10.3389/feart.2023.1221404
Received: 12 May 2023; Accepted: 07 July 2023;
Published: 25 July 2023.
Edited by:
Xuelong Li, Shandong University of Science and Technology, ChinaReviewed by:
Dan Ma, China University of Mining and Technology, ChinaCopyright © 2023 Niu, Sun and Hou. This is an open-access article distributed under the terms of the Creative Commons Attribution License (CC BY). The use, distribution or reproduction in other forums is permitted, provided the original author(s) and the copyright owner(s) are credited and that the original publication in this journal is cited, in accordance with accepted academic practice. No use, distribution or reproduction is permitted which does not comply with these terms.
*Correspondence: Huafen Sun, MTU0MjIxNjQ0QHFxLmNvbQ==
Disclaimer: All claims expressed in this article are solely those of the authors and do not necessarily represent those of their affiliated organizations, or those of the publisher, the editors and the reviewers. Any product that may be evaluated in this article or claim that may be made by its manufacturer is not guaranteed or endorsed by the publisher.
Research integrity at Frontiers
Learn more about the work of our research integrity team to safeguard the quality of each article we publish.