 Desiree P. Hullaster1
 Gerilyn S. Soreghan1Ravi K. Kukkadapu2Brock S. Dumont1
 Kato T. Dee1
 Andrew S. Elwood Madden1*
- 1School of Geosciences, University of Oklahoma, Norman, OK, United States
- 2Environmental Molecular Sciences Laboratory, Pacific Northwest National Laboratory, Richland, WA, United States
Siliciclastic strata of the Colorado Plateau attract attention for their striking red, green, bleached, and variegated colors that potentially record both early depositional and later diagenetic events. We investigated the proximal-most strata of the Paradox Basin, from their onlap contact with the Precambrian basement of the Uncompahgre Plateau to the younger Cutler strata exposed within 10 km of the Uncompahgre Plateau to attempt to understand the significance of the striking colors that occur here. These strata preserve a complex geology associated with buried paleorelief and sediment-related permeability variations at a major basin-uplift interface. Strata exposed within ∼1.5 km of the onlap contact exhibit a pervasive drab color in contrast to the generally red colors that predominate farther from this front. In-between, strata commonly host variegated red/green/bleached intercalations. Thin-section petrography, SEM, XRD, Raman spectroscopy, Mössbauer spectroscopy, and whole-rock geochemistry of samples representing different color variations from demonstrate that water–rock interactions charged the rocks with Fe(II) that persists primarily in the phyllosilicate fraction. Color variations reflect grain-size differences that allowed the reduction of fluids from regional fault and basement/fill contacts to permeate coarser-grained Cutler sediments. Hematite and chlorite occur in both red and green sediments but are absent in the bleached sediments. Pervasive hematite in both red and green layers suggests that sediments were hematite-rich before later alteration. Chlorite and smectite are elevated in green samples and inversely correlated with biotite content. Green coloration is generally associated with 1) coarser grain sizes, 2) spatial association with basement contacts, 3) elevated smectite and/or chlorite, 4) less total Fe but greater Fe(II)/Fe(III) primarily in the phyllosilicate fraction, and 5) uranium enrichment. The bleached coloration reflects the removal of pigmentary Fe(III) oxide, while the green coloration is due to the removal of pigmentary hematite and the abundance of Fe(II)-bearing phyllosilicates. Abundant mixed-layer and swelling clays such as smectite, illite/smectite, and chlorite/smectite (including tosudite) dominate the mineralogy of the clay fraction. These results are consistent with other studies demonstrating fault-associated fluid alteration in the Paradox Basin region. However, the pervasive greening was not observed in many of these studies and appears to reflect the unique aspects of the paleovalley system and the importance of biotite alteration to Fe(II)-bearing phyllosilicates.
Introduction
The complex geologic record throughout the Paradox Basin region of the western United States continues to present challenges and opportunities for unraveling the story of paleofluid alteration that includes, for example, meteoric/regional groundwater, basinal fluids, hydrocarbon maturation and migration, and hydrothermal circulation. Interactions among faulting, sedimentation, diagenesis, salt tectonics, paleoclimate, and igneous activity in this region produced a legacy of economically important hydrocarbon, copper, uranium/vanadium, and other resources (Figure 1; e.g., Bankey, 2003; Barton et al., 2018). Diverse questions relating to the timing and chemistry of paleofluid sources and how they relate to both local geological influences and resources persist (e.g., Thorson, 2018; Kim et al., 2022). Our study differs from others in focusing specifically on the proximal-most Paradox Basin, where Permian siliciclastic strata of the undifferentiated Cutler Formation bury the fault-bounded Uncompahgre front (Cater, 1955; Cater and Craig, 1970; Moore et al., 2008) and onlap the mouth of an inferred Precambrian-hosted paleovalley system (Soreghan et al., 2007, stratigraphic column in Supplementary Figure S1).
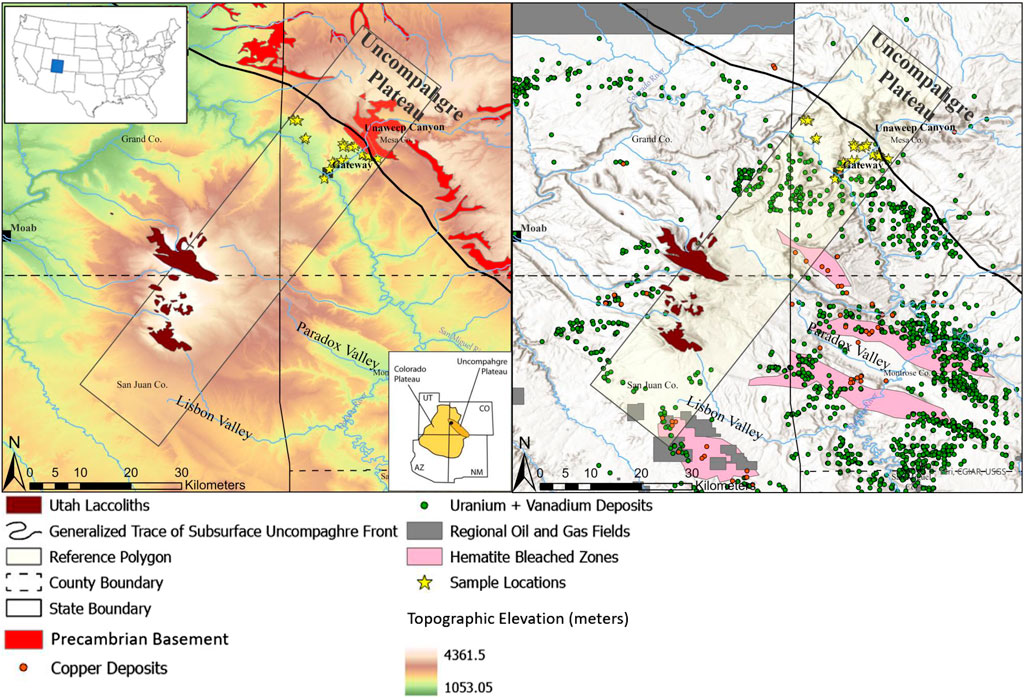
FIGURE 1. Regional overview of the features of interest linked to our study area (inset green box), including modern topography with the Paradox and Lisbon Valleys and Unaweep Canyon (left panel), Cenozoic intrusives (both), identified hydrocarbon, Cu and U+V accumulations (right), estimated boundaries of extensive hematite bleaching (right), and the generalized subsurface location of the Uncompahgre Plateau bounding reverse fault. The large shaded rectangle indicates the general region of the cross-section shown later in Figure 4. Data sources are provided in the SI.
The proximal, lower Permian Cutler Group/Formation (hereafter simplified to “Formation”) hosts redox interfaces in the form of bleached or green-hued zones within red beds, in addition to pervasive gray–green hues with local concentrations of darker green within ∼1,500 m of its onlap contact with the crystalline basement (Figures 2, 3; Supplementary Figure S2). Previous work focused on characterizing the mineralogy of the Cutler Formation for paleoclimate studies and provenance but placed less emphasis on the meaning and implications of these striking color variations and variegations (Werner, 1974; Suttner and Dutta, 1986). A previous paleomagnetic investigation of the more distal (∼60 km from source) Cutler Formation demonstrated bleaching fluid alteration along faults in the Lisbon Valley during the late Cretaceous to early Tertiary (Reynolds et al., 1985); however, redox interfaces in the proximal-most Cutler Formation (<10 km from source) were not investigated.
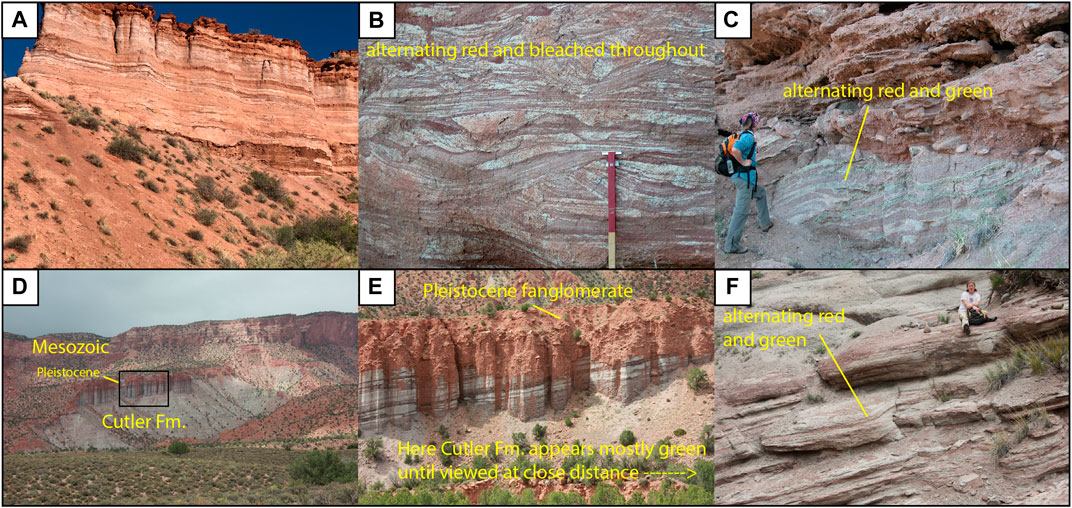
FIGURE 2. Cutler Formation field photos of outcrops representing mixed red, green, and bleached layers. (A) Looking N/NW toward the Palisade at red/bleached interlayering; the cliff face is ∼50 m high. (B) Closer view of red/bleached area; the red top of the Jacob Staff is 50 cm long. (C) Green/red Cutler underneath Pleistocene (Section V, see below). Geoscientist is ∼1.75 m tall for scale. (D) Green and red/green interlayers appear mostly green from a distance, looking north toward the location where most 1218- samples were collected (see Figure 5). (E) Close-up of cliff shown in D; cliff face is ∼50 m high. (F) Looking N; bed below geoscientist is ∼2 m thick.
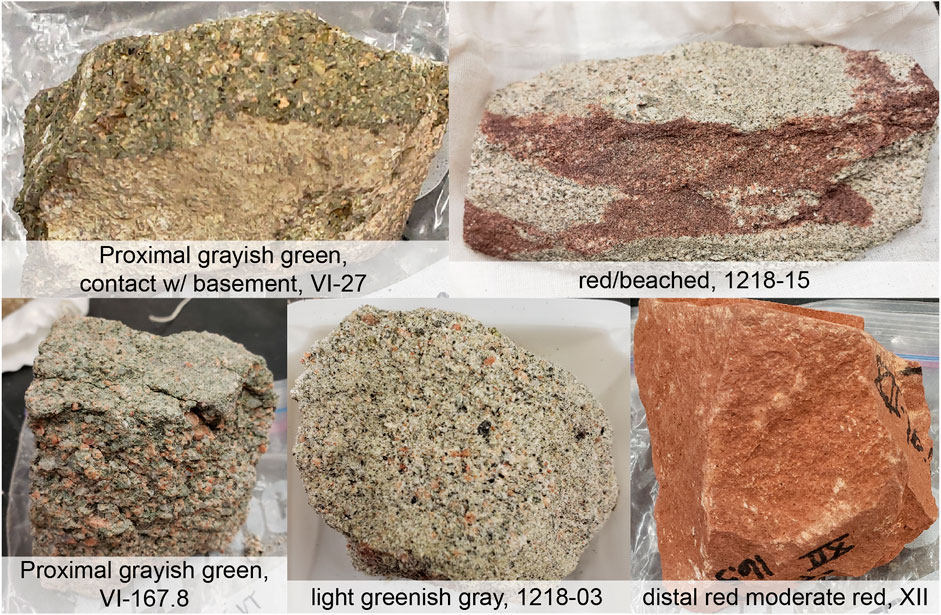
FIGURE 3. Photographs of red, green, and bleached (RGB) rock samples. The dark green rocks occur in contact with or near contact with igneous and metamorphic basement rock at the mouth of Unaweep Canyon. The proximal red–green rocks also occur near basement rock, and their occurrence spans laterally from the mouth of Unaweep Canyon to the Colorado–Utah border. The bleached interlayers do not occur within 1 km of the canyon mouth but do occur westward. Finally, the distal red rocks that are void of green-bleached alterations span from ∼3 km SW of the canyon many km to the SW.
Furthermore, we focus on the clay mineralogy and geochemistry. Attributing the abundance and distribution of these phyllosilicates to specific geologic events or processes is guided by systematic controls of temperature and chemistry at the macroscale, microenvironment, and nanoscale. Generally, although exceptional cases exist, 2:1 phases with high layer charge (micas, illite, etc.) form at temperatures that require burial, hydrothermal, or another heat source. Low layer charge 2:1 phases such as smectite form at lower temperatures (e.g., Velde, 1995; Meunier, 2005). Additionally, dioctahedral layers are associated with acidic-to-neutral weathering/fluid alteration, while trioctahedral clays are associated with alkaline/saline/evaporative environments and/or reducing conditions. Chlorites are “2:1:1” phases with an additional octahedral sheet in the interlayer position, which can occur in low-temperature/weathering environments but are predominantly known to form at higher temperatures during burial diagenesis, hydrothermal alteration, or metamorphism (Eberl et al., 1984).
Barton et al. (2018) presented a Paradox Basin regional conceptual model that provides helpful context for understanding our work within the regional sedimentary and tectonic frameworks, in addition to the many potentially interacting fluid sources and climate drivers (Figure 4). Key features include uplift and sedimentation of the Cutler Formation along the Uncompahgre front, the complexity of subsurface flow due to processes such as salt tectonics and igneous intrusions, and the contrasting effects of precipitation and evaporation as a climate control that influences mineral weathering and authigenesis (Figure 4). Additionally, we highlight three potential sources of reducing fluids likely to influence proximal Cutler rocks (Figure 4, right): 1) paleo-to-modern groundwater flow from recharge sourced in the Unaweep Canyon/Uncompahgre uplift area, where groundwater follows the large permeability contrast along the basement contact with overlying sedimentary units; 2) burial and diagenesis of organic-rich sediments in the Paradox Basin leading to the upwards expulsion of hydrocarbon-containing fluids (Nuccio and Condon, 1996; Beitler et al., 2003; Thorson, 2018); and 3) hydrothermal fluids originating from Tertiary igneous activity, most closely represented by the La Sal intrusive complex. Evidence for multiple episodes of paleofluid flow in the adjacent Paradox Basin from different sources all generally point to alteration by reduced saline fluids and subsequent ore mineralization by more oxic saline groundwaters (Kim et al., 2022). These oxidizing fluids that allowed trace precipitation of barite, gypsum, and other phases followed afterward, suggesting continued interaction with saline discharges post-reduction (e.g., Breit et al., 1990; Kim et al., 2022), likely driven at least in part by later erosion of sedimentary cover (Bailey et al., 2021).
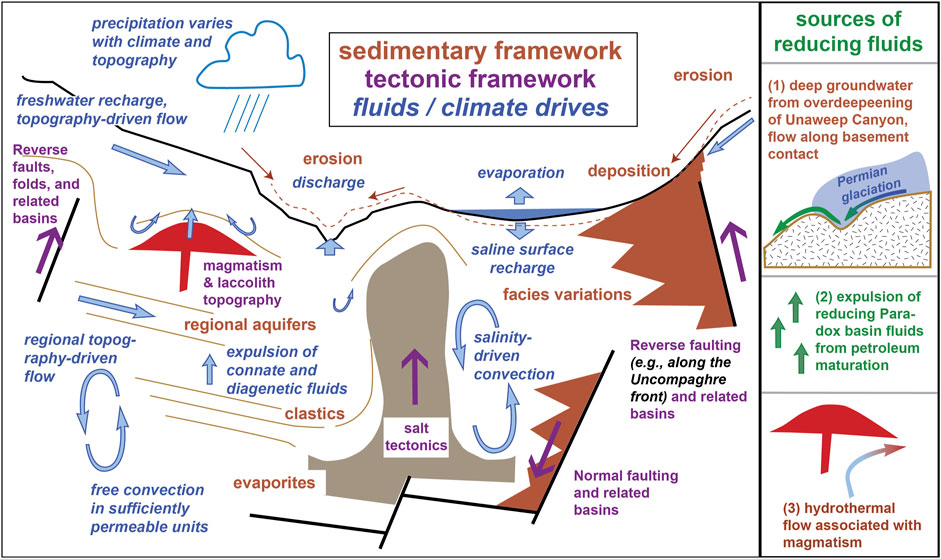
FIGURE 4. Main panel: Regional sedimentary and tectonic framework in the Paradox basin region, along with fluid flows, adapted from Barton et al. (2018). Features are not to scale or accurately arranged. Our study area lies along a basin-bounding uplift, such as the major reverse fault to the right-hand side. The right-hand panel illustrates three sources of reducing fluids that may have contributed to the alteration of the proximal Cutler.
Redox interfaces in clastic sedimentary units are also of interest because reducing conditions sequester redox-sensitive metals such as uranium (e.g., Langmuir, 1978). Redox interfaces in sandstones host ∼25% of the world’s uranium resources (Kyser, 2014) as uranium is generally soluble in oxidizing conditions and insoluble in reducing conditions. Typically, redox interfaces in the Colorado Plateau with identified uranium deposits are “roll-front” deposits associated with organic matter (e.g., Bankey, 2003). However, green and green–gray sedimentary layers that have elevated Fe(II)/Fe(III) may also sequester uranium (e.g., Bankole et al., 2016), and characteristics of the proximal Cutler are generally consistent with a potential different type of paleovalley uranium deposit (e.g., Hou et al., 2017). Here, we document the mineralogy, geochemistry, and sediment texture of pervasive drab coloration in the proximal-most Cutler and intercalated green, bleached, and red layers in the proximal Cutler Formation to evaluate the convoluted interactions of depositional environment, paleoclimate, and structure/hydrogeology on the diagenesis and potential for uranium accumulation in this system.
Geologic setting and field sampling
The lower Permian Cutler Formation onlaps the Precambrian basement at the western mouth of Unaweep Canyon (Mesa County, Colorado; Figures 1, 5, 6), a geologically unique canyon drained by underfit creeks flowing both westward and eastward from within the canyon. The canyon bisects the Uncompahgre Plateau, a late Cenozoic feature previously uplifted (as the Uncompahgre uplift) during the Pennsylvanian Ancestral Rocky Mountains orogeny (Baars and Stevenson, 1981; Kluth and Coney, 1981; Soreghan et al., 2007, 2009). The Pennsylvanian uplift produced erosion of the Uncompahgre uplift down to the crystalline Precambrian basement, which comprises gneiss, granitoids, and varied metamorphic rocks dating from 1.4 to 1.6 Ga (Hedge et al., 1968; Mose and Bickford, 1969; Case, 1991). During the Permian, the Uncompahgre uplift subsided and was ultimately buried (Cater and Craig, 1970; Soreghan et al., 2012). Evidence of this occurs near the western mouth of Unaweep Canyon, where Cutler strata bury ∼520 m of paleorelief on the Precambrian basement observable in the outcrop, including a re-entrant marking a paleovalley filled by Cutler strata (Soreghan et al., 2012) that trends into the modern Unaweep Canyon. Tectonic activity resumed during the Laramide orogeny ∼80–40 Ma and during the epeirogenic uplift associated with the incision of the Colorado Plateau ∼5–6 Ma (Dorsey and Lazear, 2013) by the Colorado River and associated tributaries. One of those tributaries—the ancestral Gunnison River—flowed through Unaweep Canyon but abandoned the canyon for its present course by ∼1.4 Ma (Balco et al., 2013; Soreghan et al., 2015a).
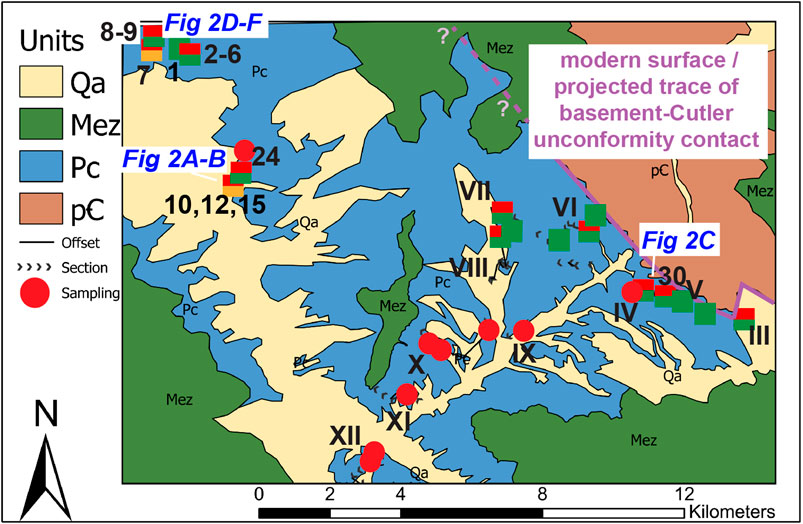
FIGURE 5. Proximal Cutler geologic/sample location map in western Colorado, from the mouth of Unaweep Canyon to the Colorado–Utah boarder. Samples were collected from sections numbered from III (proximal) to XII [“distal” relative to the area, for easier reference; the Roman numeral designations refer to the sections described in detail in Soreghan et al. (2009)]. Gateway, CO, can be found in the lower section of the map for reference. Sample locations indicated by the symbols are color-coded according to red, green, bleached, or interlayered/mixed. “Green,” “red/green,” and “red/bleached” samples are square shapes, while “red” are circles. For regional context, sample locations can be compared to their locations plotted as stars on Figure 1. Locations of photos from Figure 2 are also indicated on the map.
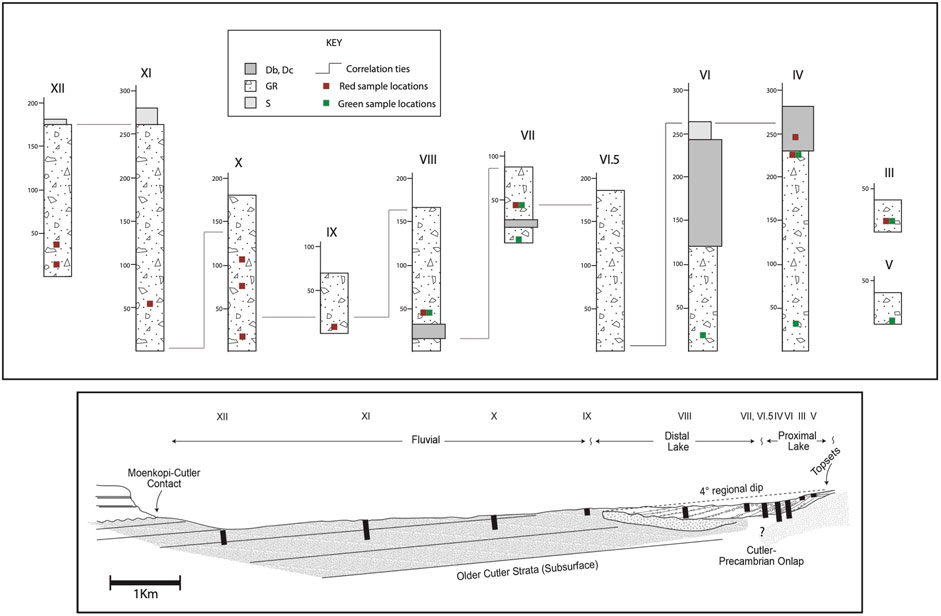
FIGURE 6. (modified after Keiser et al., 2015). Top: Simplified measured section logs of the proximal Cutler Formation exposed in the study area (see Soreghan et al., 2009 for sedimentological details). Db/Dc, Boulder-to-cobble diamictite; Gr, Conglomerate; S, Sandstone. Roman numerals with section labels and measured sections correspond to those shown on the map in Figure 3. Although the entire section here is proximal (i.e., within 0–10 km of the onlap contact), the most proximal segments (VIII and below) are from the onlap contact with the Precambrian basement near the mouth of Unaweep Canyon, and the most distal is section XII, across from the Dolores River near the town of Gateway, CO. The low regional dip of the Cutler Formation (∼4°) and its northwesterly strike paralleling drainages precluded the measurement of a single vertical log that spans the entire unit. Thus, there are successive segments of sections “young” with distance from the onlap contact. Note the lines of correlation connecting the sections. Sample locations are denoted by their color as red or green. Bleached samples do not occur along these previously measured sections but were sampled from locations farther to the northwest near the Utah border. Bottom: Cross-section illustrating the spatial arrangement of the measured sections, oriented schematically along the trend from the section IV label to the section XII label in Figure 3.
The Cutler Formation is a generally maroon-to-red, arkosic siliciclastic unit (siltstone, sandstone, and conglomerate). Strata exposed at the western mouth of Unaweep Canyon near Gateway, Colorado, and along the strike are referred to as the proximal Cutler Group (undivided; Supplementary Figure S1) (Cater and Craig, 1970; Soreghan et al., 2009). In this region, the color of Cutler strata varies substantially, with mint-to-dark green and bleached coarse-grained strata prevailing at and within 1–2 km of the onlap contact and a range of red and variegated hues predominating more distally (Figures 2, 3; Supplementary Figure S2) (Soreghan et al., 2007; Soreghan et al., 2009). Suttner and Dutta (1986), after Cater (1955), suggested the maximum burial of the proximal Cutler Formation is ∼2,400 m, implying burial generally less than expected for the complete smectite-to-illite transition (Cater, 1955; Suttner and Dutta, 1986; Worden and Burley, 2003; Meunier, 2005). With distance from the basement onlap contact, grain sizes of the Cutler Formation decrease from boulder–cobble–pebble–granule conglomerate and diamictite to sandstone and siltstone (Campbell, 1981; Soreghan et al., 2009).
In the study area, the proximal-most Cutler strata depositionally onlap the Precambrian igneous and metamorphic basement in an upthrown block of the ancient Uncompahgre highland (Cater, 1955; Cater and Craig, 1970); however, within the Paradox Basin, Cutler strata lie atop the Pennsylvanian Hermosa Formation (Supplementary Figure S1) (Cater and Craig, 1970). The Cutler Group lies unconformably below the Triassic–Jurassic strata of the Moenkopi or Chinle Formations (Supplementary Figure S1) (Cater and Craig, 1970). Depositional interpretations for the proximal Cutler converge on fluvial–alluvial and lacustrine, but paleoclimatic interpretations range among hot–humid, hot–arid, or—more recently—cold–humid (proglacial) systems sourced from erosion of the Uncompahgre uplift (Mack, 1977; Campbell, 1981; Suttner and Dutta, 1986; Dubiel et al., 2009; Soreghan et al., 2009).
Although a few studies have investigated the mineralogy of the Cutler Formation, there are no research reports on the mineralogical changes associated with the prolific color variations throughout the proximal area. Notable mineralogic changes occur from the proximal Cutler within ∼10 km of the Uncompahgre front to the distal Cutler owing to provenance variations: whereas the ∼1.4–1.6 Ga local basement sourced the (arkosic) proximal sediment, distally the provenance includes predominantly (quartzose) eolian sediment sourced from the greater Appalachian orogenic system (Hedge et al., 1968; Werner, 1974; Johansen, 1988; Lawton et al., 2015). Previous thin-section and outcrop analyses by Campbell (1981) showed that quartz grains and calcite cement increase distally while igneous and metamorphic rock fragments decrease. Previous works described the proximal Cutler as an immature arkose (Suttner and Dutta, 1986; Lawton et al., 2015), along with the heavy or trace minerals apatite, chlorite, epidote, garnet, muscovite, opaques, sphene, tourmaline, and zircon (Werner, 1974). Additional work on the clay mineralogy of the Cutler Formation via X-Ray Diffraction (XRD) by Dutta and Suttner (1986) reported clay compositions of kaolinite, chlorite, smectite, illite, quartz, carbonates, and iron oxides without further mention of mixed-layer clays (Dutta and Suttner, 1986). Dutta and Suttner (1986) documented pervasive chlorite- and smectite-rich cements throughout the unit but did not compare the visible color variations trending from proximal to distal in the proximal-most Cutler. Suttner and Dutta (1986) posited an early diagenetic origin for the chlorite and inferred arid/evaporative climate conditions.
Our work brings new data to both readdress the origin of the clays (e.g., authigenic or detrital) and specifically address color variations in the proximal Cutler Formation. Ultimately, we hoped these details would elucidate both aspects of paleoclimate and the history of fluid alteration events in this region.
Methods and materials
We mainly sampled outcrops of Cutler Formation rocks in the vicinity of Gateway, far western Colorado (Figures 1, 5). Cutler samples were collected from outcrops in the proximal region, from the onlap contact to about 10 km basinward from the contact. Many samples were collected along measured sections as described by Soreghan et al., 2009. For these samples, a Roman numeral (III-XII) represents the label for each particular measured section, in sequence from proximal (and low) to distal (and high; Figures 5, 6). Separately, samples were collected north-westward along the Precambrian basement–Cutler contact (Figure 5). These are labeled as 1218-##, ranging from 1218-01 to 1218-24. Sample 1218-30 lies along the basement–Cutler contact near measured section V. Additionally, we included samples from the Precambrian basement-associated samples as the parent rock material for the Cutler Formation. This included: 1) Two samples of basement rock excavated from outcrops below contact with the Cutler Formation, with visibly altered surface rocks discarded. 2) Green fracture-filling clay from the basement from the Massey-1 core drilled in Unaweep Canyon (described in Marra, 2008). Its pale green material was very similar to many of the green Cutler samples, and we hypothesized that it formed in response to fluid flow in the bedrock fractures somewhat up-gradient from our study area. A summary of all samples used for this study and the analyses performed on them is described in Supplementary Table S1.
Powder X-ray diffraction
A total of 45 samples were analyzed for their bulk mineralogy. Of those, 39 were additionally analyzed for clay mineralogy. Rock colors are described according to the Munsell color chart (Supplementary Table S1). When possible, subsamples of intercalated red and green or red and bleached were collected from the same sample.
Bulk random mounts to quantify whole-rock mineralogy were prepared generally following Eberl (2003). Sample preparation involved crushing with a hammer or percussion mortar until 1–2 g passed through a 0.4 mm sieve, followed by 5 min of micronizing with Y-Zr-oxide and 5–7 mL of methanol and drying. Once dry, the sample was stirred to randomize orientation and filtered through the micronizing sieve once more. Finally, the sample was poured into a glass cavity mount flush with the rim while avoiding compaction into the cavity to minimize preferred orientation and analyzed.
Separation of the clay-size fraction followed the methods of Moore and Reynolds (1997). Rock samples were crushed, and 1–2 g were filtered through a 0.4 mm sieve (Eberl, 2003). The material was then transferred to a glass beaker, combined with 150 mL distilled water and a “pinch” of sodium (hexa)metaphosphate, sonicated for 5 min to disaggregate the rock fragments, and then centrifuged at 800 rpm for 3.5 min. While avoiding the pelleted material at the bottom, the liquid containing the clay-sized (2 µm) fraction was decanted after centrifuging to make the oriented mount. Several samples were also processed by the standard Citrate–Bicarbonate–Dithionite (CBD) treatment to dissolve the iron oxide cements (Soukup et al., 2008) for particle size analysis. Although the laser particle size results were not generally successful, this process created a suspended gel of clay in some cases that could be collected with a spatula for XRD analysis.
Random clay mounts are used primarily to elucidate the di-versus trioctahedral character of phyllosilicate minerals using (hk0) reflections that indicate b-axis dimensions or discriminate between polymorphs, neither of which can be determined in an oriented clay mount. In this case, the liquid containing the 2 µm fraction was dried in the drying oven, stirred to a powder, and mounted into a bulk random mount glass holder.
Oriented clay films were prepared on fused silica slides according to the filter peel method of Drever (1973) as described in Moore and Reynolds (1997). The clay solution was vacuum-filtered onto a 0.2 µm filter and calcium-saturated with 1M CaCl2.
Samples were analyzed using a Rigaku Ultima IV powder X-ray diffractometer using Cu-Kα radiation with a voltage of 40 kV, current of 44 mA, and curved graphite diffracted-beam monochromator. Data were analyzed using Jade Pro with the ICDD-PDF4+ database. Whole-pattern Rietveld fitting was used for quantitative weight percent determinations. Oriented clay mounts were scanned with a 2Ɵ range from 2°–32° for a count time of 2 s and a step size of 0.02°. Samples were analyzed after air-drying (AD) “glycolation” via exposure to ethylene glycol (EG) vapor in a desiccator overnight (∼24 h but <72 h due to the possibility of total dissociation of swelling clays if present) and following heat treatment at 550°C (HT550) for 1 h.
Biscaye factors (Biscaye, 1965) were applied to all spectra of clay fraction-oriented mounts to convert peak areas to semiquantitative estimates of weight percent (Supplementary Table S4) and then assigned into categories with values of 1 (trace-minor) to 3 (abundant).
Statistical evaluation of the XRD data included: 1) comparison of population means for each mineral using GraphPad Prism to perform ANOVA with a post hoc Tukey’s test, 2) Hierarchical clustering of normalized bulk XRD weight percent data via k-means clustering in Tibco Spotfire, and 3) principal components analysis of semiquantitative mineral abundances in GraphPad Prism. Prior to cluster calculation, we removed trace minerals from the sample sets and normalized weight percent values from the whole-rock XRD to 100%.
Petrography and electron microscopy
Petrography is used primarily to understand mineral associations and alteration in the Cutler Formation. Splits of the same Cutler rock samples used for XRD were sent to an outside vendor for preparation of standard microprobe-polished thin sections. Thin section samples were specifically selected to capture the red/green and red/bleached redox interfaces. A Zeiss Axio Imager.Z1 stereo microscope was used to analyze all 22 thin sections via plane-polarized light and cross-polarized light to determine grain-size variations, sorting, roundness, overall mineralogy, and mineral associations. The thin sections were carbon-coated and examined via scanning electron microscopy (SEM) to identify minerals and identify mineral textures, associations, and morphology. SEM was performed on an FEI Quanta 250 with a Bruker energy-dispersive spectrometer (EDS) at the University of Oklahoma. Imaging was performed in backscatter mode for all samples. Selected carbon-coated thin sections were subsequently analyzed on the electron microprobe for a qualitative interpretation of iron oxides, micas, and chlorites. Energy-dispersive X-ray analysis (EDS) elemental mapping was performed at the University of Oklahoma on a CAMECA SX100 electron probe micro-analyzer. Analysis and mapping employed a 15 kV accelerating voltage and a 20 nA beam current (measured at the Faraday cup). Elemental mapping conditions were set to 100 frames at 200 s per frame for a total acquisition time of 20,000 s.
Raman microspectroscopy
Selected mineral grains from rock samples and thin sections were analyzed with an InVia Mapping Raman Spectrometer integrated with a Leica DM2500M optical microscope located in the OU School of Geosciences. Spectra were collected at 532 nm and/or 785 nm and analyzed using WiRE Chemometrics software and in comparison with the RRUFF database (Lafuente et al., 2015).
Mössbauer spectroscopy
Mössbauer spectra were collected at room temperature (RT), 77 and 12 K using a Web Research Company instrument that included a closed-cycle cryostat SHI-850 obtained from Janis Research Company, Inc., a Sumitomo CKW-21 He compressor unit, and a Ritverc NaI detection system. A 57Co/Rh source (75-mCi, initial strength) was used as the gamma energy source. The raw data were folded into 512 channels to provide a flat background and a zero-velocity position corresponding to the center shift (CS) of a metal Fe foil at RT. Calibration spectra were obtained with an Fe foil placed in the same position as the samples to minimize any geometry errors. Data were modeled with Recoil software using a Voigt-based structural fitting routine (Rancourt and Ping, 1991). The sample preparation and sample holder were identical to the procedures reported in Peretyazhko et al. (2012).
Whole-rock geochemistry
Whole-rock geochemistry was performed by ALS Chemex on 11 representative rock samples to determine major, trace, and rare Earth elements (REEs). Samples were pulverized, then (ALS method ME-MS81d) fused with lithium metaborate at 1,000°C, cooled, and then dissolved in 4% nitric/2% hydrochloric acid solution. Digested samples were analyzed by inductively coupled plasma mass spectrometry (ICP-MS) and ICP-atomic emission spectroscopy.
Results
Whole-rock mineralogy
The red, green, and bleached rocks contain varying amounts of chlorite, smectite, illite + mica, plagioclase, K-feldspar, calcite, and quartz plus minor gypsum and epidote (Figure 7; Supplementary Table S2). The proximal Cutler Formation has abundant mica, dominated by biotite. Identification of the heavy minerals is primarily from thin-section (and some XRD) analysis due to their relatively low abundance (<1%) in most samples. Epidote is the most abundant heavy mineral, detected via XRD in one red sample and three green samples at 0.3–7.6 wt% (Supplementary Table S2). Additionally, the two sampled Precambrian basement rocks contain detectable epidote (1218-26D and 1218-28VMQM) with lower epidote weight percentages (0.3% and 1.3%, respectively) than most red and green Cutler samples.
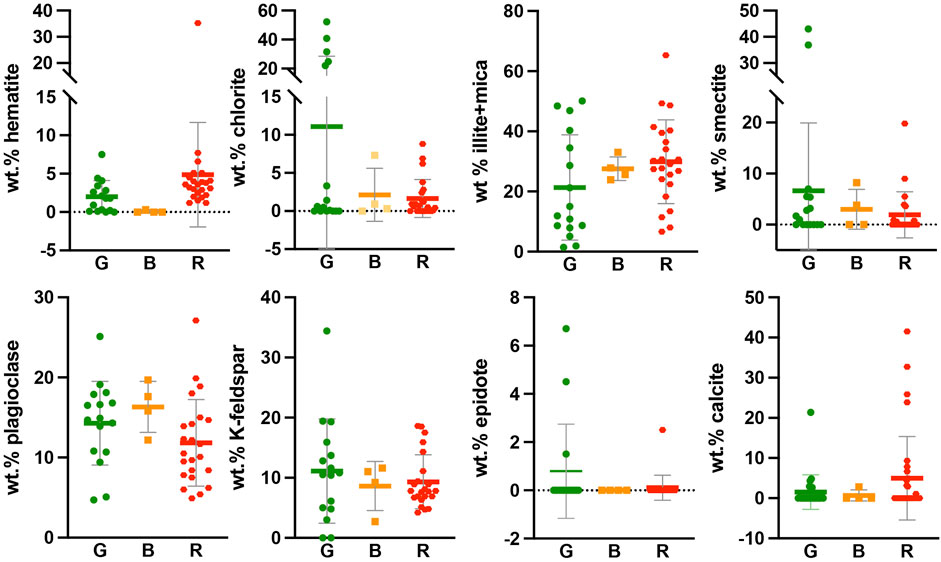
FIGURE 7. Comparisons of the mineralogical abundance of eight key minerals in the red, green, and bleached Cutler formation samples, including the mean and standard deviation.
Counterintuitively, both red and green samples host ferric iron oxide (hematite), verified using XRD and Raman spectroscopy (Supplementary Figure S3). Hematite is the only truly red ferric [Fe(III)] iron oxide, while many Fe(II)-bearing minerals exhibit green colors (Cornell and Schwertmann, 2003). X-ray diffraction subtraction patterns of associated red–green and red-bleached samples revealed high similarities in the red vs. green and red vs. bleached rocks, with similarity percentages ranging from 81% to 97.1%. Hematite abundance decreases as red > green >> bleached. Moreover, chlorite, which is commonly green and typically associated with Fe(II), occurs in both red and green layers.
Statistical comparisons of weight percent means between populations of red (23 samples), green (16), and bleached (4) samples were performed via ANOVA (Figure 7). No statistically significant comparisons could be made with bleached samples due to the low number of samples. Mean chlorite wt% values are significantly higher in the green samples (11.1%) compared with the red samples (1.6%, p-value 0.0283). Other sample means that are not significant by ANOVA are still worth noting, having p-values near 0.2. Hematite averages 3.5% in the red samples, 2.0% in the green samples, and zero in the bleached (Figure 7). There is more illite + mica on average in the red samples (30.2%) than in the green (21.7%) or bleached samples (27.9%). Smectite exhibits the highest abundance in the green samples (7.5%), followed by the bleached (3.7%) and red samples (2%). The mean plagioclase content is highest in the bleached (16.5%) and green samples (14.7%) and lowest in the red samples (12.0%). Potassium feldspar is similar across all rock colors. The quartz content averages lowest in the green samples and highest in the red samples. Epidote occurs primarily in green samples (Figure 7). Calcite is most prevalent in the red samples collected farthest (∼8 km) from the surface expression of basement onlap but remains a minor constituent throughout the formation (present in 21 samples).
The two Precambrian rocks were plotted on a Streckeisen QAP diagram to classify each rock (Streckeisen, 1974). The QAP of samples 1218-26D and 1218-28VMQM are 37:60:3 and 34:34:32, respectively. Sample 1218-26D is identified as an alkali-feldspar granite and is one of the siliciclastic Cutler source rocks in the study area, as determined by the mineralogy and direct contact of this basement rock with the Cutler Formation. The bulk mineralogy of this sample contains 4.6% chlorite, 10.2% illite + mica, 1.3% hematite, and 1.3% epidote. Sample 1218-28VMQM is a potential Cutler Formation source rock identified as a monzo-granite that does not host chlorite or hematite but contains 5.9% illite + mica and 0.3% epidote. Full wt% values are reported in Supplementary Table S2.
k-means cluster analyses
Cluster analyses attempted to generate patterns connecting rock sample color, bulk mineralogical compositions, and spatial distribution. Ten clusters were generated, although three were outliers with only one member (Figure 8; Supplementary Figure S4). Perhaps the strongest link between spatial location and mineralogy is cluster 10, in which chlorite is >20% in each sample, with a corresponding decrease in illite + mica. All samples in cluster group 10 are in sections V–VII (highly proximal), have coarse grain sizes, and are described as some variation of green. The inverse relationship between abundances of chlorite and illite + mica indicates that mica was altered to chlorite. Cluster 3 includes two samples that are spatially separated but related along the strike with high smectite:illite + mica ratios, suggesting mica alteration to smectite. Calcite is present from 0% to 10% throughout the samples and only exceeds 20% in five samples, cluster group 1, which are primarily red samples farthest from the basement contact. A general trend of high illite+mica:chlorite ratios occurs in cluster groups 2, 8, and 9, with no general spatial commonalities among the three clusters. Group 2 represents red bed samples from section XII, about 8 km from the onlap contact; groups 8 and 9 are proximal-most samples that trend southeast to northwest from the mouth of Unaweep Canyon to the Colorado–Utah border.
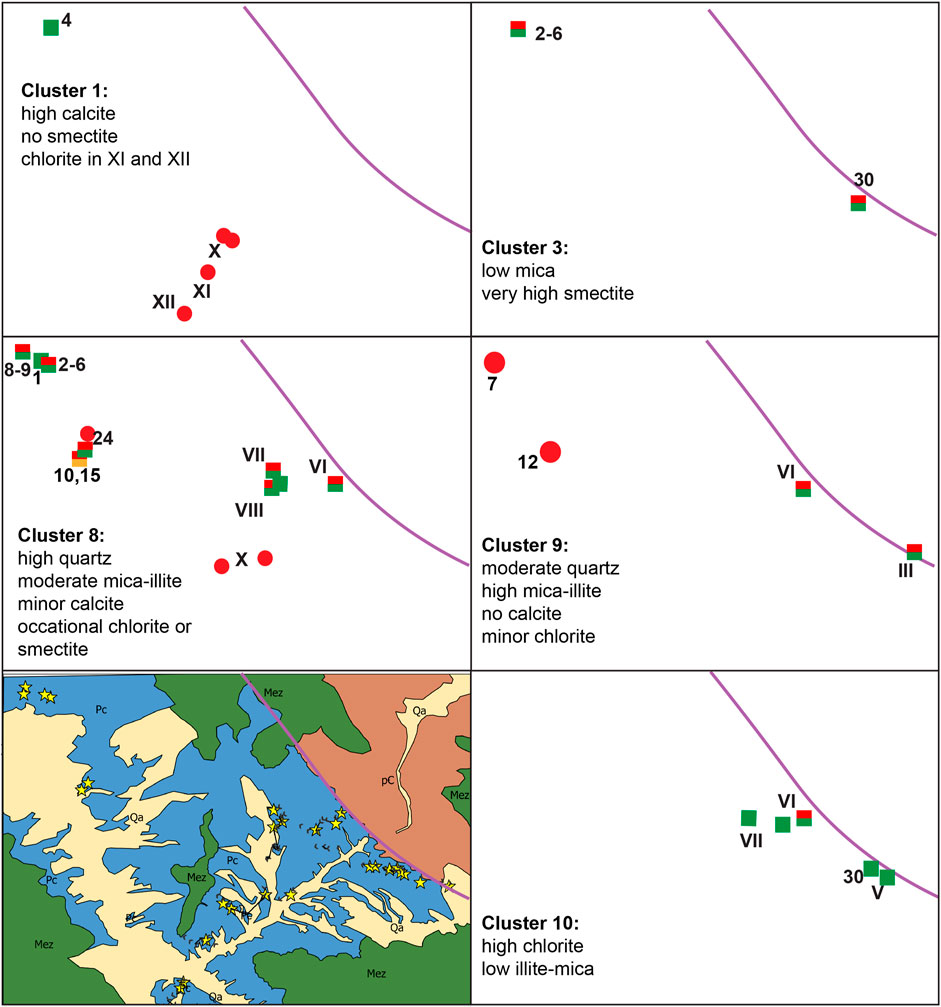
FIGURE 8. K-means cluster analysis sample location map showing the distribution of samples included in each cluster. Symbols indicate the color of the rock samples, and numbers/Roman numerals correspond to those from the sample names and measured sections. Lower left corresponds to the geologic map shown earlier with stars to indicate the locations of the collected samples.
Clay fraction mineralogy
The clay mineralogy of the Cutler Formation consists of abundant illite/smectite, illite, smectite, corrensite, and chlorite plus chlorite/smectite in one sample (53S V-1 Green) without any evidence of kaolinite (Supplementary Tables S3, S4). Examples of representative traces with mineral phase assignments are provided in Supplementary Figure S5. Previous studies of the proximal Cutler also found abundant chlorite, smectite, and illite but suggested the presence of minor kaolinite throughout the formation and lacked discussion on mixed-layer clays (Werner, 1974; Dutta and Suttner, 1986). In some cases, the dominance of smectite or chlorite was inconsistent between whole-rock and clay-size fractions. These differences can be reconciled due to the greater sensitivity of clay fraction analyses to phyllosilicates specifically, along with the likely exclusion of many clay minerals associated with larger biotite grains during clay size separation.
Chlorite/smectite with regular interstratification occurs in a range of samples from across the entire study area (53 III-14C green, 53 IV-244.5 red, 1218-15 red, 1218-10 red and bleached, 63 XII-16.5 red, and 63 XII-37.5 red), only entirely absent from section VI–VIII (Supplementary Table S3; Supplementary Figure S5). A green clay sample, MC-01-1078, collected from a fracture at 328.6 m (1,078 ft) subsurface in the gneiss basement of Massey Core #1 is regularly interstratified chlorite/smectite (Supplementary Figures S6, S7). All samples in sections VII–X plus the western proximal samples contain some amount of smectite. The distal-most section XII samples instead host corrensite and illite/smectite. Smectite distribution in the proximal-most samples at the mouth of Unaweep Canyon is not consistent throughout the samples. Smectite in the air-dried Cutler samples is primarily present in a minimally hydrated state, giving AD peaks around 12.5Å that swell to 16.9Å upon exposure to ethylene glycol. The clay fractions of green and red sections VI–X all have chlorite, smectite, and illite with no mixed-layer clays. Illite/smectite occurs only in proximal sections III and IV and in the distal-most section XII but is non-unique to the red or the green rocks. No bleached layers have illite/smectite, but all have abundant smectite.
Random clay fraction mounts were used to discriminate dioctahedral versus trioctahedral sheets based on the (060) d-spacings. In many cases, the results suggest mixtures of trioctahedral and dioctahedral phyllosilicates and/or are ambiguous. Peaks associated with trioctahedral phyllosilicates are expected, given that biotite is a dominant trioctahedral primary mineral. In two cases, single-phase clay fractions allowed unambiguous assignment of (060) peaks to a single phase. Dioctahedral smectite clay was extracted from sample 1218-10 Green, with a d(060) of 1.50 Å (Supplementary Figures S8, S9). The sample of mint-green ‘corrensite’ basement fracture fill (MC-01-1078) contains two peaks in the d(060) region; one at 1.538Å, which indicates a trioctahedral clay, and one at 1.507Å, which indicates a dioctahedral clay; thus, this green regularly interstratified chlorite/smectite is interpreted to be tri-di-octahedral (Supplementary Figure S10).
Principal component analysis (PCA) was applied to the semiquantitative dataset to assess potential spatial or stratigraphic patterns of clay distribution across the study area (Figure 9). The first two principal components account for 53% of the variance. Generally, samples from within ∼0.5 km of the basement onlap contact (samples with Arabic numeral labels and from sections III and IV) show a strong influence of smectite (lower left quadrant with yellow ellipse, Figure 9) or a mixture of chlorite and illite/smectite and chlorite (right-hand side and upper-right quadrant, Figure 9). Defying simple generalization, two samples from section XII, 8 km from the onlap, also plot along the I/S vector (Figure 9, right-hand side, gray ellipse). Most samples collected farthest distally show the strongest influence of illite+mica and chlorite, with a smaller smectite contribution (Figure 9, upper-left quadrant, gray ellipse). Finally, two red samples 1218-10 (“10”) and 1218-15 (“15”) that were collected more distally/up-section plot strongly toward the corrensite and C/S vectors.
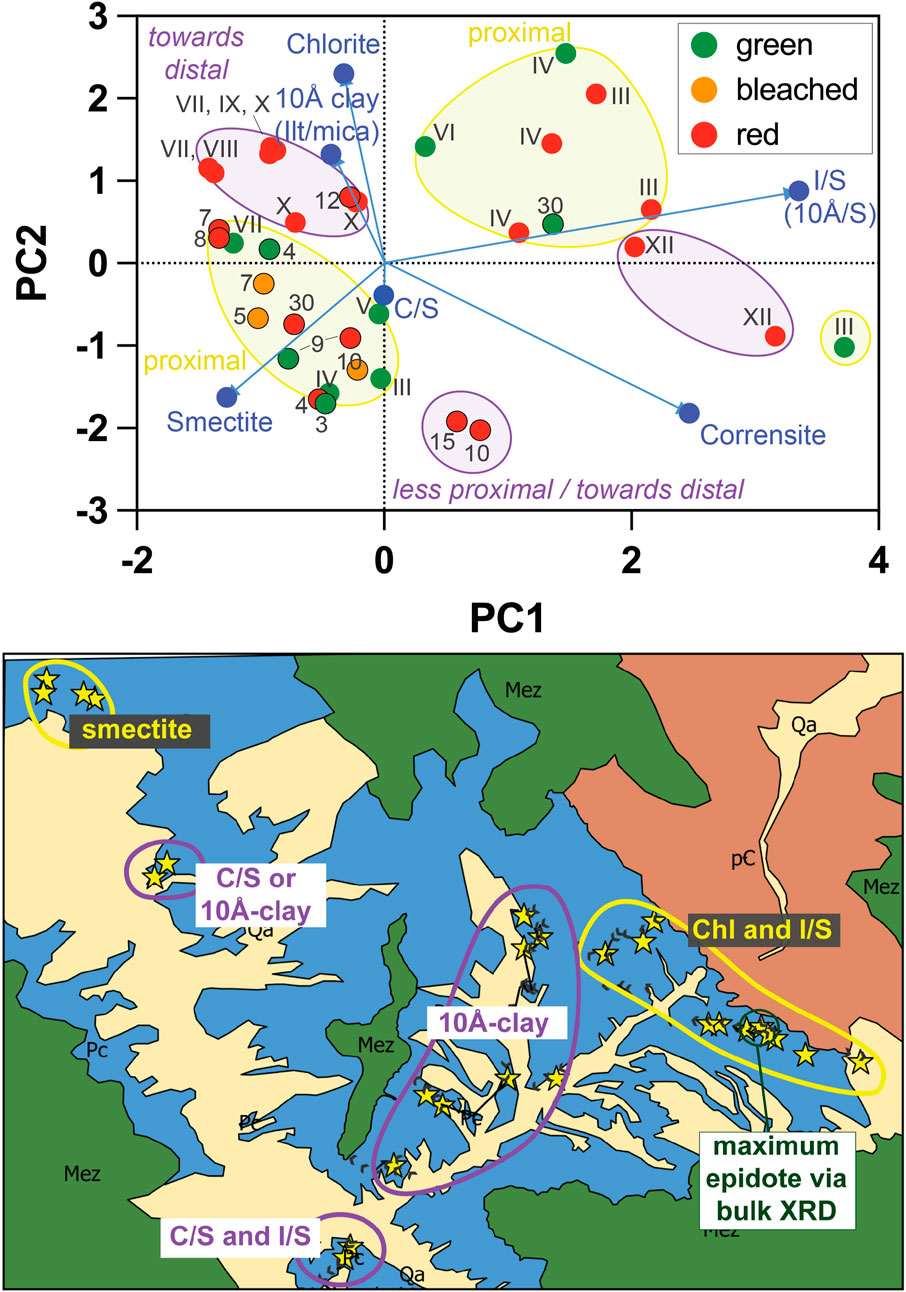
FIGURE 9. Top: PCA plot constructed from semiquantitative clay fraction XRD data. Points are labeled according to their sample/section number, with the corresponding map location shown below. Point color reflects clays that were extracted from a green, bleached, or red sediment layer. Vectors showing the contribution of each clay mineral phase are given in blue. Samples are grouped in colored shapes based on their physical locations, with yellow colors for the most proximal and purple for the more distal. Bottom: Groupings from clay data (top) shown in their map locations, along with major structural features and the location of the highest bulk sediment epidote concentration. Although the samples are mixtures, labels indicate the phase generally with the largest contributor to the PCA analysis. The “10Å clay” indicates that we know there is both illite and biotite mica in the study area, and they may both be present in the clay fraction. “ML” = “mixed layer.” North is oriented to the top of the page.
Grain size
Grain-size variations between the red, green, and bleached sediments were analyzed via optical petrography and SEM. Sections that include red–green and red-bleached redox interfaces consistently demonstrate that the green and bleached areas exhibit a coarser-grained texture relative to finer-grained red regions (Figure 10). For example, sample 53 III-14A has similar volume percentages of biotite in red and green regions, but the biotite grains are ∼1,000 µm in the green and 100–200 µm in the red (Supplementary Figure S11).
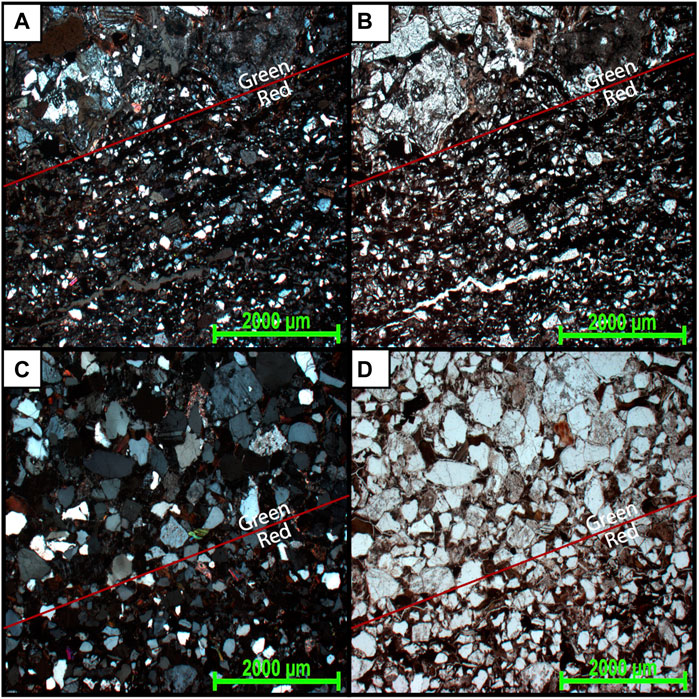
FIGURE 10. Cross-polarized (A,C) and plane-polarized (B,D) petrographic images illustrating grain-size variation between the red and green regions of sample 1218-15. Green colorations are associated with easily visible grain-size coarsening.
Petrography of texture and mineral alteration
Minerals observed in the Cutler samples via petrography are consistent with Werner (1974) and primarily include quartz, micas, rock fragments, feldspars, sparse laumontite, iron oxide grains, various clays, gypsum, and authigenic calcite, as well as heavy-minerals: epidote (var. allanite in some samples), chlorite, tourmaline, rutile, titanite, ilmenite, zircon, magnetite, manganese oxide, and garnet. Micas are primarily biotite or a biotite alteration to clay; however, minor muscovite is present in some samples. Fe oxide grains are pervasive throughout all samples, including hematite ranging up to 500 µm (Supplementary Figure S3). Gypsum cement is present in one sample.
Texturally, samples are immature, with angular-to-sub-angular grains (Figure 12; Supplementary Figure S11, 12). In addition to their generally finer grain size, the red samples are more compacted than the green samples, with oriented biotites, for example (Supplementary Figure S12). In general, the most predominant mineral alteration is the transformation of biotite to smectite or chlorite. We found this relationship holds for all samples investigated in this study: those with lower-than-average illite + mica contents had either elevated chlorite or elevated smectite via bulk XRD (Supplementary Figure S13). Therefore, additional details regarding biotite alteration are warranted.
Biotite ranges in chemical and textural alteration from relatively pristine to completely replaced by clays and Fe-Ti oxides and includes additional mineral intergrowths. Oxide replacement of biotite ranges from a “dusting” of nanoscale islands to micron-scale growths in interlayers to complete replacement by iron oxide (Supplementary Figure S14). Other biotite intergrowths include quartz, apatite, titanite, rutile, fluorite, fluorapatite, barite, and calcite (Supplementary Figure S15). The iron–titanium oxide, titanite, apatite, and quartz replacements occur in the red, green, and bleached samples. Calcite intergrowths occur between biotite interlayers in proximal sample 53 III-14A in both the red and green samples with and without iron oxide replacement. On the other hand, rutile, barite, fluorite, and fluorapatite intergrowths occur only in the green/bleached samples.
Many clays are associated with biotite alteration that is evident via iron and magnesium content plus the loss of K+ ions and addition of Al. As an example, altered biotite from sample 53-14C Green has composition of K0.8(Mg1.2, Fe1.2, Al0.6)(Si3.2, Al0.8)O10(OH)2 as determined by EPMA (Supplementary Table S5). We observed authigenic smectite and potential epidote formation via SEM in sample 1218-03 Green. The Al-rich smectite is typical of smectites found in many other altered samples (Figure 11). Supplementary Figure S16A illustrates the only example we found to date demonstrating potential epidote authigenesis. The epidote hosts no signs of weathering and occurs within the Na-Mg clay matrix of the sample in tandem with altered biotite (Supplementary Figure S16A). Typically, epidote occurrences we observed in Cutler Formation samples exhibit fractures from mechanical weathering.
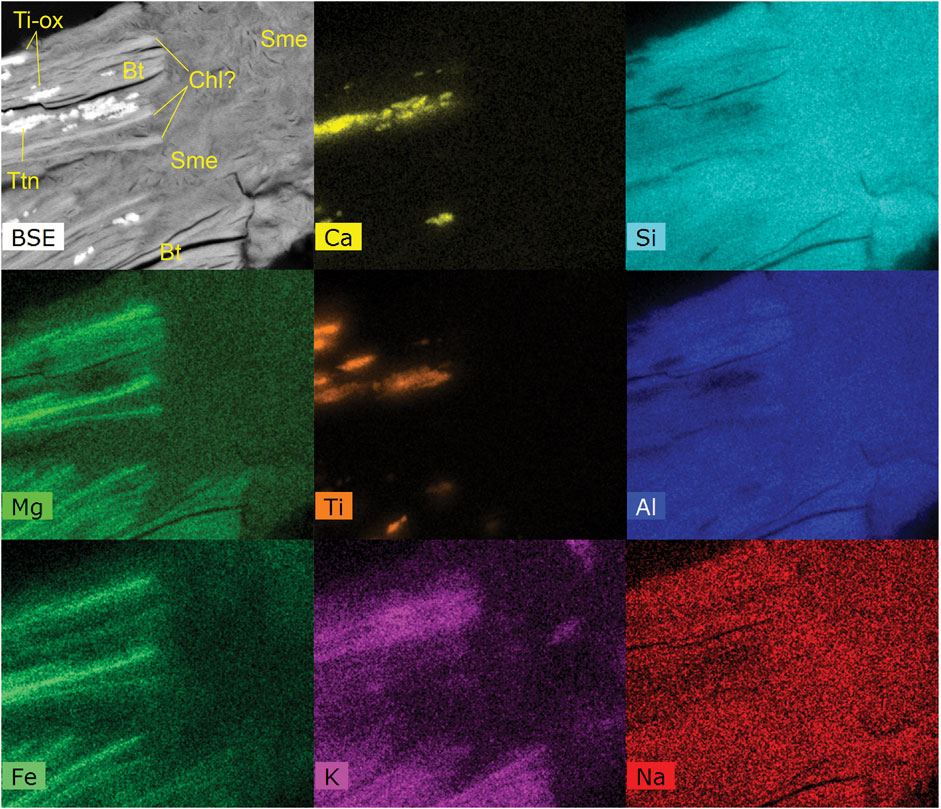
FIGURE 11. SEM-EDXA data from sample 1218-03 Green. A backscattered electron image (BSE) and X-ray count maps of various elements from the same region. These data illustrate biotite (Bt) potential chloritization in high-Fe/Mg low-K areas (Chl?), abundant Al-smectite (Sme, low in Fe and Mg), and the presence of titanite (Ttn, high Ca/Ti). Each field of view is ∼40 by 50 microns.
Samples in contact with or near the basement at the western mouth of Unaweep Canyon have the highest chlorite content. These samples also exhibit evidence of biotite chloritization, but other samples noted to contain chlorite via XRD simply host spherulitic chlorite throughout the sample, typically in association with biotite (Supplementary Figure S16B). This does not discount detrital chlorite, since chlorite also occurs in the potential source rock, 1218-26D.
Titanium is pervasive in different forms throughout the samples, including evidence for Ti-bearing clays and altered biotites in the green and bleached samples. Ti-oxides occur only as biotite intergrowths in the green and bleached samples. Sample 1218-15 Bleach hosts Fe-Ti-oxide rims around quartz and biotite in the presence of Fe-rich clay that follows an apparent preferential flow pathway for alteration fluids (Supplementary Figure S16C).
Some samples exhibit evidence of a past sulfate-bearing fluid alteration. Sulfur-rich sample 1218-03 Green contains gypsum cement, sulfur-bearing clays, and thenardite, an anhydrous sodium sulfate (Supplementary Figure S17). Sample 53S V-1 has barite crystals plus barite intergrowths in biotite (Supplementary Figure S18). Sample 63-27 includes regions of apparent hematite replacements of magnetite (martite).
Mössbauer spectroscopy paired with whole-rock geochemistry
Three proximal samples (1218-03 Green, 1218-15 Bleached, and 1218-15 Red) were selected for Mössbauer spectroscopy, providing additional information about the mineralogy and oxidation state of iron in these samples. Therefore, we also include whole-rock geochemistry results for these samples and separately present the XRD results of these three samples. According to XRD bulk mineralogy, sample 1218-03 green contains almost 10 times more smectite but less illite + mica than the bleached and red samples (Figure 13; Supplementary Table S5). The XRD patterns from Sample 1218-15 red and bleached were 96.5% similar, differing mostly in the presence of hematite in the red sample, which is absent in the bleached sample (Supplementary Figure S19, left). The green and bleached XRD patterns were 93.6% similar, with differences clearly visible in the low-angle phyllosilicate region, where the green sample exhibits smectitic >10Å d-spacings compared to the bleached sample dominated by 10Å phases (illite + mica, Figure 13; Supplementary Figure S19, right). The red sample overall has more illite + mica and hematite than the other two samples. The elevated smectite in the green and bleached samples corresponds to the lower amount of 10Å phases (illite + mica).
Whole-rock geochemical analyses of splits from the same three RGB samples demonstrate that most major and trace elements occur in similar concentrations. However, there are notable differences (Table 1): 1) the green and bleached rocks have approximately half as much total iron as the red at 2.98 wt%, 3.19 wt%, and 6.49 wt%, respectively, 2) the green sample has much higher Fe(II)/Fe(III) (green 51.8% > bleached 36.3% > red 29.5%), and 3) the green sample has considerably higher uranium (green 14.35 > red 2.26 > bleached 1.82 ppm U) and vanadium (green 100 > red 44 > bleached 42 ppm V).
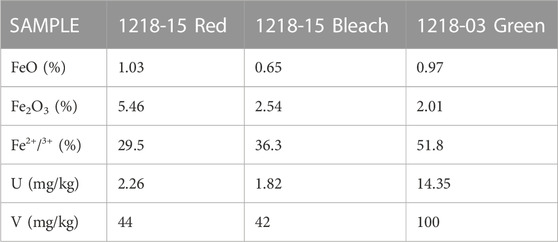
TABLE 1. Whole-rock geochemistry of three representative RGB samples with a focus on Fe(II) as FeO, Fe(III) as Fe2O3, U, and V.
Splits of the same samples were analyzed by Mössbauer spectroscopy at room temperature (RT), liquid nitrogen (77 K), and 12 K temperatures to resolve the contributions of crystalline Fe oxides, such as hematite and goethite, from their nanocrystalline counterparts and Fe sequestered in various forms of aluminosilicate minerals, such as phyllosilicates and feldspars (Noel et al., 2019; Zhao et al., 2020), (Supplementary Figure S20). RT spectral modeling of the red sample unambiguously indicates that the bulk of Fe in this sample is hematite (∼60% of total Fe), the only Fe oxide evident in powder XRD (Supplementary Figure S10); additionally, ∼10% of Fe is in epidote (Grodzicki et al., 2001), and the remainder occurs in silicate minerals—most likely phyllosilicates and feldspars (Boiteau et al., 2020), given their detection in XRD. More importantly, the lack of significant difference in spectral features among RT, 77 K, and 12 spectra suggests the sample is free of goethite and easily reducible Fe oxides, such as ferrihydrite. Crystalline hematite, on the other hand, is not evident in the RT Mössbauer spectra of the green and bleached samples. The green sample also contains epidote and Fe in clay/feldspar, with a minor amount of small-particle Fe oxide (* in 77 and 12 K spectra, Supplementary Figure S20). Unambiguous attribution of the small-particle Fe oxide to a particular phase is not possible with the present data; the broad sextet in 77 K spectrum is likely a mixture of small-particle/Al-substituted hematite and maghemite with oxyanion (e.g., silicate) coatings. The proportion of Fe(II)/Fe(III) in the clay/feldspar fraction is significantly higher, approximately 50%. Such a high Fe(II)/Fe(III) ratio compared to the red sample is expected given the influence of reducing conditions. The bleached spectra are generally similar to the green but with clay/feldspar signals dominated by Fe(III).
Discussion
Mineralogical and textural evidence for fluid alteration
In general, the k-means clustering analysis of the bulk XRD (Figure 8; Supplementary Figure S4) and the PCA analysis of the clay fraction XRD (Figure 9) showed that mineralogical trends varied spatially across the study area. Pairs of red/green samples were often in the same cluster/group depending on their map locality. For example, bulk XRD Clusters 9 and 10 together overlap with the “Chlorite and illite/smectite dominant” proximal-most zone in the clay fraction samples; these samples show biotite alteration to chlorite. Many of the other clusters do not show a clear correspondence to the clay fraction PCA, although many of the samples that were neither proximal-most nor distal-most occur in Cluster 8. We next discuss the observed mineralogical and textural features related to specific mineral types.
Iron and titanium oxides suggest post-depositional oxidation
The timing and mechanisms of the Cutler Group reddening remain an important and unresolved issue, as with many red bed units (e.g., Dubiel and Smoot, 1995; Sheldon, 2005; Soreghan et al., 2015a; Yan et al., 2019). Our research generally supports the paradigm (e.g., Van Houten, 1973; Thorson, 2018) that Cutler strata likely accumulated without any distinct red coloration (Figures 13, 14), with reddening occurring largely during diagenesis owing to the alteration of iron oxide and Fe-bearing silicate grains (Ixer et al., 1979; Elmore and Van der Voo, 1982). Evidence for post-depositional oxidation during diagenesis includes hematite-rimmed quartz grains, the lack of hematite on grain-to-grain contacts, and coarse-grained authigenic hematite that are likely pyrite or magnetite pseudomorphs (Werner, 1974) (e.g., Figure 2; Supplementary Figures S3, S11, S13). However, fine particle hematite formation and reddening from Fe(II) oxidation at the time of deposition or in the near-surface weathering environment may have occurred in some layers more than others (Figure 13). This is especially important given the recent demonstration that pigmentary hematite accumulations in the Colorado Plateau have been linked to monsoonal climate cycles in the Triassic (Lepre and Olsen, 2021); thus, surface reddening could have a strong paleoclimate significance. Alternatively, freeze-thawing in proglacial systems could influence redox dynamics and lead to the preferential release of ferrous iron (Doi et al., 2021).
Importantly, hematite persists and was detected by XRD in most green samples from across the study area (Figure 7), indicating they would have initially been red or otherwise experienced oxidation prior to green/bleaching alteration. The bleached samples are void of Fe oxide (Figure 7), suggesting the iron was leached from previously red layers. The fragments of the Precambrian parent rock investigated do not host the large (up to 500 µm) hematite grains that are pervasive throughout the Cutler strata (e.g., Supplementary Figures S3, S13) but do contain secondary hematite intergrowths within biotite. We hypothesize that these intergrowths within basement-derived biotite similarly resulted from post-burial alteration (Figure 14). Previously, Ixer et al. (1979) proposed that hematite and rutile (+titanite) form as intergrowths from the intrastratal dissolution of Fe and detrital Ti oxide grains, respectively.
Phyllosilicates
The XRD results (Figure 6; Supplementary Table S3) and microtextural analysis (e.g., Figures 11–13) indicate the Cutler strata contain a mixture of detrital and authigenic phyllosilicates. Biotite is a primary detrital phyllosilicate, while the other phases were either authigenic or a mixture of detrital and authigenic. Evidence related to the distribution and potential origin of detected phyllosilicates will be discussed in turn.
Biotite is at least partially altered in most red, bleached, and green samples but is on average much less abundant in the green samples and highest in the red samples, with bleached samples in between (Figure 6). The green samples also have the highest population means for smectite and chlorite. Quartz, apatite, hematite, calcite, and titanite intergrowths occur in both the red and green rocks; therefore, they likely formed from oxidizing fluids during diagenesis prior to greening/bleaching. Under reducing conditions, iron(III) oxides are not produced as Fe(II) is mobile or perhaps included as Fe(II) in authigenic phyllosilicates (Murakami et al., 2004; Sugimori et al., 2008). An inverse relationship between biotite and smectitic or chloritic phases in bulk XRD of several proximal samples (Supplementary Figure S13) indicates that biotite alteration to smectite and chlorite phases occurred post-deposition. Chlorite occurs throughout the samples and in the basement rock; therefore, some of the chlorite is also interpreted as detrital. Case (1991) reported that most Proterozoic basement rocks that sourced the proximal Cutler Formation sediments have abundant biotite, but specific mention of chlorite or chloritization occurs only in one unit located much farther to the northeast than the study area.
When comparing the clay mineralogy of the green-bleached rocks to their red counterparts, the green-bleached samples consistently host more smectite than the red samples (Figure 6). This suggests that the abundant pure smectite post-dates the Permian and likely reflects post-diagenetic fluid alteration. The abundance of smectite in the Permian rocks is consistent with the continued post-diagenetic alteration. Globally, smectite content drastically decreases over geologic time such that formation ages of the Eocene–present yield 40%–60% smectite but ages in the Paleozoic (i.e. Permian) do not exceed 10% (Thompson and Hower, 1975; Meunier, 2005).
To explain the abundant smectite in the Cutler Formation strata, Dutta and Suttner (1986) assumed the regional climate was arid, leading to alkaline and saline early diagenetic pore fluid that was rich in Mg and Si and thus the formation of authigenic trioctahedral Mg-rich smectite (e.g., Deocampo, 2004). However, our measurements of smectite in the proximal Cutler Formation indicate dioctahedral Al-rich smectite (e.g., Figure 12), suggesting the action of acidic to neutral fluids that could occur during temperate chemical weathering or low-temperature hydrothermal alteration.
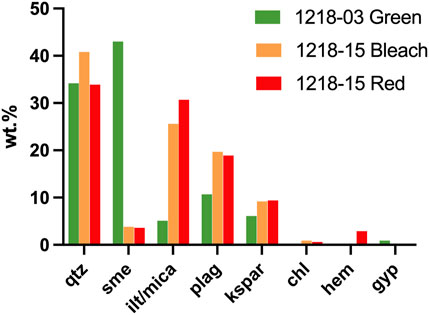
FIGURE 12. Bulk mineralogy of three representative red, green, and bleached samples used for Mössbauer spectroscopy.
I/S was detected in 8 out of 39 clay fraction samples (Supplementary Table S3). Typically, as burial increases and temperatures exceed 100°C, smectite loses its stability and transforms to illite over time (Meunier, 2005). The transformation sequence includes intermediate phases of randomly ordered and regularly ordered illite/smectite (I/S) (e.g., Meunier, 2005). Although the temperature history of the proximal Cutler Formation remains debated (e.g., Campbell, 1979; Dutta and Suttner, 1986; Soreghan et al., 2009), regional thermal modeling suggests maximum burial temperatures of just over 100°C and a later heating event associated at least in part with the late Oligocene (∼20–25 Ma) La Sal magmatism (Thomson et al., 2012; Rønnevik et al., 2017). Thus, the proximal Cutler likely experienced some smectite-to-I/S transformation during burial diagenesis. However, discrete smectite was present in only 2 of the 8 I/S-bearing samples and in 29 of the 39 oriented mounts investigated in this study (Supplementary Table S3)—an inverse relationship between the presence of discrete smectite and I/S. Further study will be needed to test hypotheses that can explain this relationship.
The presence of chlorite/smectite is a particularly interesting part of the phyllosilicate story. Regularly interstratified mixed-layer clays commonly form from biotite weathering and alteration in part because potassium loss along one interlayer increases the stability of the adjacent layers directly above and below; moreover, in some cases, two biotite layers transform into a single altered layer (e.g., Banfield and Eggleton, 1988; Murakami et al., 1999). The chemistry of the C/S provides clues as to the environment of formation. Regularly interstratified C/S is most commonly associated with saline alteration at alkaline pHs, producing Mg-rich trioctahedral “corrensite” (Reynolds, 1988). Corrensite is also commonly associated with biotite chloritization in neutral-to-alkaline hydrothermal alteration and low-grade metamorphic environments as an intermediate phase (e.g., Parneix et al., 1985; Jiang and Peacor, 1994; Velde, 1995). However, tri/di-octahedral regularly interstratified C/S known as “tosudite” has also been associated with the hydrothermal alteration of intermediate/acid crystalline rocks (Reynolds, 1988; Środoń, 1999). Eberl (1978) found that tri/di tosudite can form directly via the hydrothermal alteration of dioctahedral smectites.
In the proximal Cutler samples investigated in this study, isolated “pure” phases of smectite or C/S were difficult to locate in thin sections. We were not able to isolate C/S in the Cutler Formation sediments for the EDXA analyses; future investigations are planned via transmission electron microscopy beyond the scope of this study. However, peak intensity ratios of oriented glycolated clay mounts had intensity ratios of I(006) > I(004) (Supplementary Figure S20), indicative of dioctahedral tosudite (Reynolds, 1988). Smectites are Al rich (Al >> Mg > Fe) and dioctahedral, based on EDXA spectra and (060) spacings observed in XRD patterns from random mounts of the clay fraction. Speculatively, Al-smectite layers may have been added to trioctahedral biotite in the Cutler Formation, forming tosudite. Morrison and Perry (1986) investigated clay minerals in the Cutler Formation from bleached zones along the Lisbon fault (in the Paradox Basin ∼80 km southwest; similar to the study area of Reynolds et al., 1985). They found authigenic Al-rich smectite and corrensite (di/di octahedral or Al-“tosudite”) that they associated with acidic hydrothermal fluids traveling upwards along the fault and reacting with aluminous phases such as kaolinite or K-feldspar.
In addition to the proximal Cutler samples, we analyzed green fracture-filling clay in a basement rock core from Unaweep Canyon (Supplementary Figure S6), sample MC-01-1078. The clay fraction was entirely composed of regularly interstratified C/S (Supplementary Figure S7), which was tri-di-octahedral based on the (060) d-spacings 1.538 Å and 1.507 Å, respectively (Supplementary Figure S10); however, the peak intensity ratios of this sample showed the opposite pattern of I(004)>(006), more consistent with corrensite or high-Fe tosudite (Supplementary Figure S21). Further investigation of clay octahedral sheet chemistry in the proximal-to-distal Cutler Formation would help to clarify the nature and significance of the smectite, corrensite, and chlorite chemistries.
Epidote
Epidote, Ca2(Al, Fe)3Si3O12(OH), contains variable amounts of ferric iron (Fe3+) and aluminum (Myer, 1965). Ferric iron typically contributes to red coloration in hematite because of its face-sharing octahedra that adsorb slower wavelengths of light. Epidote, however, becomes green–dark green when the amount of Fe3+ substitution increases because it increases the size of the edge-sharing octahedra and, correspondingly, the unit cell edge volume (Myer, 1965), generating yellow–green–brown colors. Epidote in the Cutler samples is higher in the green (1.6%–7.6%) than in the basement rocks (0.3%–1.3%) from which they were derived, suggesting potential authigenic epidote formation in addition to detrital epidote. Epidote was only observed via XRD in one red sample, 1218-24, and was not detected in the bleached samples (Figure 7). Mössbauer spectroscopy indicates the presence of Fe(II) in addition to Fe(III) in epidote in both the red and green samples (Supplementary Figure S20).
Sulfate minerals
Gypsum, thenardite, and barite were observed rarely in the green samples from the northwest of our study area (Supplementary Figures S15–S17). Fine-grained clays from these samples also show Na and S in some EDS spectra, indicative of Na-sulfate fluid interactions. Previously, Breit et al. (1990) used isotopic methods to demonstrate that barite in the western Paradox basin (including our study area) was associated with basinal brines from the underlying evaporative-bearing sediments interacting with clastic rocks on their way to the surface. The persistence of gypsum and thenardite suggests that these rocks, and therefore their green colors, have not experienced significant flushing since sulfate mineral formation. These data suggest that the persistence of the green color in the northwest of the study area (e.g., Figures 2D–F) does not originate from reducing groundwater that flows downgradient from the Uncompahgre uplift. However, we note that sulfate minerals are absent in the green samples closer to Gateway, CO, and more directly down-dip from Unaweep Canyon.
Overview of alteration sequence
Based on our field and petrographic observations, many proximal Cutler Formation rocks in our study area experienced at least three distinct phases of mineral alteration: 1) oxidative reddening, 2) reductive fluid alteration, forming bleached and green colorations, and 3) sulfate-rich fluid alteration (Figures 13, 14). Alteration due to meteoric infiltration and flow of groundwater from the up-dip Unaweep Canyon region continues. This groundwater contains uranium from contact with the Precambrian crystalline rocks (Faluso, 2021), which can be reduced and accumulated in the Fe(II)-rich green layers.
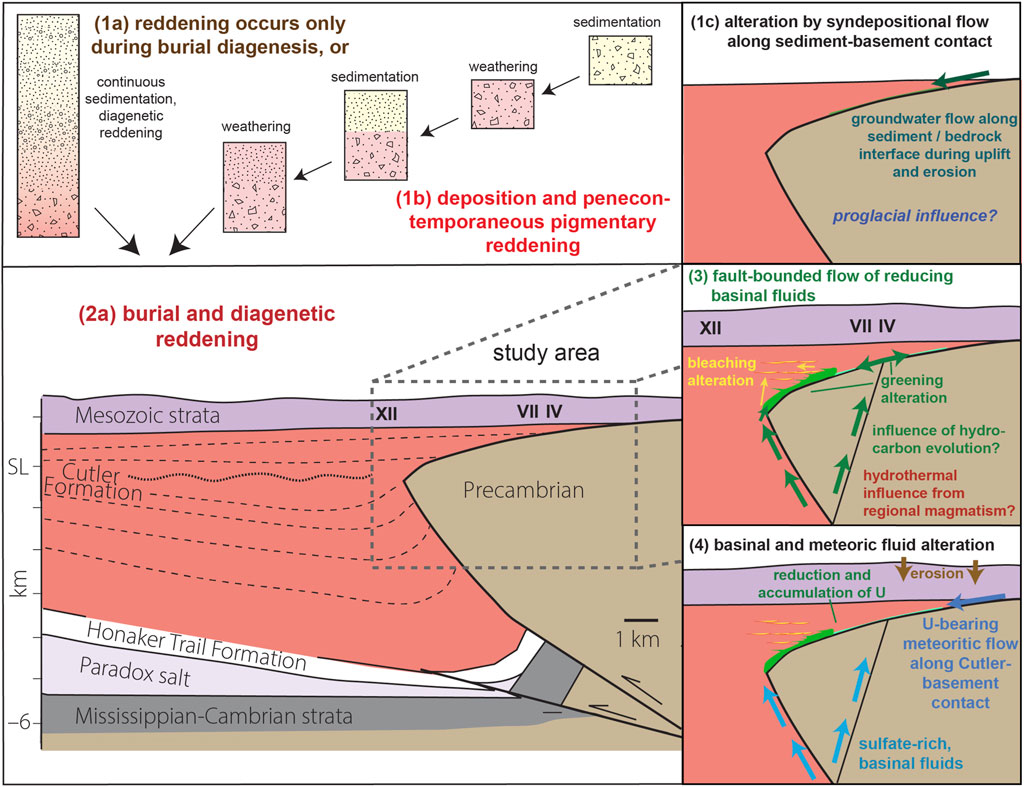
FIGURE 13. Paragenetic sequence of events in that can work from the time of deposition to recent, based on petrographic and geochemical data. “Smectite + ML” represents pure smectite + illite/smectite and chlorite/smectite.
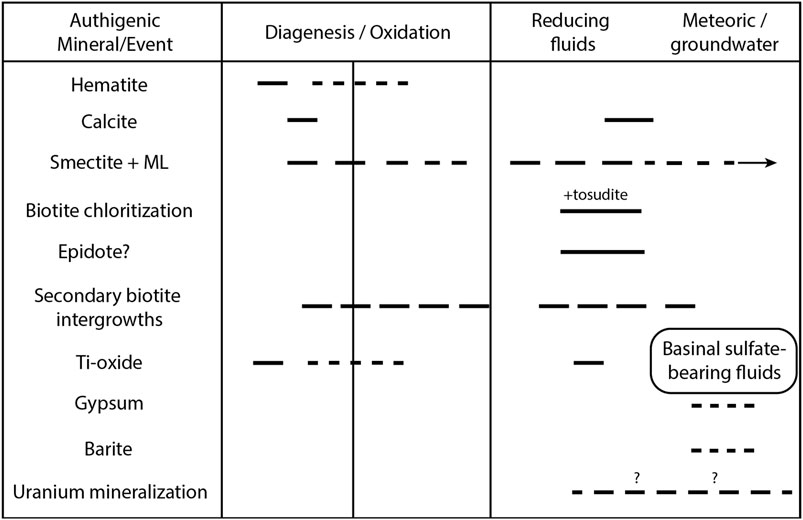
FIGURE 14. Generalized schematic of proposed Permian red bed color transformations along with potential pathways of fluid alteration to explain the spatial distribution of green and bleached layers. The orientation of the cross-section is similar to that in Figure 4 but projected more deeply into the subsurface.
We suggest that the green-bleached intercalations result from one or more episodes of reducing basinal hydrothermal fluids that migrated upward, preferentially infiltrating more permeable and coarse-grained layers near the (buried) Uncompahgre uplift bounding fault system. Bleached and green layers are inferred to be more permeable than the red layers based on grain size and field observations and to have therefore served as preferential fluid pathways. The proximal green rocks contain a greater proportion of Fe(II), whereas Fe(III) (e.g., Table 1; Supplementary Figure S20) reduced in bleached layers was likely solubilized and transported into adjacent red areas or flushed away.
An alternate model for the reddening of Cutler sediments could be 1) pigmentary hematite formed during penecontemporaneous weathering, 2) further hematization occurred during diagenesis, followed by 3) reduction via hydrothermal/reducing/basinal fluids to form green and bleached layers, and finally, 4) sulfate minerals in pore spaces in the green altered rock suggest the influence of sulfate-bearing fluids that post-date the original greening reduction event.
Conduits for reducing fluids include faults, fractures, and the basement onlap contact with overlying Cutler strata. Fault-associated fluid alteration in the Paradox basin is well established (e.g., Jacobs and Kerr, 1965; Morrison and Parry, 1986; Briet et al., 1990; Bailey et al., 2021; MacIntyre et al., 2023). However, alteration in the proximal-most Cutler is unique owing to 1) the spatial association down-dip from the Unaweep Canyon paleovalley (Soreghan et al., 2005b) and 2) the onlap contact of the Cutler Formation with the Precambrian basement here. We hypothesize that the Precambrian basement/Cutler contact serves as an additional preferential fluid pathway.
Significance of findings in the context of previous Paradox Basin studies
Discriminating the timing and extent of regional fluid alteration events remains an active area of research, with historical ideas summarized by Dahlkamp (2010) and Shawe (2011). Potential sources of fluid alteration that might have influenced the proximal Cutler Formation include meteoric syn-depositional and diagenetic groundwaters, Paradox basin fluids expelled during the Permo-Triassic salt tectonic valley collapse (Thompson et al., 2018), large-scale regional groundwater flow (Sanford, 1982), hydrocarbon evolution, dewatering in overlying Mesozoic mudstone during burial and compaction, fluids mobilized during the Laramide orogeny, fluids associated with multiple regional Tertiary volcanic episodes to the east, southeast, south, and southwest, basinal groundwaters brought to the surface by erosional reconfiguring of regional hydrologic gradients, and modern meteoric groundwater (e.g., Barton et al., 2018; Bailey et al., 2021; Bailey et al., 2022; Kim et al., 2022).
In particular, the La Sal Mountain laccolith, located 30–40 km southwest of the study area, caused regional hydrothermal activity during the early Tertiary (Shawe, 2011; Thomson et al., 2015). Chan, Parry, and Bowman (2000) determined the La Sal Mountain activity to have occurred from 28 to 25 Ma; thus, over a span of 4 Ma. This igneous activity heated formation waters in the Paradox Basin that subsequently followed permeable flow paths along fault zones and within the Uravan mineral belt (Shawe, 2011). The reduced (often sulfide and/or hydrocarbon-bearing) formation fluids, in tandem with the water expelled from magmas, interacted with subsurface sediments during flow and led to deposition upon mixing with other more oxidizing fluids at the chemical/redox interfaces (Shawe, 2011). More recent studies (e.g., Bailey et al., 2021; Bailey et al., 2022; Kim et al., 2022; MacIntrye et al., 2023) also highlight the importance of sulfide-bearing fluids from Paradox Basin hydrocarbon maturation as sources of sulfur-rich fluids that migrated upwards extensively along faults in the Cretaceous to Paleogene. Occurrences of sulfate minerals in the green samples from our study support this model.
Clay mineralogy and chemistry in the study area of the proximal Cutler region provided both expected and surprising results. Acidic alteration typically leads to kaolinite formation, as observed across many Paradox Basin deposits influenced by fluid flow (e.g., Barton et al., 2018; Bailey et al., 2021; MacIntyre et al., 2023). In contrast, smectite, tosudite/corrensite, and chlorite are the clay products observed in the proximal Cutler Formation, indicating Mg/Ca-bearing intermediate or basic pH fluid alteration. The tri/di tosudite observed in this study also differs from the di/di corrensite reported along the Lisbon fault (Morrison and Parry, 1986), although dioctahedral smectites occur in both. Likely, the abundance of primary trioctahedral biotite in the proximal Cutler explains the difference. However, the abundance of octahedral Al in proximal Cutler/basement fracture-fill smectite and corrensite implies Al mobility and acidic conditions or perhaps breakdown of kaolinite (Morrison and Parry, 1986). We have no current evidence of kaolinite occurrence in our samples, but the presence of kaolinite during deposition would have large paleoclimatic implications.
Uniqueness of the proximal Cutler setting
The structural and depositional settings of the proximal-most Cutler strata contrast greatly with that of the strata within the Paradox Basin, in that proximal strata onlap Precambrian basement, and—within it—the significant paleorelief and bury the frontal fault zone along which the Uncompahgre highland rose. This setting thus conferred several additional ways in which fluids could have affected the Cutler strata. The proximal-most Cutler strata have been interpreted variously as arid or humid alluvial fan (e.g., Campbell, 1979; Dutta and Suttner, 1986) and as proglacial lacustrine and fluvial (Soreghan et a., 2009), and Dutta and Suttner (1986) interpreted the abundance of chlorite and smectite clays in the Cutler strata to bolster their interpretation of an arid setting. However, this was based on the assumption of Mg-dominated clay precipitation due to pore water concentration of solutes rather than Al-dominated, as observed in our study (e.g., Figure 11; Supplementary Figure S9). In contrast, Soreghan et al.’s (2009) inference of a humid, proglacial setting implies (by modern analog) elevated porewater solutes (e.g., Deuerling et al., 2018) and highly accelerated rates of biotite weathering (Föllmi et al., 2009). This significant contrast in depositional and paleoclimatic interpretation thus carries implications for the evolution of mineral alteration and color development. Studies of weathering associated with modern valley glaciation suggest the unique signatures of proglacial valley groundwaters are oxidative solutions with elevated sulfate and Ca (e.g., Salerno et al., 2016; Torres et al., 2017). Generally, proglacial groundwaters contain dissolved oxygen but are commonly somewhat undersaturated with respect to atmospheric O2 (Brown et al., 1994; Tranter and Wadhawan, 2014). In contrast, weathering under larger ice sheets tends to be associated with the development of anoxia and reducing groundwaters (Wadham et al., 2010; Graly et al., 2014; Andrews and Jacobson, 2018). Although biotite alteration was observed to be significant both in this study and in modern proglacial settings (e.g., Anderson et al., 2000), the observed authigenic mineralogical signatures in the proximal Cutler Formation are not consistent with reduction in low-temperature meteoric solutions. However, the presence of anoxic groundwater flowing down-gradient along the basement–sediment contact may have uniquely preserved the reducing character of the proximal Cutler sediments. Future investigation of Cutler Formation clay chemistry up- and down-section and proximally/distally would help clarify and test the contrasting climate-related hypotheses of Dutta and Suttner (1986) and Soreghan et al. (2009).
Furthermore, the paleorelief visible in the onlap map pattern documents an embayment or small paleovalley carved into basement. Soreghan et al. (2007), Soreghan et al. (2015a) inferred a much larger (partially buried) paleovalley, occupying modern Unaweep Canyon and potentially over-deepened by Permian glacial excavation a few kilometers northeast from the outcrops of the proximal Cutler Formation. Either way, the paleorelief on the basement implies the potential for hydrologic flow along the basement–Cutler interface, and the generally coarse-grained proximal strata with muddy interbeds—whether alluvial fan or proglacial fan—would have enabled hydrothermal fluids from local faults and fractures to flow through the more permeable green-bleached sediments and strip them of some of their hematite/Fe III) oxides. The interplay of location along a tectonic boundary, proglacial(?) paleovalley sedimentary and hydrologic environment, and basinal fluids makes green/bleaching alteration in the proximal Cutler Formation a unique piece to the puzzle of ancient fluid flow, mineralization, and climate at the edge of the Paradox Basin.
Data availability statement
The original contributions presented in the study are included in the article/Supplementary Material, further inquiries can be directed to the corresponding author.
Author contributions
DH collected a majority of the data and wrote a full initial draft for her M.S. thesis. AE led the direction of the project, writing, and additional data collection following DH’s graduation. GS provided motivation for the study, significant edits, access to additional samples from prior projects, and extensive discussions of the regional geological context. RK performed Mössbauer sample data collection and interpretation, in addition to writing contributions. BD created the regional overview map and participated in discussions. KD participated in the field collection of samples and contributed to writing and the conceptual framework for regional fluid movement based on his field sampling and the related work of MS student Joy Foluso. All authors contributed to the article and approved the submitted version.
Funding
A portion of the research was performed using EMSL (grid.436923.9), a DOE Office of Science User Facility sponsored by the Office of Biological and Environmental Research. This research was supported by the Schultz Chair, Maxey Chair, McCollough Chair in the School of Geosciences at the University of Oklahoma, OU Libraries for open access publication fees, and NSF awards #1736255 and 1849623.
Acknowledgments
We are grateful for the assistance of Dr. Lindsey Hunt of the OU Electron Microprobe Laboratory, Preston Larson of the OU Samuel Roberts Noble Microscopy Laboratory (SRNML, SEM), Matt Hamilton (discussions, petrography, and SEM), and Lily Pfeifer (fieldwork).
Conflict of interest
The authors declare that the research was conducted in the absence of any commercial or financial relationships that could be construed as a potential conflict of interest.
Publisher’s note
All claims expressed in this article are solely those of the authors and do not necessarily represent those of their affiliated organizations, or those of the publisher, the editors and the reviewers. Any product that may be evaluated in this article, or claim that may be made by its manufacturer, is not guaranteed or endorsed by the publisher.
Supplementary material
The Supplementary Material for this article can be found online at: https://www.frontiersin.org/articles/10.3389/feart.2023.1219966/full#supplementary-material
References
Anderson, S., Drever, J., Frost, C., and Holden, P. (2000). Chemical weathering in the foreland of a retreating glacier. Geochim. Cosmochim. Acta 64 (7), 1173–1189. doi:10.1016/s0016-7037(99)00358-0
Andrews, M., and Jacobson, A. (2018). Controls on the solute geochemistry of subglacial discharge from the Russell Glacier, Greenland Ice Sheet determined by radiogenic and stable Sr isotope ratios. Geochim. Cosmochim. Acta 329, 312–329. doi:10.1016/j.gca.2018.08.004
Baars, D. L., and Stevenson, G. M. (1981). “Tectonic evolution of the Paradox Basin, Utah and Colorado,” in Western Slope (Western Colorado). New Mexico Geological Society 32nd Annual Fall Field Conference Guidebook. Editor R. C. Epis, and J. F. Callender (Albuquerque, NM: New Mexico Geological Survey), 23–31. doi:10.56577/FFC-32
Bailey, L. R., Drake, H., Whitehouse, M. J., and Reiners, P. W. (2022). Characteristics and consequences of red bed bleaching by hydrocarbon migration: a natural example from the entrada sandstone, southern Utah. Geochem Geophys Geosystems 23, 10465. doi:10.1029/2022gc010465
Bailey, L. R., Kirk, J., Hemming, S. R., Krantz, R. W., and Reiners, P. W. (2021). Eocene fault-controlled fluid flow and mineralization in the Paradox Basin, United States. Geology 50 (3), 326–330. doi:10.1130/g49466.1
Balco, G., Soreghan, G. S., Sweet, D. E., Marra, K. R., and Bierman, P. R. (2013). Cosmogenic-nuclide burial ages for Pleistocene sedimentary fill in Unaweep Canyon, Colorado, USA. Quat. Geochron 18, 149–157. doi:10.1016/j.quageo.2013.02.002
Banfield, J. F., and Eggleton, R. A. (1988). Transmission electron microscope study of biotite weathering. Clays Clay Mineral. 36, 47–60. doi:10.1346/ccmn.1988.0360107
Bankey, V. (2003). Resource potential and geology of the grand mesa, Uncompahgre, and Gunnison (GMUG) national forests and vicinity, Colorado. United States: U.S. Geological Survey.
Bankole, O. M., El Albani, A., Meunier, A., Rouxel, O. J., Gauthier-Lafaye, F., and Bekker, A. (2016). Origin of red beds in the Paleoproterozoic Franceville Basin, Gabon, and implications for sandstone-hosted uranium mineralization. Am. J Sci 316 (9), 839–872. doi:10.2475/09.2016.02
Barton, M. D., Barton, I. F., and Thorson, J. P. (2018). “Paleofluid flow in the Paradox Basin: introduction,” in Paradox Basin fluids and Colorado plateau copper, uranium, and vanadium deposits field trip. Editor J. P. Thorson (Littleton, CO: Society of Economic Geologists), 59. Available at: https://www.segweb.org/Store/detail.aspx?id=EDOCGB59.
Beitler, B., Chan, M. A., and Parry, W. T. (2003). Bleaching of jurassic Navajo sandstone on Colorado plateau Laramide highs: evidence of exhumed hydrocarbon supergiants? Geology 31, 1041–1044. doi:10.1130/g19794.1
Biscaye, P. E. (1965). Mineralogy and sedimentation of recent deep-sea clay in the Atlantic Ocean and adjacent seas and oceans. Geol. Soc. Am. Bull. 76, 803–832. doi:10.1130/0016-7606(1965)76[803:masord]2.0.co;2
Boiteau, R. M., Kukkadapu, R., Cliff, J. B., Smallwood, C. R., Kovarik, L., Wirth, M. G., et al. (2020). Calcareous organic matter coatings sequester siderophores in alkaline soils. Sci. Total Environ. 774, 138250. doi:10.1016/j.scitotenv.2020.138250
Breit, G. N., Goldhaber, M. B., Shawe, D. R., and Simmons, E. C. (1990). Authigenic barite as an indicator of fluid movement through sandstones within the Colorado plateau. SEPM J. Sediment. Res. 60, 884–896. doi:10.1306/d426763b-2b26-11d7-8648000102c1865d
Brown, G. H., Tranter, M., Sharp, M. J., Davies, T. D., and Tsiouris, S. (1994). Dissolved oxygen variations in alpine glacial meltwaters. Earth Surf. Process Landf. 19, 247–253. doi:10.1002/esp.3290190305
Campbell, J. A. (1979). “Lower Permian depositional system, northern Uncompahgre basin,” in Permianland field symposium. Editor D. L. Baars (Durango, CO: Four Corners Geological Society), 13–21.
Campbell, J. A. (1981). “Uranium mineralization and depositional facies in the Permian rocks of the northern Paradox Basin, Utah and Colorado,” in Geology of the Paradox Basin: Rocky mountain association of geologists. Editor D. L. Weigand (Denver, CO: Rocky Mountain Association of Geologists), 187–194.
Case, J. E. (1991). Geologic map of the northwestern part of the Uncompahgre uplift, grand county, Utah, and mesa county, Colorado, with emphasis on proterozoic rocks. Reston, VA: U.S. Geological Survey, 16.
Cater, F. W. (1955). Geology of the Gateway quadrangle, Colorado. Washington, DC: U.S. Geological Survey.
Cater, F. W., and Craig, L. C. (1970). Geology of the salt anticline region in southwestern Colorado. Washington, DC: U.S. Government Printing Office.
Chan, M. A., Parry, W. T., and Bowman, J. R. (2000). Diagenetic hematite and manganese oxides and fault-related fluid flow in Jurassic sandstones, southeastern Utah. AAPG Bull. 84 (9), 1281–1310. doi:10.1306/a9673e82-1738-11d7-8645000102c1865d
Cornell, R. M., and Schwertmann, U. (2003). The iron oxides: structure, properties, reactions, occurrences and uses. Weinheim: Wiley-VCH.
Deocampo, D. M. (2004). Authigenic clays in east africa: regional trends and paleolimnology at the plio–pleistocene boundary, olduvai gorge, Tanzania. J. Paleolimnol. 31, 1–9. doi:10.1023/b:jopl.0000013353.86120.9b
Deuerling, K. M., Martin, J. B., Martin, E. E., and Scribner, C. A. (2018). Hydrologic exchange and chemical weathering in a proglacial watershed near Kangerlussuaq, west Greenland. J. Hydrol. 556, 220–232. doi:10.1016/j.jhydrol.2017.11.002
Doi, M., Harada, M., and Okada, T. (2021). Freezing enhances leaching of ferrous ions but hinders reductive dissolution of ferric ions from iron oxides. ACS Earth Space Chem. 5, 1544–1551. doi:10.1021/acsearthspacechem.1c00071
Dorsey, R. J., and Lazear, G. (2013). A post–6 Ma sediment budget for the Colorado River. Geosphere 9 (4), 781–791. doi:10.1130/ges00784.1
Drever, J. I. (1973). Preparation of oriented clay mineral specimens for x-ray-diffraction analysis by a filter-membrane peel technique. Am. Mineral 58, 553–554.
Dubiel, R. F., Huntoon, J. E., Stanesco, J. D., and Condon, S. M. (2009). “Cutler group alluvial, eolian, and marine deposystems: permian facies relations and climatic variability in the Paradox Basin,” in The Paradox Basin revisited new developments in petroleum systems and basin analysis. Editors W. S. Houston, L. L. Wray, and P. G. Moreland (United States: RMAG Special Publication), 265–308.
Dubiel, R. F., and Smoot, J. P. (1995). “Criteria for interpreting paleoclimate from red beds—a tool for Pangean reconstructions,” in Pangea: global environments and resources. Can soc pet geol mem. Editors A. F. Embry, B. Beauchamp, and D. J. Glass (Denver, CO: Rocky Mountain Association of Geologists), 295–310.
Dutta, P. K., and Suttner, L. J. (1986). Alluvial sandstone composition and paleoclimate; II, Authigenic mineralogy. J Sed Res. 56 (3), 346–358. doi:10.1306/212f890e-2b24-11d7-8648000102c1865d
Eberl, D. (1978). Reaction series for dioctahedral smectites. Clays Clay Min. 26, 327–340. doi:10.1346/ccmn.1978.0260503
Eberl, D. D. (2003). User guide to RockJock-A program for determining quantitative mineralogy from X-ray diffraction data. Boulder, CO: U.S. Geological Survey.
Eberl, D. D., Farmer, V. C., and Barrer, R. M. (1984). Clay mineral formation and transformation in rocks and soils. Phil Trans. R. Soc. Lond. A 311, 241–257. doi:10.1098/rsta.1984.0026
Elmore, R. D., and Van der Voo, R. (1982). Origin of hematite and its associated remanence in the copper harbor conglomerate (keweenawan), upper Michigan. J. Geophys Res. Solid Earth 87 (B13), 10918–10928. doi:10.1029/jb087ib13p10918
Föllmi, K. B., Arn, K., Hosein, R., Adatte, T., and Steinmann, P. (2009). Biogeochemical weathering in sedimentary chronosequences of the Rhône and Oberaar Glaciers (Swiss Alps): rates and mechanisms of biotite weathering. Geoderma 151, 270–281. doi:10.1016/j.geoderma.2009.04.012
Foluso, J. (2021). Hydrogeochemistry of a heterogeneous aquifer located in Unaweep canyon, mesa county, western Colorado. MS Thesis. Oklahoma: University of Oklahoma. Available at: https://shareok.org/handle/11244/329565.
Graly, J. A., Humphrey, N. F., Landowski, C. M., and Harper, J. T. (2014). Chemical weathering under the Greenland ice sheet. Geology 42, 551–554. doi:10.1130/g35370.1
Grodzicki, M., Heuss-Assbichler, S., and Amthauer, G. (2001). Mössbauer investigations and molecular orbital calculations on epidote. Phys. Chem. Mineral. 28 (9), 675–681. doi:10.1007/s002690100150
Hedge, C. E., Peterman, Z. E., Case, J. E., and Obradovich, J. D. (1968). Precambrian geochronology of the northwestern Uncompahgre Plateau, Utah and Colorado. Washington: U.S. Government Printing Office, C91–C96.
Hou, B., Keeling, J., and Li, Z. (2017). Paleovalley-related uranium deposits in Australia and China: a review of geological and exploration models and methods. Ore Geol. Rev. 88, 201–234. doi:10.1016/j.oregeorev.2017.05.005
Ixer, R. A., Turner, P., and Waugh, B. (1979). Authigenic iron and titanium oxides in Triassic red beds: (St. Bees Sandstone), Cumbria, northern England. Geol. J. 14 (2), 179–192. doi:10.1002/gj.3350140114
Jacobs, M., and Kerr, P. (1965). Hydrothermal alteration along the Lisbon valley fault zone, san juan county, Utah. GSA Bull. 76, 423–440. doi:10.1130/0016-7606(1965)76[423:haatlv]2.0.co;2
Jiang, W., and Peacor, D. (1994). Formation of corrensite, chlorite and chlorite-mica stacks by replacement of detrital biotite in low-grade pelitic rocks. J. Metamorph Geol. 12, 867–884. doi:10.1111/j.1525-1314.1994.tb00065.x
Johansen, S. J. (1988). Origins of upper Paleozoic quartzose sandstones, American southwest. Sed. Geol. 56, 153–166. doi:10.1016/0037-0738(88)90052-8
Keiser, L. J., Soreghan, G. S., and Kowalewski, M. L. (2015). Use of quartz microtextural analysis to assess possible proglacial deposition for the pennsylvanian–permian Cutler Formation (Colorado, USA). J. Sed. Res. 85 (11), 1310–1322. doi:10.2110/jsr.2015.81
Kim, J. H., Bailey, L., Noyes, C., Tyne, R. L., Ballentine, C. J., Person, M., et al. (2022). Hydrogeochemical evolution of formation waters responsible for sandstone bleaching and ore mineralization in the Paradox Basin, Colorado Plateau, USA. GSA Bull. 134 (9-10), 2589–2610. doi:10.1130/b36078.1
Kluth, C. F., and Coney, P. J. (1981). Plate tectonics of the ancestral Rocky Mountains. Geology 9 (1), 10–15. doi:10.1130/0016-7606(1985)96<719:PAPEBO>2.0.CO;2
Lafuente, B., Downs, R. T., Yang, H., and Stone, N. (2015). “The power of databases: the RRUFF project,” in Highlights in Mineralogical Crystallography. Editors T. Armbruster, and R. M. Danisi (Berlin, Germany: W. De Gruyter), 1–30. doi:10.1515/9783110417104-003
Langmuir, D. (1978). Uranium solution-mineral equilibria at low temperatures with applications to sedimentary ore deposits. Geochim. Cosmochim. Acta 42 (6), 547–569. doi:10.1016/0016-7037(78)90001-7
Lawton, T. F., Buller, C. D., and Parr, T. R. (2015). Provenance of a permian erg on the western margin of pangea: depositional system of the kungurian (late leonardian) castle valley and white rim sandstones and subjacent cutler group, Paradox Basin, Utah, USA. Geosphere 11 (5), 1475–1506. doi:10.1130/ges01174.1
Lepre, C. J., and Olsen, P. E. (2021). Hematite reconstruction of late triassic hydroclimate over the Colorado plateau. Proc. Natl. Acad. Sci. 118 (7), e2004343118. doi:10.1073/pnas.2004343118
MacIntrye, T. J., Hitzman, M. W., and Thorson, J. P. (2023). Hydrocarbon-induced bleaching and copper mineralization in the wingate sandstone, paradox valley, Colorado: two episodes of fluid migration during the evolution of the Paradox Basin. AAPG Bull. 107, 169–189. doi:10.1306/08042221112
Mack, G. H. (1977). Depositional environments of the cutler-cedar mesa facies transition (permian) near moab, Utah. Mt. Geol. 14, 53–68. https://archives.datapages.com/data/rmag/mg/1977/mack.html.
Marra, K. (2008). Late Cenozoic geomorphic and climatic evolution of the northeastern Colorado Plateau as recorded by Plio-Pleistocene sediment fill in Unaweep Canyon, Colorado. M.S. thesis. Oklahoma: University of Oklahoma.
Moore, D. M., and Reynolds, R. C. (1997). X-ray diffraction and the identification and analysis of clay minerals. Oxford: Oxford University Press.
Moore, K., Soreghan, G. S., and Sweet, D. (2008). Stratigraphic and structural relations in the proximal Cutler Formation of the Paradox Basin: implications for timing of movement on the Uncompahgre front. Mt. Geol. 45, 49–68. https://archives.datapages.com/data/mountain-geologistrmag/data/045/045002/49_rmag-mg450049.html.
Morrison, S. J., and Parry, W. T. (1986). Dioctahedral corrensite from permian red beds, Lisbon valley, Utah. Clays Clay Min. 34, 613–624. doi:10.1346/ccmn.1986.0340601
Mose, D. G., and Bickford, M. E. (1969). Precambrian geochronology in the Unaweep Canyon, west-central Colorado. J. Geophys Res. 74 (6), 1677–1687. doi:10.1029/jb074i006p01677
Murakami, T., Ito, J. I., Utsunomiya, S., Kasama, T., Kozai, N., and Ohnuki, T. (2004). Anoxic dissolution processes of biotite: implications for Fe behavior during Archean weathering. Earth Planet Sci. Lett. 224, 117–129. doi:10.1016/j.epsl.2004.04.040
Murakami, T., Sato, T., and Inoue, A. (1999). HRTEM evidence for the process and mechanism of saponite-to-chlorite conversion through corrensite. Amer Mineral. 84, 1080–1087. doi:10.2138/am-1999-7-810
Myer, G. H. (1965). X-ray determinative curve for epidote. Amer J. Sci. 263 (1), 78–86. doi:10.2475/ajs.263.1.78
Noël, V., Boye, K., Kukkadapu, R., Li, Q., and Bargar, J. (2019). Uranium storage mechanisms in wet-dry redox cycled sediments. Water Res. 152, 251–263. doi:10.1016/j.watres.2018.12.040
Nuccio, V. F., and Condon, S. M. (1996). Burial and thermal history of the Paradox Basin, Utah and Colorado, and petroleum potential of the middle pennsylvanian paradox formation. Washington, DC: U.S. Government Printing Office.
Parneix, J. C., Beaufort, D., Dudoignon, P., and Meunier, A. (1985). Biotite chloritization process in hydrothermally altered granites. Chem. Geol. 51, 89–101. doi:10.1016/0009-2541(85)90089-0
Peretyazhko, T. S., Zachara, J. M., Kukkadapu, R. K., Heald, S. M., Kutnyakov, I. V., Resch, C. T., et al. (2012). Pertechnetate (TcO4−) reduction by reactive ferrous iron forms in naturally anoxic, redox transition zone sediments from the Hanford Site, USA. Geochim. Cosmochim. Acta 92, 48–66. doi:10.1016/j.gca.2012.05.041
Rancourt, D. G., and Ping, J. Y. (1991). Voigt-based methods for arbitrary-shape static hyperfine parameter distributions in Mössbauer spectroscopy. Nucl. Instrum. Methods Phys. Res. Sect. B Beam Interact. Mater Atoms 58, 85–97. doi:10.1016/0168-583x(91)95681-3
Reynolds, R. L., Hudson, M. R., Fishman, N. S., and Campbell, J. A. (1985). Paleomagnetic and petrologic evidence bearing on the age and origin of uranium deposits in the Permian Cutler Formation, Lisbon Valley, Utah. GSA Bull. 96 (6), 719–730. doi:10.1130/0016-7606(1985)96<719:papebo>2.0.co;2
Rønnevik, C., Ksienzyk, A. K., Fossen, H., and Jacobs, J. (2017). Thermal evolution and exhumation history of the Uncompahgre Plateau (northeastern Colorado Plateau), based on apatite fission track and (U-Th)-He thermochronology and zircon U-Pb dating. Geosphere 13, 518–537. doi:10.1130/ges01415.1
Salerno, F., Rogora, M., Balestrini, R., Lami, A., Tartari, G. A., Thakuri, S., et al. (2016). Glacier melting increases the solute concentrations of himalayan glacial lakes. Environ. Sci. Tech. 50, 9150–9160. doi:10.1021/acs.est.6b02735
Sanford, R. F. (1982). Preliminary model of regional Mesozoic groundwater flow and uranium deposition in the Colorado Plateau. Geology 10, 348–352. doi:10.1130/0091-7613(1982)10<348:pmormg>2.0.co;2
Shawe, D. R. (2011). Uranium-vanadium deposits of the slick rock district, Colorado. U. S. Geol. Surv. Prof. Pap. 576, 80.
Sheldon, N. D. (2005). Do red beds indicate paleoclimatic conditions? A Permian case study. Palaeogeog, Palaeoclimatol. Palaeoecol. 228 (3-4), 305–319. doi:10.1016/j.palaeo.2005.06.009
Soreghan, G. S., Benison, K. C., Foster, T. M., Zambito, J., and Soreghan, M. J. (2015a). The paleoclimatic and geochronologic utility of coring red beds and evaporites: a case study from the RKB core (Permian, Kansas, USA). Int. J. Earth Sci. 104, 1589–1603. doi:10.1007/s00531-014-1070-1
Soreghan, G. S., Keller, G. R., Gilbert, M. C., Chase, C. G., and Sweet, D. (2012). Load-induced subsidence of the ancestral Rocky Mountains recorded by preservation of permian landscapes. Geosphere 8, 654–668. doi:10.1130/ges00681.1
Soreghan, G. S., Soreghan, M. J., Sweet, D. E., and Moore, K. D. (2009). Hot fan or cold outwash? Hypothesized proglacial deposition in the upper Paleozoic Cutler Formation, western tropical Pangea. J. Sed. Res. 79 (7), 495–522. doi:10.2110/jsr.2009.055
Soreghan, G. S., Sweet, D. E., Marra, K. R., Eble, C. F., Soreghan, M. J., Elmore, R. D., et al. (2007). An exhumed late Paleozoic canyon in the Rocky Mountains. J. Geol. 115 (4), 473–481. doi:10.1086/518075
Soreghan, G. S., Sweet, D. E., Thomson, S. N., Kaplan, S. A., Marra, K. R., Balco, G., et al. (2015b). Geology of Unaweep Canyon and its role in the drainage evolution of the northern Colorado Plateau. Geosphere 11 (2), 320–341. doi:10.1130/ges01112.1
Soukup, D. A., Buck, B. J., and Harris, W. (2008). Preparing soils for mineralogical analyses. Methods Soil Analysis Part 5—Mineralogical Methods 5, 13–31. doi:10.2136/sssabookser5.5.c2
Środoń, J. (1999). Nature of mixed-layer clays and mechanisms of their formation and alteration. Annu. Rev. Earth Pl. S. C. 27, 19–53. doi:10.1146/annurev.earth.27.1.19
Streckeisen, A. (1974). Classification and nomenclature of plutonic rocks: recommendations of the IUGS subcommission on the systematics of Igneous Rocks. Geol. Rundsch. 63 (2), 773–786. doi:10.1007/bf01820841
Sugimori, H., Iwatsuki, T., and Murakami, T. (2008). Chlorite and biotite weathering, Fe2+-rich corrensite formation, and Fe behavior under low PO2 conditions and their implication for Precambrian weathering. Am. Mineral. 93, 1080–1089. doi:10.2138/am.2008.2663
Suttner, L. J., and Dutta, P. K. (1986). Alluvial sandstone composition and paleoclimate; I, Framework mineralogy. J. Sed. Res. 56 (3), 329–345. doi:10.1306/212f8909-2b24-11d7-8648000102c1865d
Thompson, G. R., and Hower, J. (1975). The mineralogy of glauconite. Clays Clay Mineral. 23 (4), 289–300. doi:10.1346/ccmn.1975.0230405
Thompson, J. A., Giles, K., Hearon, T. E., Trudgill, B., Rowan, M. G., and Langford, R. P. (2018). “Halokinetic features in the Paradox Basin, Utah and Colorado,” in AAPG ACE 2018. AAPG datapages/search and discovery article #90323 (Tulsa, OK: American Association of Petroleum Geologists (AAPG)).
Thomson, S. N., Soreghan, G. S., and Eccles, T. M. (2012). Elevated Cenozoic geothermal gradients and later post-6 Ma incision of the Uncompahgre Plateau and Unaweep Canyon (western Colorado) revealed by low temperature thermochronology. Albuquerque, NM: Geological Society of America Rocky Mountain Section Meeting Abstracts.
Thomson, S. N., Soreghan, G. S., Reiners, P. W., Peyton, S. L., and Murray, K. E. (2015). “A precise 6 Ma start date for fluvial incision of the northeastern Colorado plateau canyonlands,” in AGU fall meeting abstracts (Washington, DC: American Geophysical Union).
Thorson, J. P. (2018). Paradox Basin fluids and Colorado plateau copper, uranium, and vanadium deposits field trip. Littleton, CO: Society of Economic Geologists, 59. Available at: https://www.segweb.org/Store/detail.aspx?id=EDOCGB59.
Torres, M., Moosdorf, N., Hartmann, J., Adkins, J., and West, J. (2017). Glacial weathering, sulfide oxidation, and global carbon cycle feedbacks. Proceed Natl. Acad. Sci. U. S. A. 114, 8716–8721. doi:10.1073/pnas.1702953114
Tranter, M., and Wadham, J. (2014). Geochemical weathering in glacial and proglacial environments. Treatise Geochem. 7, 157–173. doi:10.1016/b978-0-08-095975-7.00505-2
Van Houten, F. B. (1973). Origin of red beds A review-1961-1972. Ann. Rev. Earth Planet. Sci. 1, 39–61. doi:10.1146/annurev.ea.01.050173.000351
Wadham, J. L., Tranter, M., Skidmore, M., Hodson, A. J., Priscu, J., Lyons, W. B., et al. (2010). Biogeochemical weathering under ice: size matters. Glob. Biogeochem. Cy 24, GB3025. doi:10.1029/2009gb003688
Werner, W. G. (1974). Petrology of the Cutler Formation (Pennsylvanian-Permian) near Gateway, Colorado, and Fisher towers, Utah. J. Sed. Res. 44 (2), 292–298. doi:10.1306/74d72a18-2b21-11d7-8648000102c1865d
Worden, R. H., and Burley, S. D. (2003). Sandstone diagenesis: the evolution of sand to stone. Sandst. Diagenesis Recent Anc. 4, 3–44. doi:10.1002/9781444304459.ch
Yan, L., Peng, H., Zhang, S., Zhang, R., Kašanin-Grubin, M., Lin, K., et al. (2019). The spatial patterns of red beds and danxia landforms: implication for the formation factors–China. Sci. Rep. 9, 1961. doi:10.1038/s41598-018-37238-7
Keywords: red beds, iron, redox, uranium, clay, hydrothermal, color
Citation: Hullaster DP, Soreghan GS, Kukkadapu RK, Dumont BS, Dee KT and Elwood Madden AS (2023) Red-green-bleached redox interfaces in the proximal Permian Cutler red beds: implications for regional fluid alteration. Front. Earth Sci. 11:1219966. doi: 10.3389/feart.2023.1219966
Received: 09 May 2023; Accepted: 25 October 2023;
Published: 16 November 2023.
Edited by:
Lawrence H. Tanner, Le Moyne College, United StatesReviewed by:
Branimir Segvic, Texas Tech University, United StatesChristine Franke, Université de Sciences Lettres de Paris, France
Copyright © 2023 Hullaster, Soreghan, Kukkadapu, Dumont, Dee and Elwood Madden. This is an open-access article distributed under the terms of the Creative Commons Attribution License (CC BY). The use, distribution or reproduction in other forums is permitted, provided the original author(s) and the copyright owner(s) are credited and that the original publication in this journal is cited, in accordance with accepted academic practice. No use, distribution or reproduction is permitted which does not comply with these terms.
*Correspondence: Andrew S. Elwood Madden, YW1hZGRlbkBvdS5lZHU=