
95% of researchers rate our articles as excellent or good
Learn more about the work of our research integrity team to safeguard the quality of each article we publish.
Find out more
REVIEW article
Front. Earth Sci. , 11 October 2023
Sec. Volcanology
Volume 11 - 2023 | https://doi.org/10.3389/feart.2023.1218645
This article is part of the Research Topic Reviews in Volcanology: 2023 View all 4 articles
 Thomas J. Jones1*
 Frances Beckett2†
 Benjamin Bernard3†
 Eric C. P. Breard4,5†
 Fabio Dioguardi6,7†
 Josef Dufek5†
 Samantha Engwell7†
 Julia Eychenne8,9†
Pyroclastic density currents (PDCs) are hazardous and destructive phenomena that pose a significant threat to communities living in the proximity of active volcanoes. PDCs are ground-hugging density currents comprised of high temperature mixtures of pyroclasts, lithics, and gas that can propagate kilometres away from their source. The physical properties of the solid particles, such as their grain size distribution, morphology, density, and componentry play a crucial role in determining the dynamics and impact of these flows. The modification of these properties during transport also records the causative physical processes such as deposition and particle fragmentation. Understanding these processes from the study of deposits from PDCs and related co-PDC plumes is essential for developing effective hazard assessment and risk management strategies. In this article, we describe the importance and relevance of the physical properties of PDC deposits and provide a perspective on the challenges associated with their measurement and characterization. We also discuss emerging topics and future research directions such as electrical charging, granular rheology, ultra-fine ash and thermal and surface properties that are underpinned by the characterization of pyroclasts and their interactions at the micro-scale. We highlight the need to systematically integrate experiments, field observations, and laboratory measurements into numerical modelling approaches for improving our understanding of PDCs. Additionally, we outline a need for the development of standardised protocols and methodologies for the measurement and reporting of physical properties of PDC deposits. This will ensure comparability, reproducibility of results from field studies and also ensure the data are sufficient to benchmark future numerical models of PDCs. This will support more accurate simulations that guide hazard and risk assessments.
Pyroclastic density currents (PDCs) are widespread volcanic hazards that are responsible for over a third of all fatalities related to volcanoes. For example, in the time period 1,600 to 2010 AD, PDCs were responsible for 91,484 fatalities. This is 33% of all fatalities associated with volcanic phenomena (Auker et al., 2013). Comprised of high temperature mixtures of juvenile pyroclasts, lithics, and gas, PDCs are ground-hugging density currents that propagate away from the source at speeds ranging from 10 s to 100 s m/s, engulfing everything in their path (Brown and Andrews, 2015; Dufek et al., 2015; Dufek, 2016; Lube et al., 2020; Dellino et al., 2021a). The spreading flow can also generate co-PDC plumes, as hot gas and fine-grained particles rise buoyantly from the top of the current into the atmosphere (Figure 1A). These plumes can reach altitudes of tens of kilometres, potentially dispersing huge volumes of ash over continental scale areas, impacting our environment, and posing a risk to aviation (Engwell and Eychenne, 2016). Despite decades of high-quality investigation, PDCs remain a key research focus of the volcanological community due to their lethal nature (Lube et al., 2020). This is, at least in part, due to their highly complex and highly variable nature, and the challenges associated with taking direct measurements as the flows propagate.
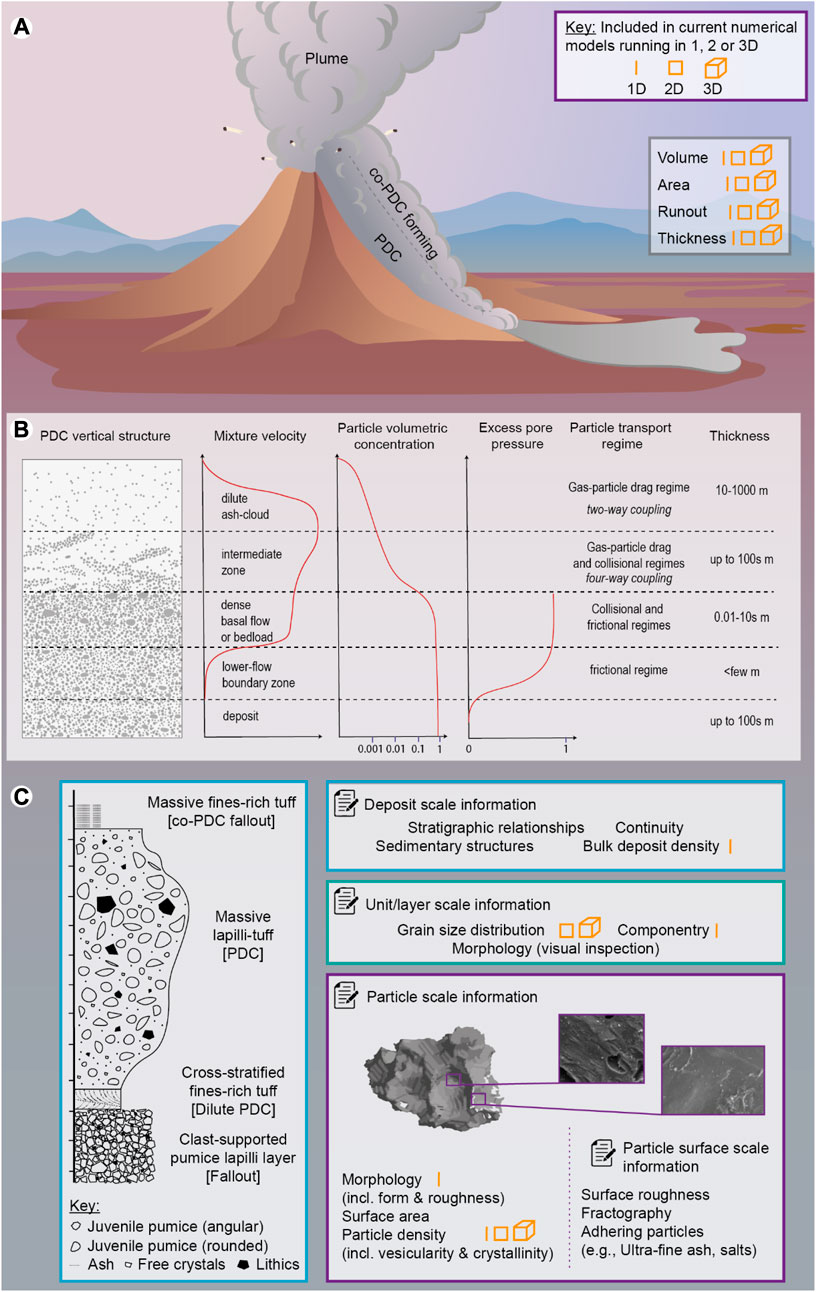
FIGURE 1. Schematic cartoon illustrating the physical properties of pyroclastic density currents discussed herein. (A) The entire eruption deposit and co-PDC formation. (B) An idealised cross section showing how properties vary with vertical height. (C) Physical properties listed and grouped based on the scale at which data is collected. At decreasing length scales these include deposit sections, specific units, or layers, to the individual particle scale. Properties that are included in existing 1D, 2D or 3D PDC numerical models are marked with a line, square or cube, respectively.
Variability starts with the wide range of eruption behaviours that generate PDCs; these include the collapse of eruption columns, boiling over at the vent, directed blasts, or the collapse of lava domes or lava flows. Despite this diversity all PDCs have the commonality that they are ground-hugging gravity currents that are negatively buoyant with respect to the surrounding atmosphere (Figure 1A). The associated deposits span several orders of magnitude in volume from
There is also great temporal and spatial variability within the density currents. The internal variability within a single current is summarised in Figure 1B. For example, the flow velocity varies in a highly non-linear way (Figure 1B) from the flow base to the flow top. The particle concentration is also vertically stratified with the dense portion of the flow confined to the flow base and reducing upward through the intermediate zone into the overriding dilute ash cloud (Branney and Kokelaar, 2002; Breard and Lube, 2017; Brosch and Lube, 2020; Lube et al., 2020). The excess pore pressure, responsible for keeping the PDC fluidized and mobile, increases through the lower flow boundary zone to reach a maximum in the dense basal flow. Above this level, the granular mixture is highly permeable at lower particle concentrations and is unable to sustain any appreciable excess pore pressure (Lube et al., 2020).
During transport, entrainment acts to change the bulk density of PDCs. Substrate erosion and entrainment of clasts increases PDC density (Fauria et al., 2016) and changes the componentry (e.g., relative proportions of juvenile pyroclasts and lithics). Entrainment of cooler ambient air at the free surface acts to further stratify the current by modifying the thermal profile and by reducing PDC density, diluting the overriding ash cloud (Benage et al., 2016; Sher and Woods, 2017). With increasing distances from source, the mean particle size is reduced, and particles commonly become rounder due to particle-particle collisions leading to abrasion that progressively removes small chips and asperities on pyroclast exteriors (Dufek and Manga, 2008; Kueppers et al., 2012; Jones et al., 2016; Hornby et al., 2020; Breard et al., 2023). The successful segregation and removal of fine particles from PDCs can create co-PDC ash plumes, dominated by particles with diameters <90 µm (Engwell and Eychenne, 2016). All of this variability makes it extremely challenging and, in many cases, impossible to quantitatively define ‘typical’ PDC properties.
As a community we are conducting complex analogue experiments and constructing increasingly sophisticated 2D and 3D numerical models of PDCs and their associated co-PDC ash plumes. The use of physical property data in existing 1, 2 and 3D numerical models are highlighted in Figure 1. These models are used to understand current dynamics, reconstruct past events, and recover their source conditions. Additionally, models are used to forecast (in a probabilistic manner) the runout and dispersion of products (Neri et al., 2015a, b; Sandri et al., 2018; Clarke et al., 2020). These probabilistic data can then be incorporated into hazard mapping and mitigation strategies to minimise the impact of PDCs and co-PDC plumes when they occur. However, these analogue and numerical models require ground-truthing, dynamic scaling, and the input of predetermined physical property data (e.g., grain size, particle density). The aforementioned lack of ‘typical’ PDC properties and associated variability makes appropriate incorporation into models challenging.
Furthermore, the physical properties of PDCs and co-PDC plumes and their individual components (e.g., juvenile pyroclasts, crystals, lithics) exhibit a fundamental control on the associated environmental impacts. For example, the size, shape, and density distribution of co-PDC ash controls its dispersion and fallout (Wilson and Huang, 1979; Eychenne et al., 2015; Engwell and Eychenne, 2016); the abundance of ultra-fine (<10 µm) ash particles contribute to the severity of the associated health hazard (Horwell and Baxter, 2006; Horwell, 2007; Eychenne et al., 2022) and the surface roughness and associated surface area of particles influence their chemical reactivity (Mills and Rose, 2010; Delmelle et al., 2018; Maters et al., 2020).
Previous reviews have comprehensively documented many aspects of PDCs such as their fluid dynamics, sedimentology, transport processes, and deposit structures (Druitt, 1998; Branney et al., 2002; Roche et al., 2013; Sulpizio et al., 2014; Neri et al., 2015b; Brown and Andrews, 2015; Dufek et al., 2015; Dufek, 2016; Lube et al., 2020; Douillet, 2021). Here, our purpose is not to provide a full review but rather a perspective on the physical properties of PDCs and associated deposits. The physical properties of the solid particles, such as their grain size distribution, morphology, density, and componentry play a crucial role in determining the dynamics and impact of these flows and are thus the focus here. These properties are associated with a range of scales; from the deposit to an individual particle (Figure 1C). As a result, both the methods of property characterisation and the property use are extremely wide ranging and bridge multiple scientific communities. This article aims to highlight key challenges amongst this interdisciplinary community and inform ways to better combine information from deposits, textural analysis, and analogue and numerical modelling.
In this Section, we detail and provide perspectives on key physical properties of PDC deposits. We describe how the property is useful, briefly highlight the state of knowledge, how it is currently determined, discuss the challenges surrounding data collection and highlight future directions.
PDC deposits serve as a crucial record of current progression, decline, and cessation stages, offering an accessible footprint for researchers. The sedimentary structures found within PDC deposits have been extensively studied, as they can help infer flow, sediment transportation, and deposition processes based on sedimentology principles. These principles however are primarily developed for other natural density currents such as fluvial and turbidity currents. PDCs possess unique characteristics (e.g., a high sediment-to-carrier phase density ratio) that set them apart from other currents. This distinction complicates the interpretation of flow properties from sedimentary structures. As a result, despite years of research, the study of sedimentary structures in PDCs remains an ongoing and active research field.
Branney and Kokelaar (2002) were among the first to provide a systematic classification of PDC deposit lithofacies and to use these to interpret the temporal evolution of currents. This work posited the vertical arrangement of lithofacies for determining unsteady processes (e.g., temporal variation) within the “flow-boundary zone” (Figure 1B). This is the zone in which the deposit forms and is located between the lowermost part of the PDC and the uppermost part of the forming deposit. Unlike older approaches in the interpretation of PDC deposits, Branney and Kokelaar (2002), by means of the flow-boundary zone approach, could reconcile the long-lived debate between endmember high-concentration and low-concentration PDC transport mechanisms; they suggested that whatever the concentration in the PDC, the style of sedimentation and, therefore, deposition is controlled by conditions and processes taking place in the flow-boundary zone. Their systematic classification of lithofacies also included the analysis of lateral variation of lithofacies, which reflected the spatial variation of the flow-boundary zone. Sedimentary structures can be linked to the internal arrangement of clasts resulting in various degrees (i.e., from absence to abundance) of lamination (thickness <1 cm) or stratification (thickness >1 cm). The arrangement of these laminae-strata (e.g., parallel, cross-stratified, ripples and dunes, lenses) are also known as bedforms.
Based on the “flow-boundary zone” concept, Sulpizio et al. (2007) developed a model for reconciling the two models of PDC deposition: en masse (i.e., deposits formed by en masse abrupt freezing of the entire PDC) and aggradation (i.e., deposits formed by the continuous supply of sediment from the flow to the flow-boundary zone). In their model, they assume that PDC deposits originate from stratified currents wherein particle segregation, by differing terminal velocities, can develop a high-concentration zone in the lowermost part of the current (Branney and Kokelaar, 2002). This zone then moves as a succession of high-concentration pulses, in which the interplay amongst shear-rate, rate of deposition, and particle concentration controls the depositional regime (fallout, fluid-escape, granular flow, and traction). Pulse stoppage occurs en-masse when resistive forces overcome the driving forces. The four types of flow-boundary zones are completely intergradational (Branney and Kokelaar, 2002; Burgisser and Bergantz, 2002) and mixed regimes are common (Sulpizio et al., 2007). Using this framework, it is possible to qualitatively characterise the PDC flow condition based on the observed sedimentary structures; for example, faintly stratified deposits with reverse grading can be attributed to multiple pulses depositing in fluid-escape regimes.
Bedforms (e.g., lamination, cross-laminations, ripples, dunes) forming within the flow-boundary zone of a PDC, fluvial current, turbidity current, or aeolian process are the result of the overlying current exceeding the critical shear stress for motion (Bartholdy et al., 2015). One of the long-standing goals of physical volcanology, and sedimentology in general, is to use the sequence of bedforms to interpret the fluid and granular conditions of a current. Douillet (2021) described several types of facies and facies associations commonly found in PDC deposits and the most common qualitative and quantitative interpretation of the flow conditions, with a particular emphasis on the subcritical vs. supercritical flow conditions. If these structures can be attributed to an antidune, it is possible to extrapolate quantitative flow parameters like velocity (Prave, 1990). In addition to the specific case of antidunes, phase diagrams relating ripples, dune wavelength and particle size with dimensionless numbers that describe flow properties (e.g., the Froude number and critical Shields number), are also available (Perillo et al., 2014; Fedele et al., 2016).
Given their use in adding quantification to field observations, further discriminatory and phase diagrams have been produced in recent years. These include using sedimentation and bedload transportation rate relationships to identify the conditions that form massive vs. stratified deposits (Dellino et al., 2020). Experiments have also been used to develop a phase diagram for monodisperse dense granular flows (Smith et al., 2020) relating the backset bedforms (e.g., steep, shallow, or planar) to flow conditions (e.g., Froude number, flow velocity, and thickness). Additionally, by using sedimentological models that relate deposit characteristics to dilute PDC flow properties (Dellino et al., 2008; Dioguardi and Mele, 2018), simple diagrams have been produced in which dilute PDC parameters like dynamic pressure, average particle concentration and sedimentation rate can be estimated by measuring the bedforms’ wavelength and particle median grain size (Dellino et al., 2021b). Going forward, continued collaboration between the field volcanology and numerical modelling community will further support both the validation (Esposti Ongaro et al., 2020a) or ‘ground truthing’ of models and the ability to provide essential quantification of PDC dynamics from field-based observations. Increased sophistication of the experimental and numerical models (e.g., 2D and 3D simulations, polydisperse grain size distributions) that underpin such diagrams will increase their accuracy and extend their use.
Related to sedimentary structure is the deposit fabric, which can be defined as the particle (mutual) orientation/alignment within the deposit. This property had been historically used in the sedimentology of fluvial and turbidity currents to infer flow direction and later applied to interpret entrained-particle long-axis alignment found in pyroclastic deposits (Zrelak et al., 2020 and references therein). Capaccioni and Sarocchi (1996) were among the first to use computer analysis to quantitatively analyse the fabric of particles within ignimbrite deposits and showed how this analysis could give insight into ignimbrite emplacement mechanisms. There is also a method that focuses on analysing the fabric of very fine particles called anisotropy of magnetic susceptibility (AMS). It is used to investigate the preferred orientation of magnetic minerals, such as magnetite, in a rock based on the finding that the maximum axis of magnetic susceptibility corresponds to inferred flow streamlines (Palmer et al., 1999). Using this technique, flow direction has been inferred from large ignimbrites of varying degrees of welding, where the source was unknown (Le Pennec et al., 1998).
PDC deposits vary greatly in area, thickness, and volume and these deposit characteristics have been used to classify eruptions (e.g., Volcanic Explosivity Index and magnitude). Such descriptors allow us to quantify mass partitioning between volcanic processes (e.g., column vs PDCs, PDC vs co-PDC plume) (Walker, 1972; Sparks and Walker, 1977; Druitt, 1998; Ritchie et al., 2002; Cas and Wright, 2012; Scarpati et al., 2014; Bernard et al., 2016; Giordano and Cas, 2021), assess the mobility of the currents and decipher the type of flow involved. Inspired by the work of Heim (1932) on debris and rock avalanches, volcanologists have used simple metrics such as vertical height descent (H) and runout length (L) to assess flow mobility (Hayashi and Self, 1992; Ogburn and Calder, 2017). Similar to non-volcanic granular flows, the H/L ratios of dense PDCs display an inverse relationship with volume that can be attributed to a volume-dependent friction weakening mechanism (Calder et al., 1999; Breard et al., 2018). Although the role of the fluid phase is unclear in debris avalanches (Pudasaini and Miller, 2013) on Earth and other planetary bodies, the volume-dependent friction phenomenology of dense PDCs can be explained by the formation and retention of excess pore pressure (Breard et al., 2018 and references therein).
The H/L ratio has been commonly used to estimate the empirical friction coefficient necessary for describing the Coulomb rheology of dense PDCs (Saucedo et al., 2005; Ogburn and Calder, 2017). Friction is highly variable spatially-and-temporally, despite the practicality of using a constant friction coefficient for modelling purposes (Lube et al., 2019). Using PDC deposit volume V and area A, the ratio
PDC deposits are complicated to interpret due to spatio-temporal changes in the flow-deposit boundary conditions (Branney and Kokelaar, 2002), making it difficult to gain quantitative information about flow dynamics. While at the individual outcrop scale the flow behaviour may be encrypted, at the large-scale, deposit thinning is a proxy for the vertical stratification of the flow, which is sensitive to topographic obstacles (Giordano and Doronzo, 2017). In general, deposit geometry is one of the key metrics that helps us determine the extent of the impact of past PDCs. It is important to note, however, that erosion can significantly alter the observed volume, area, and runout of deposits, thus affecting our estimation of flow mobility, hazards, and risks. Between these parameters, the PDC area and runout of historical flows are generally the easiest to estimate, whereas volume is much more challenging. The calculation of deposit volume is subject to major uncertainties on the deposit thickness (Breard et al., 2018). Paleo-topography understanding, and numerous deposit outcrops are necessary to reduce this uncertainty (Bernard et al., 2014a). Deposits are also susceptible to erosion locally changing deposit thicknesses and can completely remove any evidence of thin deposits. Furthermore, runout and area measurements can be conducted remotely, however volume measurements have typically required field-based observations.
High-resolution digital elevation models (DEMs), provided by either the use of satellite imaging or unmanned aerial vehicles (UAVs, “drones”) equipped with LiDAR technology, have revolutionised the study of PDC deposits from recent volcanic eruptions (Breard et al., 2015; Albino et al., 2020) and have made remote thickness and volume measurements possible. Satellite-based remote sensing allows volcanologists to obtain accurate DEMs (i.e., down to approximately 1 m in horizontal resolution and ∼0.2–0.3 m in vertical resolution), which offer vital topographic data for modelling and characterising PDC deposit distribution, volume, and flow dynamics. UAV-mounted LiDAR sensors provide rapid, high-resolution, and accurate 3D topographic data, enabling the assessment of deposit geometry, even in hazardous or remote areas (James et al., 2020; Granados-Bolaños et al., 2021). Importantly, LiDAR surveys can be conducted swiftly between eruptions, allowing researchers to characterise PDC deposits before erosive events alter the landscape. As a result of the synergistic use of these advanced technologies, more accurate constraints can be placed on the geometry (especially volume and thickness) and emplacement mechanisms of PDC deposits, which in turn enables a more comprehensive assessment of their hazards.
In cases where DEMs prior to eruptions are not available, non-invasive methods such as Georadar, also known as ground-penetrating radar (GPR), provide valuable tools for analysing the thickness of PDC deposits. By transmitting high-frequency electromagnetic waves into the ground and measuring the reflected signals, Georadar enables non-invasive, subsurface imaging of deposit layers, offering insights into their thickness and internal structure with remarkable accuracy (Gase et al., 2017).
Grain size is one of the main indicators of volcanic deposit type and can be used to differentiate PDC from fall deposits. Fall deposits are typically well sorted and mantle topography (Walker, 1971). In comparison, PDC deposits are diverse in nature, both in terms of spatial distribution and grain size (Fisher and Schminke, 1984; Druitt, 1998) due to the myriad of transport and depositional processes that operate within a current, from turbulent suspension to dense granular flow (Sulpizio et al., 2014; Lube et al., 2020). Hybrid deposits also exist, which display characteristics of both fall and flow and are formed due to the simultaneous deposition of particles from the buoyant plume and PDC (Dowey and Williams, 2022). Transition between different transport and depositional processes within a current can be impacted by various scales of topographical obstacles (Branney and Kokelaar, 2002; Doronzo et al., 2010) and by deposition and entrainment of particles from the erodible substrate (Brand et al., 2014; Pollock et al., 2019). Beyond the classification of volcaniclastic deposits, PDC grain size (Figure 2) can be used to differentiate the type of PDC (Walker, 1971). Deposits from dense PDCs, such as block and ash flows, are commonly associated with the gravitational collapse of domes or lava flow fronts, exhibiting complex, multimodal, and poorly sorted grain size distributions (Sparks, 1976; Charbonnier and Gertisser, 2008; Sarocchi et al., 2011; Macorps et al., 2018; Charbonnier et al., 2023). In contrast, deposits associated with dilute PDCs (or surges) commonly have unimodal (in log-scale), better sorted distributions, often with a long fine tail (Walker, 1971; Walker, 1984; Sulpizio et al., 2007; Breard et al., 2015).
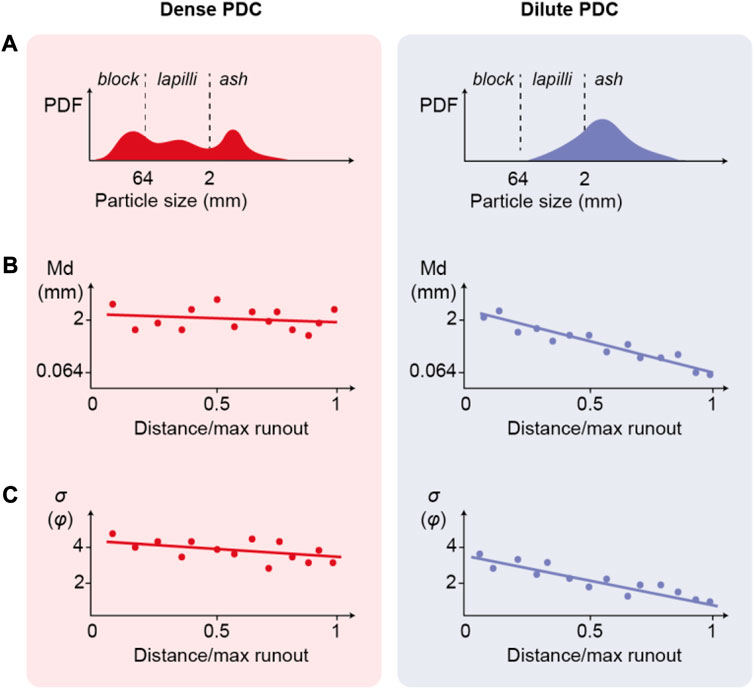
FIGURE 2. Conceptual grain size characteristics of PDCs transporting most of the mass in a dense granular avalanche (left) or in a dilute turbulent suspension (right). (A) shows conceptual grain size distributions, (B) an illustration of the change in median (Md) and (C) sorting coefficient (φ) within a flow with distance from source.
A key difference in fall and flow deposit grain size distributions is their spatial variability. While fall deposits show relatively minor changes in grain size locally, the grain size of PDC deposits can vary significantly over short distances (e.g., <<100 m), related to pulsatory activity and flow-substrate interactions (e.g., Richie et al., 2002; Sulpizio et al., 2007; Charbonnier and Gertisser, 2011; Lube et al., 2014). These variations can complicate correlation efforts between exposures across a flow and even at the outcrop scale. Despite local variation, changes in grain size characteristics with distance from source are informative for understanding flow dynamics. The deposits associated with both dense and dilute PDCs generally show a decay in median grain size with distance from source, particularly for dilute PDCs (Figure 1). This relative increase in fines with distance is related to two main mechanisms: 1) fragmentation and attrition of particles, and 2) preferential deposition of coarse particles that cannot be suspended by turbulent eddies in dilute PDCs (Valentine, 1987; Dufek and Manga, 2008; Manga et al., 2011; Kueppers et al., 2012; Brosch et al., 2022; Breard et al., 2023).
Estimating grain size distribution at the outcrop scale is challenging and often requires multiple methods, which include photogrammetry, sieving in the field and the laboratory, and particle laser analysis. Studies typically sample and sieve deposits at the outcrop, commonly using sieves with one or half phi increments {
Grain size distributions are commonly reduced to representative statistics to enable comparison of information from numerous locations (Walker, 1971; Sparks, 1976; Charbonnier and Gertisser, 2011), with statistics such as median grain size (Md) and sorting coefficient (
Grain size data play a crucial role in designing laboratory experiments for studying PDC behaviour. However, laboratory apparatus size limitations (e.g., channel width) constrain the particle length scales that can be used. In the most simplified cases, analogue materials such as glass beads have been employed due to their ease of use and resistance to abrasion (Roche et al., 2013; Smith et al., 2020; Gueugneau et al., 2022; Penlou et al., 2023). When using natural samples at benchtop scales, the grain size distribution is subsampled to include only fine particles to prevent wall effects and maintain relevant scaling [e.g., pore pressure diffusion timescale, as demonstrated by Girolami et al. (2008)]. Furthermore, restricting grain size narrows the range of gas-particle coupling mechanisms present in a single experiment, which may not accurately represent the complexity of natural PDCs. This limitation prompted the creation of large-scale experiments (Sulpizio et al., 2007; Lube et al., 2015) that allow for the use of nearly complete grain sizes seen in PDC deposits, omitting only the coarse tail of the size distribution. Such large-scale experiments have been instrumental in evaluating how grain size distributions evolve within flows and deposits, ultimately enhancing our understanding of natural PDC deposits (Breard et al., 2016; Brosch et al., 2022).
Grain size information is a critical input for numerical simulation of PDCs (e.g., Esposti Ongaro et al., 2012; Dufek, 2016). Incorporating grain size information into numerical models typically entails either discretizing a grain size distribution into a finite number of classes, representing the most prevalent particles, or inputting statistics such as median and sorting parameters, which is then used to define the proportion of particles in several bins of different sizes (Neri et al., 2002; Esposti Ongaro et al., 2008). Increasing the number of particle size bins simulated significantly raises the computational cost of numerical approaches. One important aspect of numerical model development lies in development of methods to minimize these costs (e.g., de Michieli Vitturi et al., 2015). One such method, already employed when modelling particles in volcanic plumes, is using the method of moments which enables the simulation of a continuous distribution of particles. Implementing this method in PDC models may facilitate the use of more sophisticated grain size data. However, it is essential to recognise that models used in hazard analysis and those simulating flow scale processes overlook complex particle interactions (i.e., four-way coupling, see Section 3.1). Instead, these models modify the particle distribution in a simulated flow by calculating particle deposition using terminal settling laws (Bursik and Woods, 1996; Dellino et al., 2008; Dioguardi et al., 2017; de Michieli Vitturi et al., 2019).
The componentry of pyroclastic deposits is a quantitative parameter describing the proportion of different particle categories defined based on their mineralogy and texture (e.g., vesicularity, crystallinity, morphology). Componentry provides key information that can be used to infer some physical processes occurring during flow propagation. For instance, the process of co-PDC formation by ash elutriation from the PDC body during propagation has been historically identified based on the componentry of PDC deposits, namely, the content of free crystals (Walker, 1972; Sparks and Walker, 1977). Indeed, a crystal enrichment in the matrix of PDC deposits compared to the crystal content of the magma has been observed in several ignimbrite deposits (e.g., Vulsini volcanoes, Italy and Santorini, Greece). This can be explained by a process of density-driven fractionation during particle elutriation, leading to preferential retention of crystals in PDC deposits and escape of glassy, potentially vesicular, particles in the co-PDC plumes.
Componentry is also essential to understand substratum erosion and bulking processes (Bernard et al., 2014b). Componentry allows us to quantify the incorporation of accidental material, to track their origin along the edifice slopes, and hence provides a way to infer the efficiency and timing of substratum erosion. Componentry can also provide insight into particle breaking and comminution during transport, given that different component types have variable susceptibility to fracturing and abrasion (Bernard and Le Pennec, 2016; Hornby et al., 2019; Jones et al., 2022). Componentry is also key for interpreting deposit facies and sedimentological structures, which are controlled by the particle settling behaviour, which in turn depends on the density, and hence componentry, of the grains. For example, Dellino et al. (2008) used componentry analysis to infer the flow properties of past dilute turbulent PDCs; specifically, they based their methodology on observations that the laminated layers in dilute PDC deposits often consist of different components with different densities, grain sizes and shapes. Since the different particle components present in the same laminae are deposited contemporaneously, i.e., by settling at the same terminal velocity, one may assume that aerodynamic equivalence must exist between the different components. From this principle, it is possible to set the equivalence of the terminal velocities of particles of different components, from which their model calculates PDC flow properties like the shear velocity. Finally, componentry is inherently linked to particle density and hence particle settling velocity. This will be discussed in the following sub-section (Section 2.5).
The methods typically used to analyse PDC componentry include component identification and counting of the block/bomb population in the field or using outcrop photographs, and sampling of matrix and separation/counting in the laboratory under the binocular microscope (Bernard and Le Pennec, 2016). The main challenge with any componentry analyses is the determination of the categories of particles (e.g., free crystals, lithics, dense juvenile), which must be based on consistent criteria that do not change with changes in grain size. Because component category determination is dependent on the scientific questions each study is dealing with, comparing componentry datasets across independent studies is often challenging.
Some componentry datasets exist in the literature on specific PDC deposits, such as ignimbrites from the Campanian Ignimbrite eruption (Scarpati et al., 2015), various eruptions in the Azores and Chile (Walker, 1971; Calder et al., 2000), pumice flows from the 3.9 ka BP Somma-Vesuvius eruption (Sulpizio et al., 2010), the 1902 and 1929 Mt Pelée eruption (Fisher and Heiken, 1982; Bourdier et al., 1989), the blast surge and pumice flows from the 18 May 1980 Mount St Helens eruption (Druitt, 1992; Brand et al., 2014), block and ash flows from Merapi (Abdurachman et al., 2000; Charbonnier and Gertisser, 2011; Charbonnier et al., 2013), Soufrière Hills Volcano (Cole et al., 2002, 2014), Colima (Macorps et al., 2018; Saucedo et al., 2019), Santiaguito (Hornby et al., 2019) and Tungurahua (Bernard et al., 2014b; Bernard and Le Pennec, 2016). Yet, studies relating the observed componentry trends to general processes of emplacement are still lacking in the literature.
Going forward, the growing use of automated chemical detection instruments and software, such as QEMSCAN Particle Mineralogical Analysis, based on the scanning electron microscope (Hornby et al., 2019) or raman spectroscopy coupled to morphological imagers (Varga and Roettig, 2018; Thivet et al., 2020) will make the collection of large componentry datasets less time consuming and have the capability to link to other textural properties (e.g., morphology, size) with greater ease. Furthermore, once these large, internally consistent datasets are created, artificial intelligence and machine learning approaches may use these as training datasets to support automated classification. This will enhance the use of componentry as a metric and enhance the number of scientific questions that can be addressed. However, alongside this data increase it would be useful, as a community, to remove some subjectivity and question-dependent component classifications and determine a basic set of classes that, as a minimum, can be robustly compared across different deposits, measured by different laboratory groups. Furthermore, upon creation and archiving of such datasets, transparent community documentation and accessible data storage is essential (Andrews et al., 2022; Wallace et al., 2022).
Particle density is one of the parameters controlling particle terminal settling velocity, where increased particle densities for a given grain size lead to increased settling velocities. Due to this, particle density is extremely important for sedimentation modelling, both during PDC transport and within any associated (co-PDC) plumes (Choux and Druitt, 2002; Dellino et al., 2008; Doronzo et al., 2010; Andrews and Manga, 2012; Dioguardi and Dellino, 2014; Dioguardi et al., 2014, 2017; Dioguardi and Mele, 2015). Additionally, during an eruption, changes to the particle density can increase eruption column density (e.g., increased lithics due to wall rock erosion or increased juvenile density due to reduced vesicularity) and potentially generate PDCs by column collapse (Shea et al., 2011, 2012). Furthermore, particle density is inherently linked to componentry. Lithics and free crystals are typically denser and within a single deposit show less variation in density relative to the juvenile pyroclasts. The density of juvenile components is more complex and varies as a function of dense glass density ρ0, the crystal and vesicle volume fractions, ɸx and ɸv respectively, and the crystal and vesicle size distributions. ρ0 is closely related to the chemical composition of the magma where density increases with decreasing silica content (Lesher and Spera, 2015; Iacovino and Till, 2019). ɸx, ɸv and the crystal and vesicle size distributions can be highly variable and depend on both the magma composition and the magma ascent and fragmentation history. Ultimately, the particle density of juvenile material depends on the inter-relationship between particle size, ɸx, ɸv and the crystal and vesicle size distributions.
As demonstrated by several studies on fallout deposits, the density of vesicular juvenile particles varies with grain size following a sigmoidal decrease (Barberi et al., 1989; Rosi et al., 1999; Bonadonna and Phillips, 2003; Eychenne and Le Pennec, 2012; Cashman and Rust, 2016). High and low density plateaus are observed at fine and coarse grain sizes, respectively. The high plateau density value corresponds to the Dense Rock Equivalent (DRE) density (i.e., glass and groundmass crystals devoid of bubbles) whereas the low plateau density value indicates the average density of lapilli-sized vesicular particles. The grain size thresholds at which the density plateaus occur depend on ɸx, ɸv and the crystal and vesicle size distributions. It is generally observed that the high density plateau occurs at a grain size threshold below 500 μm, and the low density plateau at a grain size threshold above 2 mm (Breard et al., 2016; Cashman and Rust, 2016).
A series of well-established methods exist for determining particle density. Typically, these methods include forms of pycnometry–methods to measure volume. With a subsequent measurement of mass, density can be calculated. Other methods include the settling of particles in water (Fisher, 1965) or suspension in heavy liquids (Barberi et al., 1989). Depending on the method and sample used, the exact form of density varies. This is outlined in Table 1.
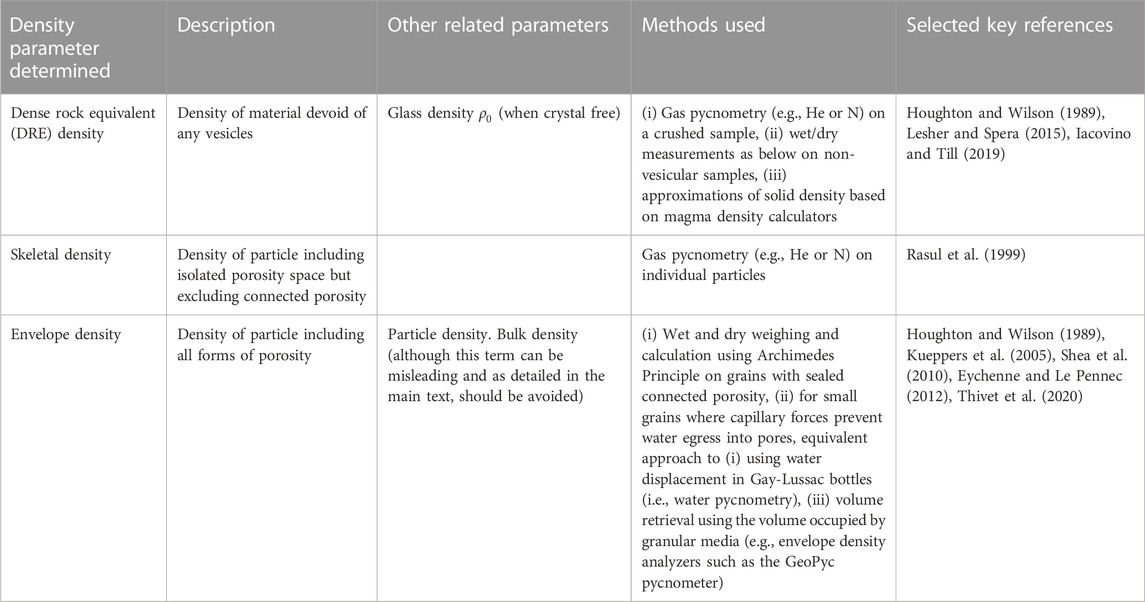
TABLE 1. Density parameters determined for pyroclastic material and common methods used.
Despite these well-established methods there are little data on particle density for PDC deposits; most studies with these data are focussed on pyroclastic fall units. However, observations on fall deposits (e.g., sigmoidal distribution) should equally apply. Some previous works on PDC deposits have focussed on particle density variations as a function of grain size (Dellino et al., 2008) and have shown that for some juvenile clasts from Somma- Vesuvius and Campi Flegrei density increases exponentially with decreasing grain size over a narrow range from 0.5 mm to ∼2.5 mm. Other studies have compared particle density variations between directed blast deposits from different volcanoes (Belousov et al., 2007; Bernard et al., 2014a) or have compared fall vs. flow units to elucidate PDC formation mechanisms (Shea et al., 2012).
However, currently studies are often limited to a single grain size. Going forward, aided by the increasing availability and collaborative access to instrumentation, the generation of density distributions will prove useful for more sophisticated modelling of sedimentation and particle segregation within PDCs. There is also a need to add clarification to the terms used to describe density. For example, ‘bulk density’ is frequently used at a range of scales to describe an individual particle, an experimental mixture, and a deposit. Additionally, the numerical value, and thus definition, of particle or envelope density can vary based on methodology. For example, when wrapping particles in a wax film, the extent to which the film is pushed into surface cavities will exert a control on the density calculated. To allow accurate comparison between published datasets, clear and consistent definitions must be sought. Furthermore, robust, and appropriate statistical treatment of density datasets must be performed (Bernard et al., 2015).
The morphology of pyroclasts within PDCs and associated co-PDC plumes exhibits a control on the momentum coupling between the particle and the carrier phase (e.g., gas, or pseudo-gas when very fine particles are fully coupled with the fluid), and thus also controls the momentum dissipation due to the particle-fluid drag, the particles’ trajectory and terminal settling velocity. It is well-established in multiphase flow dynamics that the aerodynamic drag of solid particles depends on their particle Reynolds number, density, and shape (e.g., Ganser, 1993; Dioguardi and Mele, 2018; Bagheri and Bonadonna, 2019). Through its control on particle packing, a particles’ morphology also influences the permeability of both the current and deposits. Furthermore, morphology is frequently used as a diagnostic tool. For example, it can be used to assess the abrasion propensity of pyroclasts, where more angular clasts are more susceptible to mechanical modification, and thus can be used as a proxy for the distance travelled from source (Manga et al., 2011; Brand et al., 2014). Morphology is also extensively used to distinguish between fallout and flow units in the field, where flow units contain more rounded pyroclasts.
There are a range of methods used in the measurement of morphology, of increasing sophistication and use. Simple qualitative visual inspection is a wide-spread field approach with specific clasts quantitatively measured for minor, intermediate and long axis length with tape measures or callipers, depending on the overall pyroclast size. In the laboratory, for pyroclasts of lapilli size or smaller, morphologies based on 2D measurements are typically made. These fall into two categories: projected and cross-sectional. Projected morphology measurement techniques include dynamic image analysis (e.g., Microtrac Camsizer instruments), static image analysis (e.g., Malvern Morphologi), and custom-made camera-light set ups (e.g., Dellino et al., 2005). All these methods measure the particle silhouette. In contrast, cross-section-based measurements involve mounting, impregnating and polishing particles to produce polished grain mounts or thin sections. These are then imaged using a Scanning Electron Microscope (SEM). Lastly, 3D measurements are becoming increasingly common with advances in X-Ray computed tomography (XRCT); however, with current micro XRCT scanners the voxel (i.e., three-dimensional pixel) resolution is not sufficient to accurately document the morphology of (fine) ash-sized particles. The exact resolution is dependent on the individual instrument specification and is expected to improve with continued technological advancement.
Typical or representative values for pyroclast morphology are almost impossible to define. Pyroclast morphology is inherently linked to the primary fragmentation mechanism, which for PDCs is non-unique encompassing a broad range of eruption styles and compositions (Brown and Andrews, 2015; Dufek et al., 2015). Additionally, the pyroclasts are variably modified by further (i.e., secondary) fragmentation processes creating a temporal evolution in morphology (Calder et al., 2000; Manga et al., 2011; Kueppers et al., 2012; Mueller et al., 2015; Jones et al., 2016). This complexity and the lack of representative values hinder the incorporation of particle morphology into numerical models and the scaling of analogue experiments.
Another challenge for the quantification of particle morphology is the huge range of shape descriptors used within the literature. This range makes cross-comparison between different studies and deposits challenging and the frequent use of alternative nomenclature (e.g., roundness vs. circularity vs. form factor) further hinders useful comparisons. The use of shape parameters for juvenile volcanic pyroclasts, associated statistical tests and classifications, and the protocols for data collection have been extensively reviewed and this will not be repeated here (Leibrandt and Le Pennec, 2015; Liu et al., 2015; Dürig et al., 2021; Comida et al., 2022; Ross et al., 2022; Benet et al., 2023). The detailed work of Liu et al. (2015) leads to the recommendation of the following bounded (i.e., scaled from 0 to 1) shape descriptors: solidity, convexity, and axial ratio.
Solidity (SLD) is a measure of the irregularities and roughness on a particle scale (i.e., the morphological roughness) and is expressed as:
where Ap is the pyroclast area and AH is the area of the bounding convex hull. Convexity (CVX) is a measure of the small-scale cavities or protrusions on the particle surface (i.e., the textural roughness) and is expressed as:
where PP is the pyroclast perimeter and PH is the perimeter of the bounding convex hull. The axial ratio (AxlR) is a measure of particle elongation and is expressed as:
where B and A are the minor and major axis of the best fit ellipse, respectively. Furthermore, if a single parameter is needed to document the overall particle irregularity, then the form factor (FF) is recommended:
FF measures the deviation of a particle from a circle; however, its sensitivity to both particle elongation and roughness limits its use as a diagnostic tool. A visual representation of these parameters is shown in Figure 3.
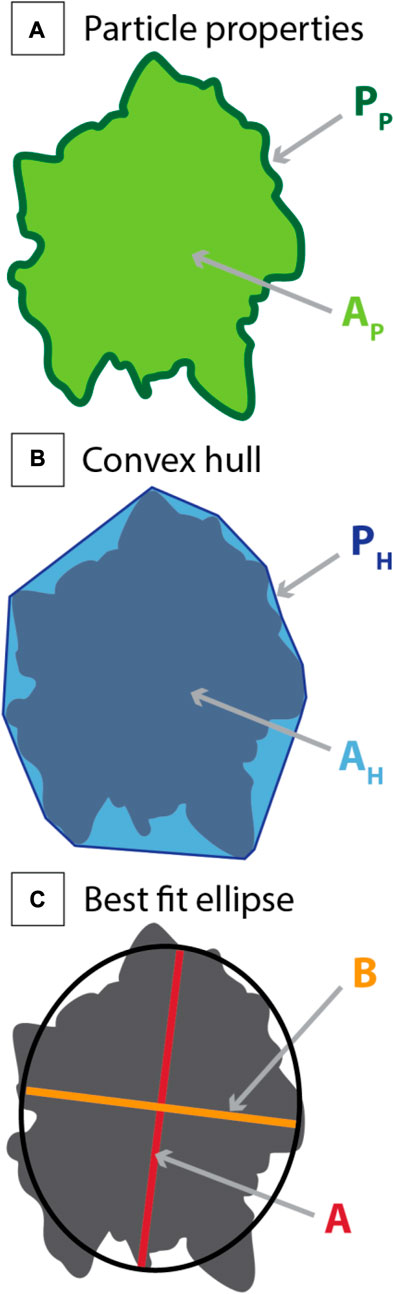
FIGURE 3. Schematic illustration of the recommended shape descriptors as defined by Liu et al. (2015). (A) Key pyroclast properties consisting of the pyroclast perimeter, PP and the pyroclast area, Ap. (B) The area, AH and perimeter, PH of the bounding convex hull. (C) The major, A and the minor, B axes of the best fit ellipse.
Previously, Dellino et al. (2005) recommended the use of the so-called “shape factor” for aerodynamic purposes (e.g., drag calculations):
where
In which Asph is the surface area of the equivalent sphere. Asph was calculated using the equivalent particle diameter determined by water displacement in Gay-Lussac bottles. Χ is the particle circularity:
where Psph is the perimeter of the circle equivalent to the maximum projection area.
This shape factor parameter, Ψ has been found to perform well in shape dependent drag laws (even better than 3D shape descriptors, Dioguardi and Mele, 2018) for terminal velocity calculations, which is to be expected since irregular particles tend to settle with the maximum projection area oriented perpendicular to the direction of motion.
As detailed, the quantification of these shape parameters is essential for models of aerodynamic drag which, in turn, are used in PDC simulation tools. This is particularly important for dilute PDCs, in which the particle-fluid interaction dominates. For example, Dioguardi and Mele (2018) showed that, for an overall variation of particle shape factor (Equation 5) of 20% around the measured value of their test case, the dynamic pressure calculated via their simplified dilute PDC model varied by ∼ 65%, while deposition rates and times varied by ∼ 30%.
Despite these advances, challenges remain. For the same particle, the shape parameter value depends on whether cross-sectional or projected images are used. Projected area-based measurements typically exhibit higher values due to the smoothing effect when projecting a 3-dimensional object onto a 2-dimensional plane (Liu et al., 2015). Furthermore, when using projected areas, it has been shown that values of FF, CVX and SLD can be dependent on the data collection method. Differences have been interpreted to stem from the difficulty in keeping the outline of a 3D shape in focus when using optical imaging techniques (Liu et al., 2015). Shape descriptors are also dependent on the grain size class analysed and different studies use different sizes governed by their scientific question, or the sample available, for example. These challenges make comparisons between published results problematic. The tephra fall community has started to define protocols for deposit sampling, data collection and analysis (Ross et al., 2022; Wallace et al., 2022). To support future intercomparison between datasets these protocols should be continually refined and adopted. Going forward, the growing use of XRCT could also be incorporated into such protocols and 3D shape parameter selection. Doing this early as a community may prevent the explosion of terms and methods observed with the 2D shape descriptors. The 3D measurement of particle shape and its use for calculating particle drag (Dioguardi et al., 2017) will be useful as numerical capabilities increase.
In this section, we highlight key properties that are needed for numerical simulation of PDCs and in the design, analysis, and scaling of analogue experimentation. However, unlike those in the previous section, these properties cannot be measured directly from the deposits; rather they are inferred.
PDCs are multiphase flows often composed of two phases: solid and gas. Due to gravity and ambient fluid entrainment, PDCs are density stratified, with a solid concentration that typically decreases upward. As in many other multiphase flows, processes at the microscale (i.e., particle scale) influence those at the mesoscale, which in turn impact macroscale processes. Similarly, the macroscale defines the environment in which the mesoscale features form through instabilities and other cascading processes. Simultaneously, the mesoscales create the environment in which the microscale features of individual particles are embedded. This bidirectional transfer of information up and down the wide range of length scales, from the particle size, interparticle spacing, instability length scales and finally to the scale of the system, makes PDCs extremely challenging to describe mathematically and therefore simplify in numerical models (Lube et al., 2020).
The solid concentration (C) per unit volume (i.e., measurements in volume %) greatly affects the gas-particle coupling regimes in PDCs (Breard et al., 2016). The mass loading (M) is also a dimensionless parameter and is defined as the ratio of particle-to-fluid mass and has been used to assess the coupling regime of multiphase flows (e.g., Capecelatro et al., 2014). Quantitatively it can be expressed as: M = solid density*C/(fluid density*(1-C)).
Very dilute (C<∼10−5 and M<0.1), particles can be approximated as one-way coupled, because the wake they create in the fluid is smaller than the mean particle separation length (e.g., Elghobashi, 1994). At concentrations of ∼10−5≤C<∼10−4 and 0.1≤M<1, particles can modulate the carrier flow field and, through feedback, impact their transport mechanism. This is the two-way coupling regime, where particle ↔ fluid interactions must be accounted for. When C>∼10−4 and M≥1, interactions between the suspended particles, both in the form of direct particle-particle collisions and fluid-mediated neighbour interactions, become important. This regime of particle-laden flows is traditionally termed four-way coupled, where particle ↔ particle interactions must be accounted for in addition to fluid → particle (forward coupling) and particle → fluid (backward coupling) interactions. Most PDCs, due to their high temperature, will be dominated by 2-way and 4-way coupling, as they become buoyant and transform into a co-PDC plume when concentrations drop below C<∼10−4 (e.g., Lube et al., 2020).
Concentration and mass loading impacts the settling velocity of particles (Breard et al., 2016; Weit et al., 2018; Penlou et al., 2023), and in turn this impacts the density stratification and partitioning of mass between the basal granular layer (i.e., the bedload) and overriding turbulent suspension (Douillet et al., 2014, 2019; Brosch and Lube, 2020). The concentration of particles in PDCs is expected to be heterogeneous temporally and spatially at any given location due to particle clustering. Clusters mainly form by: 1) turbulence due to preferential sweeping/concentration (in one-way and two-way coupling regimes), as particles with a Stokes number of unity will be swept to eddy margins and accumulate in low vorticity regions. 2) When four-way coupling originates at the microscale (i.e., particle scale) and generates elongated mesoscale clusters of particles that increase the settling velocity of the mixture (Lube et al., 2020). To date, the role of concentration on particle clustering is only crudely captured in 3D PDC models and has yet to be included in 2D models.
When the concentration, C
The drastic spatial and temporal evolution of the solid concentration make PDCs one of the most challenging multiphase flows to describe on Earth and has led our community to simplify their descriptions as either dense granular flows or dilute turbulent suspensions. The ability to directly image the inertial dynamics of PDCs and observe particle concentration structures is limited, although promising advances have been made in the use of Doppler radar (Voege et al., 2005; Bech and Chau, 2012; Vriend et al., 2013). Nevertheless, these technologies rely on well-timed and perfectly positioned instrumentation and eruption. Going forward, enhanced high-performance computing paired with large-scale laboratory experiments may offer ways to directly image concentration profiles in a systematic way (Esposti Ongaro et al., 2020a).
The permeability of gas-pyroclast mixtures is a key parameter that controls the diffusion timescale of excess pore pressure. Excess pore pressure can build inside dense PDCs due to the pore pressure feedback (Lube et al., 2020). This occurs through a variety of mechanisms involving flow compaction, dilation, and shear. In all these mechanisms the pore pressure is increased within the flow, and this helps to reduce the solid stresses, and consequently strongly contributes to increasing PDC mobility. Increased permeabilities support faster pore pressure diffusion and defluidization of the gas-pyroclast mixture. Permeability is expected to vary by orders of magnitude because of its strong dependence on the grain size distribution and the interrelated voidage/packing fraction (Ergun, 1952; Gidaspow, 1994). Currently, permeability is likely encapsulated within the low effective friction coefficient in depth-averaged PDC models used to reproduce the long runout of past events. Despite the importance of this parameter, permeability measurements of PDCs remain scarce (Bareschino et al., 2007; Druitt et al., 2007; Breard et al., 2019b). This is in part due to physical limitations of having small experimental setups that cannot accommodate the wide grain size distribution transported by flows.
In this section we provide a perspective on topics that are newly emerging or where there is a growing interest in response to new community requirements, increased computation capabilities, or advances in observation and experimentation, for example.
Volcanic eruptions display spectacular evidence of particle charging and strong electric fields, often to the point of producing discharge such as visible lightning. Lightning produces a broad spectrum of electromagnetic signals, and radio waves in particular that can be detected at great distances from the source (100 s–1000 s of km). Charging of volcanic ash is known to be produced by three main processes (Cimarelli et al., 2022): 1) fracto-charging (also known as fractoemission; James et al., 2008) as particles fragment due to rapid decompression or disruptive collisions (Méndez Harper et al., 2021), 2) tribo-charging of ash due to particle-particle interaction or particle-hydrometeor interaction (Méndez Harper and Dufek, 2016) and 3) radioactive charging, for instance as radon decays (Nicoll et al., 2019). Both frictional and comminution processes operate in PDCs (e.g., Dufek and Manga, 2008) and hence particle charging is expected to occur during PDC transport. However, what is less certain is how the higher concentration of particles in PDCs influence the breakdown conditions at discharge. Most research on volcanic lightning has focused on charging in jets and plumes and benefited from a multidisciplinary approach from collaborations across atmospheric sciences, volcanology, and engineering (Cimarelli et al., 2022). However, lightning has also been detected in PDCs (Schultz et al., 2020) and described in early records of witness accounts (Lacroix, 1904). Nonetheless, there is a gap in knowledge regarding the role of particle charging on the dynamics of PDCs (across dense to dilute flow regimes) and whether electric fields, measurements of particle charge, or radio wave measurements could be used to probe the internal properties of PDCs and help their detection/identification, as other mass flows on Earth do not produce significant discharges. Searching PDC deposits for lightning-induced volcanic spherules (Genareau et al., 2015) may provide insight into past events however, separating PDC spherules from those formed in the jet/plume before collapse will be a challenge.
Granular flow rheology plays a crucial role in controlling the transportation and deposition of PDCs and can even influence their initiation (Sulpizio et al., 2014; Lube et al., 2020). However, despite its significance, the granular flow rheology of volcanic materials remains poorly understood as in situ measurements are lacking, and rheometry experiments on volcanic materials are still in their infancy. Similar to other complex granular media, the rheology of volcanic granular flows depends on various properties of the mixture, such as particle shape, density, and grain size distribution. In the past decade, advances in our understanding of PDC dynamics was aided by the development of experiments (Lube et al., 2015; Sulpizio et al., 2016; Smith et al., 2020; Gueugneau et al., 2022; Poppe et al., 2022) and use of tools from soft-matter physics, including the discrete-element method (Cundall and Strack, 1979), which can help us derive constitutive equations to describe granular flow rheology (e.g., μ(I)-rheology; Jop et al., 2006) and its interactions with the substrate (Breard et al., 2020; Breard et al., 2022). Although a bulk rheology that captures some of the complexity at micro- and meso-scales may be sufficient for depth-averaged models, 3D models require inputs such as particle-particle friction, particle-substrate friction, and particle-restitution coefficients (Breard et al., 2019a; Neglia et al., 2022), which are more challenging to measure than simple angle of repose or the H/L ratio.
The textural characterisation of ultra-fine volcanic ash (i.e., particle diameter <10 µm) has direct implications for human and environmental health hazard assessments (Eychenne et al., 2022; Ligot et al., 2022), for the understanding of long-range ash transport (Gouhier et al., 2019; Cashman and Rust, 2020; Eychenne and Engwell, 2022), and for improving satellite ash retrieval methods (Prata et al., 2019). PDCs are significant sources of ultra-fine ash given their high comminution efficiency (Kueppers et al., 2012; Mueller et al., 2015; Bernard and Le Pennec, 2016; Jones et al., 2016; Buckland et al., 2018; Hornby et al., 2020), which are expected to be preferentially partitioned into co-PDC plumes and transported long-distances in the atmosphere, potentially causing widespread impacts. Yet, no study has specifically investigated natural ash from PDCs in this size range. New opportunities for characterising the textural properties of such fine grained material are now emerging, thanks to the recent development of new tools for isolating ultra-fine ash from tephra samples, and the democratisation of high throughput and high spatial resolution analytical instruments, such as scanning and transmission electron microscopes with FEG sources (Eychenne et al., 2022). Characterising the texture of ultra-fine ash produced by PDCs should become a key research avenue in the future.
The surface properties of pyroclasts, in particular the surface area and surface chemistry, play a key role in the eruption dynamics, and in the associated eruption impacts. For instance, the surface area (total surface area, specific surface area, or surface area to volume ratio) exhibits an important control on the gas-particle heat transfer (Stroberg et al., 2010), and therefore affects the buoyancy and cooling of pyroclastic flows and plumes. Surface area also impacts particle drag and hence particle settling velocities (Ganser, 1993), and is used in calculating fragmentation energy budgets (Kolzenburg et al., 2013; Hajimirza et al., 2022). Critically, surface properties are the main control of the physicochemical interaction processes between the pyroclasts and the ambient medium (e.g., air/atmosphere, water bodies, lung lining fluids and lung tissues). Thus, the health and environmental impacts of volcanic pyroclasts are intrinsically related to their surface properties. The surface chemistry determines the available sites, and the surface area available for chemical exchange (e.g., scavenging and leaching) with the gaseous and liquid phases present within volcanic gas-particle mixtures (i.e., plumes, PDCs, co-PDCs) and surrounding atmosphere (Ayris et al., 2013, 2014; Delmelle et al., 2018, 2021). The pyroclasts’ surface properties therefore have a significant control on the fluxing of sulphur and halogen gases into the atmosphere during volcanic eruptions. The scavenging of the surrounding gaseous/liquid species by the pyroclast surfaces leads to chemically loaded particles (e.g., surface sulphate and halide salt formation; Casas et al., 2022) interacting with the environment after deposition. Salts can be readily mobilised into the soils and hydrological system with (positive and negative) implications for surrounding agriculture and water supplies (Ayris and Delmelle, 2012; Stewart et al., 2020). Surface salts are also dissolved in lung lining fluids releasing bio accessible, and potentially toxic, elements in the lungs (Tomašek et al., 2019). For the respiratory health hazard, surface area and chemistry are essential parameters to constrain, as they control the interaction mechanisms between the inhaled particles and the cell membranes, and hence the particles’ bioreactivity and harmful effects (Damby et al., 2013; Stewart et al., 2022).
Surface area measurements of volcanic particles are time consuming and, for small ash-sized particles, typically measured using the Brunauer–Emmett–Teller (BET) method of nitrogen adsorption. Specific surface areas (i.e., normalised per gram) for volcanic ash are typically <2 m2 g−1 (Delmelle et al., 2005; Horwell et al., 2007; Ayris and Delmelle, 2012), however larger values can be caused by rougher particle surfaces at the nanometer scale. Surface chemistry can be measured by X-ray photoelectron spectroscopy (XPS) or approached by high-resolution scanning electron microscopy coupled with energy dispersive spectroscopy (EDS) (Delmelle et al., 2007, 2021), while the surface composition in soluble species is typically measured by chemical analyses (e.g., ion chromatography and mass spectrometry) of the particles leachates (Stewart et al., 2020).
Most of the previous work on the surface properties of pyroclasts has focused on particles from fallout deposits. However, surface properties of pyroclasts transported within PDCs and co-PDC plumes are of equal or perhaps greater importance. Indeed, high abrasion rates occur in PDCs, producing abundant surface derived chips with high surface area (Jones and Russell, 2017). Furthermore, PDCs are hot mixtures of particles, volcanic gas, and ambient air, suggesting a high potential for particle-gas chemical exchange via the particles’ surfaces, but these processes have so far barely been studied. Bridging the gaps between the PDC and fallout community on these topics provides a clear way forward.
Distinct from other mass flows and gravity currents, PDCs carry considerable thermal energy, which not only plays a crucial role in their dynamics but also renders them deadly even during brief exposures (<1 min) at high temperatures (>100°C). In addition, unlike (nearly) isothermal currents such as snow avalanches and haboobs, they can generate large thermal plumes (co-PDC plumes) with source areas that can extend over their propagation area. Consequently, understanding the thermal evolution of PDCs is critical for hazard assessment.
The thermal structure of PDCs has yet to be probed in situ. Instead, their thermal signature is acquired through thermal imaging or deposit analysis. Thermal imaging is restricted to the outer opaque ash-cloud layer and can be employed to detect and gain a deeper understanding of the (colder) ambient fluid entrainment (Spampinato et al., 2011; Lube et al., 2020). PDCs that engulf vegetation (such as wood) frequently leave deposits containing charcoal. The charcoal’s reflectance increases with temperature during the charring process, which can help uncover the emplacement temperature of PDC deposits (Scott and Glasspool, 2005). While this method has been applied to only a limited number of historical deposits, laboratory studies demonstrate that charcoal reflectance measurements can accurately reveal the formation temperature from 200°C to 1,100°C (Scott and Glasspool, 2005; Ascough et al., 2010). Thus, charcoal reflectance analysis presents numerous applications in volcanology, including the study of PDC deposition and associated cooling as a function of transport distance (e.g., Pensa et al., 2015). Alternative techniques for uncovering thermal conditions include: 1) using lithic clasts and the natural remanent magnetization (NRM) method (Mandeville et al., 1994; McClelland et al., 2004; Zanella et al., 2015), 2) examining leaves damaged but not burnt by low-temperature PDCs (Efford et al., 2014), 3) oxidation rates (e.g., Tait et al., 1998), 4) calculating the conditions required for deposit welding (e.g., Andrews and Branney, 2011) and 5) quench rind measurements of large juvenile clasts (e.g., Benage et al., 2016).
Using the various aforementioned techniques, we know PDCs emplace deposits at temperatures ranging from <60°C (hydrothermal eruptions) to 850°C (Banks and Hoblitt, 1986; Trolese et al., 2018; Pensa et al., 2019; Brand et al., 2023) and usually display minimal temperature evolution from proximal to distal regions. This, however, does not imply a spatially constant temperature within a current (the deposits record the thermal condition at emplacement). For example, survivor accounts from the 1980 lateral blast from Mt St Helens report being engulfed initially in cold air with mud and ice particles, followed by scorching temperatures after about 10 s, causing severe burns (Lipman and Mullineaux, 1981). Large-scale experiments (Brosch et al., 2022), in which the PDC temperature can substantially vary between the non-depositional flow head (that entrains substantial ambient air) and the flow body (where ambient fluid entrainment is limited due to strong density gradients that prevent mixing), corroborate the Mt St Helens reports. Unfortunately, unless future in situ temperature measurements are obtained using thermocouples immersed in PDCs, present techniques can only offer limited insights into the temporal and spatial evolution of the thermal conditions within currents.
To comprehend the spatiotemporal thermal structure of PDCs, numerical models that solve the energy equation have been developed in 1D (Bursik and Woods, 1996; Shimizu et al., 2019), 2D (de' Michieli Vitturi et al., 2023), and 3D (Esposti Ongaro et al., 2008; Dufek, 2016; Esposti Ongaro et al., 2020b; Hutchison and Dufek, 2021). However, all these models require several key assumptions and approximations. As input parameters, the initial temperatures of both the fluid and particles are required, with the latter potentially being a function of particle size (Moitra et al., 2018). The thermal properties (e.g., specific heat, thermal conductivity) of the particles also need to be established, which may also be a function of particle size and are seldom well-measured. Furthermore, 1D and 2D models must account for ambient fluid entrainment through an empirical entrainment law, such as the one developed by Parker et al. (1987) from turbidity current experiments (which does not consider entrainment in the flow head) but is widely employed in PDC models (Bursik and Woods, 1996; de’ Michieli Vitturi et al., 2023). Finally, these 1D and 2D models do not account for the vertical temperature gradients, as they assume a vertically mixed current, thus potentially underestimating the temperature of the basal flow. Overall, there is a need to understand the thermal properties of volcanic particles as a function of measurable physical properties (e.g., porosity, surface area) to help us understand the partitioning of heat within PDCs.
In this contribution we have identified key physical properties of PDCs and their related co-PDC plumes (Figure 4). These have included properties that can be extracted from the study of deposits (Section 2), those that are inferred (Section 3), and those that are emerging (Section 4) due to, at least in part, new measurement techniques, requirements, and understanding by the community. From the number and diversity in topics presented in this perspective it is clear that the study of PDCs is a multidisciplinary topic and, as such, when investigating their processes and impacts, a multidisciplinary team is required.
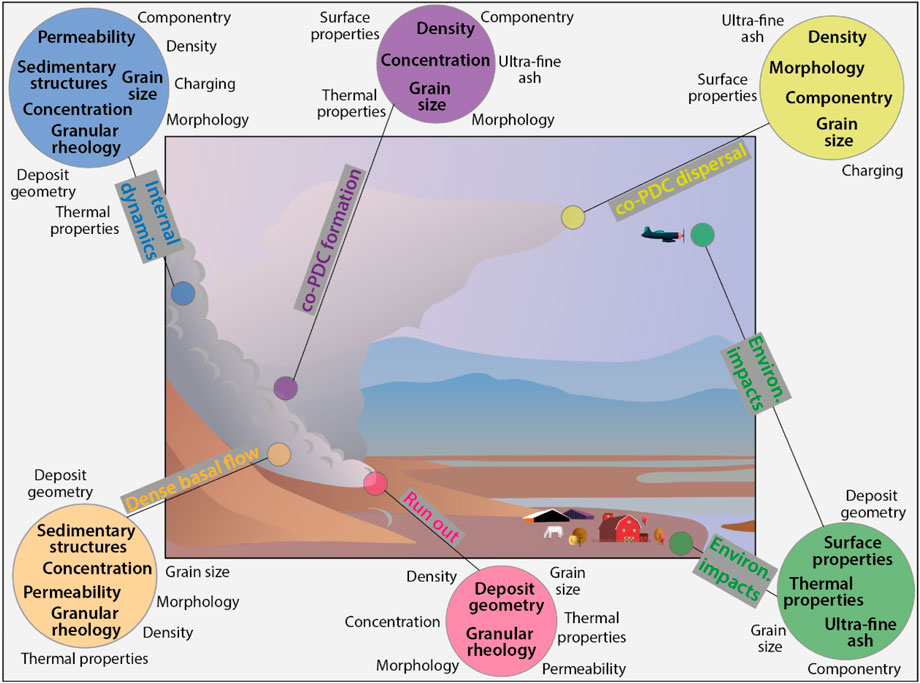
FIGURE 4. Schematic cartoon of a PDC, associated co-PDC plume and nearby infrastructure and environment. Coloured circles focus on key parts of this eruption scenario and list the associated physical and inferred properties. These words match our sub-heading titles and are sometimes abbreviated. For example, deposit geometry (area, volume, thickness, runout) is abbreviated to deposit geometry. The properties listed within the coloured circle represent first-order controls whereas properties listed outside the circle are of a lower order importance. This diagram serves as an idealised overview; clearly by their inclusion in this article, all properties are relevant to all PDC processes and all impacts in an interconnected manner.
A common theme throughout this article is the comparability of methods with those used by the tephra/air fall community. However, despite this commonality, and the fact that some of the deposits are indeed airfall themselves (e.g., co-PDC fallout layers), surprisingly little overlap exists in the methods, terminology and protocols used. A clear next step would be to bridge the gap between the tephra fall and PDC communities and the sub-groups within (e.g., numerical modellers, experimentalists, government agencies, and academia). Furthermore, the textural analysis of pyroclasts is currently experiencing ‘an explosion of methods’, with a large range of particle shape/size instrumentation becoming available and the growing use of XRCT, for example. It is therefore a perfect time for the community to discuss common and transparent methods for key physical properties, and perhaps develop a standard protocol that can be performed as a minimum and allows cross-comparison between groups. This has been started for the tephra fall community (e.g., Ross et al., 2022) and hopefully can be integrated and discussed further for PDCs.
Looking forward, unravelling the internal processes operating within PDCs remains a key and important challenge. Using geophysical techniques such as infrasound, acoustics, seismic signals and doppler radar to image the internal structure and processes provides promise, especially when such measurements are ground truthed at the lab scale where signals can be directly correlated with specific processes. The development of in situ sensors that can be used to measure internal properties (e.g., velocities, fluid pressure, thermal conditions) in real-time could provide directly measured parameters, currently lacking, needed to ground truth numerical models. Understanding entrainment dynamics and the related flux between different parts of the current (e.g., dense basal flow vs overriding cloud; Figure 1) is needed to understand mass, momentum, and energy partitioning and thus runout distance. Furthermore, determining the physical properties (e.g., size, shape, and density) of dispersing ash from co-PDCs is needed for operational modelling of the onwards transport of the ash cloud used to warn the aviation industry of the potential hazard (e.g., Beckett et al., 2015; Engwell and Eychenne, 2016).
TJJ organised the workshops that led to this contribution, secured the research funding, and led the manuscript preparation. All authors contributed to the article and approved the submitted version.
This contribution is the result of a NERC funded pyroclastic density current partnership (NE/W003767/1) which all authors acknowledge. TJJ was supported by a UK Research and Innovation Future Leaders Fellowship (MR/W009781/1). FD was supported by the RETURN Extended Partnership and received funding from the European Union Next-GenerationEU (National Recovery and Resilience Plan–NRRP, Mission 4, Component 2, Investment 1.3—D.D. 1243 2/8/2022, PE0000005). ECPB was supported by UKRI with the NERC-IRF (NE/V014242/1). SE was supported by a NERC Standard Grant (NE/R011001/1). JD was supported by NSF-EAR grant 2140303. This work is published with permission of the Executive Director of the British Geological Survey (UKRI).
We thank Karoly Nemeth, Sarah Ogburn and Adrian Hornby whose comments helped improve this work.
The authors declare that the research was conducted in the absence of any commercial or financial relationships that could be construed as a potential conflict of interest.
All claims expressed in this article are solely those of the authors and do not necessarily represent those of their affiliated organizations, or those of the publisher, the editors, and the reviewers. Any product that may be evaluated in this article, or claim that may be made by its manufacturer, is not guaranteed or endorsed by the publisher.
Abdurachman, E. K., Bourdier, J-L., and Voight, B. (2000). Nuées ardentes of 22 november 1994 at Merapi volcano, java, Indonesia. J. Volcanol. Geotherm. Res. 100, 345–361. doi:10.1016/S0377-0273(00)00144-X
Albino, F., Biggs, J., and Escobar-Wolf, R. P., (2020). “Using TanDEM-X satellite interferometry for measuring pyroclastic flow processes: bulking and run-out during the 2018 eruption of fuego volcano, guatemala,” in AGU fall meeting abstracts, 0300–V106.
Andrews, G. D., and Branney, M. J. (2011). Emplacement and rheomorphic deformation of a large, lava-like rhyolitic ignimbrite: grey's landing, southern Idaho. GSA Bull. 123 (3-4), 725–743. doi:10.1130/B30167.1
Andrews, B. J., and Manga, M. (2012). Experimental study of turbulence, sedimentation, and coignimbrite mass partitioning in dilute pyroclastic density currents. J. Volcanol. Geotherm. Res. 225, 30–44. doi:10.1016/j.jvolgeores.2012.02.011
Andrews, B. J., Costa, F., Venzke, E., and Widiwijayanti, C. (2022). Databases in volcanology. Bull. Volcanol. 84 (10), 92. doi:10.1007/s00445-022-01597-x
Ascough, P. L., Bird, M. I., Scott, A. C., Collinson, M. E., Cohen-Ofri, I., Snape, C. E., et al. (2010). Charcoal reflectance measurements: implications for structural characterization and assessment of diagenetic alteration. J. Archaeol. Sci. 37 (7), 1590–1599. doi:10.1016/j.jas.2010.01.020
Auker, M. R., Sparks, R. S. J., Siebert, L., Crosweller, H. S., and Ewert, J. (2013). A statistical analysis of the global historical volcanic fatalities record. J. Appl. Volcanol. 2, 2–24. doi:10.1186/2191-5040-2-2
Ayris, P. M., and Delmelle, P. (2012). The immediate environmental effects of tephra emission. Bull. Volcanol. 74, 1905–1936. doi:10.1007/s00445-012-0654-5
Ayris, P. M., Lee, A. F., Wilson, K., Kueppers, U., Dingwell, D., and Delmelle, P. (2013). SO2 sequestration in large volcanic eruptions: high-temperature scavenging by tephra. Geochim. Cosmochim. Acta 110, 58–69. doi:10.1016/j.gca.2013.02.018
Ayris, P. M., Delmelle, P., Cimarelli, C., Maters, E. C., Suzuki, Y. J., and Dingwell, D. B. (2014). HCl uptake by volcanic ash in the high temperature eruption plume: mechanistic insights. Geochim. Cosmochim. Acta 144, 188–201. doi:10.1016/j.gca.2014.08.028
Bagheri, G., and Bonadonna, C. (2019). On the drag of freely falling non-spherical particles. Powder Technol. 301, 526–544. doi:10.1016/j.powtec.2016.06.015
Banks, N. G., and Hoblitt, R. P. (1996). Direct temperature measurements of deposits. Mount St. Helens, Washington: United States Geological Survey, 1980–1981. USGS Professional Paper 1387. doi:10.3133/pp1387
Barberi, F., Cioni, R., Rosi, M., Santacroce, R., Sbrana, A., and Vecci, R. (1989). Magmatic and phreatomagmatic phases in explosive eruptions of Vesuvius as deduced by grain-size and component analysis of the pyroclastic deposits. J. Volcanol. Geotherm. Res. 38, 287–307. doi:10.1016/0377-0273(89)90044-9
Bareschino, P., Gravina, T., Lirer, L., Marzocchella, A., Petrosino, P., and Salatino, P. (2007). Fluidization and de-aeration of pyroclastic mixtures: the influence of fines content, polydispersity and shear flow. J. Volcanol. Geotherm. Res. 164, 284–292. doi:10.1016/j.jvolgeores.2007.05.013
Bartholdy, J., Ernstsen, V. B., Flemming, B. W., Winter, C., Bartholomä, A., and Kroon, A. (2015). On the formation of current ripples. Sci. Rep. 5, 11390–11399. doi:10.1038/srep11390
Bech, J., and Chau, J. L. (2012). Doppler radar observations: Weather radar, wind profiler, ionospheric radar, and other advanced applications. Rijeka, Croatia: InTech, 470.
Beckett, F. M., Witham, C. S., Hort, M. C., Stevenson, J. A., Bonadonna, C., and Millington, S. C. (2015). Sensitivity of dispersion model forecasts of volcanic ash clouds to the physical characteristics of the particles. J. Geophys Res. Atmos. 120, 11,636–11,652. doi:10.1002/2015JD023609
Belousov, A., Voight, B., and Belousova, M. (2007). Directed blasts and blast-generated pyroclastic density currents: A comparison of the bezymianny 1956, Mount St helens 1980, and Soufrière Hills, Montserrat 1997 eruptions and deposits. Bull. Volcanol. 69, 701–740. doi:10.1007/s00445-006-0109-y
Benage, M. C., Dufek, J., and Mothes, P. A. (2016). Quantifying entrainment in pyroclastic density currents from the tungurahua eruption, Ecuador: integrating field proxies with numerical simulations. Geophys. Res. Lett. 43 (13), 6932–6941. doi:10.1002/2016GL069527
Benet, D., Costa, F., and Widiwijayanti, C., (2023). VolcashDB: Volcanic ash particle image and classification database. doi:10.31223/X53659
Bernard, J., and Le Pennec, J-L. (2016). The milling factory: componentry-dependent fragmentation and fines production in pyroclastic flows. Geology 44, 907–910. doi:10.1130/G38198.1
Bernard, B., Hidalgo, S., Robin, C., Beate, B., and Quijozaca, J. (2014a). The 3640--3510 BC rhyodacite eruption of chachimbiro compound volcano, Ecuador: A violent directed blast produced by a satellite dome. Bull. Volcanol. 76, 849–920. doi:10.1007/s00445-014-0849-z
Bernard, J., Kelfoun, K., Le Pennec, J-L., and Vallejo Vargas, S. (2014b). Pyroclastic flow erosion and bulking processes: comparing field-based vs. modeling results at tungurahua volcano, ecuador. Bull. Volcanol. 76, 858–916. doi:10.1007/s00445-014-0858-y
Bernard, B., Kueppers, U., and Ortiz, H. (2015). Revisiting the statistical analysis of pyroclast density and porosity data. Solid earth. 6 (3), 869–879. doi:10.5194/se-6-869-2015
Bernard, J., Eychenne, J., Le Pennec, J-L., and Narváez, D. (2016). Mass budget partitioning during explosive eruptions: insights from the 2006 paroxysm of tungurahua volcano, ecuador. Geochem. Geophys Geosystems 17, 3224–3240. doi:10.1002/2016GC006431
Bonadonna, C., and Phillips, J. C. (2003). Sedimentation from strong volcanic plumes. J. Geophys Res. Solid Earth 108, B7. doi:10.1029/2002JB002034
Bourdier, J. L., Boudon, G., and Gourgaud, A. (1989). Stratigraphy of the 1902 and 1929 nuée-ardente deposits, Mt. Pelée, Martinique. J. Volcanol. Geotherm. Res. 38, 77–96. doi:10.1016/0377-0273(89)90031-0
Brand, B. D., Mackaman-Lofland, C., Pollock, N. M., Bendaña, S., Dawson, B., and Wichgers, P. (2014). Dynamics of pyroclastic density currents: conditions that promote substrate erosion and self-channelization—mount st helens, washington (usa). J. Volcanol. Geotherm. Res. 276, 189–214. doi:10.1016/j.jvolgeores.2014.01.007
Brand, B. D., Pollock, N., Vallance, J. W., Ongaro, T. E., Roche, O., Trolese, M., et al. (2023). Advances in our understanding of pyroclastic current behavior from the 1980 eruption sequence of Mount St. Helens volcano (Washington), USA. Bull. Volcanol. 85, 24. doi:10.1007/s00445-022-01617-w
Branney, M. J., and Kokelaar, P. (2002). Pyroclastic density currents and the sedimentation of ignimbrites, 27. London: Geological Society of London Memoirs, 145.
Breard, E. C. P., Lube, G., Cronin, S. J., and Valentine, G. A. (2015). Transport and deposition processes of the hydrothermal blast of the 6 August 2012 Te Maari eruption, Mt. Tongariro. Bull. Volcanol. 77, 100. doi:10.1007/s00445-015-0980-5
Breard, E. C. P., Lube, G., Jones, J. R., Dufek, J., Cronin, S. J., Valentine, G. A., et al. (2016). Coupling of turbulent and non-turbulent flow regimes within pyroclastic density currents. Nat. Geosci. 9, 767–771. doi:10.1038/ngeo2794
Breard, E. C. P., and Lube, G. (2017). Inside pyroclastic density currents--uncovering the enigmatic flow structure and transport behaviour in large-scale experiments. Earth Planet Sci. Lett. 458, 22–36. doi:10.1016/j.epsl.2016.10.016
Breard, E. C. P., Dufek, J., and Lube, G. (2018). Enhanced mobility in concentrated pyroclastic density currents: an examination of a self-fluidization mechanism. Geophys Res. Lett. 45, 654–664. doi:10.1002/2017GL075759
Breard, E. C. P., Dufek, J., and Roche, O. (2019a). Continuum modeling of pressure-balanced and fluidized granular flows in 2-D: comparison with glass bead experiments and implications for concentrated pyroclastic density currents. J. Geophys Res. Solid Earth 124, 5557–5583. doi:10.1029/2018JB016874
Breard, E. C. P., Jones, J. R., Fullard, L., Lube, G., Davies, C., and Dufek, J. (2019b). The permeability of volcanic mixtures—Implications for pyroclastic currents. J. Geophys Res. Solid Earth 124, 1343–1360. doi:10.1029/2018JB016544
Breard, E. C. P., Dufek, J., Fullard, L., and Carrara, A. (2020). The basal friction coefficient of granular flows with and without excess pore pressure: implications for pyroclastic density currents, water-rich debris flows, and rock and submarine avalanches. J. Geophys Res. Solid Earth 125, e2020JB020203. doi:10.1029/2020JB020203
Breard, E. C. P., Fullard, L., Dufek, J., Tennenbaum, M., Fernandez Nieves, A., and Dietiker, J. F. (2022). Investigating the rheology of fluidized and non-fluidized gas-particle beds: implications for the dynamics of geophysical flows and substrate entrainment. Granul. Matter 24, 34. doi:10.1007/s10035-021-01192-5
Breard, E. C. P., Dufek, J., Charbonnier, S., Gueugneau, V., Giachetti, T., and Walsh, B. (2023). The fragmentation-induced fluidisation of pyroclastic density currents. Nat. Commun. 14, 2079. doi:10.1038/s41467-023-37867-1
Brosch, E., and Lube, G. (2020). Spatiotemporal sediment transport and deposition processes in experimental dilute pyroclastic density currents. J. Volcanol. Geotherm. Res. 401, 106946. doi:10.1016/j.jvolgeores.2020.106946
Brosch, E., Lube, G., Esposti-Ongaro, T., Cerminara, M., Breard, E., and Meiburg, E. (2022). Characteristics and controls of the runout behaviour of non-Boussinesq particle-laden gravity currents-A large-scale experimental investigation of dilute pyroclastic density currents. J. Volcanol. Geotherm. Res. 432, 107697. doi:10.1016/j.jvolgeores.2022.107697
Brown, R. J., and Andrews, G. D. M. (2015). “Deposits of pyroclastic density currents,” in The encyclopedia of volcanoes (Amsterdam, Netherlands: Elsevier), 631–648.
Buckland, H. M., Eychenne, J., Rust, A. C., and Cashman, K. V. (2018). Relating the physical properties of volcanic rocks to the characteristics of ash generated by experimental abrasion. J. Volcanol. Geotherm. Res. 349, 335–350. doi:10.1016/j.jvolgeores.2017.11.017
Burgisser, A., and Bergantz, G. W. (2002). Reconciling pyroclastic flow and surge: the multiphase physics of pyroclastic density currents. Earth Planet Sci. Lett. 202, 405–418. doi:10.1016/S0012-821X(02)00789-6
Bursik, M. I., and Woods, A. W. (1996). The dynamics and thermodynamics of large ash flows. Bull. Volcanol. 58, 175–193. doi:10.1007/s004450050134
Calder, E. S., Cole, P. D., Dade, W. B., Druitt, T. H., Hoblitt, R. P., Huppert, H. E., et al. (1999). Mobility of pyroclastic flows and surges at the soufriere Hills Volcano, Montserrat. Geophys Res. Lett. 26, 537–540. doi:10.1029/1999GL900051
Calder, E. S., Sparks, R. S. J., and Gardeweg, M. C. (2000). Erosion, transport and segregation of pumice and lithic clasts in pyroclastic flows inferred from ignimbrite at Lascar Volcano, Chile. J. Volcanol. Geotherm. Res. 104, 201–235. doi:10.1016/S0377-0273(00)00207-9
Capaccioni, B., and Sarocchi, D. (1996). Computer-assisted image analysis on clast shape fabric from the orvieto-bagnoregio ignimbrite (Vulsini district, central Italy): implications on the emplacement mechanisms. J. Volcanol. Geotherm. Res. 70, 75–90. doi:10.1016/0377-0273(95)00049-6
Capecelatro, J., Desjardins, O., and Fox, R. O. (2014). Numerical study of collisional particle dynamics in cluster-induced turbulence. J. Fluid Mech. 747, R2. doi:10.1017/jfm.2014.194
Cas, R., and Wright, J. (2012). Volcanic successions modern and ancient: A geological approach to processes, products and successions. Cham: Springer Science & Business Media.
Casas, A. S., Hornby, A., Poetsch, C., Cimarelli, C., and Dingwell, D. B. (2022). A novel method for the quantitative morphometric characterization of soluble salts on volcanic ash. Bull. Volcanol. 84, 3–19. doi:10.1007/s00445-021-01519-3
Cashman, K., and Rust, A. (2016). “Introduction: part 2: volcanic ash: generation and spatial variations,” in Volcanic ash: Hazard observation (Amsterdam, Netherlands: Elsevier Inc.), 5–22.
Cashman, K. V., and Rust, A. C. (2020). Far-travelled ash in past and future eruptions: combining tephrochronology with volcanic studies. J. Quat. Sci. 35, 11–22. doi:10.1002/jqs.3159
Charbonnier, S. J., and Gertisser, R. (2008). Field observations and surface characteristics of pristine block-and-ash flow deposits from the 2006 eruption of Merapi Volcano, Java, Indonesia. J. Volcanol. Geotherm. Res. 177, 971–982. doi:10.1016/j.jvolgeores.2008.07.008
Charbonnier, S. J., and Gertisser, R. (2011). Deposit architecture and dynamics of the 2006 block-and-ash flows of Merapi Volcano, Java, Indonesia. Sedimentology 58, 1573–1612. doi:10.1111/j.1365-3091.2011.01226.x
Charbonnier, S. J., Germa, A., Connor, C. B., Gertisser, R., Preece, K., Komorowski, J. C., et al. (2013). Evaluation of the impact of the 2010 pyroclastic density currents at Merapi volcano from high-resolution satellite imagery, field investigations and numerical simulations. J. Volcanol. Geotherm. Res. 261, 295–315. doi:10.1016/j.jvolgeores.2012.12.021
Charbonnier, S. J., Garin, F., Rodríguez, L. A., Ayala, K., Cancel, S., Escobar-Wolf, R., et al. (2023). Unravelling the dynamics and hazards of the June 3rd, 2018, pyroclastic density currents at Fuego volcano (Guatemala). J. Volcanol. Geotherm. Res. 436, 107791. doi:10.1016/j.jvolgeores.2023.107791
Chedeville, C., and Roche, O. (2014). Autofluidization of pyroclastic flows propagating on rough substrates as shown by laboratory experiments. J. Geophys Res. Solid Earth 119, 1764–1776. doi:10.1002/2013JB010554
Chédeville, C., and Roche, O. (2015). Influence of slope angle on pore pressure generation and kinematics of pyroclastic flows: insights from laboratory experiments. Bull. Volcanol. 77, 96–13. doi:10.1007/s00445-015-0981-4
Choux, C. M., and Druitt, T. H. (2002). Analogue study of particle segregation in pyroclastic density currents, with implications for the emplacement mechanisms of large ignimbrites. Sedimentology 49, 907–928. doi:10.1046/j.1365-3091.2002.00481.x
Cimarelli, C., Behnke, S., Genareau, K., Harper, J. M., and Van Eaton, A. R. (2022). Volcanic electrification: recent advances and future perspectives. Bull. Volcanol. 84, 78–10. doi:10.1007/s00445-022-01591-3
Clarke, B., Tierz, P., Calder, E., and Yirgu, G. (2020). Probabilistic volcanic hazard assessment for pyroclastic density currents from pumice cone eruptions at Aluto volcano, Ethiopia. Front. Earth Sci. 8, 348. doi:10.3389/feart.2020.00348
Cole, P. D., Calder, E. S., Sparks, R. S. J., Clarke, A. B., Druitt, T. H., Young, S. R., et al. (2002). Deposits from dome-collapse and fountain-collapse pyroclastic flows at Soufrière Hills Volcano, Montserrat. Montserrat 21, 231–262. doi:10.1144/GSL.MEM.2002.021.01.11
Cole, P. D., Smith, P. J., Stinton, A. J., Odbert, H. M., Bernstein, M. L., Komorowski, J. C., et al. (2014). Chapter 5 vulcanian explosions at Soufrière Hills Volcano, Montserrat between 2008 and 2010. Geol. Soc. Lond. Mem. 39, 93–111. doi:10.1144/M39.5
Comida, P. P., Ross, P-S., Dürig, T., White, J. D. L., and Lefebvre, N. (2022). Standardized analysis of juvenile pyroclasts in comparative studies of primary magma fragmentation: 2. Choice of size fraction and method optimization for particle cross-sections. Bull. Volcanol. 84, 14–24. doi:10.1007/s00445-021-01517-5
Cundall, P. A., and Strack, O. D. L. (1979). A discrete numerical model for granular assemblies. geotechnique 29, 47–65. doi:10.1680/geot.1979.29.1.47
Damby, D. E., Horwell, C. J., Baxter, P. J., Delmelle, P., Donaldson, K., Dunster, C., et al. (2013). The respiratory health hazard of tephra from the 2010 Centennial eruption of Merapi with implications for occupational mining of deposits. J. Volcanol. Geotherm. Res. 261, 376–387. doi:10.1016/j.jvolgeores.2012.09.001
de’Michieli Vitturi, M., Neri, A., and Barsotti, S. (2015). PLUME-MoM 1.0: A new integral model of volcanic plumes based on the method of moments. Geosci. Model. Dev. 8, 2447–2463. doi:10.5194/gmd-8-2447-2015
de' Michieli Vitturi, M., Esposti Ongaro, T., Lari, G., and Aravena, A. (2019). IMEX_SfloW2D 1.0: A depth-averaged numerical flow model for pyroclastic avalanches. Model. Dev. 12, 581–595. doi:10.5194/gmd-12-581-2019
de' Michieli Vitturi, M., Esposti Ongaro, T., and Engwell, S. (2023). IMEX_SfloW2D v2: A depth-averaged numerical flow model for volcanic gas-particle flows over complex topographies and water, geosci. Model. Dev. Discuss. doi:10.5194/gmd-2023-80
Dellino, P., Mele, D., Bonasia, R., Braia, G., La Volpe, L., and Sulpizio, R. (2005). The analysis of the influence of pumice shape on its terminal velocity. Geophys Res. Lett. 32 (21), L21306. doi:10.1029/2005GL023954
Dellino, P., Mele, D., Sulpizio, R., La Volpe, L., and Braia, G. (2008). A method for the calculation of the impact parameters of dilute pyroclastic density currents based on deposit particle characteristics. J. Geophys Res. Solid Earth 113, B07206. B7. doi:10.1029/2007JB005365
Dellino, P., Dioguardi, F., Doronzo, D. M., and Mele, D. (2020). A discriminatory diagram of massive versus stratified deposits based on the sedimentation and bedload transportation rates. Experimental investigation and application to pyroclastic density currents. Sedimentology 67, 2013–2039. doi:10.1111/sed.12693
Dellino, P., Dioguardi, F., Isaia, R., Sulpizio, R., and Mele, D. (2021a). The impact of pyroclastic density currents duration on humans: the case of the ad 79 eruption of vesuvius. Sci. Rep. 11, 4959–9. doi:10.1038/s41598-021-84456-7
Dellino, P., Dioguardi, F., Rinaldi, A., Sulpizio, R., and Mele, D. (2021b). Inverting sediment bedforms for evaluating the hazard of dilute pyroclastic density currents in the field. Sci. Rep. 11, 21024–21111. doi:10.1038/s41598-021-00395-3
Delmelle, P., Villiéras, F., and Pelletier, M. (2005). Surface area, porosity and water adsorption properties of fine volcanic ash particles. Bull. Volcanol. 67, 160–169. doi:10.1007/s00445-004-0370-x
Delmelle, P., Lambert, M., Dufrêne, Y., Gerin, P., and Óskarsson, N. (2007). Gas/aerosol-ash interaction in volcanic plumes: new insights from surface analyses of fine ash particles. Earth Planet Sci. Lett. 259, 159–170. doi:10.1016/j.epsl.2007.04.052
Delmelle, P., Wadsworth, F. B., Maters, E. C., and Ayris, P. M. (2018). 8. High temperature reactions between gases and ash particles in volcanic eruption plumes. Rev. Mineral. Geochem. 84, 285–308. doi:10.1515/rmg.2018.84.8
Delmelle, P., Maters, E. C., Calkins, J. A., Gaspard, F., Opfergelt, S., and Jenkins, S. F. (2021). Eruptive style controls the formation of silicon hexafluoride salts on volcanic ash: the case of the 2010 eruption of eyjafjallajökull volcano, iceland. Chem. Geol. 579, 120327. doi:10.1016/j.chemgeo.2021.120327
Dioguardi, F., and Dellino, P. (2014). Pyflow: A computer code for the calculation of the impact parameters of dilute pyroclastic density currents (DPDC) based on field data. Comput. Geosci 66, 200–210. doi:10.1016/j.cageo.2014.01.013
Dioguardi, F., and Mele, D. (2015). A new shape dependent drag correlation formula for non-spherical rough particles. Experiments and results. Powder Technol. 277, 222–230. doi:10.1016/j.powtec.2015.02.062
Dioguardi, F., and Mele, D. (2018). PYFLOW_2. 0: A computer program for calculating flow properties and impact parameters of past dilute pyroclastic density currents based on field data. Bull. Volcanol. 80, 28–16. doi:10.1007/s00445-017-1191-z
Dioguardi, F., Dellino, P., and Mele, D. (2014). Integration of a new shape-dependent particle-fluid drag coefficient law in the multiphase Eulerian-Lagrangian code MFIX-DEM. Powder Technol. 260, 68–77. doi:10.1016/j.powtec.2014.03.071
Dioguardi, F., Mele, D., Dellino, P., and Dürig, T. (2017). The terminal velocity of volcanic particles with shape obtained from 3D X-ray microtomography. J. Volcanol. Geotherm. Res. 329, 41–53. doi:10.1016/j.jvolgeores.2016.11.013
Doronzo, D. M., Valentine, G. A., Dellino, P., and de Tullio, M. D. (2010). Numerical analysis of the effect of topography on deposition from dilute pyroclastic density currents. Earth Planet Sci. Lett. 300, 164–173. doi:10.1016/j.epsl.2010.10.003
Douillet, G. A., Rasmussen, K. R., Kueppers, U., Lo Castro, D., Merrison, J. P., Iversen, J. J., et al. (2014). Saltation threshold for pyroclasts at various bedslopes: wind tunnel measurements. J. Volcanol. Geotherm. Res. 278, 14–24. doi:10.1016/j.jvolgeores.2014.03.011
Douillet, G. A., Bernard, B., Bouysson, M., Chaffaut, Q., Dingwell, D. B., Gegg, L., et al. (2019). Pyroclastic dune bedforms: macroscale structures and lateral variations. examples from the 2006 pyroclastic currents at tungurahua (ecuador). Sedimentology 66, 1531–1559. doi:10.1111/sed.12542
Douillet, G. A. (2021). The supercritical question for pyroclastic dune bedforms: an overview. Sedimentology 68, 1698–1727. doi:10.1111/sed.12859
Dowey, N., and Williams, R. (2022). Simultaneous fall and flow during pyroclastic eruptions: A novel proximal hybrid facies. Geology 50, 1187–1191. doi:10.1130/G50169.1
Druitt, T. H. (1992). Emplacement of the 18 may 1980 lateral blast deposit ENE of Mount St. Helens, Washington. Bull. Volcanol. 54, 554–572. doi:10.1007/BF00569940
Druitt, T. H. (1998). Pyroclastic density currents. Geol. Soc. Lond. Spec. Publ. 145, 145–182. doi:10.1144/GSL.SP.1996.145.01.08
Druitt, T. H., Avard, G., Bruni, G., Lettieri, P., and Maez, F. (2007). Gas retention in fine-grained pyroclastic flow materials at high temperatures. Bull. Volcanol. 69, 881–901. doi:10.1007/s00445-007-0116-7
Dufek, J., and Manga, M. (2008). In situ production of ash in pyroclastic flows. J. Geophys Res. Solid Earth 113, 092077–B12202. doi:10.1029/2007JB005555
Dufek, J., Ongaro, T. E., and Roche, O. (2015). “Pyroclastic density currents: processes and models,” in The encyclopedia of volcanoes (Amsterdam, Netherlands: Elsevier), 617–629.
Dufek, J. (2016). The fluid mechanics of pyroclastic density currents. Annu. Rev. Fluid Mech. 48, 459–485. doi:10.1146/annurev-fluid-122414-034252
Dürig, T., Ross, P-S., Dellino, P., White, J. D. L., Mele, D., and Comida, P. P. (2021). A review of statistical tools for morphometric analysis of juvenile pyroclasts. Bull. Volcanol. 83, 79–21. doi:10.1007/s00445-021-01500-0
Efford, J. T., Bylsma, R. J., Clarkson, B. D., Pittari, A., Mauriohooho, K., and Moon, V. G. (2014). Vegetation dieback as a proxy for temperature within a wet pyroclastic density current: A novel experiment and observations from the 6th of august 2012 tongariro eruption. J. Volcanol. Geotherm. Res. 286, 367–372. doi:10.1016/j.jvolgeores.2014.05.016
Elghobashi, S. (1994). On predicting particle-laden turbulent flows. Appl. Sci. Res. 52, 309–329. doi:10.1007/BF00936835
Engwell, S., and Eychenne, J. (2016). Chapter 4. Contribution of fine ash to the atmosphere from plumes associated with pyroclastic density currents. 1. Amsterdam, Netherlands: Elsevier.
Esposti Ongaro, T. E., Neri, A., Menconi, G., de'Michieli Vitturi, M., Marianelli, P., Cavazzoni, C., et al. (2008). Transient 3D numerical simulations of column collapse and pyroclastic density current scenarios at Vesuvius. J. Volcanol. Geotherm. Res. 178, 378–396. doi:10.1016/j.jvolgeores.2008.06.036
Esposti Ongaro, T., Clarke, A. B., Voight, B., Neri, A., and Widiwijayanti, C. (2012). Multiphase flow dynamics of pyroclastic density currents during the May 18, 1980 lateral blast of Mount St. Helens. J. Geophys. Res. Solid Earth 117. B6. doi:10.1029/2011JB009081
Esposti Ongaro, T., Cerminara, M., Charbonnier, S. J., Lube, G., and Valentine, G. A. (2020a). A framework for validation and benchmarking of pyroclastic current models. Bull. Volcanol. 82, 51–17. doi:10.1007/s00445-020-01388-2
Esposti Ongaro, T., Komorowski, J-C., Legendre, Y., and Neri, A. (2020b). Modelling pyroclastic density currents from a subplinian eruption at La Soufrière de Guadeloupe (West Indies, France). Bull. Volcanol. 82, 76–26. doi:10.1007/s00445-020-01411-6
Eychenne, J., and Engwell, S. L. (2022). The grainsize of volcanic fall deposits: spatial trends and physical controls. GSA Bull. 135 (7-8), 1844–1858. doi:10.1130/B36275.1
Eychenne, J., and Le Pennec, J-L. (2012). Sigmoidal particle density distribution in a subplinian scoria fall deposit. Bull. Volcanol. 74, 2243–2249. doi:10.1007/s00445-012-0671-4
Eychenne, J., Cashman, K., Rust, A., and Durant, A. (2015). Impact of the lateral blast on the spatial pattern and grain size characteristics of the 18 May 1980 Mount St. Helens fallout deposit. J. Geophys Res. Solid Earth 120, 6018–6038. doi:10.1002/2015JB012116
Eychenne, J., Gurioli, L., Damby, D., Belville, C., Schiavi, F., Marceau, G., et al. (2022). Spatial distribution and physicochemical properties of respirable volcanic ash from the 16-17 August 2006 Tungurahua eruption (Ecuador), and alveolar epithelium response in-vitro. GeoHealth e2022GH000680 6, e2022GH000680. doi:10.1029/2022GH000680
Fauria, K. E., Manga, M., and Chamberlain, M. (2016). Effect of particle entrainment on the runout of pyroclastic density currents. J. Geophys. Res. Solid Earth 121 (9), 6445–6461. doi:10.1002/2016JB013263
Fedele, J. J., Hoyal, D., Barnaal, Z., Tulenko, J., and Awalt, S. (2016). “Bedforms created by gravity flows,” in SEPM special publication autogenic dynamics and self-organization in sedimentary systems. doi:10.2110/sepmsp.106.12
Fisher, R. V. (1965). Settling velocity of glass shards. Deep Sea Res. Oceanogr. Abstr. 12 (3), 345–353. doi:10.1016/0011-7471(65)90006-9
Fisher, R. V., and Heiken, G. (1982). Mt. Pelée, Martinique: may 8 and 20, 1902, pyroclastic flows and surges. J. Volcanol. Geotherm. Res. 13, 339–371. doi:10.1016/0377-0273(82)90056-7
Folk, R. L., and Ward, W. C. (1957). Brazos River bar [Texas]; a study in the significance of grain size parameters. J. Sediment. Res. 27, 3–26. doi:10.1306/74D70646-2B21-11D7-8648000102C1865D
Ganser, G. H. (1993). A rational approach to drag prediction of spherical and nonspherical particles. Powder Technol. 77, 143–152. doi:10.1016/0032-5910(93)80051-B
Gase, A. C., Brand, B. D., and Bradford, J. H. (2017). Evidence of erosional self-channelization of pyroclastic density currents revealed by ground-penetrating radar imaging at Mount St. Helens, Washington (USA). Geophys Res. Lett. 44, 2220–2228. doi:10.1002/2016GL072178
Genareau, K., Wardman, J. B., Wilson, T. M., McNutt, S. R., and Izbekov, P. (2015). Lightning-induced volcanic spherules. Geology 43 (4), 319–322. doi:10.1130/G36255.1
Gidaspow, D. (1994). Multiphase flow and fluidization: Continuum and kinetic theory descriptions. Massachusetts, United States: Academic Press.
Girolami, L., Druitt, T. H., Roche, O., and Khrabrykh, Z. (2008). Propagation and hindered settling of laboratory ash flows. J. Geophys. Res. Solid Earth 113 (B2). doi:10.1029/2007JB005074
Giordano, G., and Doronzo, D. M. (2017). Sedimentation and mobility of PDCs: A reappraisal of ignimbrites’ aspect ratio. Sci. Rep. 7, 4444. doi:10.1038/s41598-017-04880-6
Giordano, G., and Cas, R. A. (2021). Classification of ignimbrites and their eruptions. Earth-Science Rev. 220, 103697. doi:10.1016/j.earscirev.2021.103697
Gouhier, M., Eychenne, J., Azzaoui, N., Guillin, A., Deslandes, M., Poret, M., et al. (2019). Low efficiency of large volcanic eruptions in transporting very fine ash into the atmosphere. Sci. Rep. 9, 1449–1512. doi:10.1038/s41598-019-38595-7
Granados-Bolaños, S., Quesada-Román, A., and Alvarado, G. E. (2021). Low-cost UAV applications in dynamic tropical volcanic landforms. J. Volcanol. Geotherm. Res. 410, 107143. doi:10.1016/j.jvolgeores.2020.107143
Gueugneau, V., Charbonnier, S., and Roche, O. (2022). PyroCLAST: A new experimental framework to investigate overspilling of channelized, concentrated pyroclastic currents. Bull. Volcanol. 85, 5. doi:10.1007/s00445-022-01623-y
Hajimirza, S., Jones, T. J., Moreland, W. M., Gonnermann, H. M., and Thordarson, T. (2022). Quantifying the water-to-melt mass ratio and its impact on eruption plumes during explosive hydromagmatic eruptions. Geochem. Geophys Geosystems 23, e2021GC010160. doi:10.1029/2021GC010160
Hayashi, J. N., and Self, S. (1992). A comparison of pyroclastic flow and debris avalanche mobility. J. Geophys Res. Solid Earth 97, 9063–9071. doi:10.1029/92JB00173
Hornby, A. J., Lavallée, Y., Kendrick, J. E., Rollinson, G., Butcher, A. R., Clesham, S., et al. (2019). Phase partitioning during fragmentation revealed by QEMSCAN Particle Mineralogical Analysis of volcanic ash. Sci. Rep. 9, 126–212. doi:10.1038/s41598-018-36857-4
Hornby, A., Kueppers, U., Maurer, B., Poetsch, C., and Dingwell, D. (2020). Experimental constraints on volcanic ash generation and clast morphometrics in pyroclastic density currents and granular flows. Volcanica 3, 263–283. doi:10.30909/vol.03.02.263283
Horwell, C. J. (2007). Grain-size analysis of volcanic ash for the rapid assessment of respiratory health hazard. J. Environ. Monit. 9, 1107–1115. doi:10.1039/B710583P
Horwell, C. J., and Baxter, P. J. (2006). The respiratory health hazards of volcanic ash: A review for volcanic risk mitigation. Bull. Volcanol. 69, 1–24. doi:10.1007/s00445-006-0052-y
Horwell, C. J., Fenoglio, I., and Fubini, B. (2007). Iron-induced hydroxyl radical generation from basaltic volcanic ash. Earth Planet Sci. Lett. 261, 662–669. doi:10.1016/j.epsl.2007.07.032
Houghton, B. F., and Wilson, C. J. N. (1989). A vesicularity index for pyroclastic deposits. Bull. Volcanol. 51, 451–462. doi:10.1007/BF01078811
Hutchison, A. K., and Dufek, J. (2021). Generation of overspill pyroclastic density currents in sinuous channels. J. Geophys Res. Solid Earth e2021JB022442 126. doi:10.1029/2021JB022442
Iacovino, K., and Till, C. B. (2019). DensityX: A program for calculating the densities of hydrous magmatic liquids from 427-1,627 °C and up to 30 kbar. Volcanica 2, 1–10. doi:10.30909/vol.02.01.0110
Inman, D. L. (1952). Measures for describing the size distribution of sediments. J. Sediment. Res. 22, 125–145. doi:10.1306/D42694DB-2B26-11D7-8648000102C1865D
James, M. R., Wilson, L., Lane, S. J., Gilbert, J. S., Mather, T. A., Harrison, R. G., et al. (2008). Electrical charging of volcanic plumes. Space Sci. Rev. 137, 399–418. doi:10.1007/s11214-008-9362-z
James, M. R., Carr, B., D’Arcy, F., Diefenbach, A., Dietterich, H., Fornaciai, A., et al. (2020). Volcanological applications of unoccupied aircraft systems (UAS): developments, strategies, and future challenges. Volcanica 3, 67–114. doi:10.30909/vol.03.01.67114
Jones, T. J., and Russell, J. K. (2017). Ash production by attrition in volcanic conduits and plumes. Sci. Rep. 7, 5538. doi:10.1038/s41598-017-05450-6
Jones, T. J., McNamara, K., Eychenne, J., Rust, A. C., Cashman, K. V., Scheu, B., et al. (2016). Primary and secondary fragmentation of crystal-bearing intermediate magma. J. Volcanol. Geotherm. Res. 327, 70–83. doi:10.1016/j.jvolgeores.2016.06.022
Jones, T. J., Cashman, K. V., Liu, E. J., Rust, A. C., and Scheu, B. (2022). Magma fragmentation: A perspective on emerging topics and future directions. Bull. Volcanol. 84 (5), 45. doi:10.1007/s00445-022-01555-7
Jop, P., Forterre, Y., and Pouliquen, O. (2006). A constitutive law for dense granular flows. Nature 441 (7094), 727–730. doi:10.1038/nature04801
Kolzenburg, S., Russell, J. K., and Kennedy, L. A. (2013). Energetics of glass fragmentation: experiments on synthetic and natural glasses. Geochem. Geophys Geosystems 14, 4936–4951. doi:10.1002/2013GC004819
Kueppers, U., Scheu, B., Spieler, O., and Dingwell, D. B. (2005). Field-based density measurements as tool to identify preeruption dome structure: set-up and first results from unzen volcano, japan. J. Volcanol. Geotherm. Res. 141 (1-2), 65–75. doi:10.1016/j.jvolgeores.2004.09.005
Kueppers, U., Putz, C., Spieler, O., and Dingwell, D. B. (2012). Abrasion in pyroclastic density currents: insights from tumbling experiments. Phys. Chem. Earth, Parts A/B/C 45, 33–39. doi:10.1016/j.pce.2011.09.002
Lacroix, A. (1904). La Montagne Pelée et ses éruptions. Bull. Am. Geogr. Soc. 38 (1), 60. Masson. doi:10.2307/198615
Le Pennec, J-L., Chen, Y., Diot, H., Froger, J. L., and Gourgaud, A. (1998). Interpretation of anisotropy of magnetic susceptibility fabric of ignimbrites in terms of kinematic and sedimentological mechanisms: an anatolian case-study. Earth Planet Sci. Lett. 157, 105–127. doi:10.1016/S0012-821X(97)00215-X
Leibrandt, S., and Le Pennec, J-L. (2015). Towards fast and routine analyses of volcanic ash morphometry for eruption surveillance applications. J. Volcanol. Geotherm. Res. 297, 11–27. doi:10.1016/j.jvolgeores.2015.03.014
Lesher, C. E., and Spera, F. J. (2015). “Chapter 5 - thermodynamic and transport properties of silicate melts and magma,” in The encyclopedia of volcanoes. Editor H. Sigurdsson 2 (Amsterdam: Academic Press), 113–141.
Ligot, N., Guevara, A., and Delmelle, P. (2022). Drivers of crop impacts from tephra fallout: insights from interviews with farming communities around tungurahua volcano, ecuador. Volcanica 5, 163–181. doi:10.30909/vol.05.01.163181
Lipman, P. W., and Mullineaux, D. R. (1981). The 1980 eruptions of Mount St. Helens, Washington, 1250. Washington, DC: US Government Printing Office. US Geological Survey Professional Paper.
Liu, E. J., Cashman, K. V., and Rust, A. C. (2015). Optimising shape analysis to quantify volcanic ash morphology. GeoResJ 8, 14–30. doi:10.1016/j.grj.2015.09.001
Lube, G., Breard, E. C. P., Cronin, S. J., Procter, J. N., Brenna, M., Moebis, A., et al. (2014). Dynamics of surges generated by hydrothermal blasts during the 6 August 2012 Te Maari eruption, Mt. Tongariro, New Zealand. J. Volcanol. Geotherm. Res. 286, 348–366. doi:10.1016/j.jvolgeores.2014.05.010
Lube, G., Breard, E. C. P., Cronin, S. J., and Jones, J. (2015). Synthesizing large-scale pyroclastic flows: experimental design, scaling, and first results from pele. J. Geophys Res. Solid Earth 120, 1487–1502. doi:10.1002/2014JB011666
Lube, G., Breard, E. C. P., Jones, J., Fullard, L., Dufek, J., Cronin, S. J., et al. (2019). Generation of air lubrication within pyroclastic density currents. Nat. Geosci. 12, 381–386. doi:10.1038/s41561-019-0338-2
Lube, G., Breard, E. C. P., Esposti-Ongaro, T., Dufek, J., and Brand, B. (2020). Multiphase flow behaviour and hazard prediction of pyroclastic density currents. Nat. Rev. Earth Environ. 1, 348–365. doi:10.1038/s43017-020-0064-8
Macorps, E., Charbonnier, S. J., Varley, N. R., Capra, L., Atlas, Z., and Cabré, J. (2018). Stratigraphy, sedimentology and inferred flow dynamics from the July 2015 block-and-ash flow deposits at Volcán de Colima, Mexico. J. Volcanol. Geotherm. Res. 349, 99–116. doi:10.1016/j.jvolgeores.2017.09.025
Mandeville, C. W., Carey, S., Sigurdsson, H., and King, J. (1994). Paleomagnetic evidence for high-temperature emplacement of the 1883 subaqueous pyroclastic flows from Krakatau Volcano, Indonesia. J. Geophys. Res. Solid Earth 99, 9487–9504. B5. doi:10.1029/94JB00239
Manga, M., Patel, A., and Dufek, J. (2011). Rounding of pumice clasts during transport: field measurements and laboratory studies. Bull. Volcanol. 73, 321–333. doi:10.1007/s00445-010-0411-6
Maters, E. C., Cimarelli, C., Casas, A. S., Dingwell, D. B., and Murray, B. J. (2020). Volcanic ash ice-nucleating activity can be enhanced or depressed by ash-gas interaction in the eruption plume. Earth Planet Sci. Lett. 551, 116587. doi:10.1016/j.epsl.2020.116587
McClelland, E., Wilson, C. J. N., and Bardot, L. (2004). Palaeotemperature determinations for the 1.8-ka Taupo ignimbrite, New Zealand, and implications for the emplacement history of a high-velocity pyroclastic flow. Bull. Volcanol. 66, 492–513. doi:10.1007/s00445-003-0335-5
Méndez Harper, J., and Dufek, J. (2016). The effects of dynamics on the triboelectrification of volcanic ash. J. Geophys Res. Atmos. 121, 8209–8228. doi:10.1002/2015JD024275
Méndez Harper, J., Cimarelli, C., Cigala, V., Kueppers, U., and Dufek, J. (2021). Charge injection into the atmosphere by explosive volcanic eruptions through triboelectrification and fragmentation charging. Earth Planet. Sci. Lett. 574, 117162. doi:10.1016/j.epsl.2021.117162
Mills, O. P., and Rose, W. I. (2010). Shape and surface area measurements using scanning electron microscope stereo-pair images of volcanic ash particles. Geosphere 6, 805–811. doi:10.1130/GES00558.1
Moitra, P., Sonder, I., and Valentine, G. A. (2018). Effects of size and temperature-dependent thermal conductivity on the cooling of pyroclasts in air. Geochem. Geophys Geosystems 19, 3623–3636. doi:10.1029/2018GC007510
Mueller, S. B., Lane, S. J., and Kueppers, U. (2015). Lab-scale ash production by abrasion and collision experiments of porous volcanic samples. J. Volcanol. Geotherm. Res. 302, 163–172. doi:10.1016/j.jvolgeores.2015.07.013
Neglia, F., Dioguardi, F., Sulpizio, R., Ocone, R., and Sarocchi, D. (2022). Computational fluid dynamic simulations of granular flows: insights on the flow-wall interaction dynamics. Int. J. Multiph. Flow. 157, 104281. doi:10.1016/j.ijmultiphaseflow.2022.104281
Neri, A., Di Muro, A., and Rosi, M. (2002). Mass partition during collapsing and transitional columns by using numerical simulations. J. Volcanol. Geotherm. Res. 115, 1–18. doi:10.1016/S0377-0273(01)00304-3
Neri, A., Bevilacqua, A., Esposti Ongaro, T., Isaia, R., Aspinall, W. P., Bisson, M., et al. (2015a). Quantifying volcanic hazard at Campi Flegrei caldera (Italy) with uncertainty assessment: 2. Pyroclastic density current invasion maps. J. Geophys Res. Solid Earth 120, 2330–2349. doi:10.1002/2014JB011776
Neri, A., Esposti Ongaro, T. E., Voight, B., and Widiwijayanti, C. (2015b). “Pyroclastic density current hazards and risk,” in Volcanic hazards, risks and disasters (Amsterdam, Netherlands: Elsevier), 109–140.
Nicoll, K., Airey, M., Cimarelli, C., Bennett, A., Harrison, G., Gaudin, D., et al. (2019). First in situ observations of gaseous volcanic plume electrification. Geophys Res. Lett. 46, 3532–3539. doi:10.1029/2019GL082211
Ogburn, S. E., and Calder, E. S. (2017). The relative effectiveness of empirical and physical models for simulating the dense undercurrent of pyroclastic flows under different emplacement conditions. Front. Earth Sci. 5, 83. doi:10.3389/feart.2017.00083
Palmer, H. C., and MacDonald, W. D. (1999). Anisotropy of magnetic susceptibility in relation to source vents of ignimbrites: empirical observations. Tectonophysics 307, 207–218. doi:10.1016/S0040-1951(99)00126-2
Parker, G., Garcia, M., Fukushima, Y., and Yu, W. (1987). Experiments on turbidity currents over an erodible bed. J. Hydraul. Res. 25, 123–147. doi:10.1080/00221688709499292
Penlou, B., Roche, O., Manga, M., and van den Wildenberg, S. (2023). Experimental measurement of enhanced and hindered particle settling in turbulent gas-particle suspensions, and geophysical implications. J. Geophys. Res. Solid Earth 128. e2022JB025809. doi:10.1029/2022JB025809
Pensa, A., Porreca, M., Corrado, S., Giordano, G., and Cas, R. (2015). Calibrating the pTRM and charcoal reflectance (ro%) methods to determine the emplacement temperature of ignimbrites: fogo a sequence, são miguel, azores, portugal, as a case study. Bull. Volcanol. 77, 18–19. doi:10.1007/s00445-015-0904-4
Pensa, A., Capra, L., and Giordano, G. (2019). Ash clouds temperature estimation. Implication on dilute and concentrated PDCs coupling and topography confinement. Sci. Rep. 9, 5657. doi:10.1038/s41598-019-42035-x
Perillo, M. M., Best, J. L., and Garcia, M. H. (2014). A new phase diagram for combined-flow bedforms. J. Sediment. Res. 84, 301–313. doi:10.2110/jsr.2014.25
Poppe, S., Gilchrist, J. T., Breard, E. C. P., Graettinger, A., and Pansino, S. (2022). Analog experiments in volcanology: towards multimethod, upscaled, and integrated models. Bull. Volcanol. 84, 52. doi:10.1007/s00445-022-01543-x
Pollock, N. M., Brand, B. D., Rowley, P. J., Sarocchi, D., and Sulpizio, R. (2019). Inferring pyroclastic density current flow conditions using syn-depositional sedimentary structures. Bull. Volcanol. 81, 1–16. doi:10.1007/s00445-019-1303-z
Prata, G. S., Ventress, L. J., Carboni, E., Mather, T. A., Grainger, R. G., and Pyle, D. M. (2019). A new parameterization of volcanic ash complex refractive index based on NBO/T and SiO2 content. J. Geophys Res. Atmos. 124, 1779–1797. doi:10.1029/2018JD028679
Prave, A. R. (1990). Clarification of some misconceptions about antidune geometry and flow character. Sedimentology 37, 1049–1052. doi:10.1111/j.1365-3091.1990.tb01845.x
Pudasaini, S. P., and Miller, S. A. (2013). The hypermobility of huge landslides and avalanches. Eng. Geol. 157, 124–132. doi:10.1016/j.enggeo.2013.01.012
Rasul, M. G., Rudolph, V., and Carsky, M. (1999). Segregation potential in binary gas fluidized beds. Powder Technol. 103 (2), 175–181. doi:10.1016/S0032-5910(98)00230-7
Ritchie, L. J., Cole, P. D., and Sparks, R. S. J. (2002). Sedimentology of deposits from the pyroclastic density current of 26 december 1997 at Soufrière Hills Volcano, Montserrat. Geol. Soc. Lond. Mem. 21, 435–456. doi:10.1144/GSL.MEM.2002.021.01.19
Roche, O., Phillips, J. C., and Kelfoun, K. (2013). “Pyroclastic density currents. Model volcan process phys math volcanism 203–229,” in The physics and mathematics of volcanism ed fagents SA, gregg TKP, lopes RMC (Cambridge: Cambridge University Press).
Rosi, M., Vezzoli, L., Castelmenzano, A., and Grieco, G. (1999). Plinian pumice fall deposit of the campanian ignimbrite eruption (phlegraean fields, Italy). J. Volcanol. Geotherm. Res. 91, 179–198. doi:10.1016/S0377-0273(99)00035-9
Ross, P-S., Dürig, T., Comida, P. P., Lefebvre, N., White, J. D. L., Andronico, D., et al. (2022). Standardized analysis of juvenile pyroclasts in comparative studies of primary magma fragmentation; 1. Overview and workflow. Bull. Volcanol. 84, 13–29. doi:10.1007/s00445-021-01516-6
Sandri, L., Tierz, P., Costa, A., and Marzocchi, W. (2018). Probabilistic hazard from pyroclastic density currents in the Neapolitan area (Southern Italy). J. Geophys Res. Solid Earth 123, 3474–3500. doi:10.1002/2017JB014890
Sarocchi, D., Sulpizio, R., Macías, J. L., and Saucedo, R. (2011). The 17 july 1999 block-and-ash flow (BAF) at Colima volcano: new insights on volcanic granular flows from textural analysis. J. Volcanol. Geotherm. Res. 204, 40–56. doi:10.1016/j.jvolgeores.2011.04.013
Saucedo, R., Macías, J. L., Sheridan, M. F., Bursik, M., and Komorowski, J. (2005). Modeling of pyroclastic flows of Colima volcano, Mexico: implications for hazard assessment. J. Volcanol. Geotherm. Res. 139, 103–115. doi:10.1016/j.jvolgeores.2004.06.019
Saucedo, R., Macías, J. L., and Gavilanes-Ruiz, J. C., (2019). “Pyroclastic density currents at volcán de Colima,” in Volcán de Colima (Cham: Springer), 111–139.
Scarpati, C., Sparice, D., and Perrotta, A. (2014). A crystal concentration method for calculating ignimbrite volume from distal ash-fall deposits and a reappraisal of the magnitude of the Campanian Ignimbrite. J. Volcanol. Geotherm. Res. 280, 67–75. doi:10.1016/j.jvolgeores.2014.05.009
Scarpati, C., Sparice, D., and Perrotta, A. (2015). The ground layer of the campanian ignimbrite: an example of deposition from a dilute pyroclastic density current. Bull. Volcanol. 77, 97–10. doi:10.1007/s00445-015-0985-0
Schultz, C. J., Andrews, V. P., Genareau, K. D., and Naeger, A. R. (2020). Observations of lightning in relation to transitions in volcanic activity during the 3 June 2018 Fuego Eruption. Sci. Rep. 10, 18015–18112. doi:10.1038/s41598-020-74576-x
Scott, A. C., and Glasspool, I. J. (2005). Charcoal reflectance as a proxy for the emplacement temperature of pyroclastic flow deposits. Geology 33 (7), 589–592. doi:10.1130/G21474.1
Shea, T., Houghton, B. F., Gurioli, L., Cashman, K. V., Hammer, J. E., and Hobden, B. J. (2010). Textural studies of vesicles in volcanic rocks: an integrated methodology. J. Volcanol. Geotherm. Res. 190, 271–289. doi:10.1016/j.jvolgeores.2009.12.003
Shea, T., Gurioli, L., Houghton, B. F., Cioni, R., and Cashman, K. V. (2011). Column collapse and generation of pyroclastic density currents during the AD 79 eruption of Vesuvius: the role of pyroclast density. Geology 39, 695–698. doi:10.1130/G32092.1
Shea, T., Gurioli, L., and Houghton, B. F. (2012). Transitions between fall phases and pyroclastic density currents during the AD 79 eruption at Vesuvius: building a transient conduit model from the textural and volatile record. Bull. Volcanol. 74, 2363–2381. doi:10.1007/s00445-012-0668-z
Sher, D., and Woods, A. W. (2017). Experiments on mixing in pyroclastic density currents generated from short-lived volcanic explosions. Earth Planet. Sci. Lett. 467, 138–148. doi:10.1016/j.epsl.2017.03.009
Shimizu, H. A., Koyaguchi, T., and Suzuki, Y. J. (2019). The run-out distance of large-scale pyroclastic density currents: A two-layer depth-averaged model. J. Volcanol. Geotherm. Res. 381, 168–184. doi:10.1016/j.jvolgeores.2019.03.013
Smith, G., Rowley, P., Williams, R., Giordano, G., Trolese, M., Silleni, A., et al. (2020). A bedform phase diagram for dense granular currents. Nat. Commun. 11, 2873–2911. doi:10.1038/s41467-020-16657-z
Spampinato, L., Calvari, S., Oppenheimer, C., and Boschi, E. (2011). Volcano surveillance using infrared cameras. Earth-Science Rev. 106 (1-2), 63–91. doi:10.1016/j.earscirev.2011.01.003
Sparks, R. S. J. (1976). Grain size variations in ignimbrites and implications for the transport of pyroclastic flows. Sedimentology 23, 147–188. doi:10.1111/j.1365-3091.1976.tb00045.x
Sparks, R. S. J., and Walker, G. P. L. (1977). The significance of vitric-enriched air-fall ashes associated with crystal-enriched ignimbrites. J. Volcanol. Geotherm. Res. 2, 329–341. doi:10.1016/0377-0273(77)90019-1
Stewart, C., Damby, D. E., Tomašek, I., Horwell, C. J., Plumlee, G. S., Armienta, M. A., et al. (2020). Assessment of leachable elements in volcanic ashfall: A review and evaluation of a standardized protocol for ash hazard characterization. J. Volcanol. Geotherm. Res. 392, 106756. doi:10.1016/j.jvolgeores.2019.106756
Stewart, C., Damby, D. E., Horwell, C. J., Elias, T., Ilyinskaya, E., Tomašek, I., et al. (2022). Volcanic air pollution and human health: recent advances and future directions. Bull. Volcanol. 84, 11. doi:10.1007/s00445-021-01513-9
Stroberg, T. W., Manga, M., and Dufek, J. (2010). Heat transfer coefficients of natural volcanic clasts. J. Volcanol. Geotherm. Res. 194, 214–219. doi:10.1016/j.jvolgeores.2010.05.007
Sulpizio, R., Mele, D., Dellino, P., and La Volpe, L. (2007). Deposits and physical properties of pyroclastic density currents during complex subplinian eruptions: the ad 472 (pollena) eruption of somma-vesuvius, italy. Italy. Sedimentol. 54, 607–635. doi:10.1111/j.1365-3091.2006.00852.x
Sulpizio, R., Bonasia, R., Dellino, P., Mele, D., Di Vito, M. A., and La Volpe, L. (2010). The pomici di Avellino eruption of somma--vesuvius (3.9 ka BP). Part II: sedimentology and physical volcanology of pyroclastic density current deposits. Bull. Volcanol. 72, 559–577. doi:10.1007/s00445-009-0340-4
Sulpizio, R., Dellino, P., Doronzo, D. M., and Sarocchi, D. (2014). Pyroclastic density currents: state of the art and perspectives. J. Volcanol. Geotherm. Res. 283, 36–65. doi:10.1016/j.jvolgeores.2014.06.014
Sulpizio, R., Castioni, D., Rodriguez-Sedano, L. A., Sarocchi, D., and Lucchi, F. (2016). The influence of slope-angle ratio on the dynamics of granular flows: insights from laboratory experiments. Bull. Volcanol. 78, 77–11. doi:10.1007/s00445-016-1069-5
Tait, S., Thomas, R., Gardner, J., and Jaupart, C. (1998). Constraints on cooling rates and permeabilities of pumice in an explosive eruption jet from colour and magnetic mineralogy. J. Volcanol. Geotherm. Res. 86 (1-4), 79–91. doi:10.1016/S0377-0273(98)00075-4
Thivet, S., Gurioli, L., Di Muro, A., Eychenne, J., Besson, P., and Nedelec, J. M. (2020). Variability of ash deposits at piton de la Fournaise (La reunion island): insights into fragmentation processes at basaltic shield volcanoes. Bull. Volcanol. 82, 63–20. doi:10.1007/s00445-020-01398-0
Tomašek, I., Damby, D. E., Horwell, C. J., Ayris, P. M., Delmelle, P., Ottley, C. J., et al. (2019). Assessment of the potential for in-plume sulphur dioxide gas-ash interactions to influence the respiratory toxicity of volcanic ash. Environ. Res. 179, 108798. doi:10.1016/j.envres.2019.108798
Trolese, M., Giordano, G., Komorowski, J-C., Jenkins, S., Baxter, P., Cholik, N., et al. (2018). Very rapid cooling of the energetic pyroclastic density currents associated with the 5 November 2010 Merapi eruption (Indonesia). J. Volcanol. Geotherm. Res. 358, 1–12. doi:10.1016/j.jvolgeores.2018.06.004
Valentine, G. A. (1987). Stratified flow in pyroclastic surges. Bull. Volcanol. 49, 616–630. doi:10.1007/bf01079967
Varga, G., and Roettig, C-B. (2018). Identification of saharan dust particles in pleistocene dune sand-paleosol sequences of fuerteventura (canary islands). Hung. Geogr. Bull. 67, 121–141. doi:10.15201/hungeobull.67.2.2
Voege, M., Hort, M., and Seyfried, R. (2005). Monitoring volcano eruptions and lava domes with Doppler radar. Eos, Trans. Am. Geophys Union 86, 537–541. doi:10.1029/2005EO510001
Vriend, N. M., McElwaine, J. N., Sovilla, B., Keylock, C. J., Ash, M., and Brennan, P. V. (2013). High-resolution radar measurements of snow avalanches. Geophys Res. Lett. 40, 727–731. doi:10.1002/grl.50134
Walker, G. P. L. (1971). Grain-size characteristics of pyroclastic deposits. J. Geol. 79, 696–714. doi:10.1086/627699
Walker, G. P. L. (1972). Crystal concentration in ignimbrites. Contrib Mineral Pet. 36, 135–146. doi:10.1007/BF00371184
Walker, G. P. L. (1984). Characteristics of dune-bedded pyroclastic surge bedsets. J. Volcanol. Geotherm. Res. 20, 281–296. doi:10.1016/0377-0273(84)90044-1
Wallace, K. L., Bursik, M. I., Kuehn, S., Kurbatov, A. V., Abbott, P., Bonadonna, C., et al. (2022). Community established best practice recommendations for tephra studies—From collection through analysis. Sci. data 9, 447. doi:10.1038/s41597-022-01515-y
Weit, A., Roche, O., Dubois, T., and Manga, M. (2018). Experimental measurement of the solid particle concentration in geophysical turbulent gas-particle mixtures. J. Geophys. Res. Solid Earth 123 (5), 3747–3761. doi:10.1029/2018JB015530
Wilson, L., and Huang, T. C. (1979). The influence of shape on the atmospheric settling velocity of volcanic ash particles. Earth Planet Sci. Lett. 44, 311–324. doi:10.1016/0012-821X(79)90179-1
Zanella, E., Sulpizio, R., Gurioli, L., and Lanza, R. (2015). Temperatures of the pyroclastic density currents deposits emplaced in the last 22 kyr at Somma--Vesuvius (Italy). Geol. Soc. Lond. Spec. Publ. 396, 13–33. doi:10.1144/SP396.4
Keywords: granular flow, co-ignimbrite, ash, pyroclastic rocks, ignimbrite, pyroclastic flow, volcanic hazard and risk, surge
Citation: Jones TJ, Beckett F, Bernard B, Breard ECP, Dioguardi F, Dufek J, Engwell S and Eychenne J (2023) Physical properties of pyroclastic density currents: relevance, challenges and future directions. Front. Earth Sci. 11:1218645. doi: 10.3389/feart.2023.1218645
Received: 07 May 2023; Accepted: 31 August 2023;
Published: 11 October 2023.
Edited by:
Nick Varley, University of Colima, MexicoReviewed by:
Karoly Nemeth, Institute of Earth Physics and Space Sciences, HungaryCopyright © 2023 Jones, Beckett, Bernard, Breard, Dioguardi, Dufek, Engwell and Eychenne. This is an open-access article distributed under the terms of the Creative Commons Attribution License (CC BY). The use, distribution or reproduction in other forums is permitted, provided the original author(s) and the copyright owner(s) are credited and that the original publication in this journal is cited, in accordance with accepted academic practice. No use, distribution or reproduction is permitted which does not comply with these terms.
*Correspondence: Thomas J. Jones, dGhvbWFzLmpvbmVzQGxhbmNhc3Rlci5hYy51aw==
†These authors have contributed equally to this work
Disclaimer: All claims expressed in this article are solely those of the authors and do not necessarily represent those of their affiliated organizations, or those of the publisher, the editors and the reviewers. Any product that may be evaluated in this article or claim that may be made by its manufacturer is not guaranteed or endorsed by the publisher.
Research integrity at Frontiers
Learn more about the work of our research integrity team to safeguard the quality of each article we publish.