 Hangtao Yu1,2,3,4
 Haopeng Chen2*
 Chuang Xu2,5*
 Jinbo Li2
 Yi Chai1,3,4
 Guangyu Jian2
 Hui Zhang1,3,4
 Ming Xu1,3,4
 Qiang Zhao1,3,4
 Jun Tu1,3,4
- 1Guangzhou Marine Geological Survey, China Geological Survey, Guangzhou, China
- 2Department of Geodesy and Geomatics Engineering, School of Civil and Transportation Engineering, Guangdong University of Technology, Guangzhou, China
- 3Key Laboratory of Marine Mineral Resources, Ministry of Natural Resources, Guangzhou Marine Geological Survey, China Geological Survey, Guangzhou, China
- 4National Engineering Research Center for Gas Hydrate Exploration and Development, Guangzhou, China
- 5Cross Research Institute of Ocean Engineering Safety and Sustainable Development, Guangdong University of Technology, Guangzhou, China
The Tibetan Plateau is a region where the Indian and Asian-European plates collide. A high-precision Moho topography model is important for the study of plate motion and internal tectonics of the Tibetan Plateau. However, previous gravity-based models failed in representing adequately the Moho topography because crustal effects and biases in the inversion parameters were not fully considered. To address these issues, we extracted the gravity effect caused by the crust using wavelet multi-scale analysis, and used an adaptive linear inversion method with available gravity and seismic data to estimate more accurate inversion parameters. With these two improvements, we inverted for a high-precision Moho topography model of the Tibetan Plateau. The results show that the majority of the Tibetan Plateau has a Moho depth of 60–70 km. The Moho depth in the center of the Qaidam Basin is about 50 km, and the Moho topography between the east and west of the basin has obvious undulations. The Moho depth of the Tarim Basin ranges from 38–50 km. While the undulation of Moho is limited in the center of the basin, obvious uplifts are shown in northern and southern basin. The plate driving force between the Tibetan Plateau and the Tarim Basin may be the primary cause of this phenomenon. By comparing the difference with the seismic data, we found that the RMS of our model is 2.8 km smaller than that of the CRUST 1.0 model, which shows that our model is more accurate.
1 Introduction
The Tibetan Plateau (TP) is the highest and largest plateau on the Earth, and most area of the plateau has height larger than 4 km (Figure 1). Due to the collision between the Eurasian and Indian plates, the TP has undergone complex tectonic evolution for 50 million years, and is an ideal region to study plate tectonics, continental collision, and orogeny (Molnar and Tapponnier, 1975; Tapponnier et al., 1982; Royden et al., 2008; Gao et al., 2013; Xu et al., 2017; Xu et al., 2020). The geometry and trend of the Moho discontinuity provide crucial insights for understanding these internal tectonic phenomena (Gao et al., 2013; Xu et al., 2017; Wan et al., 2019).
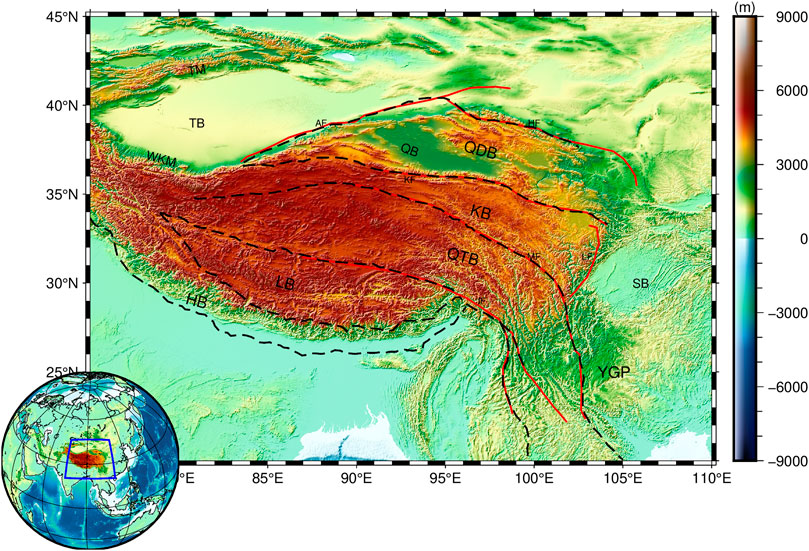
FIGURE 1. The topography and primary tectonic elements of TP (modified from Xu et al., 2017). The red solid lines represent the faults, the black dashed lines are the boundaries of the tectonic blocks. There are several tectonic blocks distributed on the TP from north to south, namely the Qaidam Block (QDB), Kunlun Block (KB), Qiangtang Block (QTB), Lhasa Block (LB), and Himalayan Block (HB). There are also several fault zones in the region, including the Jiali Fault (JF), Manyi-Yushu-Xianshuihe Fault (MF), Kunlun Fault (KF), Haiyuan Fault (HF), Altyn Tagh Fault (AF), Longmenshan Fault (LF). In addition, there are Tarim Basin (TB), Qaidam Basin (QB), Sichuan Basin (SB), Yunnan-Guizhou Plateau (YGP), Tianshan Mountains (TM), Western Kunlun Mountains (WKM) and other formations in the region.
Currently, two primary methods are used to study the Moho topography of the TP: seismic methods and gravity methods. Seismic methods, such as seismic reflection and refraction analysis, have yielded many results (Kao et al., 2001; Kind et al., 2002; Zhang and Klemperer, 2005; Zhao et al., 2006; Zhang et al., 2007; Yang et al., 2011; Obrebski et al., 2012; Tian et al., 2014; Koulakov et al., 2015). However, due to the sparse distribution of seismic stations, the Moho topography obtained by seismic methods can only be locally accurate. In comparison, gravity methods can achieve high resolution models over large scales. Several scholars used gravity methods to study the Moho topography of the TP (Hao et al., 2014; Chen and Tenzer, 2017; Xu et al., 2017; Wan et al., 2019; Xuan and Jin, 2022). Hao et al. (2014) calculated the crustal thickness of the TP based on the EGM2008 and CRUST 2.0 models, and found that the crustal thickness of the TP ranges from 50 to 75 km. Chen and Tenzer (2017) proposed a spatial domain Moho modeling method to calculate the Moho topography of the TP with constant and variable densities. Wan et al. (2019) proposed an inversion algorithm based on orbital gravity gradient data to calculate the Moho topography of the TP, concluding that its deepest Moho discontinuity is close to 70 km. Xuan and Jin (2022) obtained the Moho topography of the TP based on separated regional and local gravity anomalies, showing that the Moho depths in the central and western parts of the TP exhibit a clear north-to-south variation. Although the gravity method has produced significant results, there are certain limitations in the precision of inversion results. This is due to the fact that the signals do not take into account the crust influences, and the inversion parameters (mean Moho depth and crust-mantle density contrast) are imprecise. Therefore, there is an urgent need for a new method to determine inversion parameters to obtain a more accurate Moho topography model of the TP.
Wavelet multi-scale analysis has been proved to be one effective method to separate material signals at different field source depths (Xu et al., 2017). Therefore, we used wavelet multi-scale analysis to separate the gravity signals from the different layers within the TP, and then we subtracted the signals brought by the crust. In addition, Li et al. (2022) presented a novel gravity inversion method for determining Moho topography. This method is grounded on the linear correlation between the depth of Moho discontinuity at established control points and corresponding gravity observations. By leveraging this relationship, a more accurate estimation of the density contrast of the Moho topography is achieved, thereby significantly enhancing the reliability of Moho topography inversion result. Combining gravity and seismic data, we adopted the adaptive linear inversion method proposed by Li et al. (2022) to determine the inversion parameters and invert for the Moho topography model of the TP. We verified the correctness of the model by comparing it with the results of the previous studies. Finally, the tectonic features of the Moho topography in this region was further revealed, which could provide possible clues for plate motions, tectonic evolution and other related studies.
2 Data
The study area of this paper is the TP (latitude and longitude range from 20°N to 45°N, 75°E to 110°E), which is located at the junction of the Eurasian plate and the Indian plate. The collisions of the two plates have formed complex tectonic features in TP (Figure 1).
In this paper, three main open data sets are used: free-air gravity anomalies, topography, and sediment thickness. The free-air gravity anomaly data is from the XGM 2019e_2159 model published by Zingerle et al. (2020) with a spatial resolution of 5′×5′. The topographic data is from the Earth2014 model published by Hirt and Rexer (2015) with a spatial resolution of 1′× 1′(Figure 1). The sediment layer thickness is from the CRUST 1.0 model published by Laske et al. (2013) with a spatial resolution of 1°× 1°, which will be used for the sediment layer correction in the following.
Utilizing the XGM 2019e_2159 gravity field model as a foundation, we derived the free-air gravity anomalies of TP with a solution height set at 10 km (Figure 2A). Notably, the free-air gravity anomalies ranges from −116 to 121 mGal, and high gravity anomalies predominantly concentrated in the southwestern TP. To further analyze the impact of topography, we employed the Earth2014 model to determine the corresponding gravitational effect resulting from the topographic distribution (Figure 2D). By subtracting the topographic gravity effect from the free-air gravity anomalies, we obtained the Bouguer gravity anomalies of the TP (Figure 3).
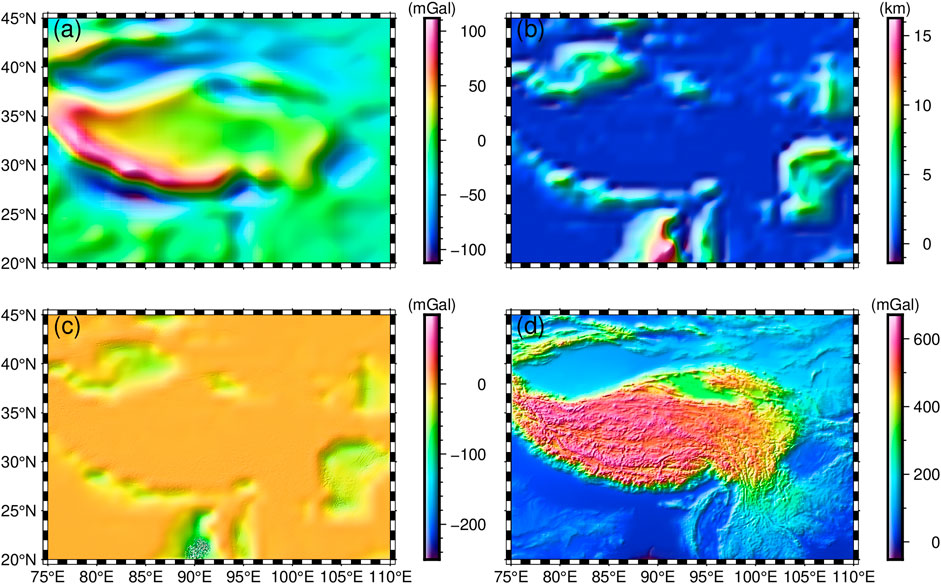
FIGURE 2. (A) Free air gravity anomalies of the TP. (B) Sediment layer thickness. (C) Gravity effect corresponding to the sediment layer thickness. (D) Gravity effect corresponding to the topography.
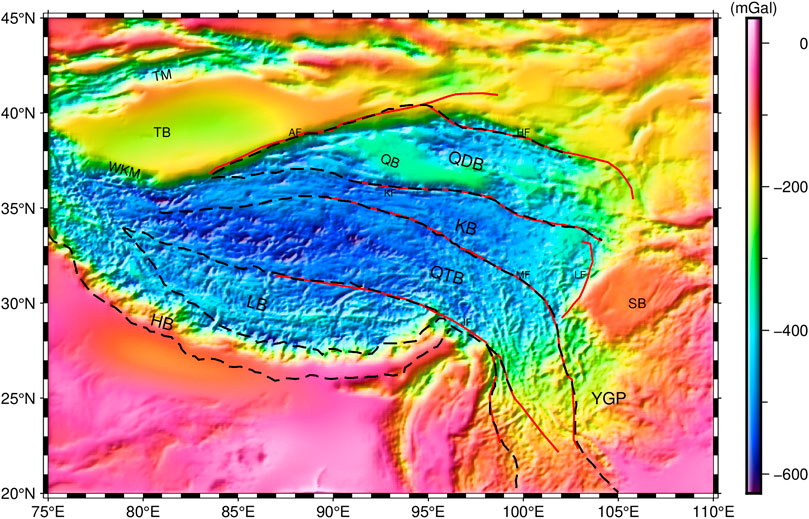
FIGURE 3. Bouguer gravity anomalies of the TP.
The Bouguer gravity anomalies in the study area have significant lateral variations, ranging from −615 to 15 mGal (Figure 3). The TP generally exhibits a negative gravity anomaly distribution with values ranging from −615 to −400 mGal in the majority of the region, while the gravity anomaly values in QDB range from −500 to −300 mGal. The KB and LB exhibit gravity anomalies ranging from −500 to −400 mGal in most regions, and the regions with lowest gravity anomalies are mainly located in the QTB. The Bouguer gravity anomalies in the HB exhibit significant variation, ranging from −400 to 0 mGal, and gradually increase from north to south. Apart from the TP, the Bouguer gravity anomalies in the TB and SB exhibit a more uniform distribution, with values ranging from around −200 mGal in the TB to around −100 mGal in the SB. It is apparent that the Bouguer gravity anomalies distribution in the TP exhibit a clear negative correlation with the topography, demonstrating a generalized low gravity anomaly phenomenon. The QTB has the lowest gravity anomaly, while the HB has the highest gravity anomaly.
Upon obtaining the Bouguer gravity anomalies of the TP (Figure 3), it is imperative to account for the influence excerted by the sedimentary layers and subsequently deduct them from the Bouguer gravity anomalies. Figure 2B reveals the sedimentary layer thickness distribution within the TP, which was derived from the CRUST1.0 model. Adopting the forward method proposed by Parker (1973) and Wu (2016), we calculated the gravity effect exerted by these sedimentary layers (Figure 2C). After subtracting this gravity effect, we are able to obtain the sediment-free gravity anomaly, which is the basis for the wavelet multi-scale analysis later on and the signal source for the Moho topographic inversion.
3 Methodology
The inversion flow diagram is illustrated in Figure 4, comprising two main parts. One is the wavelet multi-scale analysis, which is used to extract the gravitational signals necessary for inverting the Moho topography. The other is the adaptive linear inversion, which is used to estimate the optimal parameters and iteratively invert for the Moho topography of the TP.
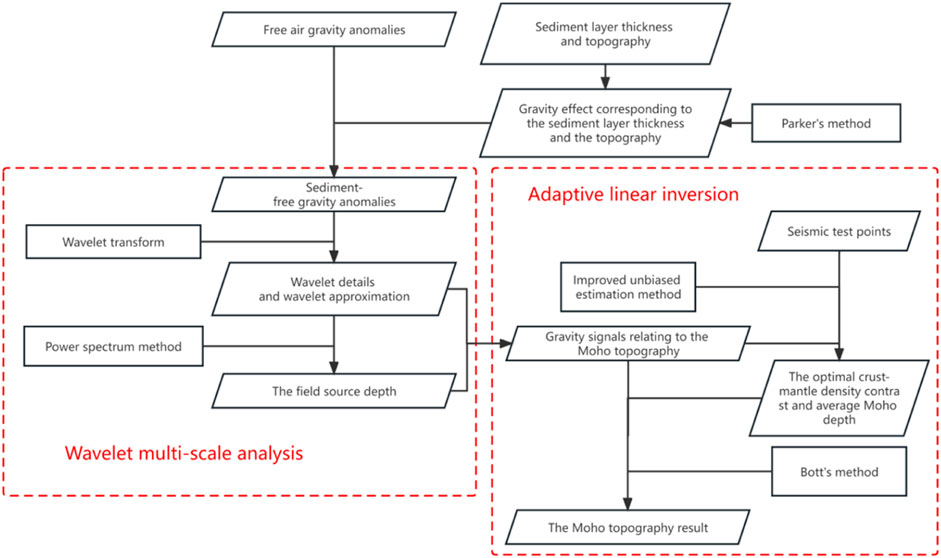
FIGURE 4. Inversion flow.
3.1 Wavelet multi-scale analysis
Wavelet multi-scale analysis has two steps. Step1: The gravity anomaly is a comprehensive signal of all the materials in the TP. In order to more accurately invert the Moho topography of the TP, we need to separate the gravity anomalies and deduct the gravity effects from the crust. Mallat (1989) proposed the theory of wavelet transform for separating the signals in different frequency bands. Therefore, we use wavelet multi-scale analysis to separate the gravity anomaly signal of the TP and obtain wavelet details (high-frequency signal)
where
Step 2: The prerequisite for extracting the gravity signals relating to the Moho topography is to determine the stratigraphy corresponding to different orders of wavelet detail signals, which requires knowing the depth of different signals. Therefore, we estimate the field source depth
where
3.2 Adaptive linear inversion
Adaptive linear inversion also has two steps. Step1: After obtaining the gravity signals relating to the Moho topography, we need to determine the inversion parameters, i.e., the average Moho depth and the crust-mantle density contrast. Previously, regarding the selection of these parameters, most scholars did not consider constraining them with seismic data, or used seismic data constraints but did not consider the existence of systematic bias, which has a more obvious impact on the accuracy of Moho topography inversion results (Xu et al., 2017; Xuan and Jin, 2022). Therefore, based on the existing seismic control points (Test points in Figure 7), we adopt the improved unbiased estimation method proposed by Li et al. (2022) to compute a more accurate average Moho depth and crust-mantle density contrast. Firstly, we introduce systematic deviations
where
where
Step 2: After determining the average Moho depth and the crust-mantle density contrast, we use the iterative method proposed by Bott (1960) to invert for the Moho topography of the TP. Its initial model is shown in Eq. 6:
where
Where
Where
In summary, the method consists two steps. The first step is to estimate the optimal crust-mantle density contrast and average Moho depth based on the linear relationship between seismic points and gravity observations. The second step is to modify the Moho model by several iterations to reduce the discrepancy between its forward gravity effect and the gravity observations. Until the RMS of the discrepancy is less than a threshold, the iterations are stopped and the Moho topography model is obtained.
4 Results
4.1 Gravity anomalies from the Moho topography
In order to derive precise inversion parameters for Moho topography, it is essential to extract the gravity anomaly signal originating from the Moho discontinuity. Based on the sediment-free gravity anomalies, we use Eq. 1 to extract wavelet details of different orders (the wavelet base used is “coif3”). The resulting wavelet details are illustrated in Figure 5. By employing Eq. 2, mean field depths were estimated and are presented in Table 1.
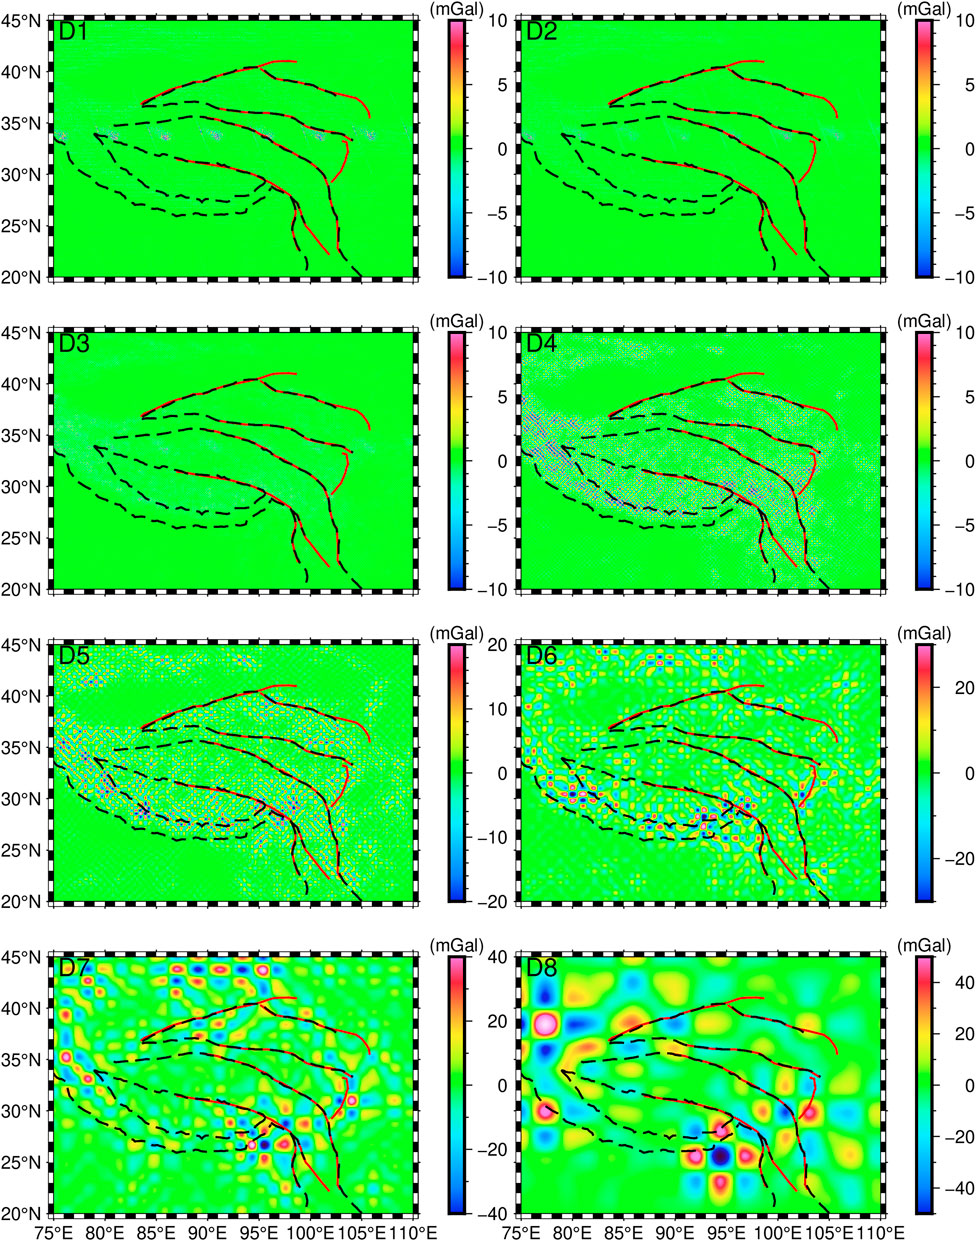
FIGURE 5. Decomposed gravity anomalies D1–D8 in TP.

TABLE 1. The average field source depth corresponding to different orders of gravity signals.
Comparisons between Figure 5 and Table 1 indicate that at D7, the mean field source depth is determined to be 82.14 km, with corresponding gravity anomaly values ranging from −40 to 40 mGal. The observed strong gravity anomalies are likely originating from materials close to the Moho discontinuity. In addition, D6 corresponds to a depth of 52.02 km, which is similar to the average Moho depth of the TP derived by previous studies. Therefore, we consider D1 to D6 as gravity signals brought by the crust. After deducting D1∼D6, the remaining 6th-order wavelet approximation A6 is the gravity signal corresponding to the Moho topography of the TP, as shown in Figure 6.
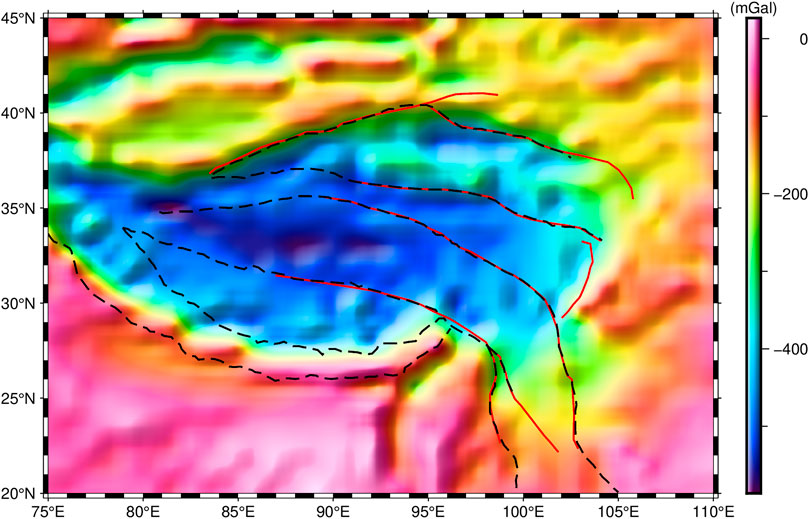
FIGURE 6. The 6th-order wavelet approximation A6 of the sediment-free gravity anomalies.
4.2 Moho topography inversion parameters
Initially, a group of seismic control points were selected based on previous studies (Wang et al., 2008a; Wang et al., 2008b; Zhang et al., 2009; Hazarika et al., 2013; Liu et al., 2014; Saikia et al., 2016; Murodov et al., 2018; Mandal et al., 2021). The spatial distribution of these points and their corresponding Moho depths are illustrated in Figure 7. These control points are categorized into two groups: test points and validation points. The test points are utilized for the calculation of hyperparameters, i.e., the average Moho depth and the crust-mantle density contrast. The validation points are used to compare the inverted Moho model with the CRUST 1.0 model. It shows that the seismic control points are densely concentrated in the central, western, eastern, and southern regions of the TP. However, there is few seismic control points in the northern region. Despite the limited coverage of seismic control points across the TP, their absence in the northern region has minimal influence on the computation of hyperparameters.
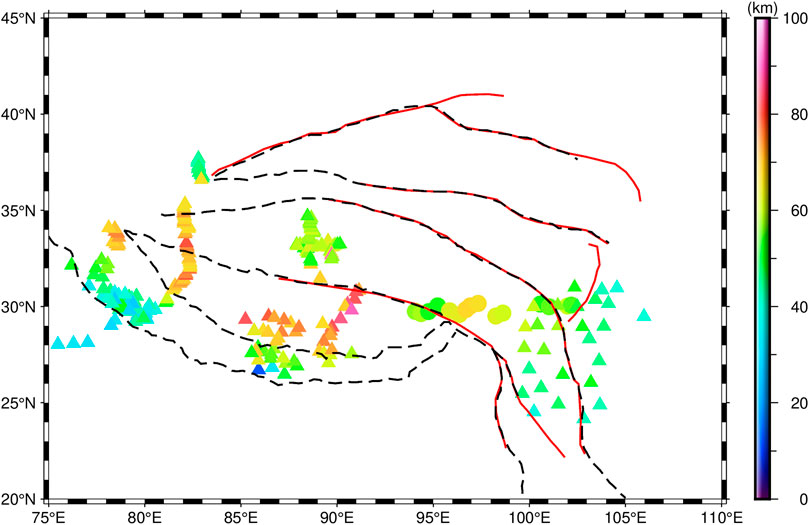
FIGURE 7. Distribution of seismic control points. Triangles are test points for calculating hyperparameters, circles are validation points for verifying the inversion results. The color bar shows the Moho depth.
To extract the gravity anomalies at the control points, we conduct a matching process between the latitude and longitude coordinates of the control points and their corresponding locations indicated in Figure 6. Subsequently, Eq. 3 is applied to establish the linear relationship between the depths of the control points and the associated gravity anomalies. This analysis yields an average Moho depth of 47.7604 km, as shown in Figure 8A. Additionally, Figure 8B is obtained by utilizing Eq. 4, which led to a calculated crust-mantle density contrast of 0.5038 g/cm³.
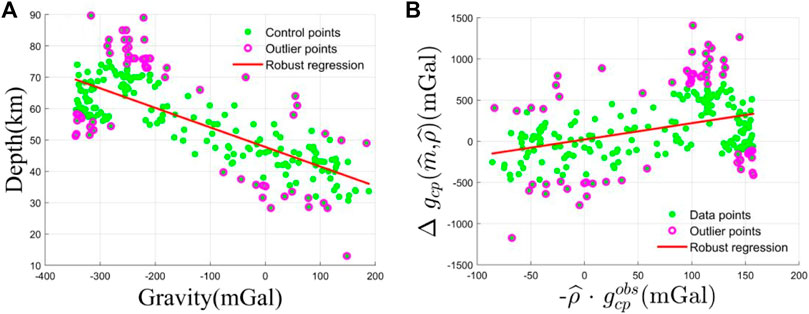
FIGURE 8. Hyperparameters estimation with seismic data. (A) Moho depth-observed gravity relation. (B) Accurate estimation of Moho density contrast by robust regression.
4.3 Moho topography in the TP
Under the constraint of seismic control points, we calculate the hyperparameters more accurately. Specifically, the calculated average Moho depth and crust-mantle density contrast are 47.7604 km and 0.5038 g/cm3, respectively. Using the iterative inversion of Eqs 6, 7, the Moho topography of the TP was then calculated, as illustrated in Figure 9.
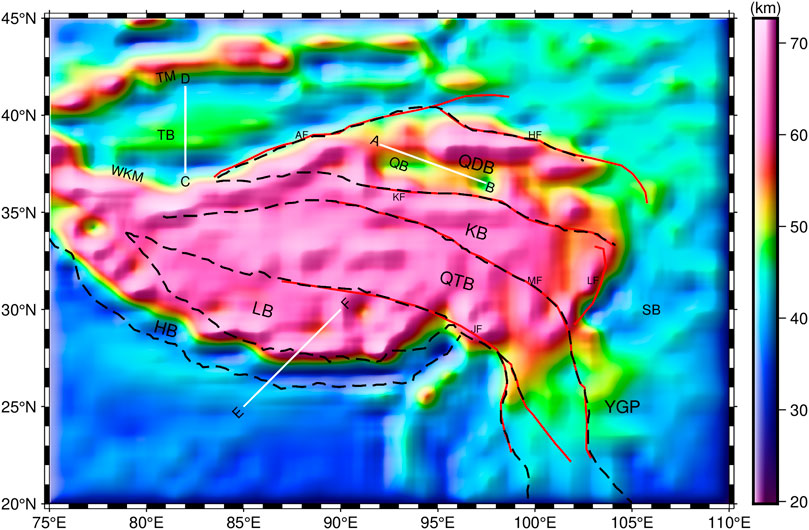
FIGURE 9. Moho topography of the TP.
In order to visualize the variation of Moho discontinuity and topography, three different profiles (A-B, C-D and E-F) are chosen in QB, TB and the southern region of the TP, respectively. The coordinates of points A, B, C, D, E and F are (38.5°N, 92°E), (36.5°N, 97.5°E), (37°N, 82°E), (41.5°N, 82°E), (25°N, 85°E) and (30°N, 90°E), respectively. The corresponding Moho discontinuity and topography for the three profiles are shown in Figure 10. Our model is compatible with CRUST1.0, but is able to resolve finer structures. Furthermore, the Moho depth of our model correlates well with the topography (Figure 10C). For the profile EF, the correlation coefficient between the Moho depth of our model and the topography is 0.955. In comparison, the correlation coefficient between the Moho depth of CRUST1.0 model and the topography is 0.832.
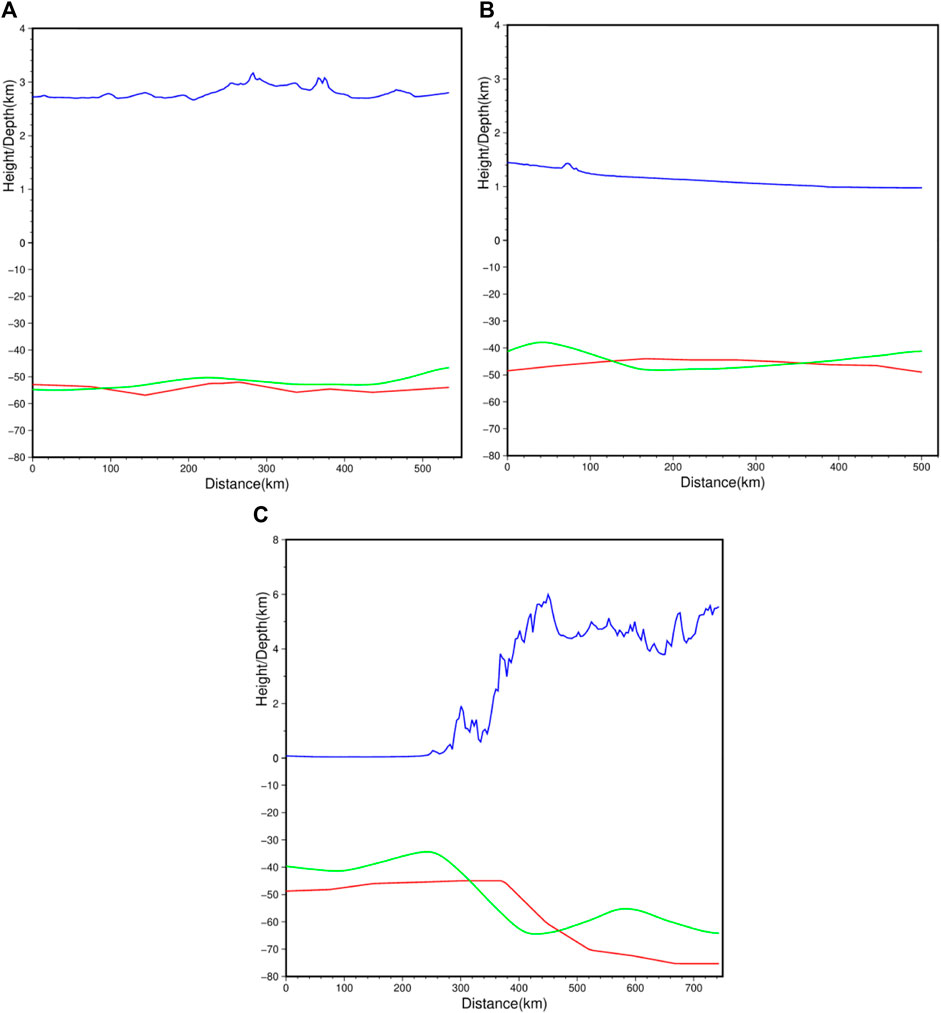
FIGURE 10. Moho topography of profiles AB (A), CD (B) and EF (C). The horizontal axis denotes the distance, while the vertical axis represents the height/depth. In each figure, the green line is the Moho topography of our model, the red line is the Moho topography of the CRUST1.0 model, and the blue line is the topography.
The study area exhibits varying Moho depths, ranging from 19.8 to 72.7 km, with an average depth of 47.4 km. Specifically, LB, QTB, and KB regions typically demonstrate Moho depths within the range of 60–70 km, while QDB displays a broader range from 45 to 70 km, with depths near the center of QB reaching 50 km. In Figure 10A, the Moho topography of profile A-B is depicted, revealing depth values ranging from −55 to −46.6 km, which aligns with the findings reported by Teng et al. (1995). Notably, the central region of QB exhibits an elevated Moho topography compared to its surroundings. In contrast, TB is observed as independent of the TP, as indicated by Burchfiel et al. (1989). Figure 9 illustrates that the TB has Moho depths ranging from 38 to 50 km, with minimal Moho deformation within the basin and overall insignificant undulations. These characteristics can be attributed to TB’s low-temperature thermal structure and greater lithospheric strength, as suggested by Wang (2001) and Sun et al. (2013). The Moho topography of profile C-D exhibits depths ranging from −48.3 to −38 km. The central region of TB shows Moho depth at approximately −47 km, while the margins of the TB display depths at around −40 km. Notably, the Moho on both the north and south sides of TB has experienced uplift compared to the center. Apart from WKM and TM in the north, the HB region is greatly influenced by plate compression (Aitchison et al., 2007). Figure 9 shows that the Moho depths in the HB ranging from 30 to 70 km, exhibiting more intense Moho relief. Moreover, the mantle in the southwestern part of the HB is uplifted to an average depth of about 35 km. The Moho topography of profile E-F shows depth values ranging from −64.5 to −34.4 km.
In this study, the CRUST 1.0 model is utilized as a primary Moho topography model. The study area exhibits Moho depths ranging from 26.5 km to 80.0 km, with an average depth of 49.8 km. Notably, the Moho discontinuity in central TP is deeper than that in surrounding areas. Specifically, LB, QTB, and KB demonstrate Moho depths at approximately 75 km, while QDB exhibits an elevated depth of around 55 km. It is important to highlight that the CRUST 1.0 model inadequately determines the position of the undulating boundary due to its limited spatial resolution. This limitation is also evident in the WKM, TM, AF, HF, and LF regions. Furthermore, it illustrates that the Moho topographic uplift observed in TB and QB is not adequately represented in the CRUST 1.0 model.
To validate the accuracy of the Moho topography model, we compare our model, the CRUST 1.0 model (Figure 11A) and Xu et al.'s model (Figure 11B) with the seismic validation points, as shown in Table 2. The maximum and minimum differences between the CRUST 1.0 model and the validation points (C-V) are 2.3 and −12.8 km, respectively. The maximum and minimum differences between Xu et al.'s model and the validation points (X-V) are 2.0 and −13.6 km, respectively. Meanwhile, the maximum and minimum differences between the Moho topography model in this study and the validation points (T-V) are 4.8 and −4.4 km, respectively. These results demonstrate that our Moho topography model closely aligns with the validation points. Furthermore, the root mean square (RMS) values of the C-V, X-V and T-V are 5.8 km, 6.4 km and 3.0 km, respectively. The nearly twofold difference between these two RMS values further confirms that our Moho topography model is more accurate than the CRUST 1.0 model.
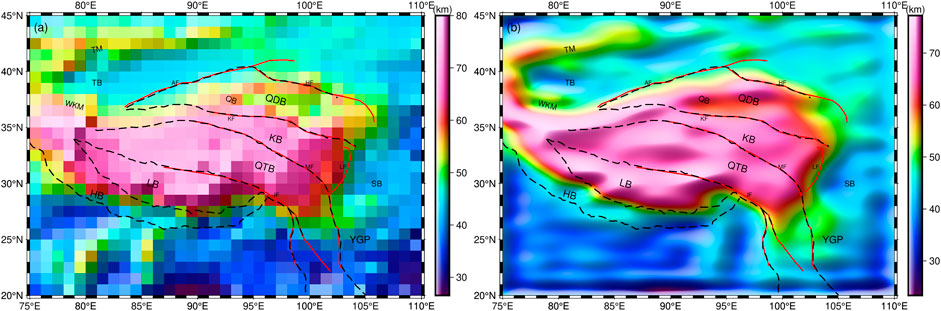
FIGURE 11. Moho topography of CRUST1.0 model (A) and Xu et al. (2017) (B).
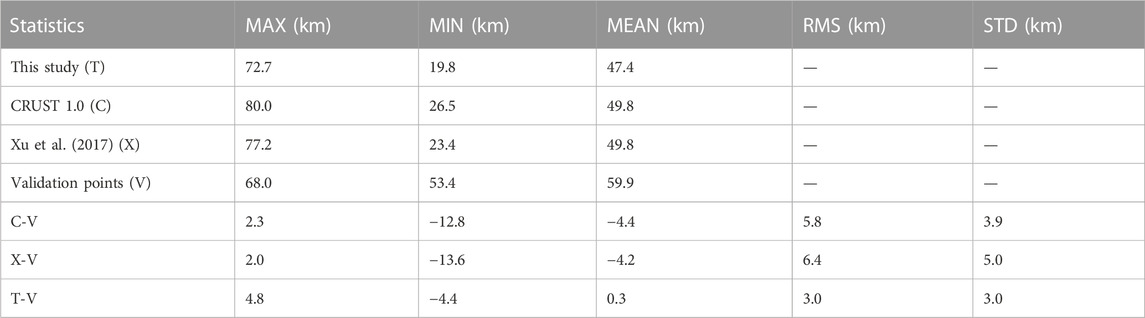
TABLE 2. Statistics of the Moho depth differences between this study and CRUST1.0 (unit: km). MAX, MIN, MEAN, STD, and RMS are the maximum, minimum, average, standard deviation and root mean square, respectively.
5 Discussions
The internal structure of the QB needs to be discussed. Yang et al. (2021) proposed a distinct Conrad and Moho discontinuity between the eastern and western parts of QB, which is corroborated by Figure 9 and Figure 10A. Notably, there is visible Moho undulation between the southern sections of QB and KB. We suggest that this phenomenon is primarily attributed to the lateral heterogeneity of crustal strength in the region, leading to differential crustal deformation in QB and KB, as supported by the findings of Zhu and Helmberger (1998). Additionally, the Moho undulation in the southern part of QB is significantly influenced by the down-plunging of the mantle lithosphere, as suggested by Meyer et al. (1998), Zhou et al. (2006), and Yin et al. (2008). Pei et al. (2022) further highlight significant distinctions in the internal tectonics and physical properties between QB and TB. Specifically, the crust of QB exhibits lower plasticity in terms of strength and deformation, which extends from the basin perimeter to the center, as depicted in Figure 9.
Regarding the junction between the southern side of TB and the northern part of TP (WKM and AF lineaments), Levin et al. (2013) proposed the existence of prominent upper-mantle anisotropy features at this location, with similar deformation directions observed within the upper mantle of the southern side of TB and the northern part of TP. Pusok and Kaus (2015) suggested that some of the plate driving forces generate gravitational potential, leading to the formation of the northern and southern ranges in TP and causing the upward uplift of the mantle, as also depicted in Figure 10B. Therefore, we conclude that the plate driving forces between the TP and TB result in the mantle uplift in the southern part of TB. However, due to the high structural hardness of the TB block, this plate driving force cannot sustain the continued uplift of the mantle in this region, leading to an east-west extensional deformation force. Furthermore, Figure 9 and Figure 10B show that the Moho depth in the northern part of TB is approximately 41 km, while the Moho depth of the TM is around 60 km. Junmeng et al. (2003) suggested that the rapid uplift of TM is primarily caused by the northward subduction of the upper mantle of TB, which is highly consistent with the findings presented in Figure 9. Thus, it is evident that TB’s northward movement under the compression from the Indian plate, subducting near the TM, plays a significant role in the thickening of the TM’s crust.
Previous studies (Li et al., 2014; He et al., 2018; Mandal et al., 2021) provided evidence for the subduction of the Indian plate beneath the Eurasian plate, as indicated by the steep decrease in Moho topography within the range of 250–420 km from point E in Figure 10C. Furthermore, Figure 10C illustrates significant mantle uplift near HB and LB, located at distances of 250 km and 570 km from point E, respectively. The extent of uplift is more extensive in the LB with a covering distance of approximately 350 km, while it spans approximately 180 km in the HB. This nearly symmetrical phenomenon is suggested to be a result of the relative forces generated by the compression between the Indian and Eurasian plates, with variations in their impact due to differences in tectonic strength and other factors. Figure 10C also shows that the uplift of the mantle correlates well with the uplift of the topography from point E to F, as well as near TM, WKM, and AF. It is speculated that the interplate forces alone are insufficient to sustain continuous mantle uplift, and a portion of these forces is dispersed, resulting in the uplift of the topography.
Furthermore, it is evident that HB and QDB exhibit significant Moho undulations, indicating their ongoing tectonic activity under the influence of plate motion. In contrast, the topography of Moho in LB, QTB and KB is not very undulating, and the influence of plate movement is not obvious. Due to the relatively weak lithospheric strength of QDB, it is speculated that KF is still moving northward. Additionally, AF may undergo lateral extension in the future due to the insufficient driving force and blockage of TB. Tian et al. (2021) argued that the crust of the Longxi Basin is hard and the expansion of the TP to the northeast is unlikely, which coincides with our Moho topography, and therefore the deformation of the HF is not drastic. The MF and JF have the Moho depth of 60 km, and we suggest that both the thickening of Moho topography and the presence of the MF and JF are formed by the decoupling of the upper crust from the lower and middle crust in the central and southern TP, which is similar to the view of Xue et al. (2021). Tapponnier et al. (2001) proposed that the interaction of faults and oblique tectonics is responsible for the unique Moho topography of the TP. Comparing the Moho topography, we categorize the faults into three kinds. The first type of faults, such as MF and JF, whose action does not result in significant undulation of the Moho topography on either side. The crust on both sides of this type of faults is of comparable hardness and more stable tectonics. The second type of faults, such as AF, HF, and LF, whose action results in a distinctly undulating Moho topography on both sides. In this case, the crust on the thin side is harder, and the extrusion of the soft crust side into the hard crust side results in this type of faults extending sideways instead of vertically. The third type of fault, such as KF, whose action causes the Moho topography to undulate on both sides, but the undulation is not significant. In this case, the crust is softer on the thin side and the hard crust side extrudes into the soft crust side, which results in strong deformation of the crust in the vicinity of the fault.
6 Conclusion
In this paper, in order to obtain a more accurate Moho topography model of the TP, we make improvements in two aspects. On the one hand, the gravity effect brought by the crust is considered, and wavelet multi-scale analysis is utilized to eliminate its influence. On the other hand, an adaptive linear inversion method is used to estimate more accurate mean Moho depth and crust-mantle density contrast. On this basis, we invert for the Moho topography model of the TP. The Moho topography results show that the Moho depths in the study area are ranging from 19.8 to 72.7 km. Among them, the Moho depths in the LB, QTB, and KB regions are generally in the range of 60–70 km, while the QDB is ranging from 45 to 70 km, with depths of up to 50 km close to the center of the QB. The Moho depths in the TB are ranging from 38 to 50 km, and those in the HB are ranging from 30 to 70 km. It shows that there are significant disparities in Moho topography distribution between QB and TB. Moreover, there are noticeable discontinuities in the Moho topography between the east and west of QB. There is limited Moho deformation in central TB, while Moho uplift is shown on the north and south sides of TB. Mantle uplift and topographic uplift can be observed near TM, WKM, AF, and HB. It is speculated that the interplate forces are inadequate to sustain the continued mantle uplift, and a portion of the forces transform into east-west extensional deformation, thereby causing the topographic uplift. In addition, our Moho model is more accurate than the CRUST 1.0 model as the RMS of our model is 2.8 km less than that of the CRUST 1.0 model.
Data availability statement
The original contributions presented in the study are included in the article/supplementary material, further inquiries can be directed to the corresponding authors.
Author contributions
Conceptualization, CX; methodology, HY and CX; software, JL and GJ; validation, HY and HC; formal analysis, CX; investigation, YC and MX; data curation, JL and HY; writing—original draft preparation, HY and CX; writing—review and editing, HC and HY; visualization, HZ, QZ and JT; supervision, CX; project administration, CX; funding acquisition, HY. All authors contributed to the article and approved the submitted version.
Funding
This study was supported by the National Natural Science Foundation of China (Grant Nos 42104136, 41974014, 42274004, 41804061), Science and Technology Projects in Guangzhou (Grant No. 202201011216), China Geological Survey (Grant No. DD20191007, DD20230649), and the Natural Science Foundation of Guangdong Province, China (Grant No. 2022A1515010396).
Acknowledgments
We are grateful to Hirt and Rexer (2015), Zingerle et al. (2020) and Laske et al. (2013) for providing data for this experiment, and the figures in this paper were produced using the General Mapping Tool (Wessel et al., 2019).
Conflict of interest
The authors declare that the research was conducted in the absence of any commercial or financial relationships that could be construed as a potential conflict of interest.
Publisher’s note
All claims expressed in this article are solely those of the authors and do not necessarily represent those of their affiliated organizations, or those of the publisher, the editors and the reviewers. Any product that may be evaluated in this article, or claim that may be made by its manufacturer, is not guaranteed or endorsed by the publisher.
References
Aitchison, J. C., Ali, J. R., and Davis, A. M. (2007). When and where did India and Asia collide? J. Geophys. Res. Solid Earth 112 (5). doi:10.1029/2006jb004706
Bott, M. H. P. (1960). The use of rapid digital computing methods for direct gravity interpretation of sedimentary basins. Geophys. J. Int. 3 (1), 63–67. doi:10.1111/j.1365-246X.1960.tb00065.x
Burchfiel, B. C., Quidong, D., Molnar, P., Royden, L., Yipeng, W., Peizhen, Z., et al. (1989). Intracrustal detachment within zones of continental deformation. Geology 17 (8), 748–752. doi:10.1130/0091-7613(1989)017<0448:idwzoc>2.3.co;2
Chen, W., and Tenzer, R. (2017). Moho modeling in spatial domain: a case study under Tibet. Adv. Space Res. 59 (12), 2855–2869. doi:10.1016/j.asr.2017.03.015
Gao, R., Chen, C., Lu, Z., Brown, L. D., Xiong, X., Li, W., et al. (2013). New constraints on crustal structure and Moho topography in Central Tibet revealed by SinoProbe deep seismic reflection profiling. Tectonophysics 606, 160–170. doi:10.1016/j.tecto.2013.08.006
Hao, Z., Zhicai, L., and Bo, Z. (2014). Qinghai-Tibet Plateau crustal thickness derived from EGM2008 and CRSUT2.0. Geodesy Geodyn. 5 (4), 9–15. doi:10.3724/sp.j.1246.2014.04009
Hazarika, D., Kumar, N., and Yadav, D. K. (2013). Crustal thickness and Poisson’s ratio variations across the northwest Himalaya and eastern Ladakh. Acta Geophys. 61, 905–922. doi:10.2478/s11600-013-0128-y
He, P., Lei, J., Yuan, X., Xu, X., Xu, Q., Liu, Z., et al. (2018). Lateral Moho variations and the geometry of the Main Himalayan thrust beneath the Nepal Himalayan orogen revealed by teleseismic receiver functions. Geophys. J. Int. 214 (2), 1004–1017. doi:10.1093/gji/ggy192
Hirt, C., and Rexer, M. (2015). Earth2014: 1 arc-min shape, topography, bedrock and ice-sheet models–Available as gridded data and degree-10,800 spherical harmonics. Int. J. Appl. Earth Observation Geoinformation 39, 103–112. doi:10.1016/j.jag.2015.03.001
Holland, P. W., and Welsch, R. E. (1977). Robust regression using iteratively reweighted least-squares. Commun. Statistics-theory Methods 6 (9), 813–827. doi:10.1080/03610927708827533
Junmeng, Z., Guodong, L., Zaoxun, L., Xiankang, Z., and Guoze, Z. (2003). Lithospheric structure and dynamic processes of the Tianshan orogenic belt and the Junggar basin. Tectonophysics 376 (3-4), 199–239. doi:10.1016/j.tecto.2003.07.001
Kao, H., Gao, R., Rau, R. J., Shi, D., Chen, R. Y., Guan, Y., et al. (2001). Seismic image of the Tarim basin and its collision with Tibet. Geology 29 (7), 575–578. doi:10.1130/0091-7613(2001)029<0575:siottb>2.0.co;2
Kind, R., Yuan, X., Saul, J., Nelson, D., Sobolev, S. V., Mechie, J., et al. (2002). Seismic images of crust and upper mantle beneath Tibet: evidence for Eurasian plate subduction. science 298 (5596), 1219–1221. doi:10.1126/science.1078115
Koulakov, I., Maksotova, G., Mukhopadhyay, S., Raoof, J., Kayal, J. R., Jakovlev, A., et al. (2015). Variations of the crustal thickness in Nepal Himalayas based on tomographic inversion of regional earthquake data. Solid Earth 6 (1), 207–216. doi:10.5194/sed-6-2867-2014
Laske, G., Masters, G., Ma, Z., et al. (2013). Update on CRUST1. 0—a 1-degree global model of Earth’s crust. Vienna, Austria: EGU General Assembly.
Levin, V., Huang, G. D., and Roecker, S. (2013). Crust–mantle coupling at the northern edge of the Tibetan plateau: evidence from focal mechanisms and observations of seismic anisotropy. Tectonophysics 584, 221–229. doi:10.1016/j.tecto.2012.05.013
Li, J., Xu, C., and Chen, H. (2022). An improved method to Moho depth recovery from gravity disturbance and its application in the South China Sea. J. Geophys. Res. Solid Earth 127 (7), e2022JB024536. doi:10.1029/2022JB024536
Li, Y., Gao, M., and Wu, Q. (2014). Crustal thickness map of the Chinese mainland from teleseismic receiver functions. Tectonophysics 611, 51–60. doi:10.1016/j.tecto.2013.11.019
Liu, G. C., Shang, X. F., He, R. Z., et al. (2014). Topography of Moho beneath the central Qiangtang in north tibet and its geodynamic implication. Chin. J. Geophys. 57 (7), 2043–2053. doi:10.6038/cjg20140702
Mallat, S. G. (1989). A theory for multiresolution signal decomposition: the wavelet representation. IEEE Trans. pattern analysis Mach. Intell. 11 (7), 674–693. doi:10.1109/34.192463
Mandal, P., Srinivas, D., Suresh, G., and Srinagesh, D. (2021). Modelling of crustal composition and Moho depths and their implications toward seismogenesis in the kumaon–garhwal himalaya. Sci. Rep. 11 (1), 14067. doi:10.1038/s41598-021-93469-1
Meyer, B., Tapponnier, P., Bourjot, L., Métivier, F., Gaudemer, Y., Peltzer, G., et al. (1998). Crustal thickening in Gansu-Qinghai, lithospheric mantle subduction, and oblique, strike-slip controlled growth of the Tibet plateau. Geophys. J. Int. 135 (1), 1–47. doi:10.1046/j.1365-246X.1998.00567.x
Molnar, P., and Tapponnier, P. (1975). Cenozoic Tectonics of Asia: effects of a Continental Collision: features of recent continental tectonics in Asia can be interpreted as results of the India-Eurasia collision. Science 189 (4201), 419–426. doi:10.1126/science.189.4201.419
Murodov, D., Zhao, J., Xu, Q., Liu, H., and Pei, S. (2018). Complex N–S variations in Moho depth and V p/V s ratio beneath the western Tibetan Plateau as revealed by receiver function analysis. Geophys. J. Int. 214 (2), 895–906. doi:10.1093/gji/ggy170
Obrebski, M., Allen, R. M., Zhang, F., Pan, J., Wu, Q., and Hung, S. (2012). Shear wave tomography of China using joint inversion of body and surface wave constraints. J. Geophys. Res. Solid Earth 117 (1). doi:10.1029/2011JB008349
Parker, R. L. (1973). The rapid calculation of potential anomalies. Geophys. J. Int. 31 (4), 447–455. doi:10.1111/j.1365-246X.1973.tb06513.x
Pei, X., Huangfu, P. P., Li, Z. H., et al. (2022). Why Qaidam Basin is amalgamated into Tibetan plateau but Tarim Basin is not? Chin. J. Geophys. 65 (11), 4259–4272. doi:10.6038/cjg2022P0429
Pusok, A. E., and Kaus, B. J. P. (2015). Development of topography in 3-D continental-collision models. Geochem. Geophys. Geosystems 16 (5), 1378–1400. doi:10.1002/2015GC005732
Royden, L. H., Burchfiel, B. C., and van der Hilst, R. D. (2008). The geological evolution of the Tibetan Plateau. science 321 (5892), 1054–1058. doi:10.1126/science.1155371
Saikia, S., Chopra, S., Baruah, S., Baidya, P. R., and Singh, U. K. (2016). Crustal imaging of the Northwest Himalaya and its foredeep region from teleseismic events. Geomatics, Nat. Hazards Risk 7 (4), 1265–1286. doi:10.1080/19475705.2015.1063095
Santos, D. F., Silva, J. B. C., Martins, C. M., dos Santos, R. D. C. S., Ramos, L. C., and de Araújo, A. C. M. (2015). Efficient gravity inversion of discontinuous basement relief. Geophysics 80 (4), G95–G106. doi:10.1190/GEO2014-0513.1
Spector, A., and Grant, F. S. (1970). Statistical models for interpreting aeromagnetic data. Geophysics 35 (2), 293–302. doi:10.1190/1.1440092
Sun, Y., Dong, S., Zhang, H., Li, H., and Shi, Y. (2013). 3D thermal structure of the continental lithosphere beneath China and adjacent regions. J. Asian Earth Sci. 62, 697–704. doi:10.1016/j.jseaes.2012.11.020
Tapponnier, P., Peltzer, G., Le Dain, A. Y., Armijo, R., and Cobbold, P. (1982). Propagating extrusion tectonics in Asia: new insights from simple experiments with plasticine. Geology 10 (12), 611–616. doi:10.1130/0091-7613(1982)10<611:petian>2.0.co;2
Tapponnier, P., Zhiqin, X., Roger, F., Meyer, B., Arnaud, N., Wittlinger, G., et al. (2001). Oblique stepwise rise and growth of the Tibet Plateau. science 294 (5547), 1671–1677. doi:10.1126/science.105978
Teng, J. W., Hu, J. F., Zhang, Z. J., et al. (1995). The 3-D structure of Rayleigh wave and sedimentary basins in north-west China. Acta Geophys. Sin. 38, 737–749.
Tian, X., Bai, Z., Klemperer, S. L., Liang, X., Liu, Z., Wang, X., et al. (2021). Crustal-scale wedge tectonics at the narrow boundary between the Tibetan Plateau and Ordos block. Earth Planet. Sci. Lett. 554, 116700. doi:10.1016/j.epsl.2020.116700
Tian, X., Liu, Z., Si, S., and Zhang, Z. (2014). The crustal thickness of NE Tibet and its implication for crustal shortening. Tectonophysics 634, 198–207. doi:10.1016/j.tecto.2014.07.001
Wan, J., Xu, C., Luo, Z., Wu, Y., Zhou, B., and Yan, J. (2019). An approach to Moho topography recovery using the on-orbit GOCE gravity gradients and its applications in Tibet. Remote Sens. 11 (13), 1567. doi:10.3390/rs11131567
Wang, C. Y., Lou, H., Lü, Z. Y., Wu, J., Chang, L., Dai, S., et al. (2008a). S-wave crustal and upper mantle’s velocity structure in the eastern Tibetan Plateau—deep environment of lower crustal flow. Sci. China Ser. D Earth Sci. 51 (2), 263–274. doi:10.1007/s11430-008-0008-5
Wang, W. M., Su, Y. L., Gao, X., and Guo, Z. (2008b). A study of the velocity structure beneath Himalaya mountain chain region using transform function method. Chin. J. Geophys. 51 (6), 1735–1744. doi:10.3321/j.issn:0001-5733.2008.06.014
Wang, Y. (2001). Heat flow pattern and lateral variations of lithosphere strength in China mainland: constraints on active deformation. Phys. Earth Planet. Interiors 126 (3-4), 121–146. doi:10.1016/S0031-9201(01)00251-5
Wessel, P., Luis, J. F., Uieda, L., Scharroo, R., Wobbe, F., Smith, W. H. F., et al. (2019). The generic mapping tools version 6. Geochem. Geophys. Geosystems 20 (11), 5556–5564. doi:10.1029/2019GC008515
Wu, L. (2016). Efficient modelling of gravity effects due to topographic masses using the Gauss–FFT method. Geophys. Suppl. Mon. Notices R. Astronomical Soc. 205 (1), 160–178. doi:10.1093/gji/ggw010
Xu, C., Liu, Z., Luo, Z., Wu, Y., and Wang, H. (2017). Moho topography of the Tibetan Plateau using multi-scale gravity analysis and its tectonic implications. J. Asian Earth Sci. 138, 378–386. doi:10.1016/j.jseaes.2017.02.028
Xu, C., Yu, H., Yao, C., Li, J., and Yan, J. (2020). An improved gravity method to horizontal tectonic stresses and its applications in Tibet. Geodesy Geodyn. 11 (6), 468–473. doi:10.1016/j.geog.2020.10.001
Xuan, S., and Jin, S. (2022). Moho depth and crustal density structure in the Tibetan Plateau from gravity data modelling. J. Asian Earth Sci. 233, 105261. doi:10.1016/j.jseaes.2022.105261
Xue, S., Chen, Y., Liang, H., Li, X., Liang, X., Ma, X., et al. (2021). Deep electrical resistivity structure across the Gyaring Co Fault in Central Tibet revealed by magnetotelluric data and its implication. Tectonophysics 809, 228835. doi:10.1016/j.tecto.2021.228835
Yang, B., Wang, Y. B., Zhao, L., Yang, L., and Sha, C. (2021). Depth variation of the Conrad discontinuity in the Qaidam Basin, northwestern China, and its crustal dynamic implications. Earth Planet. Phys. 5 (3), 1–9. doi:10.26464/epp2021030
Yang, H., Hu, J., Li, G., Zhao, H., and Wen, L. (2011). Analysis of the crustal thickness and Poisson's ratio in eastern Tibet from teleseismic receiver functions. Geophys. J. Int. 186 (3), 1380–1388. doi:10.1111/j.1365-246X.2011.05118.x
Yin, A., Dang, Y. Q., Wang, L. C., Jiang, W. M., Zhou, S. P., Chen, X. H., et al. (2008). Cenozoic tectonic evolution of Qaidam basin and its surrounding regions (Part 1): the southern Qilian Shan-Nan Shan thrust belt and northern Qaidam basin. Geol. Soc. Am. Bull. 120 (7-8), 813–846. doi:10.1130/b26180.1
Zhang, H. S., Tian, X. B., and Teng, J. W. (2009). Estimation of crustal Vp/Vs with dipping Moho from receiver functions. Chin. J. Geophys. 52 (5), 1243–1252. doi:10.3969/j.issn.0001-5733.2009.05.013
Zhang, X. M., Sun, R. M., and Teng, J. W. (2007). Study on crustal, lithospheric and asthenospheric thickness beneath the Qinghai-Tibet Plateau and its adjacent areas. Chin. Sci. Bull. 52 (6), 797–804. doi:10.1007/s11434-007-0110-7
Zhang, Z., and Klemperer, S. L. (2005). West-east variation in crustal thickness in northern Lhasa block, central Tibet, from deep seismic sounding data. J. Geophys. Res. Solid Earth 110 (B9). doi:10.1029/2004JB003139
Zhao, J., Mooney, W. D., Zhang, X., Li, Z., Jin, Z., and Okaya, N. (2006). Crustal structure across the Altyn Tagh Range at the northern margin of the Tibetan plateau and tectonic implications. Earth Planet. Sci. Lett. 241 (3-4), 804–814. doi:10.1016/j.epsl.2005.11.003
Zhou, J., Xu, F., Wang, T., Cao, A., and Yin, C. (2006). Cenozoic deformation history of the Qaidam Basin, NW China: results from cross-section restoration and implications for qinghai–tibet plateau tectonics. Earth Planet. Sci. Lett. 243 (1-2), 195–210. doi:10.1016/j.epsl.2005.11.033
Zhu, L., and Helmberger, D. V. (1998). Moho offset across the northern margin of the Tibetan Plateau. Science 281 (5380), 1170–1172. doi:10.1126/science.281.5380.1170
Keywords: Moho topography, Tibetan Plateau, gravity inversion, adaptive linear inversion, wavelet multi-scale analysis
Citation: Yu H, Chen H, Xu C, Li J, Chai Y, Jian G, Zhang H, Xu M, Zhao Q and Tu J (2024) Adaptive linear inversion of Moho topography in the Tibetan Plateau by combining gravity and seismic data. Front. Earth Sci. 11:1214686. doi: 10.3389/feart.2023.1214686
Received: 30 April 2023; Accepted: 14 December 2023;
Published: 05 January 2024.
Edited by:
Juergen Pilz, University of Klagenfurt, AustriaReviewed by:
Huai Zhang, University of Chinese Academy of Sciences, ChinaNuno Afonso Dias, Lisbon Higher Institute of Engineering (ISEL), Portugal
Afonso Loureiro, Agência Regional para o Desenvolvimento da Investigação Tecnologia e Inovação (ARDITI), Portugal
Copyright © 2024 Yu, Chen, Xu, Li, Chai, Jian, Zhang, Xu, Zhao and Tu. This is an open-access article distributed under the terms of the Creative Commons Attribution License (CC BY). The use, distribution or reproduction in other forums is permitted, provided the original author(s) and the copyright owner(s) are credited and that the original publication in this journal is cited, in accordance with accepted academic practice. No use, distribution or reproduction is permitted which does not comply with these terms.
*Correspondence: Haopeng Chen, aHBjaGVuQGdkdXQuZWR1LmNu; Chuang Xu, Y2h1YW5neHVAZ2R1dC5lZHUuY24=