 Jianxin Yu
 Zhibin Zhou1
95% of researchers rate our articles as excellent or good
Learn more about the work of our research integrity team to safeguard the quality of each article we publish.
Find out more
ORIGINAL RESEARCH article
Front. Earth Sci. , 23 June 2023
Sec. Geohazards and Georisks
Volume 11 - 2023 | https://doi.org/10.3389/feart.2023.1209259
This article is part of the Research Topic Instability Mechanism and Disaster Prevention of the Jointed Rockmass View all 11 articles
The structural face of rock plays a decisive role in the stability of geotechnical engineering, and the mechanism of failure destabilization of layered rock masses is still unclear. By preparing rock-like materials, shear failure tests on layered rock masses were carried out under different bedding dip angles, different rock bridge width, different normal forces, and forward and reverse shear effects. With the increase in the rock bridge width, the influence of the joint inclination angle on the shear failure process of the rock sample decreases; the peak shear strength of the specimen is the largest when the joint inclination angle is 60°, followed by 90°, 30° and 0° from large to small; the failure mode in forward shear is mainly tensile failure, and the failure mode in reversed shear is mainly shear failure; the peak number of acoustic emission events is proportional to the joint inclination angle and the rock bridge width of the specimen, and the number of acoustic emission events is proportional to the joint inclination angle and the rock bridge width of the specimen. The number of acoustic emission peak events is proportional to the bedding angle of the sample and the width of the rock bridge. The peak number of acoustic emission events in the reverse shear of the layered rock mass is greater than that in the forward shear. The angle of the lamina and the width of the rock bridge are both important factors affecting the strength of the rock. The results of this study provide a basis for identifying the shear failure mechanism of rock bridge in layered rock masses.
The angle of laminations and the extension of fractures in rock masses have always been a hot spot and focus of research in geotechnical stability analysis, and rock bridge penetration often becomes a key factor in rock slides (Sun et al., 2020). The failure of layered rock masses is determined by the physical and mechanical properties of the structural body and the structural face, and research focuses mainly on the strength of the structural face and the destabilization of the failure regularity (Zhu and Zeng, 2005). The strength of a jointed rock mass is between the strength of the rock material itself and the strength of the joint surface, and its failure mechanism and failure mode are very complicated (Liu et al., 2019).
Many scholars have analyzed the stability of slopes by studying empirical expressions for the shear strength and joint inclination of layered rock masses under different normal force conditions and relating them to the geometrical mechanics of the layered rock masses themselves to invert the effect of the joint inclination of layered rock masses on some mechanical parameters, such as the shear and compressive strength of the rock masses (Zhang and Liu., 2001; Liu and Zhang, 2002; Ran et al., 2016). Researchers at home and abroad have studied the effect of bedding direction on the strength and failure mode of layered rock masses through Brazilian splitting tests (Debecker and Vervoort, 2009; Tavallali and Vervoort, 2010a; Cho et al., 2012; Vervoort et al., 2014; Tan et al., 2015). Xia et al. (2020) concluded from extensive simulations that the shear strength of the rock mass is lowest when the laminae dip at 0° and highest at 30°. Tavallali and Vervoort (2010b) concluded from their study that the tensile strength of laminated sandstone increases with increasing quartz grains. Song et al. (2020) combined indoor tests and numerical simulations to conclude that variations in the dip angle of the rock joints lead to different forms of failure in through-jointed rock masses. Heng et al. (2019) obtained from direct shear tests that when laminated shale laminae were sheared at 30° and 60° angles, a wild goose column of fractures along the laminae was formed. Wang et al. (2017) analyzed the fracture pattern around the shear surface of jarosite with different laminae orientations and observed different degrees of laminae cracking and wild goose column fractures, which showed obvious laminae orientation effects. Li et al. (2019) found that the sample can be divided into four failure modes: tensile failure, shear failure, mixed failure, and shear failure. Liang et al. (2023) obtained through experiments that the increase of confining pressure will promote the development of shear cracks. Bao et al. (2023) obtained by numerical simulation that the sliding failure of layered rock mass is layered. Wang et al. (2022) found that CREAC showed advantages in impact deformation and energy absorption.
Rock bridges also play a very important role in the stability of the rock mass. Zhang et al. (2015) concluded that as the rock bridge becomes narrower and wider, the failure mode of the rock mass transforms from shear failure to extensive shear failure. Zhang et al. (2018) and Qin et al. (2019) showed that the direct shear failure of rock bridges exhibited three failure modes: tension failure, tension-shear failure and shear failure. Lajtai (1969) classified the failure of rock bridges into tension, shear and extrusion failure according to the magnitude of normal stress. It was concluded from the tests that the shear resistance of the shear failure surface composed of the structural surface and the rock bridge showed a good linear growth relationship, the breakage of the rock bridge originated from the tip of the joints, and the failure process was characterized by obvious stages (Savilabti et al., 1990; Shen et al., 1999; Zhao et al., 2014). Zhu et al. (2020) verified the formation of stress concentration and tensile stress zones at the joint ends from the perspective of flow fields. Gehle and Kutter (2003) carried out large deformation direct shear tests and concluded that the mechanisms that govern the different shear phases could be identified as 1) tensile rupturing. 2) rolling and sliding friction of dilatant joint zones and 3) sliding within the joint filling composed of brecciated material. Zhang et al. (2005) found that the propagation of wing cracks depends on the joint separation and the joint azimuth angle, and the connection of wing cracks dominates the eventual failure pattern and determines the peak shear load of the rock specimens. Yuan (2020) used numerical simulation to derive that there are three types of rock bridge failure in the locked section: tension through failure, tension shear through failure, and no through failure. Qi et al. (2021) concluded that when the shear displacement of the rock bridge reached 2.0–3.9 mm, the specimen started to generate a large number of acoustic emission events with the rapid growth of shear stress. Chen et al. (2017) concluded from indoor direct shear tests that, with the variation of normal stress and connectivity, the failured surface of the rock body showed “一”, “X”, “sawtooth”, “Z” and composite type “Z” and composite failure forms.
In summary, domestic and foreign researchers have conducted a lot of research on the shear failure mechanism of layered rock mass and rock bridge, and have achieved guiding research results. However, there are few studies on the shear failure of rock under the condition of multiple factors. In this paper, by making layered rock mass samples and conducting direct shear tests, the effects of different bedding angles, different normal forces, different rock bridge widths and forward and reverse shear factors on the shear effect are systematically studied. At the same time, the energy release process in the shear process of the sample is reflected by the acoustic emission device during the experiment, which provides a theoretical basis for further understanding the propagation and evolution mechanism of rock shear failure cracks under the condition of multiple factors.
The test rock was prepared as similarly as possible to the natural rock, using a high-strength cement mortar with cement: fine sand: water = 1:1:0.35. The uniaxial compressive strength and uniaxial tensile strength of the sample are 64.31 MPa and 3.62 MPa, respectively, and the elastic modulus is 6.00 GPa. The mold used for the test was a modified mold with a special angled steel plate in the middle of the ordinary mold to create different lamellar angles when pouring, with a mold size of 100 mm × 100 mm × 100 mm, as shown in Figure 1.
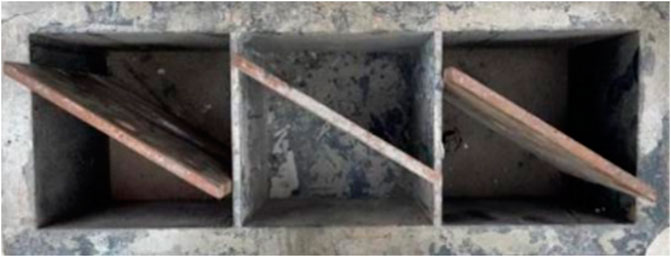
FIGURE 1. Mold of the sample.
The cement and sand were weighed in proportion, put into a mixer, and mixed well. Then, water was slowly added to make it well mixed, and the mixed mortar was poured into the mold. The test is poured in layers, half of which is poured first, vibrated, and compacted. Then, after two and a half hours, the other half is poured, after which the steel plate is withdrawn, vibrated, and compacted, and the surface is smoothed. The cast specimens were placed in the maintenance room and demolded after 24 h. The demolded specimens were maintained for 28 days, and finally, the maintained specimens were taken to the fabrication plant for seam cutting.
The test equipment used is the KYZW-100 Rock Weak Face Straight Shear Instrument manufactured by Jinan Mining and Rock Testing Instruments Co. The DS-2 acoustic emission instrument was used to monitor the crack expansion within the specimen and to reflect the stability of the material deformation or rupture. To observe the crack extension of the specimen more visually, a camera was used to take pictures of the whole process of specimen failure during the test, and the test equipment is shown in Figure 2.
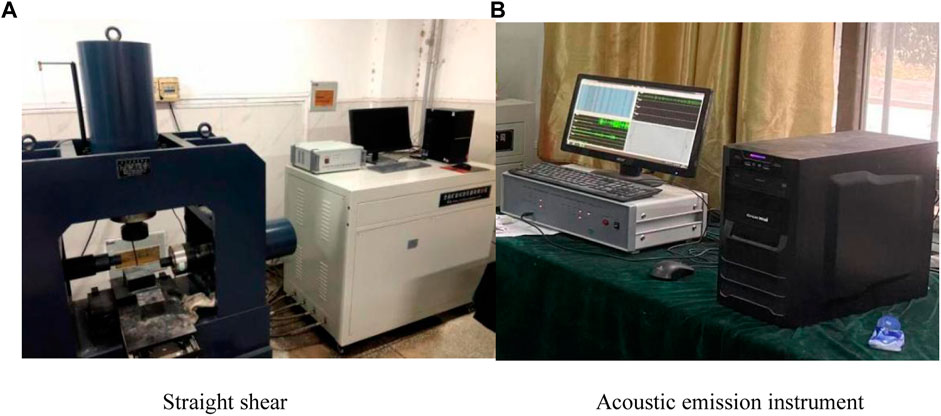
FIGURE 2. Test equipments. (A) Straight shear. (B) Acoustic emission instrument.
Considering the four conditions of bedding inclination, normal force, rock bridge width and positive and negative shear, 23 specimens were made, and the bedding inclination was divided into four groups: 0°, 30°, 60° and 90°, where the width of the rock bridge at 0°, 30° and 90° was 80 mm, the positive and negative shear tests were carried out at 30°, and the width of the rock bridge at 60° was 60 mm, 70 mm, 80 mm and 90 mm. Four normal forces of 10 kN, 20 kN, 30 kN and 40 kN were applied for the shear tests, and the specific test protocols are listed in Table 1.
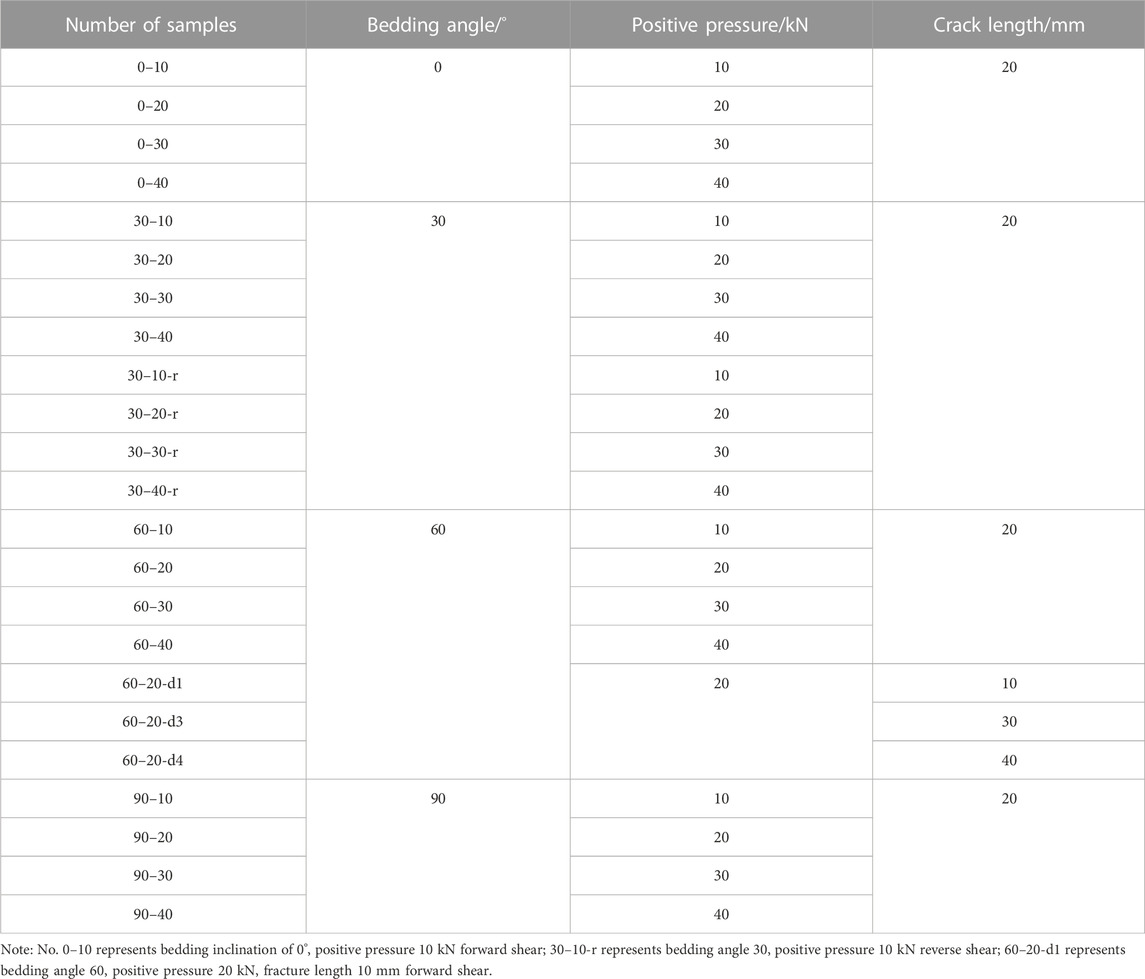
TABLE 1. Test scheme.
1) Before the specimen is tested in shear, the acoustic emission probe is arranged on the surface of the specimen to prevent the acoustic emission probe from falling off during the test, and the probe and the specimen are taped together with adhesive tape. To achieve better test results, two acoustic emission probes were used during the test, one on each side of the shear surface, numbered 1 and 2, and the acoustic emission probes were arranged as shown in Figure 3.
FIGURE 3. Acoustic emission probe arrangement.
2) Place the specimen arranged for acoustic emission on the shear apparatus, first load the normal force at a rate of 2 kN/s to the design value and stabilize it, then apply the shear force at a rate of 0.004 mm/s, turn on the acoustic emission apparatus at the same time and collect data from both apparatuses simultaneously until the specimen is damaged and the data are stabilized to end the test.
Normal stress during shear failure of a specimen and shear stress can be expressed as
Where
To investigate the effect of normal force on the shear failure of layered rock bridges, the shear failure process of four bedding dip specimens with the same rock bridge width (80 mm) and different normal forces was analyzed, and the variation in shear stress and shear displacement is shown in Figure 4, where the failure pattern of 30° bedding dip specimens is shown in Figure 5.
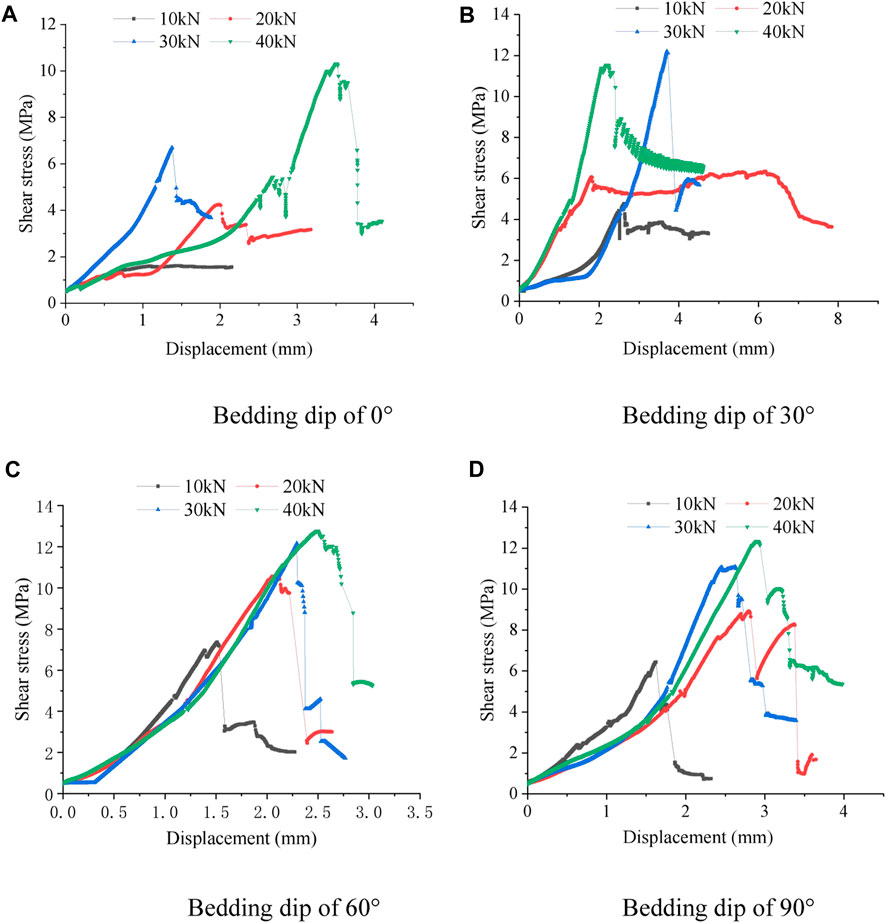
FIGURE 4. Shear stress and shear displacement curves under different normal forces. (A) Bedding dip of 0°. (B) Bedding dip of 30°. (C) Bedding dip of 60°. (D) Bedding dip of 90°.
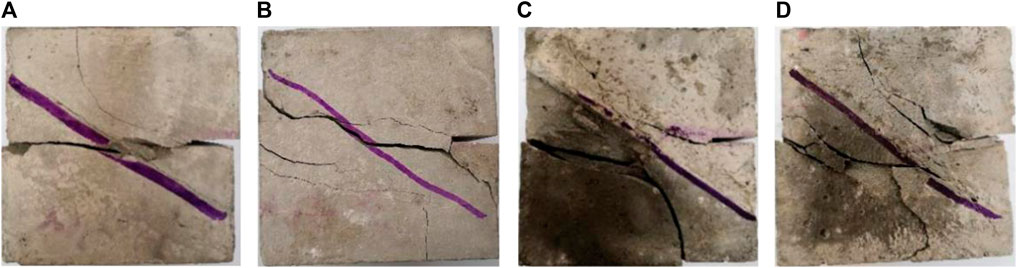
FIGURE 5. Shear failure pattern of specimens with different normal forces at a bedding dip angle of 30°. (A) 10 kN. (B) 20 kN. (C) 30 kN. (D) 40 kN.
From Figure 4, it can be seen that the specimen shear failure has obvious brittle characteristics, and the trends of the shear stress and shear displacement curve characteristics under different normal force conditions are basically the same. In the initial stage of loading, the shear displacement increases relatively quickly, and the shear stress increases relatively slowly. With increasing shear force, the shear stress increases rapidly, and the shear displacement increases slowly. When the shear stress increases to the maximum value, the specimen is sheared off, and the curve will appear to fall off a cliff and finally tend to stabilize. The peak shear strength of the specimen increases with the increase in normal force.
It can be seen from Figure 5 that when the normal force is 10 kN, tiny tensile cracks are produced in the specimen initially, the main crack is produced by the tip of the joint, and the crack extends and penetrates along the rock bridge (Figure 4A). When the normal force increases to 20 kN, the specimen is subjected to tensile stresses during shear, and tensile cracks appear in the specimen. With the increase in shear displacement, the tensile cracks expand, and eventually, the specimen is failured (Figure 4B). When the normal force exceeds 20 kN, before shear is applied, the specimen has already produced compression tensile cracks because of the normal force. The tensile cracks mainly appear at the weak corner at the bottom of the specimen, accompanied by the application of shear. The shear cracks are also produced by the tip of the joint and shear the rock bridge off (Figures 4C,D). As the normal force increases, the shear failure of the layered rock bridge goes through three stages: shear failure, shear-tension failure, and compression-shear failure. This is different from the literature (Lajtai, 1969), because the existence of the bedding plane has an effect on the shear failure of the sample, which is different from the shear failure of the ordinary rock bridge.
To study the effect of the joint inclination angle on the shear failure of layered rock bridges, the same rock bridge width (80 mm) was used to analyze the shear failure process under four normal forces and different joint inclination angles. The variation law of shear stress and shear displacement is shown in Figure 6, and the shear failure pattern of the specimen with a normal force of 20 kN is shown in Figure 7.
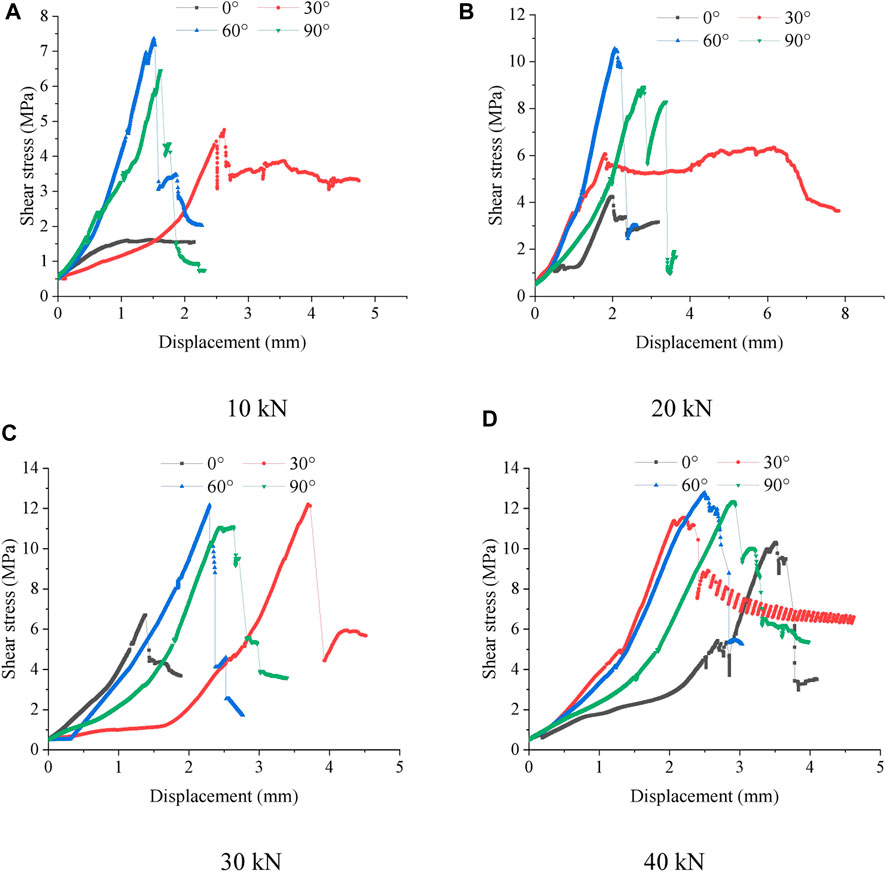
FIGURE 6. Shear stress vs. shear displacement curves for different bedding inclination angles. (A) 10 kN. (B) 20 kN. (C) 30 kN. (D) 40 kN.
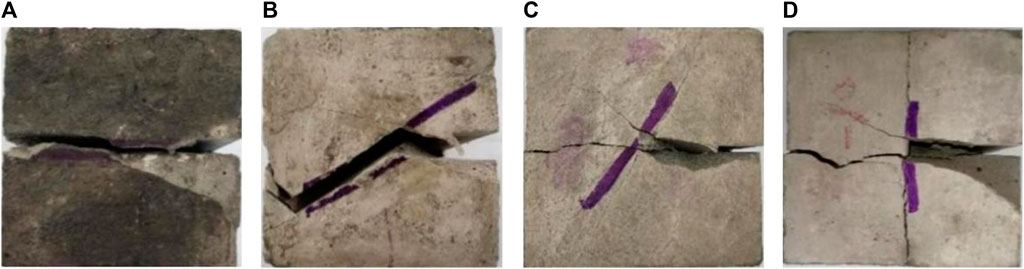
FIGURE 7. Shear failure pattern of specimens with different bedding dip angles for a normal force of 20 kN. (A) 0°. (B) 30°. (C) 60°. (D) 90°.
As shown in Figure 6, the overall characteristics of the shear stress and shear displacement curves under different bedding dip angles are basically the same as those under different normal force conditions. The maximum shear strength of the rock sample is the shear strength of the lamina surface when the joint inclination angle is 0°, and the lamina surface has the least effect on the shear failure of the specimen when the joint inclination angle is 90°, so the maximum shear strength is the shear strength of the specimen material itself. The peak shear strength of the specimen at 60° of bedding inclination is the greatest and is greater than the maximum shear strength of the rock sample, which is consistent with the conclusions obtained in the literature (Heng et al., 2014) using laminated shale shear. With the exception of the 60° case, the peak shear strengths were, in descending order, 90°, 30°, and 0°.
As shown in Figure 7, at a normal force of 20 kN, the shear cracks for specimens with different bedding dip angles all arise and extend from the tip of the joints, and the shear failure surface for specimens with a bedding dip angle of 0° arises along the bedding face, forming a through shear failure surface. For specimens with a bedding dip angle of 30°, the shear failure cracks arise from the joints and extend along the rock bridge, and when the cracks extend to the bedding face, they then form shear failure along the bedding face. In specimens with a joint inclination of 60°, the main shear failure crack forms a through crack along the shear face bridge and forms a tiny crack in the lamina face. This mode of failure is one of the reasons for the maximum shear strength of this lamina face. In specimens with a joint inclination of 90°, the main shear failure crack forms a through crack along the shear face bridge perpendicular to the lamina face.
The specimens were subjected to forward and reverse shear tests at a specimen rock bridge width of 80 mm and a joint inclination angle of 30°. The variation pattern of shear stress and shear displacement is shown in Figure 8.
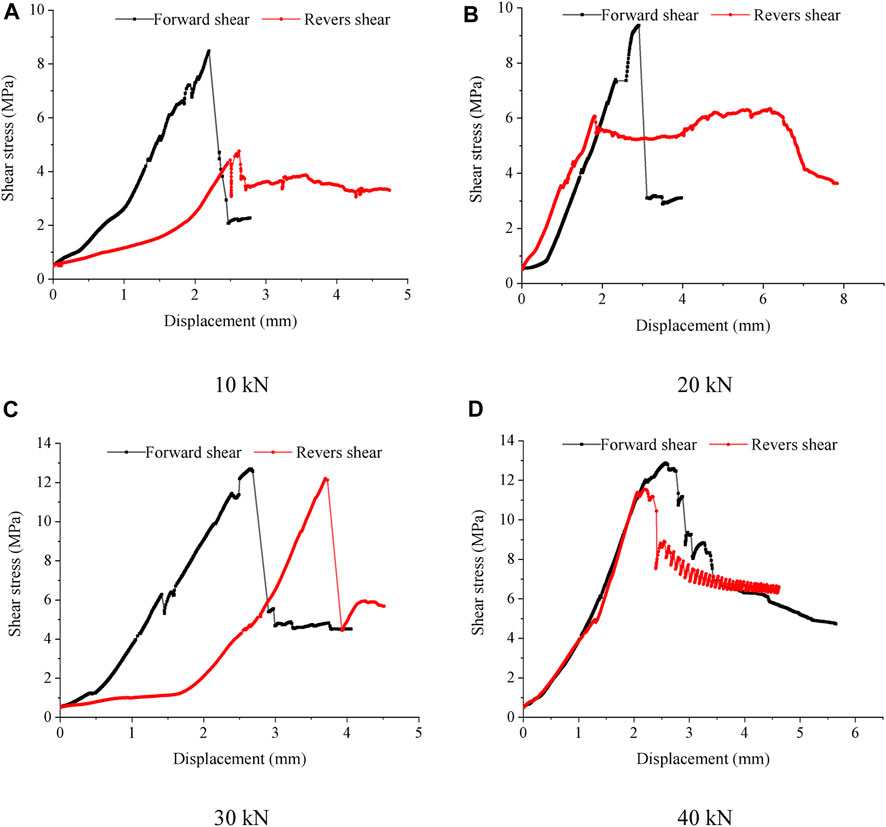
FIGURE 8. Plots of positive and negative shear stress and shear displacement of specimens under different normal forces. (A) 10 kN. (B) 20 kN. (C) 30 kN. (D) 40 kN.
Figure 8 shows that the peak shear strength of forward shear is greater than the peak shear strength of reverse shear for specimens with the same joint inclination angle under different normal force conditions, and the peak shear strength increases with increasing normal force, both of which are proportional to the law of variation of shear strength with normal force in rock shear tests.
In the comparison analysis of Figure 5B and Figure 7B, the normal force is 20 kN, the bedding dip angle is 30°, and the specimen is damaged for forward shear and reverse shear. In the case of forward shear, the failure mode of the specimen is mainly tension failure, and in the case of reverse shear, the main failure mode of the specimen is shear failure. The shear strength in forward shear is greater than the peak shear strength in reverse shear.
To study the effect of different rock bridge widths on the shear failure of layered rock, shear failure tests were carried out at the same bedding dip angle (60°) and constant positive pressure (20 kN), varying the widths of the rock bridges of the specimens to 90 mm, 80 mm, 70 mm and 60 mm, and the various patterns of shear stress and shear displacement are shown in Figure 9, and the failure patterns are shown in Figure 10.
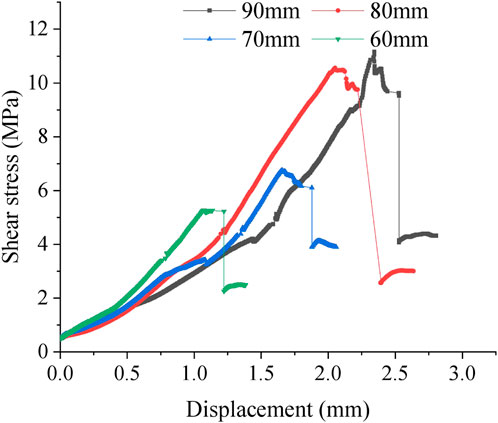
FIGURE 9. Shear stress versus shear displacement curves for specimens with different rock bridge widths.
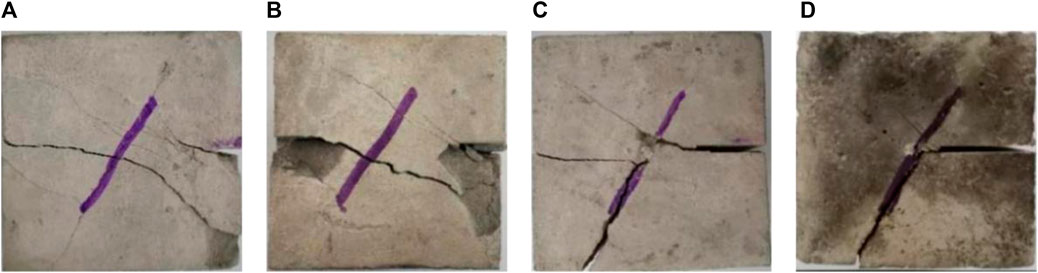
FIGURE 10. Shear failure pattern under different rock bridge width conditions. (A) 90 mm. (B) 80 mm. (C) 70 mm. (D) 60 mm.
Analysis of Figure 9 shows that the shear failure results for different rock bridge widths under the same conditions of the same normal force and bedding dip angle reveal that the specimens have basically the same characteristics of shear stress and shear displacement curves during shear failure, with the peak shear strength of the specimens increasing with the increase in rock bridge width and the shear displacement of the specimens increasing with the increase in rock bridge width.
As shown in Figure 10, as the width of the rock bridge increases, the influence of the joint inclination angle on the shear failure of the rock sample decreases. At 60 mm and 70 mm rock bridge widths, the main fracture from shear failure of the specimen extends and breaks along the laminae. In contrast, for rock bridge widths of 80 mm and 90 mm, the main fracture runs through the bridge of the specimen, and the laminae face is less affected by the failure. This indicates that the rock bridge width is one of the important factors affecting the strength of the rock.
In the early stage of shear force application, the specimen is in the elastic deformation stage, and the number of acoustic emission events is low. With increasing shear force, the crack continues to expand, and after the shear force reaches its peak, the specimen is suddenly damaged, and the shear stress will show a cliff-type drop. At this time, the number of acoustic emission events will increase considerably. The number of acoustic emission events under different test conditions are shown in Figure 11, Figure 12 and Figure 13.
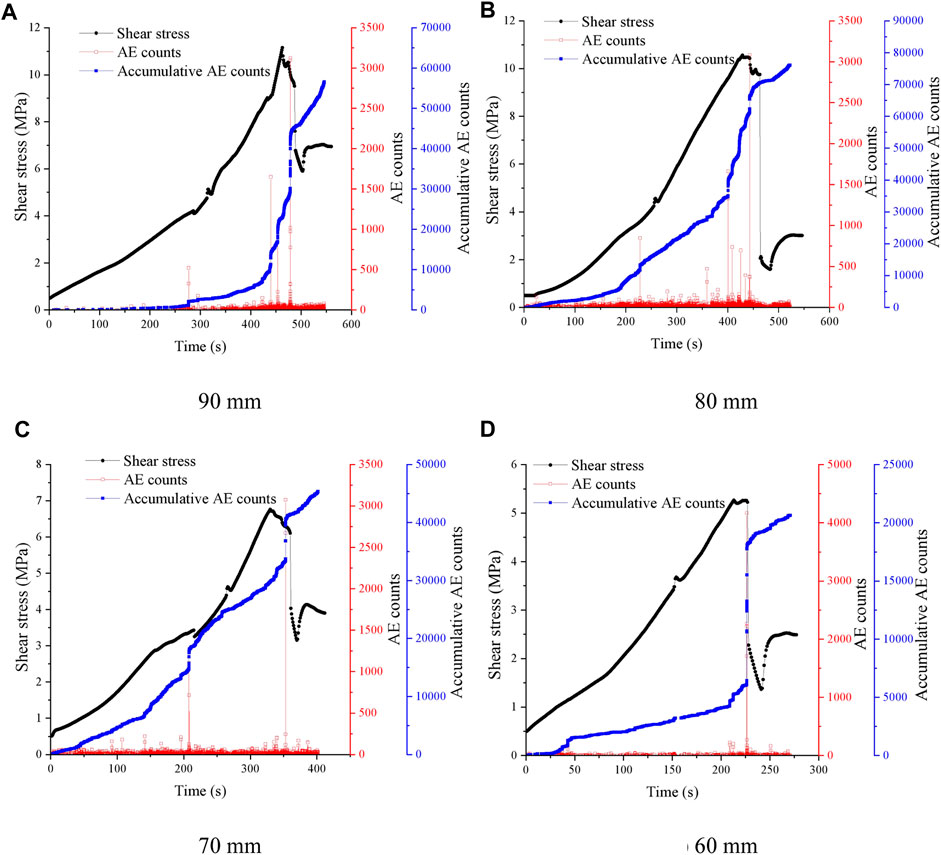
FIGURE 11. Acoustic emission counts over time during shear at different rock bridge widths. (A) 90 mm. (B) 80 mm. (C) 70 mm. (D) 60 mm.
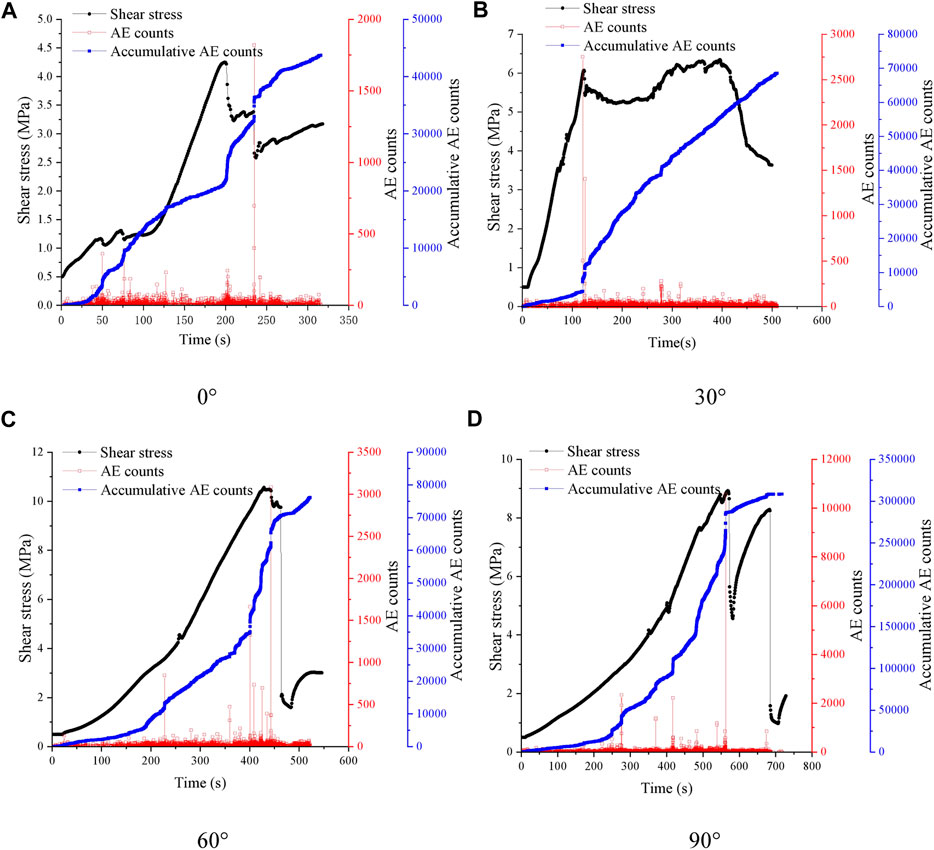
FIGURE 12. Acoustic emission counts with time for shear processes at different bedding dip angles. (A) 0°. (B) 30°. (C) 60°. (D) 90°.
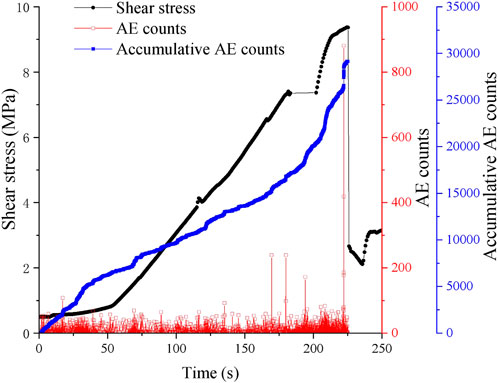
FIGURE 13. Acoustic emission counts over time during forward shear.
As shown in Figure 11, when the normal force is 20 kN and the bedding angle is 60°, the acoustic emission characteristics of different rock bridge widths are analyzed. When the rock bridge width is 90 mm, 80 mm and 70 mm, the number of instantaneous acoustic emission events of shear failure of the sample is basically the same, which is about 3,250 times. However, when the rock bridge width is 60 mm, the number of instantaneous acoustic emission events of shear failure of the sample is large, which is about 4,200 times. This is because when the rock bridge width is 60 mm, the sample will be destroyed instantaneously along the bedding plane during the shear process. With the increase of the width of the rock bridge, the peak value of the cumulative number of acoustic emission events in the whole process of shear shows an increasing trend. This is because the width of the rock bridge is larger, the energy accumulated inside the sample during shear failure is larger, and the energy released at the moment of failure is relatively larger.
As shown in Figure 12, when the normal force is 20 kN and the width of the rock bridge is 80 mm, the acoustic emission characteristics under different bedding dip angles are analyzed. With the increase of the bedding dip angle, the number of instantaneous acoustic emission events and the cumulative number of acoustic emission events in the whole process of sample shearing are increasing. Although the peak shear strength is the largest when the bedding angle is 60°, the number of acoustic emission time is not the largest. The maximum is 90° and the minimum is 0°. Because when the bedding angle is 0°, in the process of shear failure of the sample, the cracks are generated and developed along the weak plane of the bedding, the shear failure ability of the sample is low, the energy accumulated inside the sample is the smallest, and the peak value of the acoustic emission event is the smallest. When the bedding angle is 90°, the cracks are perpendicular to the weak plane of the bedding, and the energy accumulated inside the sample is the largest, so the peak value of the acoustic emission event is the largest.
From the comparative analysis of 3.3 forward shear and reverse shear, it can be seen that the failure mechanisms of forward shear and reverse shear of layered rock are different, and the number of acoustic emission events generated by the two shear methods also differs significantly. Figure 13 and Figure 12B show the characteristic curves of the acoustic emission events of the specimens in forward and reverse shear at 30°, respectively. In the process of forward shear, the specimens are mainly damaged by tension, there is less energy accumulated inside the specimens, and the number of peak acoustic emission events is small when they are damaged. Conversely, when the specimen is in reverse shear, it is mainly shear failure, the energy accumulated inside the specimen is large, and the number of peak acoustic emission events at the time of failure is relatively large.
During shear failure of rocks, the angle of laminae and joints can have a dramatic effect on the extension of cracks. When the angle of shear to the laminae was greater than 90°, similar phenomena were observed when it was less than 90° (Ikari et al., 2015). For specimens with different laminae inclination angles, cracks generated at the tips of the joints caused local failure to the specimens under shear, and as the shear force continued to increase, the cracks continued to expand, eventually forming a through shear failure zone, which was consistent with the literature (Savilabti et al., 1990; Shen et al., 1999; Zhao et al., 2014). During the shear failure process, the pre-cracking of the specimen will tend to close due to the action of the normal force at the joint tip. Coupled with the increasing shear force, the specimen will produce tension cracks, and the joint tip will appear to be broken, slagged and spalled. The width of the rock bridge has a great influence on the crack extension of the laminated specimen. When the width of the rock bridge is relatively large, the shear force of the specimen is mainly provided by the rock bridge, and the specimen has tension cracks in the shear failure process. The failure surface presents a certain angle and eventually forms through failure. The failure process of the weak side of the lamina has less influence on the failure. When the width of the rock bridge of the specimen is small, before the application of shear force, because of the action of the normal force. When the specimen rock bridge width is small, before the shear force is applied, because of the normal force, the specimen produces a compression pull crack at the tip of the joint. With the shear force applied, the specimen produces a shear crack. When extended to the laminated weak surface, the specimen eventually breaks along the laminated surface. In this process, the laminated surface plays a major role in the destruction of the specimen.
For specimens with bedding inclinations of 0° and 90°, the presence of the joints has relatively little effect on crack extension during shear failure. For 0° specimens, shear failure is mainly in the form of slip along the bedding surface; for 90° specimens, it is mainly shear fracture perpendicular to the bedding surface. For the 30° and 60° specimens, there is a clear difference between the crack extension in forward and reverse shear. In forward shear, the specimen is sheared by a tensile crack perpendicular to the bedding surface from the tip of the joints, and the tensile crack expands during the shear process and eventually penetrates; in reverse shear, a tensile crack first appears at the tip of the joints, and with increasing shear force, the crack expands and eventually penetrates along the bedding surface. The specimen undergoes shear failure.
Shear strength weakening with sliding is an important property of intact and fractured rocks, a mechanism for landslides or collapse tipping of rocky slopes containing fractures, and an important model for analyzing earthquake mechanisms and precursor phenomena in seismology (Heng et al., 2019). The angle of the lamina and the width of the rock bridge are both important factors affecting the strength of the rock. Through the indoor direct shear test, the shear failure of the rock under different working conditions is simulated, the crack generation and expansion pattern of the specimen during the shear failure is observed, and the mechanical properties of the specimen before and after the failure are analyzed, which is of great significance for the study of the collapse of layered rocky slopes containing joints and the slip movement of faults in the event of earthquakes.
To analyze the shear failure characteristics of layered rock bridges, an indoor shear test was carried out by preparing similar rock materials. Combined with acoustic emission monitoring, shear tests under different bedding dip angles, different normal forces, different rock bridge widths and positive and negative shear were analyzed. The main conclusions are as follows.
(1) Under different normal force conditions, the specimen shear damage has obvious brittle characteristics, the peak shear strength is proportional to the normal force, the peak shear strength of layered rock is influenced by the width of the rock bridge, and the greater the width of the rock bridge is, the greater the peak shear strength.
(2) Under different joint inclination angle conditions, the maximum shear strength of the rock sample is the shear strength of the lamina face when the joint inclination angle is 0°; when the joint inclination angle is 90°, the lamina face has the least effect on the shear failure of the specimen, and the maximum shear strength is the shear strength of the specimen material itself; the peak shear strength is 60°, 90°, 30° and 0° in descending order.
(3) When the joint inclination angle is the same, the shear stress and shear displacement curves of the specimens under forward and reverse shear conditions are basically the same, and the peak shear strength is proportional to the normal force. The failure mode of the specimens in forward shear is mainly tension failure, while the failure mode of the specimens in reverse shear is mainly shear failure.
(4) Acoustic emission has an obvious phase, the peak number of acoustic emission events is proportional to the width of the rock bridge and the dip angle of the lamina, and its peak time and the peak time of shear stress are basically the same; the peak number of acoustic emission events of reverse shear is greater than that of forward shear.
(5) Bedding angle, normal force and rock bridge width are important factors affecting rock strength.
The original contributions presented in the study are included in the article/Supplementary Material, further inquiries can be directed to the corresponding authors.
JY conceived of and designed the experiments. JY, ZZ, and ZL performed the experiments. ZZ, LC, and HL analyzed the data. ZZ and LZ wrote the paper. All authors contributed to the article and approved the submitted version.
This work was supported by funding from the National Natural Science Foundation of China (42107200), Postdoctoral Research Grant in Henan Province (202101036), and Outstanding Youth Fund Project of Henan Polytechnic University (J2023-4).
The authors would like to thank the researchers of past studies in the field for their excellent work and their help in providing references for this paper. Finally, we wish to thank the reviewers for critically reviewing the manuscript.
The authors declare that the research was conducted in the absence of any commercial or financial relationships that could be construed as a potential conflict of interest.
All claims expressed in this article are solely those of the authors and do not necessarily represent those of their affiliated organizations, or those of the publisher, the editors and the reviewers. Any product that may be evaluated in this article, or claim that may be made by its manufacturer, is not guaranteed or endorsed by the publisher.
Bao, Y. D., Chen, J. P., Su, L. J., Zhang, W., and Zhan, J. W. (2023). A novel numerical approach for rock slide blocking river based on the CEFDEM model: A case study from the samaoding paleolandslide blocking river event. Eng. Geol. 312, 106949. doi:10.1016/j.enggeo.2022.106949
Chen, G. Q., Wang, J. C., Wang, W., Luo, F. Y., and Li, Z. B. (2017). Direct shear failure characteristics of discontinuous jointed rock mass with different connectivity. J. Eng. Geol. 25, 322–329. doi:10.13544/j.cnki.jeg.2017.02.008
Cho, W. J., Kim, H., Jeon, S., and Min, K. B. (2012). Deformation and strength anisotropy of Asan gneiss, Boryeong shale, and Yeoncheon schist. Int. J. Rock Mech. Min. Sci. 50, 158–169. doi:10.1016/j.ijrmms.2011.12.004
Debecker, B., and Vervoort, A. (2009). Experimental observation of fracture patterns in layered slate. Int. J. Fract. 159, 51–62. doi:10.1007/s10704-009-9382-z
Gehle, C., and Kutter, H. K. (2003). Breakage and shear behaviour of intermittent rock joints. Int. J. Rock Mech. Min. Sci. 40, 687–700. doi:10.1016/S1365-1609(03)00060-1
Heng, S., Yang, C. H., Zeng, Y. J., Zhang, B. Q., Guo, Y. T., Wang, L., et al. (2014). Anisotropy of shear strength of shale based on direct shear test. Chin. J. Rock Mech. Eng. 33, 874–883. doi:10.13722/j.cnki.jrme.2014.05.002
Heng, S., Li, X. Z., Liu, X., and Zhang, X. D. (2019). Study on the propagation mechanism of shale fractures under direct shear conditions. J. Rock Mech. Eng. 38, 2438–2450. doi:10.13722/j.cnki.jrme.2019.0557
Ikari, M. J., Niemeijer, A. R., and Marone, C. (2015). Experimental investigation of incipient shear failure in foliated rock. J. Struct. Geol. 77, 82–91. doi:10.1016/j.jsg.2015.05.012
Lajtai, E. Z. (1969). Shear strength of weakness planes in rock. Int. J. Rock Mech. Min. Sci. Geomech. Abstr. 6, 499–515. doi:10.1016/0148-9062(69)90016-3
Li, B., Huang, D., Jiang, Q. H., and Cheng, G. Q. (2019). Fracture pattern and toughness of layered sandstone influenced by layer orientation. J. Geotech. Eng. 41, 1854–1862. doi:10.11779/CJGE201910009
Liang, X., Tang, S. B., Tang, C. A., Hu, L. H., and Chen, F. (2023). Influence of water on the mechanical properties and failure behaviors of sandstone under triaxial compression. Rock Mech. Rock Eng. 56 (2), 1131–1162. doi:10.1007/s00603-022-03121-1
Liu, K. D., and Zhang, Y. J. (2002). Influence factors on shear failure orientation of layered rocks. J. Rock Mech. Eng., 335–339.
Liu, W., Zeng, Y. W., Xia, L., and Chen, X. (2019). Dendrobium sonia polysaccharide regulates immunity and restores the dysbiosis of the gut microbiota of the cyclophosphamide-induced immunosuppressed mice. Eng. J. Wuhan Univ. 52, 600–607. doi:10.1016/S1875-5364(19)30062-7
Qi, Y. Y., Wei, W., Chen, Z. Q., and Gao, X. (2021). Acoustic emission characteristics of shear failure of rock bridges. Bull. Sci. Technol. 37, 72–76. doi:10.13774/j.cnki.kjtb.2021.03.013
Qin, C. A., Chen, G. Q., Zheng, H. J., and Tang, P. (2019). Failure of rock bridge at the end fracture condition under direct shear tests. Geotechnics 40, 642–652. doi:10.16285/j.rsm.2017.1424
Ran, Y., Chen, G. Q., Huang, B. R., Zhang, X. D., and Chen, C. S. (2016). Experimental study on failure characteristics of rock bridge different widths under direct shear. J. Changjiang Acad. Sci. 33, 131–134+144. doi:10.11988/ckyyb.20150684
Savilabti, T., Nordlund, E., and Stephansson, O. (1990). “Shear-boxtesting and modeling of joint bridge,” in Proceedings of International Symposium for Rock Joints. Editors N. R. Barton, and O. Stephansson (Norway), 295–300. doi:10.1016/0148-9062(91)92236-r
Shen, T., Feng, D. X., Ren, W. Z., and Bai, S. W. (1999). Research on strength property of shear including discontinuity and rock bridge. Geotechnics, 34–39. doi:10.16285/j.rsm.1999.01.006
Song, Y., Zang, F. Y., Li, Y. Q., Du, Y. Q., and Wang, & W. Y. (2020). Analysis of shear failure characteristics of anchored jointed rock mass. Chin. J. Geol. Hazard Control 31, 133–140. doi:10.16031/j.cnki.issn.1003-8035.2020.05.18
Sun, X., Chen, G. Q., Zhang, G. Z., Wang, D., and Qin, C. A. (2020). Study on meso-failure characteristics and dilatancy effect of rock bridge direct shear. J. Eng. Geol. 28, 246–254. doi:10.13544/j.cnki.jeg.2019-039
Tan, X., Konietzky, H., Frühwirt, T., and Dan, Q. D. (2015). Brazilian tests on transversely isotropic rocks: Laboratory testing and numerical simulations. Rock Mech. Rock Eng. 48, 1341–1351. doi:10.1007/s00603-014-0629-2
Tavallali, A., and Vervoort, A. (2010a). Effect of layer orientation on the failure of layered sandstone under Brazilian test conditions. Int. J. Rock Mech. Min. Sci. 47 (02), 313–322. doi:10.1016/j.ijrmms.2010.01.001
Tavallali, A., and Vervoort, A. (2010b). Failure of layered sandstone under Brazilian test conditions: Effect of micro-scale parameters on macro-scale behaviour. Rock Mech. Rock Eng. 43, 641–653. doi:10.1007/s00603-010-0084-7
Vervoort, A., Min, K. B., Konietzky, H., Cho, J. W., Debecker, B., Dinh, Q. D., et al. (2014). Failure of transversely isotropic rock under Brazilian test conditions. Int. J. Rock Mech. Min. Sci. 70, 343–352. doi:10.1016/j.ijrmms.2014.04.006
Wang, P. T., Ren, F. H., Miao, S. J., Cai, M. F., and Yu, Q. L. (2017). Evaluation of the anisotropy and directionality of a jointed rock mass under numerical direct shear tests. Eng. Geol. 225, 29–41. doi:10.1016/j.enggeo.2017.03.004
Wang, Q., Xu, S., Xin, Z. G., He, M. C., and We, I. H. Y. (2022). Mechanical properties and field application of constant resistance energy-absorbing anchor cable. Tunn. Undergr. Space Technol. 125, 104526. doi:10.1016/j.tust.2022.104526
Xia, L., Yao, J. S., and Jiang, L. (2020). Effect of bedding characteristics on shear mechanical properties of layered rock mass. J. Water Resour. Archit. Eng. 18, 37–43+69. doi:10.3969/j.issn.1672-1144.2020.01.007
Yuan, X. H. (2020). Study on deformation failure mode and evolution mechanism of middle locked rock bridge under uniaxial compression. J. Saf. Sci. Technol. 16, 116–121. doi:10.11731/j.issn.1673-193x.2020.09.018
Zhang, Y. J., and Liu, Y. P. (2001). Anisotropy of shear strength of layered rock and determination of shear failure plane. Geotech. Mech. (03), 254–257. doi:10.16285/j.rsm.2001.03.004
Zhang, H. Q., Zhao, Z. Y., Tang, C. A., and Song, L. (2005). Numerical study of shear behavior of intermittent rock joints with different geometrical parameters. Int. J. Rock Mech. Min. Sci. 43 (5). doi:10.1016/j.ijrmms.2005.12.006
Zhang, G. F., Chen, G. Q., Ao, C. Q., Zhang, Y., and Zhao, Y. J. (2015). Experimental study on direct shear of rock bridge with different width. Railw. Eng. (11), 89–91+120. doi:10.3969/j.issn.1003-1995.2015.11.26
Zhang, L. M., Chen, G. Q., Li, Z. B., Luo, F. Y., and Zhou, Y. X. (2018). Failure process of coplanar discontinuous rock bridge in direct shear test. J. Chang jiang Acad. Sci. 35, 120–125+142. doi:10.11988/ckyyb.20170371
Zhao, Y. L., Peng, Q. Y., Wan, W., Wang, W. J., and Zhao, F. J. (2014). Experimental and numerical analysis on rupture of rock bridge with Non-Coplanar intermittent joints under direct shear. Civ. Constr. Environ. Eng. 36, 59–67. doi:10.11835/j.issn.1674-4764.2014.01.009
Zhu, Z. Q., and Zeng, Y. W. (2005). Study on uniaxial compressive strength and shear failure surface of layered rock mass. Geotech. Eng. World 8, 27–29. doi:10.3969/j.issn.1674-7801.2005.04
Keywords: geotechnical engineering, layered rock, shear failure, rock bridge width, failure mechanism
Citation: Yu J, Zhou Z, Liu H, Zhou L, Li Z and Cheng L (2023) Experimental study on the shear failure of layered rock bridges. Front. Earth Sci. 11:1209259. doi: 10.3389/feart.2023.1209259
Received: 20 April 2023; Accepted: 12 June 2023;
Published: 23 June 2023.
Edited by:
Hongyuan Liu, University of Tasmania, AustraliaCopyright © 2023 Yu, Zhou, Liu, Zhou, Li and Cheng. This is an open-access article distributed under the terms of the Creative Commons Attribution License (CC BY). The use, distribution or reproduction in other forums is permitted, provided the original author(s) and the copyright owner(s) are credited and that the original publication in this journal is cited, in accordance with accepted academic practice. No use, distribution or reproduction is permitted which does not comply with these terms.
*Correspondence: Jianxin Yu, amlhbnhpbnl1QGhwdS5lZHUuY24=; Huanchun Liu, bGl1aHVhbmNodW5AaHB1LmVkdS5jbg==
Disclaimer: All claims expressed in this article are solely those of the authors and do not necessarily represent those of their affiliated organizations, or those of the publisher, the editors and the reviewers. Any product that may be evaluated in this article or claim that may be made by its manufacturer is not guaranteed or endorsed by the publisher.
Research integrity at Frontiers
Learn more about the work of our research integrity team to safeguard the quality of each article we publish.