 Wanling Zhang1,2
 Qiang Zeng1,2*
- 1Center for Underground Coal Fire, College of Ecology and Environment, Xinjiang University, Urumqi, China
- 2Key Laboratory of Oasis Ecology of Ministry of Education, Xinjiang University, Urumqi, China
The characteristics of oxidized spontaneous combustion of coal can reflect the performance of coal, and an appropriate structural model can reflect it more intuitively. In this study, samples from Baishihu Coal Mine were used to study the macromolecular structure, microcrystal structure, and oxidation process of coal by X-ray photoelectron spectroscopy (XPS), carbon nuclear magnetic resonance (13C-NMR), and Fourier infrared spectroscopy (FTIR). The molecular formula C198H164O40N2 and the molecular structure model were obtained. ChemDraw and Materials Studio were used for the experimental data, and high-resolution transmission electron microscopy (HRTEM) was used to verify the aromatic ring structure built to make the constructed structural model more accurate. In the water evaporation stage, the high ring aromatic layer is converted into the low ring number. Furthermore, in the high-temperature stage, the low ring aromatic layer is transformed due to the coking and condensation reaction of the coal sample. The C element in the coal sample mainly participates in the reaction in C–C and C–H forms. The spacing and effective number of aromatic layers are relatively stable. The aggregation state of coal is a macromolecular group formed between molecules with different aromatic structures and fat structures, which is formed by the interaction of internal defects and pores of molecular groups. With the increase in the treatment temperature, water loss is heavier, oxygen absorption and weight gain are perplexing, and the value of the burnout temperature is higher. The apparent activation energy of the coal–oxygen reaction increases, and the reaction is more intricate to achieve. This study furthers the understanding of coal spontaneous combustion in this mining area, provides a reference for the prevention and control of coal spontaneous combustion.
1 Introduction
Coal is a fossil energy source of high significance in production and existence; however, the development and utilization of coal result in ecological and environmental issues (Pudasainee et al., 2020; Zeng et al., 2020). The clean utilization, processing, and transformation of coal require an obvious understanding of the combustion characteristics and macromolecular chemical structure of coal (Qin, 2018). The construction of a coal macromolecular structure model is an important topic in coal research (Lei et al., 2017). The microstructure of different types of coal can be associated with the reaction characteristics of coal samples and has certain research significance. The Fuchs, Given, Wiser, Shinn, and Wender models are molecular structure models that have been proposed previously (Tahmasebi et al., 2012). With the progress in research methods and the improvement of instrument accuracy, researchers have a more intuitive understanding of the structure and association of various chemical bonds, such as a bridge bond and branching chain in coal and the distribution of the size and number of aromatic nucleus clusters (Wang et al., 2022; Yin et al., 2022; Zhang et al., 2022). On this basis, the research related to the coal structure has also made corresponding progress.
Worldwide researchers have investigated the coal structure using various methods. Studies have been carried out on the molecular structure of western Anatolia coals, high-grade anthracite, Xishan bituminous coal, Fenghuangshan anthracite coal, and Kerjian mining coal (Baysal et al., 2016; Zhang et al., 2017; Zhang et al., 2021; Ding and Zeng, 2022). Establishing a molecular structure model for coal samples from different regions reflects the differences between different qualities of coal and provides the basis for other theoretical studies (Manoj, 2016). Based on the construction of a molecular structure model to study the characteristics of coal, Lin et al. (2019) analyzed the molecular structure differences between tectonic coal and primary coal in the Pingdingshan coalfield. Zeng and Shen (2022) used thermogravimetric analysis (TGA), Fourier infrared spectroscopy (FTIR), X-ray diffraction (XRD), and temperature-programmed oxidation to characterize the spontaneous combustion characteristics of coal samples. Ghosh et al. (2020) used Raman spectroscopy, FTIR, and X-ray photoelectron spectroscopy to study the microstructural framework of coal in Langanji and Jaria basins and the Himalayas. Moroeng (2022) used X-ray photoelectron spectroscopy (XPS) to analyze the effect of contact metamorphism on N in Wittbank coal (South Africa). Jaiswal and Pal (2020) used XRD, XPS, FTIR, and high-resolution transmission electron microscopy (HRTEM) to characterize the structural characterization of Indian vitrinite-rich bituminous Karharbari coal. Numerous scholars have characterized the molecular structure of bituminous coal in different regions by means of carbon nuclear magnetic resonance (13C-NMR), FTIR, XPS, XRD, and Raman spectroscopy analysis, which has a crucial sway on the study of the mineralogical structure and basic characteristics of coal samples (Jing et al., 2019; Ping et al., 2020; Wang and Zeng, 2020). These research studies reflect the reaction dynamics of different coal samples and microstructural features, such as functional groups related to the reaction. The huge space for new applications of quantum chemical methods may contribute to achieving unprecedented progress in the coal industry (Sen and Dash, 2020). There is some subjectivity in studying the coal structure through quantum chemistry. In summary of the aforementioned studies, different analytical methods should be integrated to make the constructed model more accurate. In addition, we need to pay attention to the deep mechanism of oxidation or pyrolysis. The current understanding of many kinds of coal is still relatively limited.
As the fulcrum of the coal organic macromolecule network, the reaction properties and quantity of bridge chains, lipid rings, and heterocyclic rings are different, which determine the probability and time of the aromatic cluster in the process of coal pyrolysis. It is meaningful to analyze the reaction characteristics of the distribution of the aromatic nucleus in the process of coal. Niekerk and Mathews (2010) manually extracted the aromatic lattice stripes of coal by binarizing the high-resolution transmission electron microscopy images of South African coal using ImageJ and Photoshop. Vranjes-Wessely et al., (2020) used HRTEM imaging to directly determine the structural characteristics of pore size distribution, pore morphology, and geometric factors. Some scholars have also analyzed aromatic clusters and graphite-like structures of coal samples in different regions through HRTEM and other test methods. It provides a basis for studying the pore evolution, swelling mechanism, and ordering of coal. Jaiswal et al., 2021, Yuan et al., 2021, and Chen et al., 2021 used HRTEM to identify aromatic clusters and graphite-like structures distinguished in thermally altered coal and their genesis. Yuan et al., (2021) used HRTEM image analysis to detect samples with different deterioration grades, such as anthracite and CDNG. With graphitization, the curvature and dislocation decrease, forming ordered graphite. Hower et al., (2022) used SEM and HRTEM to examine fly ash obtained from the combustion of low sulfur sub-bituminous river basin coal. Li and Zeng (2022) used HRTEM to analyze the changes in the aggregate structure and ultramicropores of Zhungdong coal samples. The aforementioned research study determined different types of coal and functional groups and analyzed the microcrystal parameters of coal. Although there are sufficient studies available in the literature, the aromatic cluster and graphite structure of coal should be studied more deeply, which is bound to the molecular structure of coal. The pore structure can also be combined with the activation energy and gas adsorption characteristics of different reactions carried out using coal, so as to better understand the composition and reaction characteristics of the coal structure.
This study constructs the molecular structure model of raw coal at room temperature (20°C) for industrial analysis, elemental analysis, thermogravimetric analysis, Fourier infrared spectroscopy of coal samples, X-ray diffraction, X-ray photoelectron spectroscopy, carbon nuclear magnetic resonance, and HRTEM. The microstructural impact of the coal was studied by the aforementioned data analysis. The combined aromatic cluster structure assembles the molecular structure model of coal more accurately by combining the kinetic characteristics (activation energy) with functional groups and aromatic hydrocarbons. This study provides the theoretical basis for comprehensive utilization, clean utilization, and coal–oxygen reaction characteristics.
2 Materials and methods
2.1 Coal samples
The coal samples were collected from the Baishihu mining area (Xinjiang, China).
The raw coal collected was broken and screened, and particle sizes of 0.15–0.18 mm were taken for the proximate and ultimate analysis of coal. The results of proximate, ultimate, and elemental analyses and atomic ratio of coal are shown in Table 1. The atomic ratio was obtained from the C element and the normalization of the atomic mass of each element.
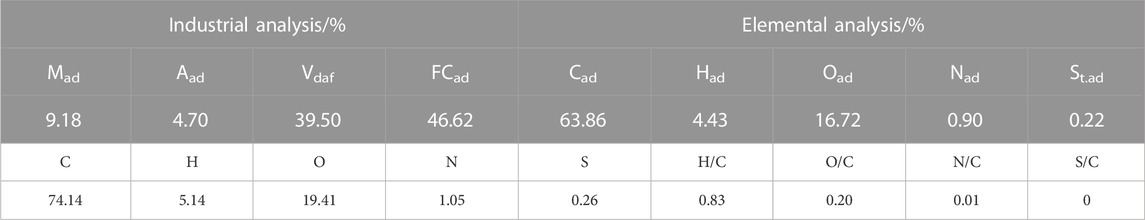
TABLE 1. Proximate, ultimate, and elemental analyses and the atomic ratio of coal.
2.2 Methods
1) 13C-NMR: Its chemical shift range is 0–250 ppm, and it can provide different types of carbon skeleton structure information and chemical environments. The Swiss Bruker AVANCE III 600 MHz fully digital superconducting NMR spectrometer was used. To obtain the carbon atom information of the coal sample, the experimental conditions were set as follows: high resolution of 4.0 mm, double resonant MAS probe, rotor working speed of 10 kHz, pulse width of 4 s, pulse delay time of 1 s, and contact time of 2 m.
2) XPS: This method measures the energy distribution of photoelectrons and Auger electrons emitted from the surface of a sample by X-ray photon irradiation using an electron spectrometer, specifically the American ESCALAB 250Xi X-ray photoelectron energy spectrometer. To determine the occurrence form of C, O, N, and S atoms in the coal sample, the experimental conditions were set as follows: monochromatic AL Kα emission source (hv = 1486.6 eV), power of 200 W, and energy analysis range of 0–5000 eV, with C 1s (284.6 eV) as the standard for charge correction.
3) XRD: XRD is particularly suitable for the phase analysis of crystalline substances, such as the composition of elements or groups with different structures. A D8 Advance X-ray powder diffractometer produced by Bruker (AXS GmbH, Karlsruhe, Germany) was used for the measurement. To obtain the microcrystal coal-like structure parameters, the experimental conditions were set as follows: Cu target radiation, step amplitude of 0.02034, count time of 19.2 s/step, voltage of 40 kV, current of 40 mA, and scanning range of 5–80.
4) HRTEM: By using HRTEM, the structure and composition information of nanoparticles can be obtained by combining the results of high-resolution image and energy spectrum analyses. The Japanese electronic JEM-2100 was used.
5) FTIR: This method is based on the principle of Fourier transform of infrared light after the interference and development of an infrared spectrometer, which can qualitatively and quantitatively analyze the samples. It is widely used in medicine and chemical industries, geology and mining, petroleum, coal, environmental protection, and other fields. The German Bruker VERTEX 70 RAMI Fourier infrared spectrometer was used. The experimental conditions were set as follows: RES 2.0 cm−1, scans 80, and a wavelength range of 400–4000 cm−1.
6) TGA: TGA is commonly used to determine the loss or gain in the mass of a selected material property through decomposition, oxidation, or evaporation, such as moisture. The Japanese HITACHI STA7300 thermal analyzer was used. To obtain coal sample reaction kinetic parameters, the experimental conditions were set as follows: heating rate of 10°C/min, an air atmosphere, air flow rate of 200 mL/min, and the control temperature was increased from room temperature to 1,000°C.
The activation energy of the reaction was calculated using the Coats–Redfern integration method. Considering the reaction process as a first-order reaction, the Arrhenius law calculates the reaction rate of a relevant coal-like reaction as follows:
The kinetic parameters of the test coal sample were calculated using the aforementioned formula. The vertical
Some researchers have used the test results of XPS, XRD, FTIR, and 13C-NMR to determine the characteristics of oxidation and spontaneous combustion of coal. However, due to some subjective factors in the construction of the model, the model may not be precise enough. There are also many structures and types of coal, and hence a single model is not suitable for coal samples in different regions. The results of experimental tests carried out in this paper were analyzed using ChemDraw, Materials Studio, and Origin software to construct structural models. The accuracy of the aromatic structures was verified by HRTEM data processed using MATLAB software, showing that the current model is more credible than previous researchers’ models. In addition, the activation energy, functional group composition, and aromatic structure lattice combined analysis can better reflect the characteristics of oxidation and spontaneous combustion of the coal sample.
3 Results of construction of coal molecular structure
3.1 Coal molecular structure
3.1.1 13C-NMR test results
13C-NMR profiles of coal samples were peaked using Origin software, and the fitting results are shown in Figure 1. The minimum constant was selected as the baseline, and the phase and baseline of the map were corrected. Furthermore, the relevant parameters of the half-peak width and peak intensity of the peaks were optimized according to the different chemical shifts belonging to the different carbon atom types. The split peak fitting map characterized the presence of three obvious carbon peaks in the coal sample, namely, fatty carbon peaks at 0–80 ppm, aromatic carbon peaks at 100–165 ppm, and base and carboxyl peaks at 175–230 ppm. The corresponding parameters of the absorption peak, such as peak position and relative content of each functional group, are shown in Tables 2, 3.
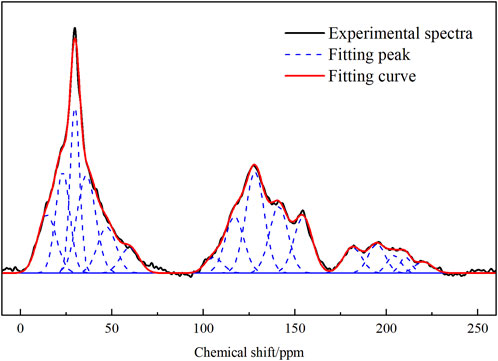
FIGURE 1. 13C-NMR peak fitting spectrum of the coal sample.
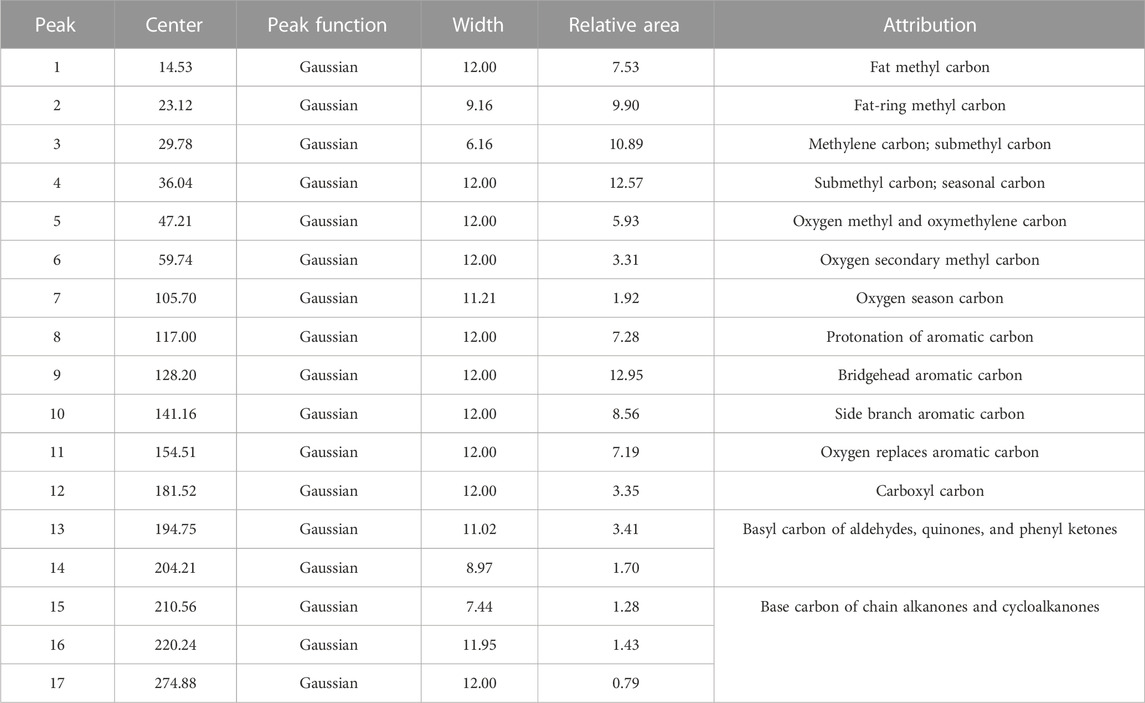
TABLE 2. Structural parameters of 13C-NMR peak fitting.

TABLE 3. Structural parameters of the coal sample.
As shown in Table 2, the C structure in the coal sample is mainly dominated by an aromatic ring structure, such as the Aldehyde-based carbon, quinones, and phenyl ketones and the base carbon of chain alkenones and cycloalkanones, supplemented by chain structures, such as methyl groups and methylene groups, with different fa values (Table 3). The proportion of different carbon structures in the coal sample was distinguished. After the test results were corroborated, the type and quantity of the aromatic ring structure, including the number of carbon skeletons of the sample and the structure and quantity of carbon chains connected to the carbon skeleton, can be inferred. Thus, the carbon skeleton structure of coal samples can be determined. The carbon skeleton structure is useful in the construction of a coal-like molecular model and for the understanding of coal-like microstructures.
3.1.2 X-ray photoelectron spectroscopy test results
XPS can be used for qualitative analysis and semi-quantitative analysis. Generally, the element composition, chemical state, and molecular structure of the sample surface can be obtained from the peak position and peak shape of the XPS map, and the element content or concentration of the sample surface can be obtained from the peak strength. The occurrence patterns of carbon, oxygen, nitrogen, and sulfur and its corresponding chemical environment were obtained using the X-ray optoelectronic energy spectrum. The results and data analysis are shown in Figure 2 and Table 4, respectively. In the coal sample, C of aromatic carbon, fatty carbon (C–C and C–H), oxygenated carbon (C–OH and C–O–C), and base carbon (C=O) were mainly used. The oxygen in coal was mainly organic oxygen (C–O, C=O, and COO-), inorganic oxygen, and adsorbed oxygen. Pyrrole nitrogen (N-5) and pyridine nitrogen (N-6) belonged to the aromatic conjugate system with strong stability. There was a lower sulfur content in coal, mainly for alcohol thiol, sulfone sulfur, and inorganic sulfur. According to the XPS peak fitting results, the proportion of different elements in coal samples can be obtained. Combined with FTIR test results, we can better judge the carbon skeleton characteristics, oxygen-bearing functional group characteristics, and the existence morphology of N and S.
FIGURE 2. XPS spectrum of the coal sample. The occurrence pattern of carbon (A), oxygen (B), nitrogen (C), and sulfur (D) and its corresponding chemical environment were obtained using the X-ray optoelectronic energy spectrum.
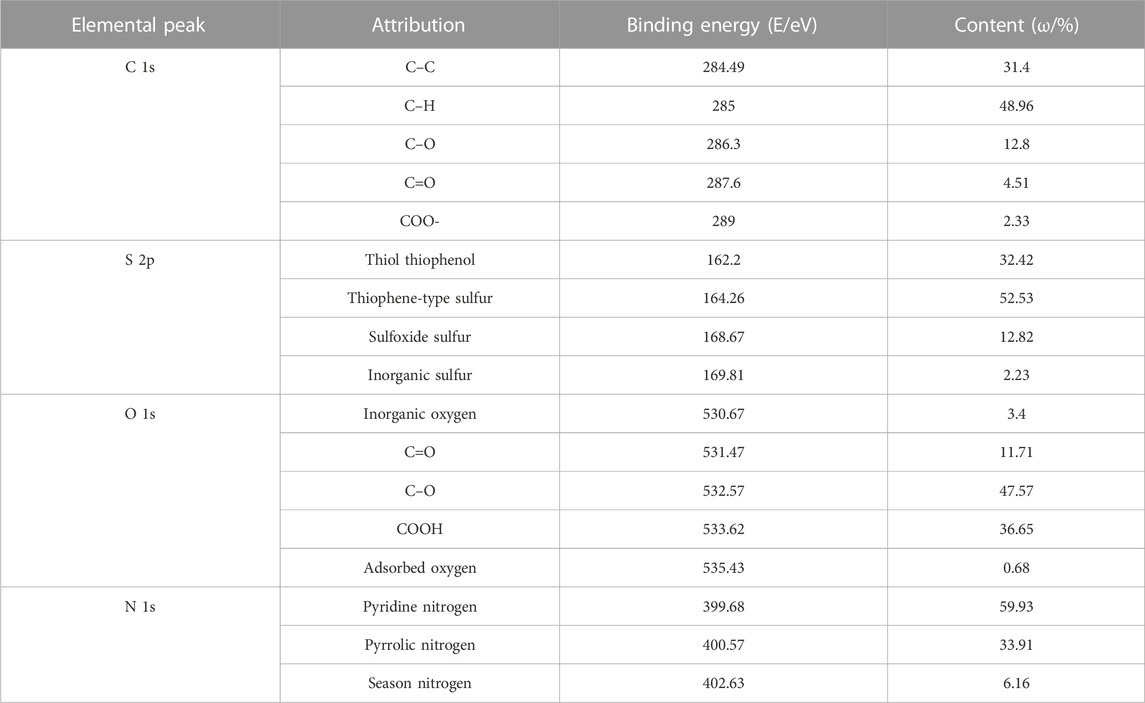
TABLE 4. Analysis results of C 1s, O 1s, N 1s, and S 2p.
The signal obtained by whole spectrum analysis is rough, with only a rough scan of the elements to determine whether and where the elements are present. Through the obtained surface composition information, the number of other elements can be roughly determined by combining it with the inferred carbon skeleton information, so as to prepare for the subsequent construction of a detailed molecular structure model. Combined with the FTIR functional group analysis of raw coal, the proportion of different functional groups in the coal samples can be determined. In addition, the allocation of the number of atoms and other structural information of the carbon skeleton of the coal samples can be determined.
3.1.3 X-ray diffraction test results
The X-ray diffraction spectrum of the coal sample is shown in Figure 3, and the results of each diffraction peak parameter after fitting to 002 and 100 peaks are shown in Table 5. Coal molecules are formed by the cross-linking of aromatic ring stacking, with a side chain of fat. The XRD spectral data analysis calculates the microcrystal structure information of the coal-like aromatic structure arrangement and structural parameters of the aromatic layer. In the figure, the peaks are located between 10 and 20, as determined by the fatty branch chain linked by the condensed aromatic nucleus. The 002 peak is located between 20 and 30, reflecting the stacking height of the aromatic layer, and the resulting characteristic peak is located at approximately 35, reflecting the degree of condensation of the aromatic ring.
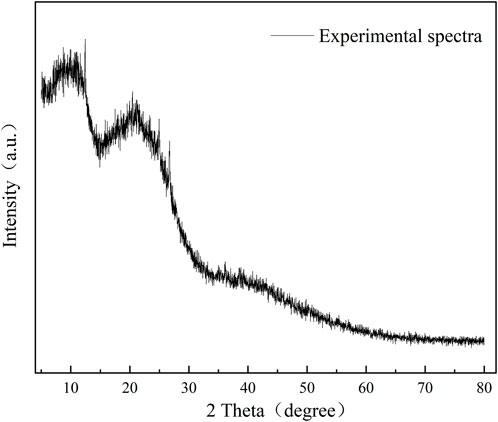
FIGURE 3. XRD pattern of the coal sample.
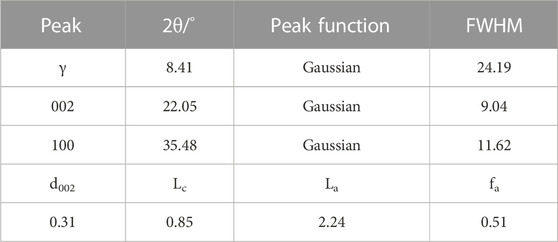
TABLE 5. XRD peak fitting of each diffraction peak parameter and microcrystalline structure parameters of the coal sample.
Using the Scherrer formula and Bragg equation, the monolayer spacing of the microcrystal structure, microcrystal stacking height perpendicular to the lattice slice, diameter size of the microcrystal parallel to the lattice slice, and the aryl carbon rate of the sample are shown in Table 5. With the degree of coal deterioration, d002 decreases and La and Lc increase. There are multiple aromatic ring structures of test coal samples, and the arrangement of the aromatic layer structure has a certain regularity. The calculated results were consistent with 13C-NMR test calculations.
3.1.4 High-resolution transmission electron microscopy test results
HRTEM technology is widely used in the microstructure analysis of carbon materials such as coal. Lattice stripe images can reflect the internal structural information of coal samples. In the quantitative analysis, five images of different edge areas of each sample were selected for analysis, and the 11-sized square pictures (a) were cut from 5 nm test images using DigitalMicrograph software. The image was imported into MATLAB to perform Fourier transform and translation (b), ring filtering and display amplitude mapping (c), Fourier inverse transform (d), and binarization and display (e), and the connectivity area <150 was removed and the stripe length distribution was calculated, as shown in Figure 4. The distribution proportion of the aromatic sheets of the coal sample under different temperatures is shown in Figure 4. The content of 2 × 2 is the highest, and 3 × 3 and 1 × 1 and other aromatic sheets are relatively diminutive, which can correspond to the number of aromatic structures calculated in the molecular model construction.
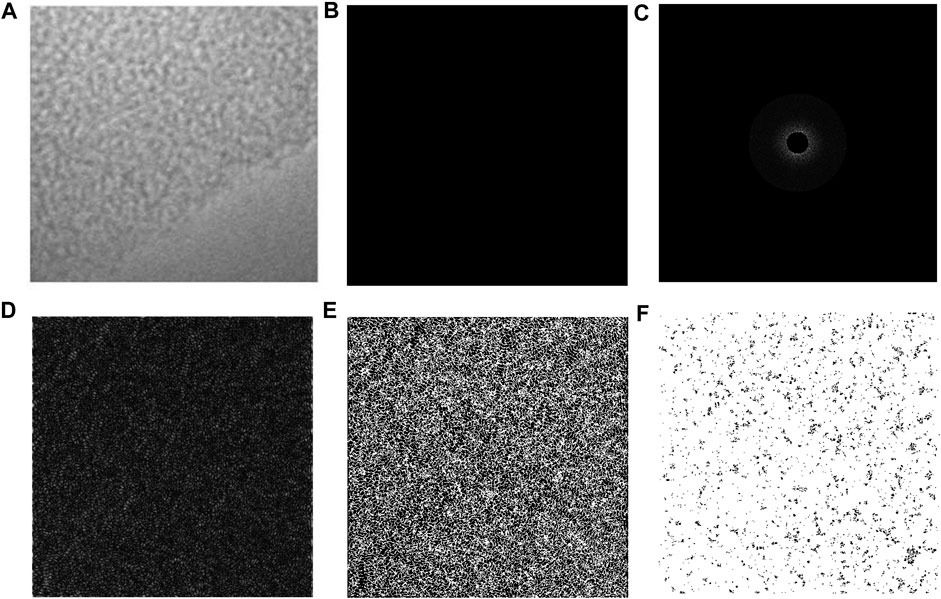
FIGURE 4. HRTEM image processing flow. The 11-sized square pictures (A) were cut from 5 nm test images using DigitalMicrograph software. The image was imported into MATLAB to perform Fourier transform and translation (B), ring filtering and display amplitude mapping (C), Fourier inverse transform (D), binarization and display (E), and the connectivity area <150 was removed and the stripe length distribution was calculated (F).
The analysis of XRD and HRTEM can help improve the accuracy of the aromatic ring information of raw coal samples, and the results of both tests can correspond to the results of 13C-NMR. Therefore, we can determine the type and number of aromatic rings in coal samples, so as to infer the composition of other carbon chains and functional groups.
3.2 Aromatic carbon structure
In the benzene ring structure, the benzene XBp value was 0, naphthalene XBp value was 0.25, anthene XBp value was 0.4, tetraphene XBp value was 0.5, and pentacene XBp value was 0.57. According to the 13C-NMR test results, the XBp value of 0.56 was calculated, indicating that the aromatic carbon structure in the sample was mainly tetracyclic benzene and pentacyclic benzene. In order to control the molecular volume and reduce the amount of simulation operation, the proportion of the aromatic structure was adjusted and the XBp results were analyzed. The final form and quantity of the aromatic structure of the coal sample are shown in Table 6.
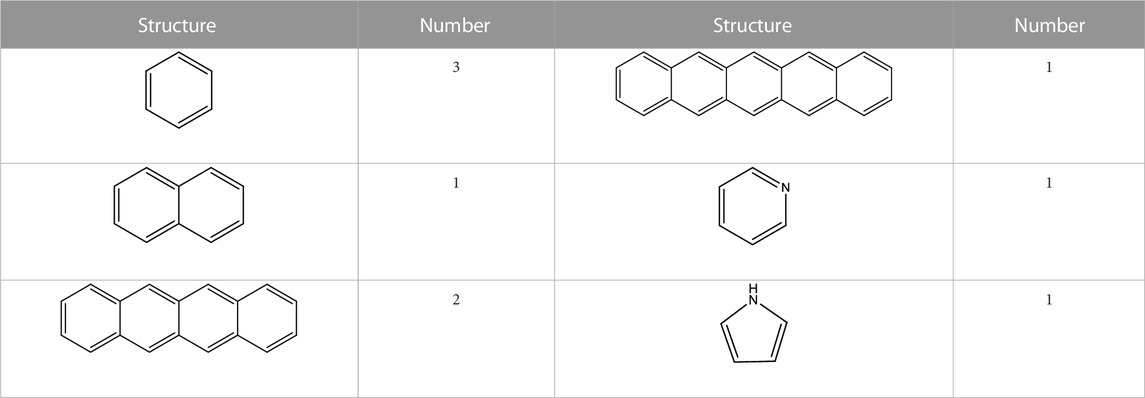
TABLE 6. Structure and quantity of the coal sample.
3.3 Fat-carbon structure
The adipose carbon structure in coal samples is mainly branched, and the lesser the deterioration of coal samples, the longer the length of the molecular side chain. The fat rate of the coal sample was 52.05%, the total aromatic carbon in the coal sample was 95, the total number of carbon atoms was 198, and the number of fat carbon atoms was 103. The number of hydrogen atoms in the coal sample was calculated as 164. The fat-carbon structure of the molecular configuration of the coal molecular model was mainly methyl, submethyl, and quaternary carbon.
3.4 Heteroatom structure
In addition to the main component of carbon, coal also contains heteroatomic structures. From the elemental analysis results of the XPS experiment, the numbers of O, N, and S atoms were 40, 2, and 0, respectively. The content of S was only 0.22%, and the number of S atoms calculated in the coal molecular model construction was 0.43. The number of S atoms was less than 1, so S was not considered in the model construction. The estimated coal molecular formula was C198H164O40N2. Without the adsorbed oxygen and inorganic oxygen content, there were 19 C–O ether oxygen bonds, five C=O groups, and 15 COO carboxyl groups. From the characterization of N 1s using XPS, there was one pyridine and one pyrrole present in the molecular configuration.
3.5 The molecular structure model of coal
The coal-like planar molecular structure model, as shown in Figure 5A, was constructed in order to calculate the chemical shift in the carbon atoms. The NMR carbon spectrum was simulated and compared with the experimental NMR carbon spectrum and optimized and adjusted using FTIR and XRD, as shown in Figure 5B. The optimized model structure is shown in Figures 5C,D. The optimized valence electron energy, non-bond energy, and bond scaling energy decreased; the electrostatic energy and hydrogen bond were relatively reduced; the total energy of the model was reduced; and the non-bond potential energy was relatively large.
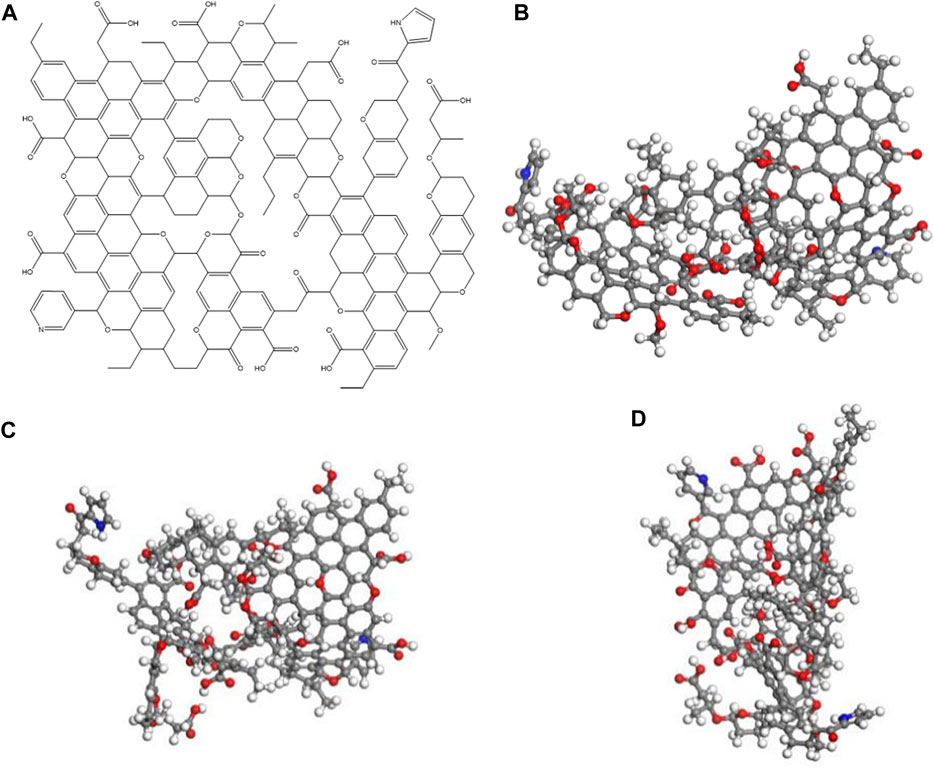
FIGURE 5. Molecular structure plane model of the coal sample (A). Three-dimensional structure of the coal sample (B). Optimized structure model of the coal sample (C) and (D).
4 Discussion
4.1 Analysis of high-resolution transmission electron microscopy
As shown in Figure 6A, the content of low aromatic layers at 1 × 1 (naphthalene) and 2 × 2 fluctuates, showing a trend of first increasing at 50°C and 250°C and then decreasing at 150°C and 450°C. The medium aromatic layers 3 × 3 and 4 × 4 increase with the temperature, and other high aromatic layers show a trend of first decreasing at 50°C and 250°C and then increasing at 150°C and 450°C. Temperatures of 150°C, 250°C, and 450°C can correspond to the activity temperature, pyrolysis temperature, and maximum weight loss rate temperature of the coal sample, respectively, indicating a correlation between the distribution of aromatic sheets and the phase of the coal–oxygen reaction. From room temperature to 150°C (water evaporation stage), which has a higher aromatic layer with low rings, the condensation reaction may occur when the temperature reaches 100°C. Low and high ring numbers are low, indicating a distribution of the aromatic layer and the thermolysis temperature of the coal–oxygen reaction; however, there are some fluctuations, which may be due to unstable miscellaneous base shedding such as oxygen-containing functional groups. The structural defects of the aromatic unit decreased, the side chain condensed, and the aromatic sheet content of high ring numbers increased.
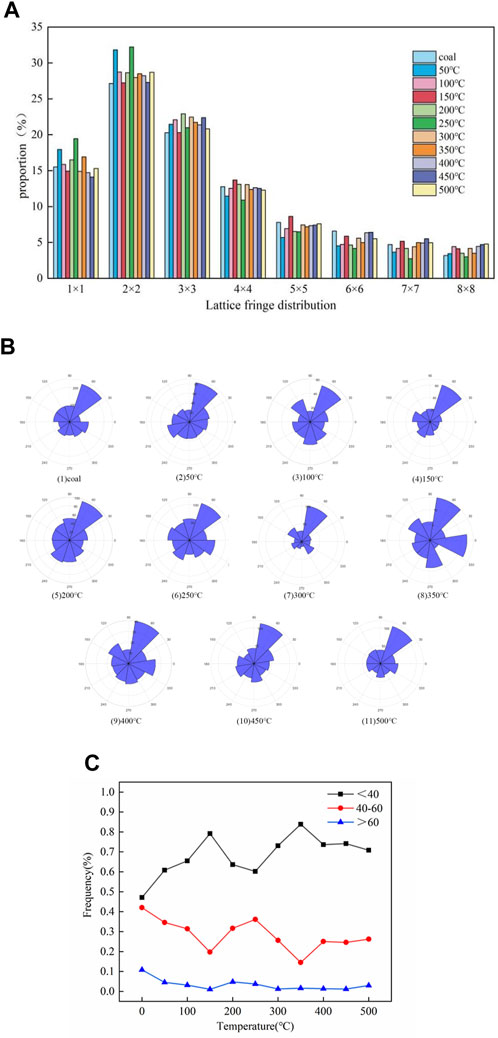
FIGURE 6. Fringe length distribution of the aromatic layer of the coal sample (A). Fringe angle distribution of the aromatic layer of the coal sample (B). Pore size distribution in coal samples (C).
As the content of coal seam deepens, the orientation of the aromatic layer tends to become orderly, and the arrangement order of local structures cannot represent the whole structure of coal. Therefore, orientation distributions of all lattice fringes extracted from each residual sample are analyzed. The slope of the line between the two endpoints of the lattice fringe was taken as the directional angle, converted to 0°–360°, and counted at intervals of 10°, as shown in Figure 6B.
Lattice stripes of coal samples are mainly distributed in four directions: 40°–70°, 110°–140°, 220°–250°, and 290°–320°. From a low temperature to a high temperature, the order of ambient temperature to 350°C becomes worse as a result of the large-scale polymerization of the aromatic lamellae produced early. During the polymerization process, the size of the intermediate lamella increases and the position of the lamella is rearranged. The order of the aromatic layer is enhanced at >400°C. The reason may be that the smaller aromatic layer produced by the splitting of oxygen-containing heterocyclic rings and ether bonds on the aromatic structure will move toward the direction of the lowest potential energy. With the increase in the heat treatment temperature, the orientated lattice has a directional tendency. It can be seen from the figure that the striations tend to move toward the directions of 110°–120° and 50°–60°, which proves that the coal sample may belong to low-rank coal.
Figure 6C shows the pore size distribution of aromatic structures, most of which occur in the range of 20–60. After heat treatment, the frequency of larger pore sizes decreases significantly. Non-six-membered rings and lattice defects lead to fringe bending, and the relationship between the pore and molecular structure does not exist independently. Different temperature treatments have different fringe distributions and pore size distributions, which leads to different aggregation states of coal and reshapes the heterogeneity of coal, showing the distribution of the cumulative fringe angle of coal samples. Most curved edges have a high curvature. The cumulative angle is related to the length of the stripes, where long stripes have more segmented angles. After high-temperature treatment, the overall orientation of the coal sample striations is spectacular, but a single striation expresses a large bend, and most of the curved striations are more refurbished in short striations.
Figure 6C shows the frequency variation with the temperature gradient for the pore size of a coal sample divided into 20–40, 40–60, and 60–80. It can be seen that the frequency of 60–80 aperture basically does not change much, and the frequency change of 20–40 and 40–60 shows an opposite trend at 150°C and 350°C, respectively; in addition, 20–40 mainly shows an upward trend, and 40–60 mainly shows a downward trend. The activity of the reaction is directly related to the pore size distribution of the coal sample and the pore size distribution on the surface of the coal sample changes the specific surface area of the coal sample, thereby affecting the activation energy of the coal–oxygen reaction. It can be seen from the figure that 150°C is the water loss and oxygen absorption temperature of the coal sample, and 350°C is the combustion temperature of the coal sample. Corresponding to the change in activation energy of the coal sample with a temperature gradient, it can be seen that the higher the frequency of the small pore size in the coal sample, the larger the specific surface area of the coal sample and the higher the activation energy of the reaction.
4.2 Analysis of Fourier infrared spectroscopy
For peak fitting of the infrared spectrum map of the coal sample, the infrared spectrum fitting results are shown in Figure 7, and the parameters and corresponding attributions are shown in Table7. The fitting results in the 700 nm−1–900 nm−1 range are shown in Figure 7A. This band has aromatic functional groups and curved vibrations outside the C–H bond surface, representing different substitution modes of the benzene ring. The fitting results in the 1000 nm−1–1800 nm−1 range are shown in Figure 7B, including the expansion vibration of the C=C double bond and the deformation vibration of CH3-, CH2-, and oxygen-containing functional groups. The fitting results in the 2800 nm−1–3000 nm−1 range are shown in Figure 7C, with the C–H expansion vibration of a saturated fat hydrocarbon. The fitting results in the 3000 nm−1–3600 nm−1 range are shown in Figure 7D, which corresponds to the hydroxyl structure.
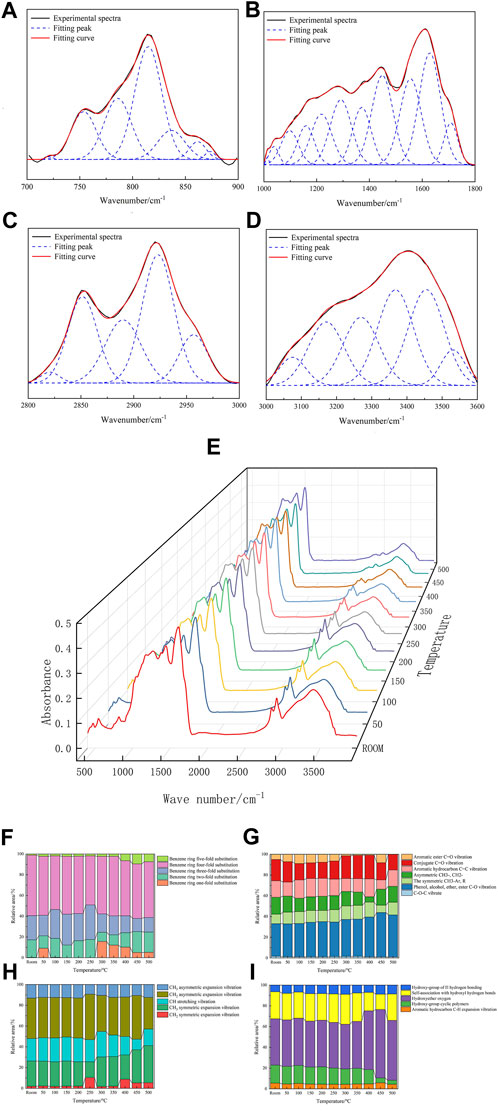
FIGURE 7. Infrared spectrum fitting of the coal sample (A–D). FTIR test results at different temperatures (E). Changes in functional groups of coal samples at different temperatures (F–I).
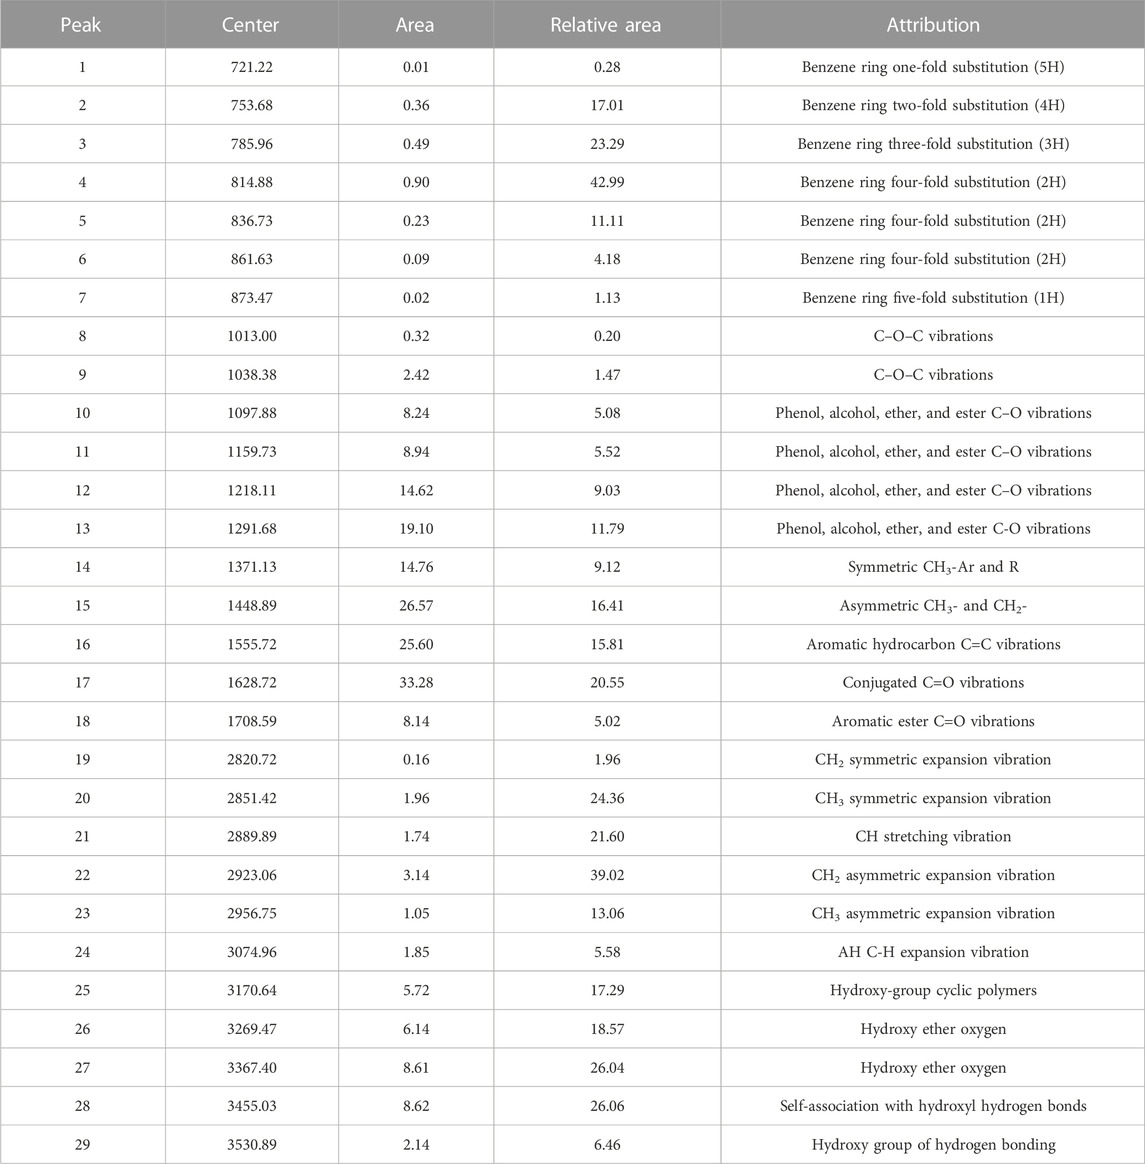
TABLE 7. Functional groups of coal.
The heated coal samples (room temperature to 500°C) were tested using FTIR. Figure 7E shows the infrared spectrum of the coal samples at different temperatures. The main functional group peak area of the spectrum is shown in Figures 7F–I; the functional group in the infrared spectrum of the 700–900 band has the lowest proportion of substitution at benzene ring five, and the proportion of substitution at benzene ring five increases with the temperature. At 300°C, the substitution at benzene ring one has the lowest proportion of 8.78%. At less than 300°C, the substitution at benzene ring two increases with the temperature to 12.74% with the 1000–1800 band and increases further. With symmetric CH3-Ar, R gradually increases, and the aromatic ester C=O vibration gradually decreases. The reaction occurs mainly with functional groups such as aromatic ester C=O vibrations and with the formation of phenol, alcohol, ether, ester, and other functional groups. In the IR spectrograph of the 2800–3000 band, the CH expansion vibration gradually decreases. There are mainly CH expansion vibration, CH2 asymmetry expansion vibration, CH3 asymmetry expansion vibration, and other functional groups that participate in the reaction and generate CH2 symmetrical expansion vibration, CH3 symmetrical expansion vibration, and other functional groups. In the IR map 3000–3600 band, the proportion of hydroxycyclic polysome to self-association hydroxy hydrogen bonds decreases. More functional groups, such as hydroxyl ether oxygen, hydroxyl hydrogen bonds, hydroxy-ring polymers, and freely associated hydroxy hydrogen bonds, are mainly involved in the reaction, and hydroxy ether oxygen functional groups and hydroxyl hydrogen bonds are generated.
The structure of fat functional groups and aromatic groups in coal also affect the distribution of pores in coal. The distribution of fat structure affects the orientation of stripes. Aggregation in coal is a large molecular group formed between molecules with different aromatic structures and fat structures, which are formed by the interaction of defects and pores within molecular groups. The structural differences in different treatments reflect the interaction results of different macromolecules in coal.
The microscopic characteristic of spontaneous combustion of coal is the change in the internal functional groups of coal molecules. The less the number of active groups in the coal structure, the lower the coal spontaneous combustion tendency. However, the more the oxygen-containing functional groups and alkyl side chains in the coal structure, the lower the hydrocarbon content and the more likely the coal is to spontaneously ignite. Deep condensation of the aromatic ring and the content of adipose hydrocarbon, hydroxyl groups, and alkyl ether decrease, and spontaneous combustion of coal decreases. The content of CH3, CH2, and oxygen of the functional group more likely leads to spontaneous combustion.
4.3 Analysis of thermogravimetric analysis
According to the thermal weight experiment data, the thermal weight curve was obtained as shown in Figure 8A. In the coal sample, the active temperature of coal T1 is the turning point temperature of water loss and oxygen absorption. The pyrolysis temperature T2 is the temperature of the maximum value point of the coal sample. T3 is the intersection point of the burning temperature, and T5 is the point where the oxygen reaction tends to end.
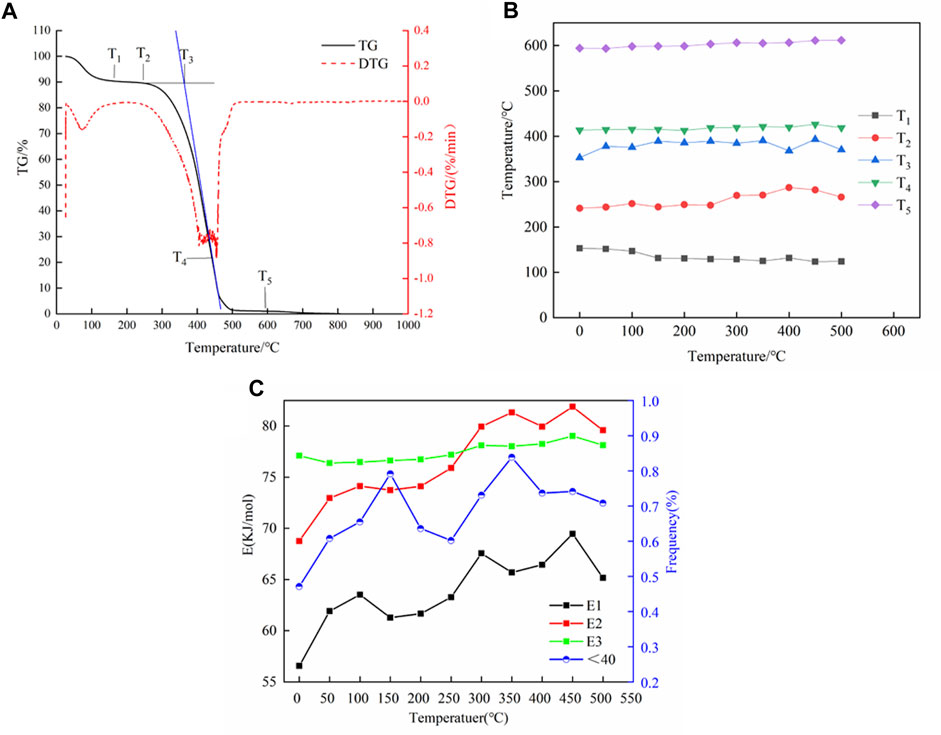
FIGURE 8. Characteristic temperature of coal (A). Characteristic temperature based on the thermal weight analysis data (B). Reaction activation energy (C).
Based on the thermal weight analysis data, the characteristic temperature is shown in Figure 8B. It can be seen that with the increase in the treatment temperature, the T1 temperature value illuminates a downward trend, indicating that water evaporation in the coal samples accelerates with an increase in the temperature, resulting in earlier oxygen absorption and weight increase phases. The temperature value of T2 denotes an upward trend and no longer increases after 400°C. The treatment temperature at 350°C is significantly higher than that of other treatment temperatures. The coal sample does not easily combine with oxygen under treatment at this temperature. Compared with other characteristic temperature values, T3 can characterize the complicated spontaneous combustion. T4 and T5 showed little change, but a slight upward trend, indicating that the end temperature of the coal sample reaction is higher with the increase in the treatment temperature.
The spontaneous combustion of coal is a process of continuous heating. In the process of heating up, the structure of coal molecules will change, and coal spontaneous combustion is also related to activation energy. The change in activation energy also causes a change in the structure of coal. The activation energy of the coal–oxygen reaction is closely related to the reaction rate. The lower the activation energy, the quicker the reaction rate and the more likely the reaction to occur. The apparent activation energy is obtained in the oxygen absorption, heating decomposition, and combustion stages of the coal–oxygen reaction, and the activation energy of coal samples at different treatment temperatures is shown in Figure 8C. In the oxygen absorption and weight increase stages, the apparent activation energy value of coal samples increased first with the treatment temperature but decreased slightly at 150°C, 350°C, and 500°C, indicating that the increase in temperature is not conducive to oxygen absorption and weight increase in coal samples. The reaction activation energy in the thermal decomposition phase increases with the increase in treatment temperature, which is consistent with the change trend of the oxygen absorption phase. However, in the later stage, the coal structure may change to a certain extent due to the high temperature, resulting in a change in adsorption capacity. The reaction activation energy of the combustion phase increases with the increase in the treatment temperature, likely because the reaction in the oxygen absorption phase accumulates the coal-like energy, providing a basis for the chain reaction, which leads to the increase in the activation energy.
The activation energy is also correlated with the distribution of the aggregate and aromatic structure and pore size of coal. Among them, the content of the aromatic layer and the activation energy of the reaction show a similar trend, and the activation energy and the accumulation angle of different degrees followed a similar law. As can be seen from Figure 8C, the activation energy of the coal–oxygen reaction and the overall trend of the pore size distribution of coal–oxygen <40 are both increasing and correlated with the characteristic temperature. This may be because with the increase in the coal treatment temperature, the volatile substances in the coal sample gradually precipitate, resulting in the increase in the proportion of small molecules in the coal sample. In addition, after temperature gradient treatment, the combustible part of the coal sample is gradually converted into non-combustible ash substances, so the activation energy of the reaction and the proportion of the small aperture increase.
5 Conclusion
In this study, the molecular structure model of Baishihu coal was determined using XRD, XPS, FTIR, and 13C-NMR. The structure of coal was optimized based on quantum chemistry. Combined with the kinetic characteristics, functional groups, and aromatic structure characteristics, the oxidation and spontaneous combustion characteristics of coal were characterized. Hence, the following conclusions are made:
The estimated coal molecular formula is C198H164O40N2. The carbon content of coal is 63.86%, and the degree of aromatic ring condensation is low. The main structures of the aromatic group are benzene rings and naphthalene. The aromatic ring structure shown by the HRTEM results is consistent with the constructed coal molecular structure model. As the treatment temperature increases, in the water evaporation stage, the high-ring aromatic layer is converted into a low-ring number. In the high-temperature stage, the low-ring aromatic layer is transformed due to the coking and condensation reaction of the coal sample. After heat treatment, the aggregate structure and pore size of coal have a high correlation with the activation energy. The distribution frequency of a small aperture on the coal sample surface affects the specific surface area of coal samples, thus affecting the activation of the coal–oxygen reaction. The C element in the coal sample mainly participates in the reaction in C–C and C–H forms. The spacing and effective number of aromatic layers are relatively stable. The aggregation state of coal is a macromolecular group formed between molecules with different aromatic structures and fat structures, which is formed by the interaction of internal defects and pores of molecular groups.
In this study, the molecular structure model of coal was constructed more accurately by using HRTEM data. Combined with the characteristics of reaction activation energy, functional group change, aromatic structure, and porosity, the characteristics of coal during the heating process are clarified. The study provides ideas for the comprehensive utilization of coal resources.
Data availability statement
The original contributions presented in the study are included in the article/Supplementary Material; further inquiries can be directed to the corresponding author.
Author contributions
WZ: writing, methodology, software, and analysis. QZ: writing—review and editing, conceptualization, supervision, funding acquisition, and project administration. All authors contributed to the article and approved the submitted version.
Funding
This work was supported by the National Natural Science Foundation of China [Grant Number 51974275] and the Science and Technology Department of Xinjiang Uygur Autonomous Region [Grant Number 2021D14018].
Conflict of interest
The authors declare that the research was conducted in the absence of any commercial or financial relationships that could be construed as a potential conflict of interest.
Publisher’s note
All claims expressed in this article are solely those of the authors and do not necessarily represent those of their affiliated organizations, or those of the publisher, the editors, and the reviewers. Any product that may be evaluated in this article, or claim that may be made by its manufacturer, is not guaranteed or endorsed by the publisher.
References
Baysal, M., Yurum, A., Yildiz, B., and Yurum, B. (2016). Structure of some Western Anatolia coals investigated by FTIR, Raman, 13C solid state NMR spectroscopy and X-ray diffraction. Int. J. Coal Geol. 163, 166–176. doi:10.1016/j.coal.2016.07.009
Chen, H., Wang, S., Tang, Y., Zeng, F., and Zhang, X. (2021). Aromatic cluster and graphite-like structure distinguished by hrtem in thermally altered coal and their Genesis. Fuel 292 (8), 120373. doi:10.1016/j.fuel.2021.120373
Ding, L., and Zeng, Q. (2022). Study on characteristics of coal spontaneous combustion in kerjian mining area, Xinjiang, China. Minerals 12 (12), 1508. doi:10.3390/min12121508
Ghosh, S., Ojha, A., and Varma, A. K. (2020). Spectral manifestations of coal metamorphism: Insights from coal microstructural framework. Int. J. Coal Geol. 228, 103549. doi:10.1016/j.coal.2020.103549
Hower, J. C., Berti, D., Winkler, C. R., Qian, D., and Briot, N. J. (2022). High-resolution transmission electron microscopy study of a powder river basin coal-derived fly ash. Minerals 12 (8), 975. doi:10.3390/min12080975
Jaiswal, Y., Pal, S. L., Jain, A., Kush, L., Jaiswal, H., and Srivastava, S. (2021). A multi-tool structural change investigation of Indian vitrinite rich bituminous coal due to CS2/NMP interaction. J. Mol. Liq. 323, 114599. doi:10.1016/j.molliq.2020.114599
Jaiswal, Y., and Pal, S. L. (2020). Structural characterization of Indian vitrinite-rich bituminous Karharbari Coal. ACS omega 5 (12), 6336–6347. doi:10.1021/acsomega.9b03674
Jing, Z., Rodrigues, S., Strounina, E., Li, M., Wood, B., Underschultz, J. R., et al. (2019). Use of FTIR, XPS, NMR to characterize oxidative effects of NaClO on coal molecular structures. Int. J. Coal Geol. 201, 1–13. doi:10.1016/j.coal.2018.11.017
Lei, Z., Yang, D., Zhang, Y. H., and Cui, P. (2017). Constructions of coal and char molecular models based on the molecular simulation technology. J. Fuel Chem. Technol. 45 (7), 769–779. doi:10.1016/s1872-5813(17)30038-5
Li, X., and Zeng, Q. (2022). HRTEM analysis of the aggregate structure and ultrafine microporous characteristics of Xinjiang Zhundong coal under heat treatment. Sci. Rep. 12 (1), 4994. doi:10.1038/s41598-022-09113-z
Lin, B., Zha, W., and Liu, T. (2019). Experimental study on molecular structure differences between the tectonic coal and primary coal in Pingdingshan coalfield. Vib. Spectrosc. 103, 102930. doi:10.1016/j.vibspec.2019.102930
Manoj, B. (2016). A comprehensive analysis of various structural parameters of Indian coals with the aid of advanced analytical tools. Int. J. Coal Sci. Technol. 3, 123–132. doi:10.1007/s40789-016-0134-1
Moroeng, O. M. (2022). Effects of contact metamorphism on δ13C, δ15N, and XPS nitrogen functional forms of inertinite-rich Witbank coals (South Africa): Indications for possible alteration by hydrothermal fluids. Chem. Geol. 612, 121135. doi:10.1016/j.chemgeo.2022.121135
Niekerk, D. V., and Mathews, J. P. (2010). Molecular representations of Permian-aged vitrinite-rich and inertinite-rich South African coals. Fuel (Lond). 89, 73–82. doi:10.1016/j.fuel.2009.07.020
Ping, A., Xia, W., Peng, Y., and Xie, G. (2020). Construction of bituminous coal vitrinite and inertinite molecular assisted by 13C NMR, FTIR and XPS. J. Mol. Struct. 1222, 128959. doi:10.1016/j.molstruc.2020.128959
Pudasainee, D., Kurian, V., and Gupta, R. (2020). Coal: Past, present, and future sustainable use. Future Energy, 21–48. doi:10.1016/B978-0-08-102886-5.00002-5
Qin, Z. (2018). New advances in coal structure model. Int. J. Min. Sci. Technol. 28 (4), 541–559. doi:10.1016/j.ijmst.2018.06.010
Sen, K., and Dash, P. S. (2020). Quantum chemical perspective of coal molecular modeling: A review. Fuel 279, 118539. doi:10.1016/j.fuel.2020.118539
Tahmasebi, A., Yu, J., Han, Y., and Li, X. (2012). A study of chemical structure changes of Chinese lignite during fluidized-bed drying in nitrogen and air. Fuel Process. Technol. 101, 85–93. doi:10.1016/j.fuproc.2012.04.005
Vranjes-Wessely, S., Misch, D., Issa, I., Kiener, D., Fink, R., Seemann, T., et al. (2020). Nanoscale pore structure of carboniferous coals from the Ukrainian donets basin: A combined HRTEM and gas sorption study. Int. J. Coal Geol. 224, 103484. doi:10.1016/j.coal.2020.103484
Wang, C., and Zeng, F. (2020). Molecular structure characterization of CS2–NMP extract and residue for malan bituminous coal via solid-state 13C NMR, FTIR, XPS, XRD, and CAMD techniques. Energy & Fuels 34 (10), 12142–12157. doi:10.1021/acs.energyfuels.0c01877
Wang, Q., Zhang, J., Li, H., Zhang, H., Bai, H., and Guo, Q. (2022). Exploring molecular structure characteristics and chemical index of qinghua bituminous coal: A comprehensive insight from single molecule of macerals to particles with various sizes. Powder Technol. 396, 36–49. doi:10.1016/j.powtec.2021.10.035
Yin, N., Song, Y., Wang, C., Zhang, X., Wu, L., Jing, X., et al. (2022). Molecular structure model construction and pyrolysis characterization of four typical coals: A case study. Energy Sources, Part A Recovery, Util. Environ. Eff. 44 (3), 6837–6855. doi:10.1080/15567036.2022.2103212
Yuan, L., Liu, Q., Mathews, J. P., Zhang, H., and Wu, Y. (2021). Quantifying the structural transitions of Chinese coal to coal-derived natural graphite by XRD, Raman spectroscopy, and HRTEM image analyses. Energy & Fuels 35 (3), 2335–2346. doi:10.1021/acs.energyfuels.0c04019
Zeng, Q., and Shen, L. (2022). Experimental study on the oxidation kinetics of coal in typical coal mining areas of the Southern Junggar coalfield, Xinjiang, China. Int. J. Coal Sci. Technol. 9 (1), 78. doi:10.1007/s40789-022-00542-9
Zeng, Q., Shen, L., and Yang, J. (2020). Potential impacts of mining of super-thick coal seam on the local environment in arid Eastern Junggar coalfield, Xinjiang region, China. Environ. Earth Sci. 79, 1–15. doi:10.1007/s12665-020-8806-y
Zhang, S., Wang, Z., Zhang, X., Wei, J., and Chen, F. (2022). Construction of molecular structure model of Tunlan coal and its microscopic physicochemical mechanism. Fuel 308, 121936. doi:10.1016/j.fuel.2021.121936
Zhang, Y., Hu, S., Zhong, Q., Zhuo, J., and Mathews, J. P. (2021). A large-scale molecular model of Fenghuangshan anthracite coal. Fuel 295, 120616. doi:10.1016/j.fuel.2021.120616
Keywords: coal oxidation and spontaneous combustion, coal molecular structure, HRTEM, 13C-NMR, FTIR
Citation: Zhang W and Zeng Q (2023) Characteristics of coal oxidation and spontaneous combustion in Baishihu Mine, Xinjiang, China. Front. Earth Sci. 11:1208803. doi: 10.3389/feart.2023.1208803
Received: 19 April 2023; Accepted: 13 June 2023;
Published: 03 July 2023.
Edited by:
Claudia Belviso, National Research Council (CNR), ItalyReviewed by:
Moshood Moshood, University of Namibia, NamibiaJian Zhang, Henan Polytechnic University, China
Copyright © 2023 Zhang and Zeng. This is an open-access article distributed under the terms of the Creative Commons Attribution License (CC BY). The use, distribution or reproduction in other forums is permitted, provided the original author(s) and the copyright owner(s) are credited and that the original publication in this journal is cited, in accordance with accepted academic practice. No use, distribution or reproduction is permitted which does not comply with these terms.
*Correspondence: Qiang Zeng, emVuZ3FpYW5nQHhqdS5lZHUuY24=