 Feng Han1*
 Chengxiang Wang
- 1School of Civil Engineering, Lanzhou Jiaotong University, Lanzhou, Gansu, China
- 2China Railway Design Group Co, Ltd., Tianjin, China
The accumulation of sand on desert roads poses a significant threat to the smooth transportation and driving safety of these roads. To address this issue, a combined approach using the variable weight theory and cloud model theory is proposed for conducting a safety risk assessment of sand accumulation on desert roads. An evaluation index system for sand accumulation hazards is obtained through the analysis of regional geomorphological conditions, wind dynamic conditions, and engineering design factors. The evaluation index system’s constant weights are determined using the Five-Point Scale Method and Analytic Hierarchy Process. Moreover, the Variable Weight Theory is used to optimize these weights based on the actual state of the project, thereby enhancing the accuracy of risk assessment. Finally, based on the cloud model theory, a safety risk assessment model is constructed for sand accumulation hazards on desert highways. The sand accumulation hazard level of the highway is determined through this model, and the comprehensive evaluation results are visualized and presented intuitively using the MATLAB software. The experimental section of the new Wuhai-Maqin expressway sand prevention test is taken as an example for practical verification. The results show that the sand accumulation disaster level of the experimental section is grade Ⅲ, which is basically consistent with the actual engineering situation, verifying the reliability and applicability of the model. Therefore, this model could serve as an essential reference for risk assessments of sand accumulation hazards, location optimization selection, and the establishment of effective sand prevention engineering measures for desert highways.
1 Introduction
Sand accumulation hazards have always been a major factor affecting the safe operation of highways in sandstorm-prone areas and the construction of sand prevention projects. According to the “National Highway Network Planning (2013–2030)”, the construction of road channels linking the east and west of China’s central region will be strengthened to expand the coverage of the road network (Chen et al., 2020; Jiang et al., 2022). However, there are large areas of desertification in Inner Mongolia, Ningxia, Gansu, and other regions (Gao et al., 2023), where sand accumulation disasters seriously threaten transportation and driving safety, making the establishment of a sand accumulation disaster assessment model for desert highways a key issue that needs to be addressed urgently.
Sand accumulation disasters on desert roads will cause problems such as reduced visibility, reduced road friction, unstable driving conditions, and increased energy consumption. It not only increases the risk of traffic accidents, but also causes road damage and economic losses (Wang C. et al., 2020; Miri and Middleton, 2022). Mitigating the impact of sand accumulation disasters on line operations has resulted in a number of outstanding sand control workers. In the initial stages of research, some scholars used intuitive methods such as field observations to analyze the influencing factors and distribution of sand hazards on highways (Aili et al., 2006; Deng et al., 2021; Chen et al., 2022). They also provided sand control ideas tailored to specific wind and sand environments. However, their understanding of the causes, types, and characteristics of sand hazards on highways was not yet clear enough. After the establishment of China’s first wind tunnel for studying desert environments by the Lanzhou Institute of Desert Research (Qu et al., 2019), Chinese Academy of Sciences in 1965, scholars were able to use simulation experiments to conduct in-depth research on wind and sand physics and engineering theories such as sand particle motion, surface and airflow around obstacles, starting from the root of the problem (Xin et al., 2016a; Cong et al., 2019; Li et al., 2020; Xie et al., 2020). They then applied this knowledge to sand control practices, thereby reducing the severity of wind and sand disasters. In the 21st century, the development of computer technology has brought further refinement to the study of wind and sand engineering. Scholars have delved deeper into the movement patterns of sand particles in wind-blown sand flows, mechanisms of sand accumulation on highways, and measures for sand prevention and fixation using methods such as numerical simulation and modern laser technology (Yu et al., 2022; Ma, 2023; Yang et al., 2023). Ni, (2022) studied the response characteristics of wind-blown sand flow and sand accumulation under different roadbed parameters using numerical simulation. Xin et al. (2016b) studied the sand accumulation characteristics under different underlying surfaces using wind tunnel experiments and laser technology. Zhang et al. (2019) optimized the porosity and layout of sand barriers to maximize windbreak efficiency. Currently, research on the construction of wind and sand regions mainly focuses on the characteristics of wind and sand flow, and the optimization of protection system parameters. However, there is no established scientific model for predicting sand accumulation disasters on desert highways based on natural and engineering data, nor for evaluating them during operation. This lack of information cannot effectively support the needs of desert highway construction and operation. Therefore, the establishment of a scientific sand accumulation disaster assessment model for desert highways is of significant and practical importance.
Cloud model evaluation can consider the impact of multiple uncertain factors and incomplete information (Zhao, 2022). It can handle not only accurate numerical data but also fuzzy, subjective, or incomplete information. This comprehensiveness enables cloud model evaluation to provide a more comprehensive description and analysis of problems, avoiding the limitations of traditional methods that rely solely on a single indicator or data. Furthermore, the cloud model can convert expert knowledge and experience into linguistic variables. By generating membership functions through cloud drops, it incorporates expert experience into the evaluation process, thereby improving accuracy. The cloud model can transform evaluation results into linguistic variables, providing decision-makers with visualized fuzzy information to assist in making decisions. These advantages make cloud model evaluation a powerful evaluation method that can provide accurate and reliable evaluation results in complex sand and dust environments. In risk assessment, weights can help determine the relative importance of different risk factors and provide decision-makers with a more objective and accurate evaluation framework (Song et al., 2023). However, due to the abundant sand sources and frequent strong winds in desert areas, frequent sand and dust activities make it difficult to support effective evaluation using only constant weights. Variable weight theory optimizes constant weights by the state value of indicators and established equilibrium functions, enhancing the rationality and dynamic nature of weights (Li et al., 2022). In practical situations, the importance and weight of indicators may change with specific engineering environments and other factors. This mechanism of dynamically adjusting weights can reflect changes in the importance of indicators in actual situations and more accurately reflect the contribution of each indicator to the evaluation results.
In light of this, this paper integrates the theory of variable weights and the cloud model to establish a sand accumulation disaster assessment model for desert highways. By analyzing the mechanism of sand accumulation on desert highways and the coupling relationship between aeolian sand flow and engineering design parameters, an evaluation index system for sand accumulation disasters on desert highways was established. The Analytic Hierarchy Process (AHP) improved by the five-point scale method was used for weighting. To make the weight more objective and dynamic, the variable weight theory was introduced, and an equilibrium function was established to optimize the constant weights based on the actual state values of the project. During the evaluation process, the degree of membership of the evaluation cloud in the standard cloud was used to realize the evaluation of the scheme. This allowed for a prediction and evaluation of the sand accumulation at each section of the desert highway based on existing engineering data and natural data in the area. The comprehensive evaluation results were visualized and intuitively presented using MATLAB programming. Based on the evaluation results, a scientific prevention and control plan for sand accumulation disasters was implemented, and new ideas were provided for the selection of highway routes in aeolian sand areas.
2 Materials and methods
2.1 Main research framework
As shown in Figure 1, the main framework of this study includes four steps: the establishment of the desert road sand accumulation disaster assessment system, the determination and optimization of index weights, the evaluation of the cloud model and the visualization of the assessment results, and the validation and application of the model.
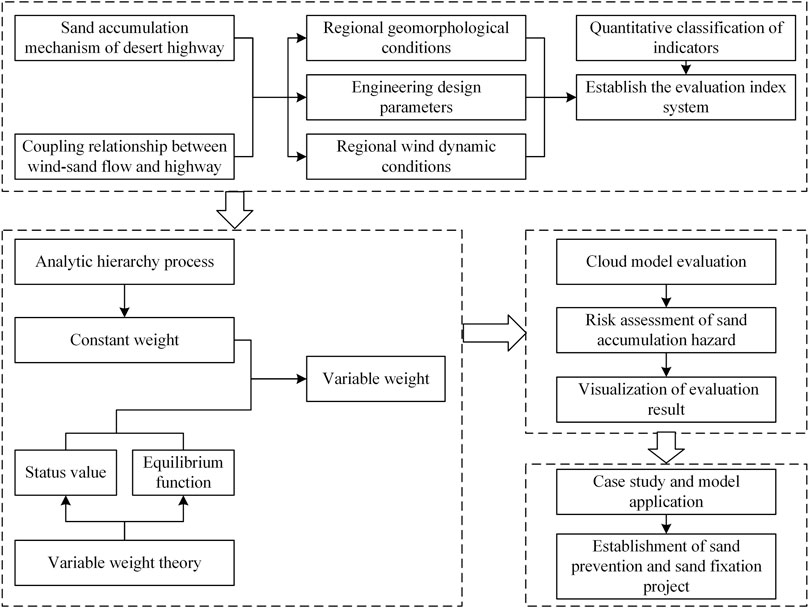
FIGURE 1. The research framework.
2.2 Mechanisms of sand accumulation disasters on desert highways
2.2.1 Sand accumulation caused by the movement of sand dunes
The sand dune itself provides the sand source for road sand accumulation. When a highway passes through a dense group of moving sand dunes, the dunes can be easily moved as a whole under the action of wind, hindering traffic. Especially when the sand dune group is low, the main wind direction is single and perpendicular to the roadbed, the sand dune moves rapidly and forms a large amount of sand accumulation on the road surface. Figure 2 illustrates that severe cases of such deposition can trigger sand burial of the road surface. On the other hand, due to the large difference in mass between the airflow and sand particles, when the running sand flow encounters a sand dune obstruction, a pressure difference is generated, and the resulting local resistance reduces the wind speed, while also weakening the energy of the airflow carrying the sand particles, causing some sand particles to deposit (Chen, 2007).
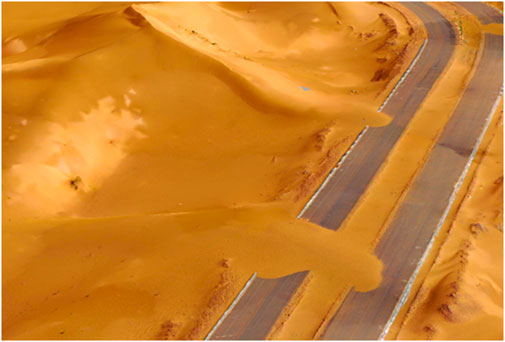
FIGURE 2. Road surface burial by sand due to sand dune movement.
2.2.2 Wind and sand flow encounter blocked sand accumulation
When the wind and sand flow pass through a saturated transit, the flow field structure of the wind and sand is affected due to the structure of the roadbed and the presence of other obstacles. The airflow velocity undergoes significant changes, with local deceleration zones and backflow zones appearing, causing a significant decrease in airflow energy, weakening the sand-carrying capacity of the wind and sand flow, and leading to sand deposition on the road surface (Zhang et al., 2008). As shown in Figure 3, obstacles such as single or multiple plants clustered on both sides of the highway can also cause sand accumulation on the road surface. The roughness of the underlying surface also affects the degree of wind and sand accumulation when encountering resistance. A smooth underlying surface generates less friction, allowing the wind and sand flow to pass through or over the obstacles. Rough obstacles on the surface can increase friction, decelerating the wind and sand flow and causing it to accumulate behind the obstacles.
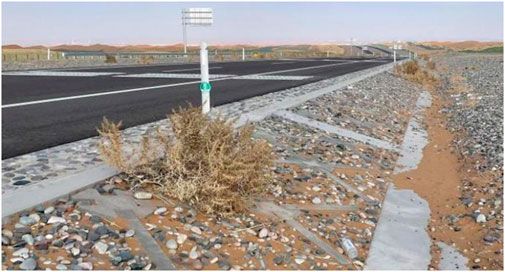
FIGURE 3. Sand accumulation due to obstacle encountered in wind-sand flow.
2.3 Establishment of the indicator system
The objectivity and accuracy of the results of a comprehensive assessment depend first and foremost on the accuracy of the selected indicators. Therefore, the establishment of an indicator system for assessment is an important foundational task in comprehensive assessment. Generally speaking, the more comprehensive the evaluation indicators chosen, the more accurately they reflect the actual project. However, too many indicators can lead to a loss of independence, which can easily reduce the scientific validity of the assessment.
The assessment index system of sand accumulation disaster is established based on the formation mechanism of highway sand accumulation, the coupling effect of wind and sand environment and highway structure, the two-phase wind and sand flow and wind and sand dynamics as the theoretical basis. Whether the results of sand accumulation disaster assessment can truly present the actual project, it is necessary to accurately characterize the wind and sand environment and the coupling effect of wind-sand flow and highway structure. Regions with severe wind and sand flow often have abundant sand sources and strong wind conditions (Xie et al., 2016; Zhuo, 2018; Wang et al., 2019; Han et al., 2022). From the perspective of providing a material foundation, the distribution of mobile sand dunes along the route, the distribution of sand sources, and the vegetation coverage will all affect the degree of sand accumulation disasters on desert highways. From the perspective of providing dynamic conditions, the dominant wind direction and wind speed, frequency of wind erosion, the particle size distribution of sand, and the form of the underlying surface can also affect the severity of sand accumulation on desert highways. According to the study on the response law of roadbeds to wind and sand flow, the roadbed as an obstacle can also affect sand accumulation on highways. The form of the roadbed, its height, the slope of the embankment, and the curve radius can all interfere with the activity of wind and sand flow. Increasing the height of the roadbed strengthens its ability to block wind, thus reducing road sand transport and increasing the likelihood of sand accumulation. Roadbeds with smaller slopes at the same height facilitate cross-sectional sand transport and decrease the degree of sand accumulation. In curved sections, a decrease in curve radius corresponds to an increase in the intensity of wind-sand flow. When the convex side of the curve is facing the wind, it diverts wind and sand-flow outwardly, while the concave side has an inward convergence effect on the wind-sand flow. Therefore, the desert road alignment should give priority to the convex side windward alignment with larger curve radius.
The use of roadbed structures is not recommended for desert highways, so this paper only focuses on embankment structures. Based on the previous analysis of the factors affecting sand accumulation on highways and the independence of various indicators, representative influencing factors were selected, and an indicator system for assessing sand accumulation disasters on desert highways was constructed, taking into account the characteristics of highway construction in desert areas. The indicator system includes three primary indicators: regional geomorphological conditions, wind dynamics conditions, and engineering design factors, as well as 10 secondary indicators, such as the height of moving sand dunes, Drift Potential, and roadbed height, as shown in Figure 4. The Drift Potential (DP) is widely used in the study of aeolian landforms or the design of sand control engineering (Xie et al., 2018). It is a scale of the wind energy for sand movement on the ground. The specific equation for calculating the Drift Potential is:
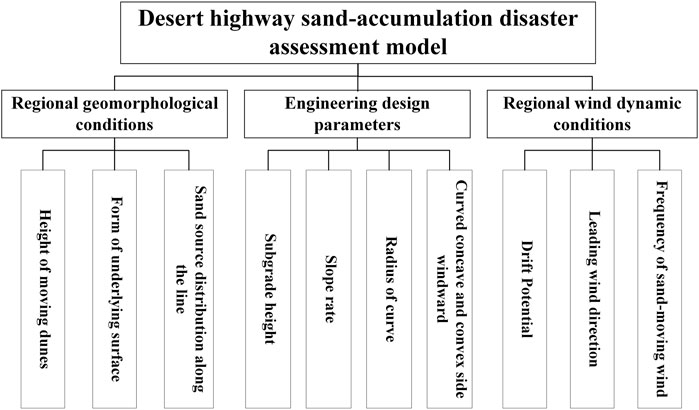
FIGURE 4. Indicator system of desert sand accumulation disaster assessment.
In the equation, DP represents the Drift Potential, with units expressed in VU. Vt and V are both in units of nautical miles per hour (nmile/h), representing the critical wind speed for sand particle movement at a height of 10 m and the wind speed greater than or equal to the critical wind speed, respectively. The variable t represents the duration of sand-moving wind, which is expressed in frequency in the text. The critical wind speed for sand particle movement is also related to the particle size distribution of the sand. Therefore, the Drift Potential is a comprehensive indicator that includes the wind speed in the study area, critical wind speed for sand particle movement, and sand particle size distribution.
2.4 Classification of desert road sand accumulation disaster level
2.4.1 Classification of sand hazard levels and protection suggestions
Sand accumulation disasters on desert highways have a significant impact on driving safety and traffic flow. In order to better evaluate the degree of sand accumulation disasters on desert highways, reduce the workload of maintenance and sand clearance, and minimize driving hazards, the target layer is divided into various levels. Based on existing research on the impact of sand accumulation on road surface skid resistance (Pan, 2021), the effect of road surface conditions on wheel adhesion, the ratio of road surface width to standard vehicle width, and the level of standard vehicle ground clearance, this paper uses sand accumulation thickness as the evaluation criterion to classify the level of sand accumulation on desert highways, as shown in Table 1.
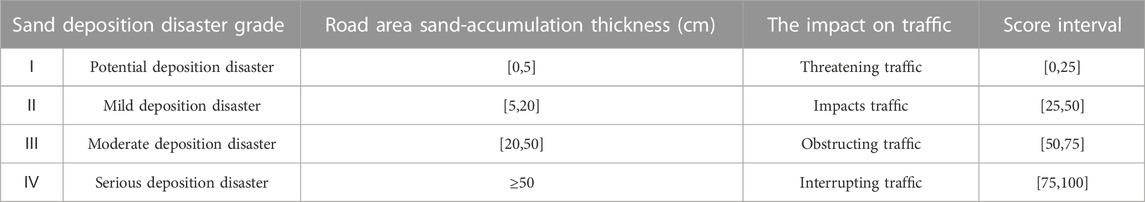
TABLE 1. Classification and Scoring of Sand Accumulation Damage Levels on Desert Roads.
Grade I is considered as a potential sand damage level, with a relatively small thickness of sand accumulation. As the road base layer has more roughness, it has less impact on the skid resistance of the road. This kind of hazard exists in almost all desert road sections and requires regular clearing of the sand to prevent it from developing into higher sand damage levels. Grade II and Ⅲ represent mild and moderate sand damage, respectively. The thickness of sand accumulation has a greater impact on the skid resistance of the road, which can significantly limit driving speed and the height of the vehicle chassis. This type of hazard can hinder or affect traffic flow. In order to mitigate this problem, sand control measures should be established based on the dominant wind direction. Vehicle speed limits should also be implemented in affected areas, and timely sand clearing should be carried out to ensure road safety. Level IV represents severe sand damage, which is typically characterized by sand accumulation in formations such as sand dunes, sand tongues, or sand sheets that obstruct traffic on desert roads. It has the greatest impact on desert road traffic. In addition to establishing sand control measures based on the engineering conditions of the affected area, speed limit signs and warning signs for hazardous areas should be installed in the affected segment to prevent traffic accidents such as vehicle rollovers and collisions.
2.4.2 Classification of indicator levels
Based on the engineering experience and previous research results of scholars (Lei et al., 2008; Zhuo, 2018), a hierarchical and quantitative classification of the established index layer based on the sand accumulation hazard level is shown in Table 2. To better describe the dominant wind direction’s impact on road surface sand accumulation, we quantify it using the angle between the dominant wind direction and the route, making the evaluation results more objective.
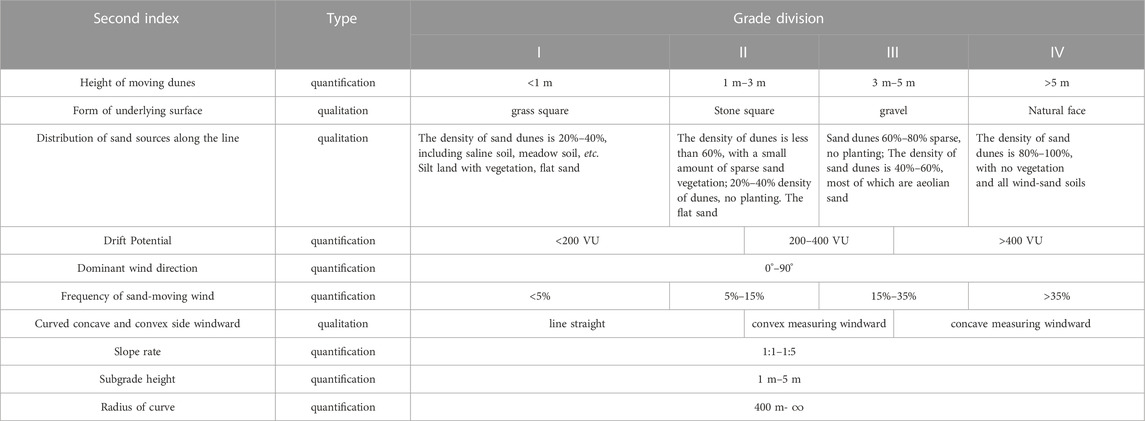
TABLE 2. Classification table of index layer.
2.5 Calculation of indicator weights
2.5.1 Calculation of constant weight weights
The Analytic Hierarchy Process (AHP) is a multi-level evaluation method that combines qualitative and quantitative analysis and is widely used in engineering assessments (Chen et al., 2017). By comparing indicators pairwise, experts can obtain judgment matrices and establish an increasing hierarchy structure model to assign weights to the index layer. The commonly used nine-point scale method in engineering assessments has the shortcoming of having unclear differences between the scales. On the other hand, the three-point scale method is useful for assessing significant differences, but it is limited in its ability to evaluate subtle differences. According to statistical data, people’s expected values for “almost the same”, “slightly better”, “better”, “much better”, and “extremely better” are 1.00, 1.30, 1.77, 2.40, and 3.63, respectively. Therefore, based on these expected values, the five-point scale method used in this article to judge the importance level between indicators is shown in Table 3, resulting in a more scientific and reasonable weighting.
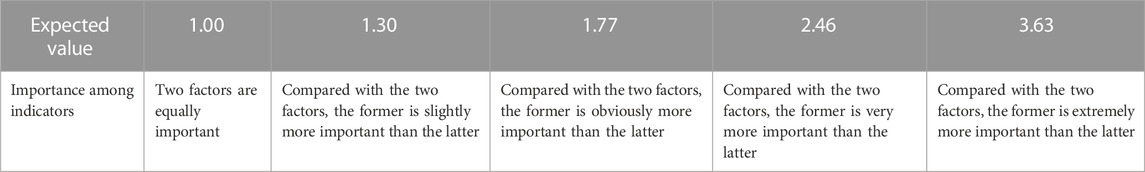
TABLE 3. Five-scale method.
After carefully analyzing the impact characteristics of sand drift on the construction of desert highways, the improved Analytic Hierarchy Process (AHP) principle is used to calculate the weights of each indicator. In practical engineering, the variable weight theory was used to optimize the constant weight obtained by using the equilibrium function. The specific steps of the AHP method are discussed in detail in reference (Meng et al., 2022).
Construct a judgment matrix based on expert ratings and the established hierarchical structure model. Normalize the matrix using the weighted arithmetic mean method. After normalizing the matrix using the product-sum method, we obtained the comprehensive weight values of 10 indicators relative to the target layer, as shown in Table 4. Furthermore, The consistency ratio (CR) values of each judgment matrix are calculated to be less than 0.1, indicating an acceptable level of inconsistency in the judgment matrices. The consistency test is passed.
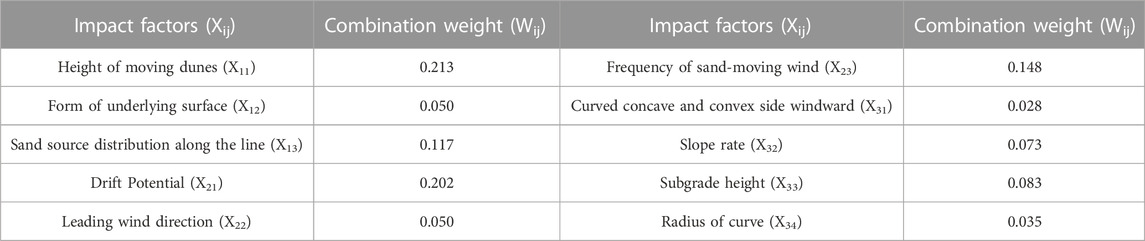
TABLE 4. Constant weight values of indicators.
2.5.2 Calculation of variable weight
The weight determined by the Analytic Hierarchy Process is called constant weight, which can only reflect the relative importance of each index to the target layer in a simple and intuitive manner. However, the comprehensive evaluation of the model is influenced by various factors, including specific engineering environmental factors (Luo et al., 2018). By only using constant weights, the importance of low-weight indicators in extreme value situations may be overlooked, leading to potential discrepancies between evaluation results and actual situations when they are offset by the status of other indicators. The theory of variable weight is a method to optimize the weights assigned to different indicators through the state values of the indicators and equilibrium functions, making the weights more rational and dynamic. In practical situations, the importance of indicators may vary depending on the engineering environment and other factors. The state value of an indicator reflects its performance in a specific engineering environment, and indicators with better performance are assigned higher weights while those with worse performance are assigned lower weights. This mechanism of dynamically adjusting the weights can reflect changes in the importance of indicators and accurately reflect the contribution of each indicator to the assessment results. This paper proposes using expert judgment and actual experience as the state values to adjust the weights. Experts and designers can suggest adjusting the importance of each indicator based on their understanding and judgment of the current situation, thus reflecting more accurately the contribution of each indicator to the decision outcome. This approach helps identify and cope with changes and uncertainties in the assessment process, improving the accuracy, reliability, flexibility, and robustness of the assessment.
When optimizing the constant weight based on the state value, it is necessary to establish an appropriate equilibrium function. Firstly, the equilibrium function can incorporate the evaluated objectives and constraints into the weight calculation, balancing the weights of various indicators according to specific situations to better meet the expected objectives and constraints. Secondly, the equilibrium function can better reflect the positive, negative, or nonlinear interactions between different factors, and can adjust the weights by selecting different equilibrium functions based on different levels of recognition of uncertain factors, in order to reduce sensitivity to uncertainty. To scientifically evaluate the target and enhance the rationality and dynamism of weights, variable weight theory is adopted to optimize constant weights (Li et al., 2022). The equilibrium function is introduced into the theory of variable weights (Liu, 1997), and the formula for calculating the variable weights is obtained as follows:
In the formula,
2.6 Establishment of evaluation model
2.6.1 Cloud model theory
The cloud model is a mathematical model proposed by Professor Li Deyi based on probability theory and fuzzy mathematics (Zhao, 2022). It is used to handle the correlation between fuzzy and random characteristics of qualitative concepts and quantitative descriptions. The cloud model ensures the scientific and rational integration of qualitative and quantitative indicators by simultaneously considering the uncertainty of affiliation degree, as well as the characteristics of fuzziness and randomness. The assessment of sand accumulation hazards involves a complex decision-making problem that includes multiple qualitative and quantitative indicators (Wang N. et al., 2020). Therefore, the theory of the cloud model can be applied to improve the accuracy of scheme optimization. Based on a comprehensive consideration of the actual characteristics of desertification hazards and the characteristics of various cloud model implementation methods, this research selects the widely applicable forward normal cloud model, as shown in Figure 5. Moreover, the comprehensive evaluation results have been visualized and made intuitive through programming in MATLAB software, with the specific implementation steps detailed as follows.
(1) Determine the 3 cloud eigenvalue parameters of the cloud model
(2) To generate a normal random variable
(3) To generate another random number
(4) Calculate the determination
(5) Repeat steps (2) to (4) to produce N cloud drops that satisfy the conditions.
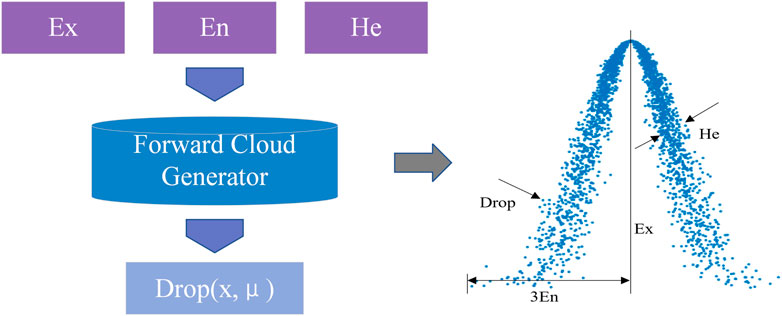
FIGURE 5. Forward cloud generator.
The cloud characteristic parameters include
2.6.2 Establishment of evaluation criteria cloud
Based on the classification and quantification of the indicator layer according to sand accumulation disaster levels as described in the preceding text, if the evaluation interval of grade
In the equation,
2.6.3 Evaluation of the establishment of a comprehensive cloud
To evaluate sand accumulation hazards, an assessment index system is established through the creation of evaluation comment sets and the formulation of corresponding quantification rules. Experienced experts are invited to quantitatively score the corresponding aspects of each plan. These scores are then computed and transformed into cloud model values using a reverse cloud generator to calculate the cloud model characteristic values of each evaluation indicator. Finally, the comprehensive cloud value is calculated based on the cloud model characteristic values combined with the indicator weights (Song et al., 2023). This assessment approach provides an objective and flexible way to evaluate complex systems and can be adjusted and optimized based on actual circumstances. According to the expert scoring matrix (Eq. 4), the cloud eigenvalue parameters such as expected value, entropy value, and super entropy of each scheme are calculated, and the calculation formula is shown in Eq. 5, where is the number of indicators and is the number of experts. On the basis of the index cloud eigenvalue parameters calculated in Eq. 5, the comprehensive cloud eigenvalue parameters are calculated by combining the weights of each index obtained from the multidimensional combination assignment, and the calculation formula is shown in Eq. 6.
3 Case study and result analysis
3.1 Engineering overview
The newly built Wuhai-Maqin Expressway is located between the Shapotou Scenic Area and the Tonghu Grassland Scenic Area, boasting a unique geographical position. It is a key transportation project within the National and Ningxia Hui Autonomous Region’s “Thirteenth Five-Year Plan” and has a mainline length of 122.9 km. In order to better investigate the sand damage patterns of the Wuma Expressway and provide scientific guidance for the construction of sand control systems, a test road section was constructed in the vicinity of Section K171+800 of the mainline of the Wuma Expressway, in the heart of the Tengger Desert, as shown in Figure 6. The Da Jiang M300RTK multi-rotor drone was used in conjunction with the Ruibo lens to conduct aerial surveying operations. It was observed that the sand dunes on both sides of the route form a grid-like chain, with a relative height of 2.1–3.6 m and an average spacing of 30 m. The geological strata mainly consist of Quaternary wind-blown sand and silt, with no bedrock exposed. Furthermore, according to existing research results, it is known that the wind speed required to initiate sand movement at a height of 2 m in the Tengger Desert, also known as the threshold wind speed (Ut), is approximately 5 m/s.
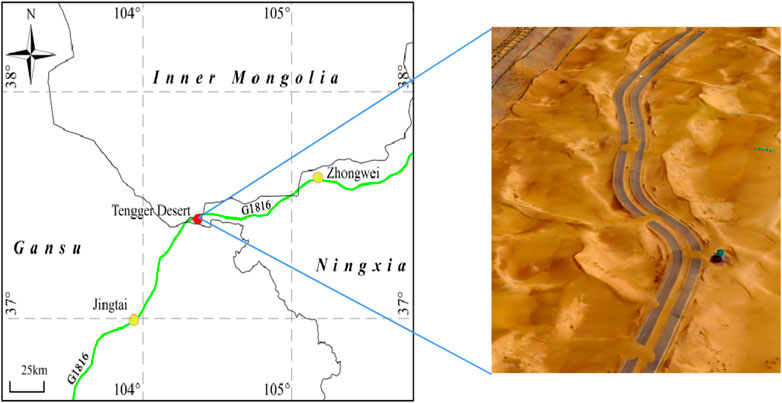
FIGURE 6. Geographical location and dune distribution of Wuhai-Maqin Expressway.
To validate the model, a straight section of the test road was selected as a representative cross-section with an embankment roadway configuration. The roadbed is 1 m high, with a slope ratio of 1:3. The measured height of the moving sand dune in this section is approximately 3.2 m. Analysis of the wind dynamics of the test section was conducted using data obtained from a field observation station in 2021. The analysis shows that the 2-min annual average wind speed in the region is 3.28 m/s, with an annual average sand drift initiating wind speed of 7.18 m/s, and a sand drift initiating day count exceeding 280 days, accounting for 77.3% of the total days in a year. The maximum instantaneous wind speed was as high as 18.6 m/s. The frequency of sand drift initiating wind speed occurring in spring is highest, accounting for 35.46% of the total, and the dominat wind direction is northwest, with a frequency of 34.22%. The sand drift-producing winds are frequent and persistent throughout the year in the study area, with strong sand/dust activities. The sand transport direction of the test section is from west to east in all seasons, and the maximum Drift Potential occurs during spring, indicating a strong sand transport environment. Therefore, this study focuses on sand drift accumulation in the spring season, with the Drift Potential of 124.57 VU, where the sand transport direction is almost perpendicular (88.08°) to the direction of the road.
3.2 Comprehensive assessment of sand accumulation hazards on desert highways
3.2.1 Determination of indicator weights
In this paper, six experts involved in the design of the project and two university scholars in the field of line selection were invited to score the indicators based on engineering reality and the classification shown in Table 2. The arithmetic mean of the scored values was used as the state value, and the variable weight theory was applied to optimize the weights of the composite weights under constant weight. α was set to 0.2 according to engineering experience, and the calculation results are shown in Table 5. The comprehensive weight change rate is the ratio of the difference between the variable weight of the indicator and the constant weight to the constant weight. A positive rate of change for the composite weight indicates an increasing trend, while a negative rate represents a decreasing trend.
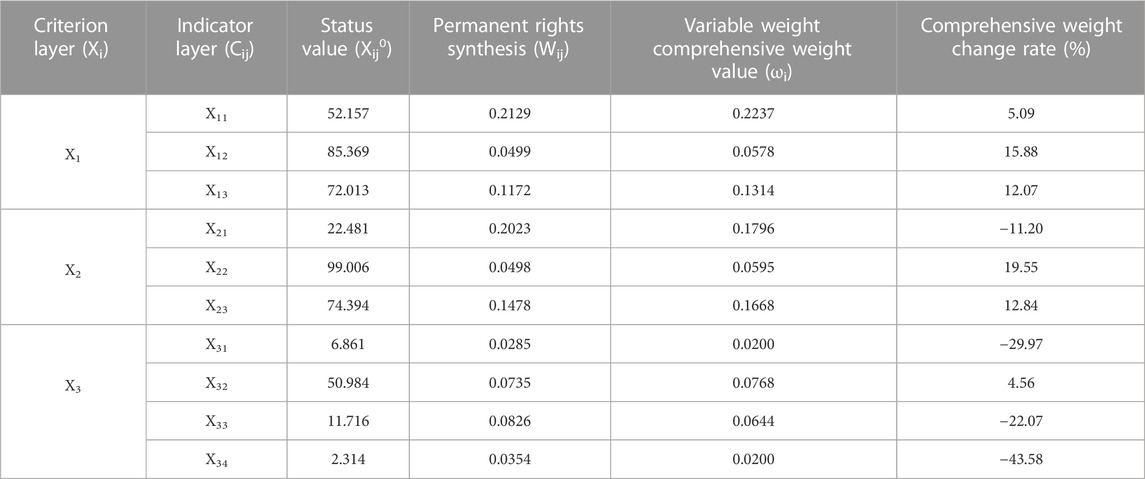
TABLE 5. State value and variable weight calculation results.
As shown in Figure 7, the analysis of the composite weight values of the indicators relative to the target layer reveals that each composite weight value changes dynamically after the introduction of the variable weight theory. Analysis of the changes in comprehensive weight rates showed that the weight change rates of concave or convex side windward in curve (X31) and the radius of the curves (X34) were the largest, with rates of −28.24% and −40.26%, respectively. This is because the cross-section line type selected in this paper is mainly composed of straight line segments, and the value of the indicator state tends to be in the extreme state. Therefore, the fixed weight assigned to the indicators was too high, and it needs to be weakened to some extent to make it more consistent with the actual engineering situation.
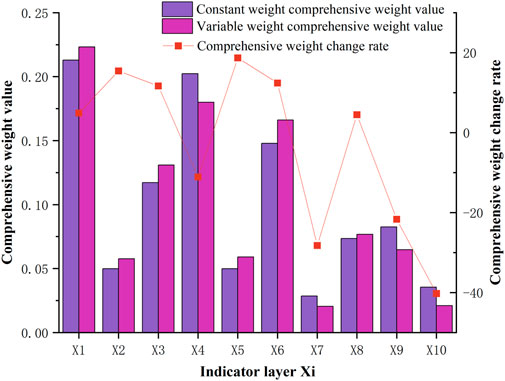
FIGURE 7. Comprehensive weight change rate.
3.2.2 Comprehensive evaluation of cloud models
As shown in Table 6, the numerical characteristics of the standard evaluation cloud of sand accumulation disasters on desert highways can be obtained by substituting the endpoint values of the evaluation intervals for each level into Eq. 3 after the quantification of indicators and the classification of sand accumulation disaster levels, as described earlier. The standard cloud image is obtained by inputting the numerical characteristics of the standard cloud into the MATLAB positive cloud generator, as shown in Figure 8.
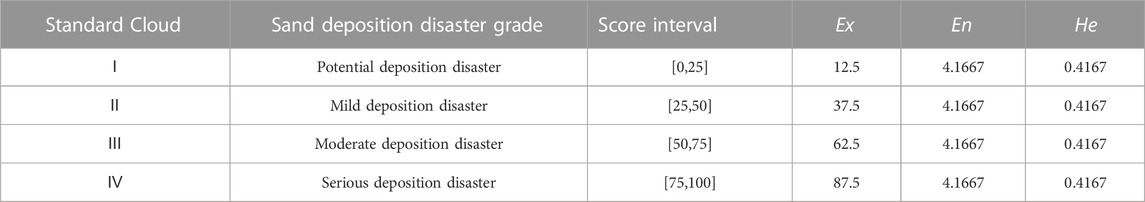
TABLE 6. Numerical characteristics of standard clouds.
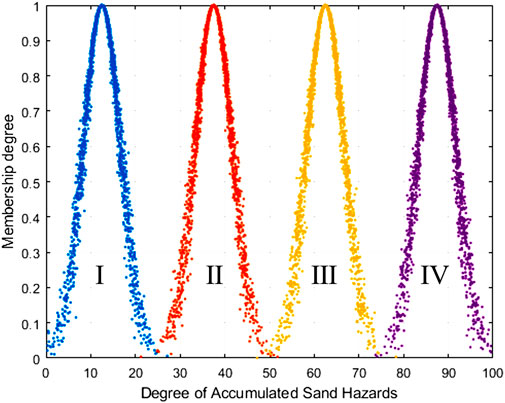
FIGURE 8. Standard cloud distribution.
To assess the degree of sand accumulation hazard on the line, primary evaluation indicators are first selected for evaluation. The expert scores for the secondary indicators are then used in Eq. 5 to calculate the digital characteristics of the level two sand accumulation hazard. The secondary evaluation cloud digital characteristics are then combined with their corresponding weight matrix using Eq. 6 to obtain the digital characteristics of the primary evaluation cloud indicators, as shown in Table 7. The comparison graph between the primary evaluation cloud and the standard cloud for the primary indicator is obtained by inputting the standard cloud and digital characteristics into the MATLAB positive cloud generator, as shown in Figure 9.
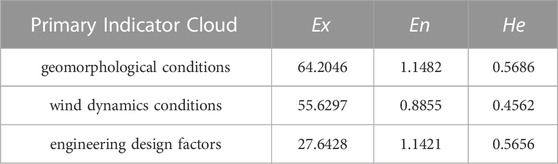
TABLE 7. Primary Indicator Cloud Digital Features.
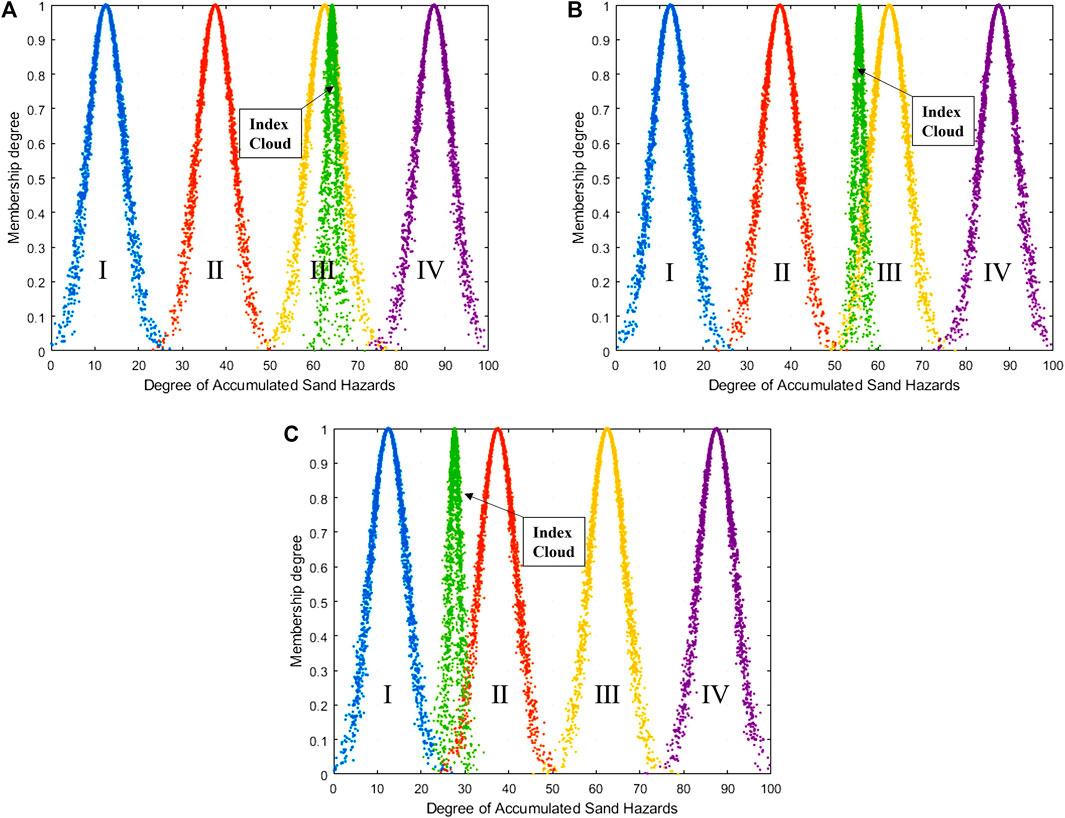
FIGURE 9. Evaluation cloud chart of primary indicators (A) geomorphological conditions (B) wind dynamics conditions (C) engineering design factors.
The primary index evaluation cloud number and its corresponding weight matrix are synthesized and operated to obtain the comprehensive evaluation cloud number feature
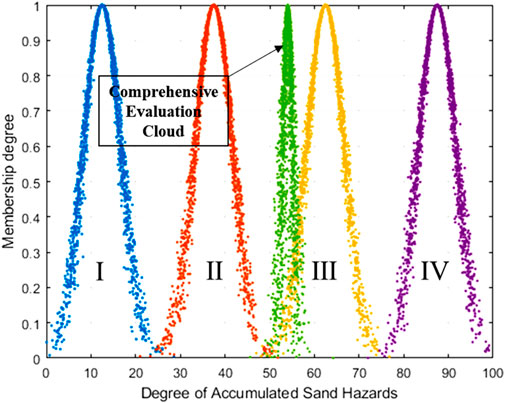
FIGURE 10. Comprehensive evaluation cloud.
Judging from the comparison and proximity of the primary index clouds, the regional geomorphological conditions as well as wind power conditions are closer to level III, which provides sufficient sand source conditions and strong wind conditions for this section, and there is a potential danger of moderate sand damage. The engineering design conditions are at level II, which has less influence on the degree of sand accumulation at this section, and the design parameters are better. Upon comparing and analyzing the comprehensive evaluation cloud and the standard cloud, it is found that the droplet distribution of the comprehensive evaluation cloud falls within the interval [46.90, 59.19]. Additionally, based on Figure 10, it can be observed that there is a significant overlap between the distribution of the comprehensive evaluation cloud and the standard cloud III. Based on the principle of maximum affiliation degree, the degree of wind-sand hazard at this section is classified as level III, indicating a moderate level of wind-sand hazard. Assuming that
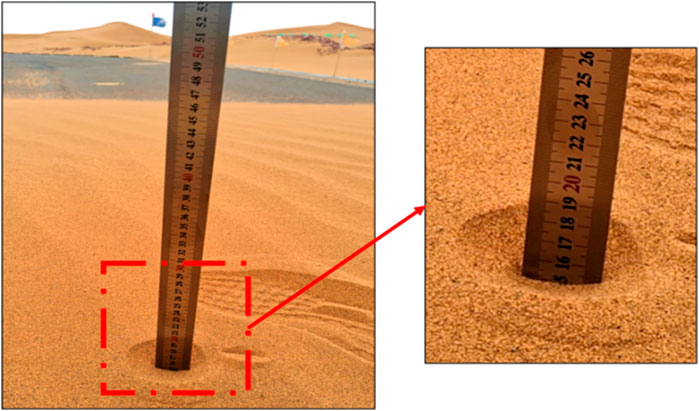
FIGURE 11. Actual measured thickness of sand accumulation.
4 Discussion
4.1 Advantages of variable weight theory and cloud model theory in evaluation
After introducing the variable weight theory into constant weight optimization, dynamic changes in the weight values of each indicator were observed. By calculating the rate of weight change, it was found that when the value of an indicator approaches an extreme state, the constant weight assigned to the indicator is too large and needs to be weakened to ensure consistency with actual engineering. Conversely, for indicators with a positive increase in weight change rate, it means that they have a significant impact on actual engineering. To prevent their influence from being neutralized by other indicators, it is necessary to increase the constant weight of such indicators and give them greater importance. Therefore, the application of variable weight theory makes the evaluation results of the model more scientifically.
During the assessment process of sand accumulation hazards on desert roads, various uncertainties exist. Cloud model can effectively model these uncertainties by introducing equilibriums and membership clouds to describe the degree and scope of uncertainty. This helps to express the fuzziness and uncertainty of evaluation data and observation results more accurately and provides more reliable evaluation results. The cloud model can also integrate expert knowledge and incomplete data to obtain more comprehensive and integrated evaluation results. By combining the opinions and knowledge of different experts, the cloud model can provide more credible evaluation results and solve conflicts and differences among different expert opinions. In addition, the cloud model can also perform cloud-based reasoning analysis, deducing and inferring evaluation results through the reasoning process, further enriching the information content of sand accumulation hazard evaluation on desert roads. In the evaluation of sand accumulation hazards on desert roads, decision-makers need to formulate corresponding management and control strategies based on the evaluation results.
4.2 Application of desert highways sand accumulation hazard assessment model
Assessment of sand accumulation hazards on desert highways holds significant practical importance for the construction of passageways in sandy areas. Evaluating sand accumulation hazards on desert highways can assess the safety of the road, identify potential disaster risks and danger spots. By assessing the extent and impact of sand accumulation along road sections, possible areas that may cause traffic hazards and accidents can be determined, and corresponding safety management measures can be proposed. This helps reduce the occurrence of traffic accidents and ensure the safety of road users. It also provides information and guidance necessary for the operation and maintenance of desert highways. Through evaluating the degree and trend of sand accumulation, the maintenance needs and frequency of desert highways can be understood. The evaluation results can guide maintenance personnel in formulating appropriate cleaning plans, selecting suitable cleaning techniques, and rationally allocating resources and equipment to maintain the road’s accessibility and sustainable operation.
Assessment of sand accumulation hazards provides a basis for developing prevention and mitigation measures. By analyzing the causes and influencing factors of sand accumulation, potential sand source areas and sand flow channels can be identified, and corresponding measures can be taken to reduce sand supply and the impact of sand flow on roads. The assessment results can also help determine appropriate environmental protection measures to prevent the impact of sandstorms on roads and surrounding ecosystems. Additionally, it can provide a foundation for sustainable road development. By understanding the development trend, scale, and impact range of sand accumulation hazards, the sustainability and feasibility of roads in the long and medium term can be assessed. The assessment results can provide decision-making support for road planners and guide road design, construction, and improvement.
4.3 Model limitations and improvements
This study presents a sand accumulation hazard assessment model for desert highways that combines the variable weight theory and the cloud model theory. The model allows for the evaluation and prediction of the level of sand accumulation hazard for highways based on the primary technical parameters that characterize the wind and sand environment along the road and the engineering design parameters. In the results analysis, the sand accumulation at the section was predicted by
Wind erosion of the roadbed is the primary form of sand damage on highways in desert areas. The roadbed is mainly filled with locally sourced sandy soil, which has a loose structure and poor compaction, making the roadbed susceptible to wind erosion and resulting in the erosion of the roadbed, slopes, and shoulders. Additionally, the impact of transiting wind and sand flows can lead to the collapse of road shoulders or the hollowing out of the road bottom surface layer. This paper only focuses on the safety risk assessment of desert road sand accumulation hazards, which is somewhat one-sided. To minimize the impact of sand damage and better guide the construction of access roads in desert areas, further consideration of wind erosion of the roadbed is needed.
5 Conclusion
This paper proposes a model for assessing sand accumulation hazards on desert highways. An evaluation index system was constructed from three dimensions: regional wind dynamic conditions, regional topographic conditions, and engineering design parameters. After determining subjective weights through an improved AHP method, variable weight theory was introduced for optimization. Based on the quantified gradation of sand accumulation hazard levels and index layers, a sand accumulation hazard assessment model for desert highways was established using cloud models. The model was validated through a study of the sand prevention test section of the newly constructed Wuhai-Maqin Expressway. The following conclusions can be drawn.
1) The variable weight theory was adopted to optimize the constant weights determined by the improved analytic hierarchy process based on the actual indicator status values in the case study. This approach resolves the shortcomings when the status value is at an extreme, and enhances the rationality and dynamicity of weight adjustments.
2) A safety risk assessment model for sand accumulation disasters on desert roads was constructed based on cloud model theory. The evaluation results were visualized and presented using MATLAB software. And protection recommendations were provided for different levels of sand hazards.
3) The analysis of the evaluation results indicates that the results obtained by the evaluation model are consistent with the actual engineering situation. Therefore, the established assessment model for highway sand accumulation disasters is rational and scientific. It can provide theoretical support for the design and operation of desert highways.
Data availability statement
The original contributions presented in the study are included in the article/Supplementary Material, further inquiries can be directed to the corresponding author.
Author contributions
FH, CW, ZeL, and ZhL contributed to conception and design of the study. FH organized the database. ZeL and ZhL performed the statistical analysis. CW wrote the first draft of the manuscript. FH, CW, ZeL, and ZhL wrote sections of the manuscript. All authors contributed to the article and approved the submitted version.
Funding
This work was supported by the National Natural Science Foundation of China (grant number 51568037); Special Funds for Guiding Local Scientific and Technological Development by The Central Government. (grant number 22ZY1QA005).
Conflict of interest
ZL was employed by the China Railway Design Group Co, Ltd.
The remaining authors declare that the research was conducted in the absence of any commercial or financial relationships that could be construed as a potential conflict of interest.
Publisher’s note
All claims expressed in this article are solely those of the authors and do not necessarily represent those of their affiliated organizations, or those of the publisher, the editors and the reviewers. Any product that may be evaluated in this article, or claim that may be made by its manufacturer, is not guaranteed or endorsed by the publisher.
References
Aili, S., Li, X., and Dong, C. (2006). Characteristics of traffic safety on desert highway. J. Traffic Transp. Eng. 6 (4), 116–121. doi:10.3321/j.issn:1671-1637.2006.04.026
Chen, C., Jia, J., Dong, K., Wu, Y., and Qiao, K. (2017). Application of improved AHP in coal roof sandstone water yield property assessment. Coal Geol. China 29 (7), 40–45. doi:10.3969/j.issn.1674-1803.2017.07.10
Chen, Y. (2007). Study on applied technique for sand fixation against wind to a highway in the desert area. Highw. Transp. Inn. Mong. 54 (2), 7–11. doi:10.3969/j.issn.1005-0574.2007.02.004
Chen, Y., Zuo, H., Wang, H., Yan, M., and Xi, C. (2022). Aeolian sand flow structures and trace element transport characteristics on different underlying surfaces in kubuqi desert. J. Green Sci. Technol. 24 (16), 10–15.
Chen, Z., Song, D., Hu, C., and Ke, Y. (2020). The september 16, 2017, linjiabang landslide in wanyuan county, China: Preliminary investigation and emergency mitigation. Landslides 17, 191–204. doi:10.1007/s10346-019-01309-1
Cong, S., Li, Z., Gong, B., Wang, S., and Huang, B. (2019). Wind tunnel test for the characteristic features of the wind with sand flowing current and its impact on the nearby buildings. J. Saf. Environ. 58 (6), 1989–2001. doi:10.13637/j.issn.1009-6094.2019.06.018
Deng, Y., Peng, C., Liu, J., Fu, Y., and Li, L. (2021). Prevention and control methods for highway disaster in desert area and its application in projects. Highway 66 (6), 345–351.
Gao, Y., Cheng, J., Dong, X., and Li, Z. (2023). Research on unfavorable geology environment modeling and alignment optimization design for railway route selection in wind-sand area based on GIS. Railw. Stand. Des. 67 (2), 30–36.
Han, F., Wang, C., Liu, Z., Li, L., and Yin, W. (2022). Study on sand-accumulation changes of highway and formation mechanism of sand damage in drifting dunes areas. Appl. Sci. 12 (19), 10184. doi:10.3390/app121910184
Jiang, X., Huang, Q., Zhang, Z., Vallejo, L. E., Chen, X., Zhao, W., et al. (2022). Influence of clay content on crack evolution of clay–sand mixture. Front. Earth Sci. 10, 915478. doi:10.3389/feart.2022.915478
Lei, Q., Li, S., Fan, D., Zhou, H., Gu, F., Qiu, Y., et al. (2008). Environmental classification and regionalization of wind-sand hazard along Tarim Desert Highway. Chin. Sci. Bull. 53 (2), 1–6. doi:10.1360/csb2008-53-zkII-1
Li, Z., Fan, X., Pu, O., Zheng, Y., and Gong, B. (2020). Wind tunnel test on wind-sand flow field and wind-sand load of buildings. Eng. Mech. 37 (1), 152–158. doi:10.6052/j.issn.1000-4750.2019.02.0067
Li, Z., Mo, X., Ge, W., and Wang, T. (2022). Comprehensive evaluation of dam-break consequences based on variable weight set pair-extenics coupling model. Adv. Eng. Sci. 54 (5), 64–71. doi:10.15961/j.jsuese.202100658
Liu, W. (1997). Balanced function and its application for variable weight synthesizing. Syst. Eng. Theory Pract. 54 (4), 58–64.
Luo, Y., Zhu, Y., Zhang, X., and Yao, L. (2018). Scheme evaluation model of railway location designs based on variable weight theory. J. Railw. Eng. Soc. 35 (8), 16–20. doi:10.3969/j.issn.1006-2106.2018.08.004
Ma, S., Ning, S., and Yang, S. (2023). Joint COVID-19 and influenza-like illness forecasts in the United States using internet search information. Highway 68 (1), 39–45. doi:10.1038/s43856-023-00272-2
Meng, J., Wang, S., Zhang, J., and Yang, Y. (2022). Ecological environmental impact assessment of small hydropower based on improved analytic hierarchy process. J. Water Resourc. Archit. Eng. 20 (1), 103–107.
Miri, A., and Middleton, N. (2022). Long-term impacts of dust storms on transport systems in south-eastern Iran. Nat. Hazards 114 (1), 291–312. doi:10.1007/s11069-022-05390-z
Ni, G. (2022). Study on the response rule of wind-sand flow and the pattern of sand barrier interdistribution in the subgrade of desert expressway. China: Lanzhou Jiaotong University.
Pan, J. (2021). Experimental study on skid resistance of sand asphalt pavement based on multi-factor conditions. China: Shihezi University.
Qu, J., Ling, Y., Liu, B., Chen, G., Wang, T., and Dong, Z. (2019). The research status and development trends of wind-sand engineering in China. Adva. Sci. 264 (3), 225–231. doi:10.11867/j.issn.1001-8166.2019.03.0225
Song, L., Zhang, J., Du, J., Jian, Y., Shen, J., and Li, H. (2023). Resilience evaluation of water conservancy project operation safety based on cloud model. Water resourc. Prot. 39 (2), 208–214.
Wang, C., Li, S., Li, Z., Lei, J., and Chen, J. (2020). Effects of windblown sand damage on desert highway guardrails. Nat. Hazards 103, 283–298. doi:10.1007/s11069-020-03987-w
Wang, N., Zhang, S., and Liu, P. (2020). Cloud model of evaluating debris flow susceptibility based on combinatorial weighting of game theory. J. Yangtze River Sci. Res. Inst. 37 (2), 41–47. doi:10.11988/ckyyb.20180136
Wang, T., Xie, S., Qu, J., and Han, Q. (2019). Characteristics of wind-blown sand environment and wind-blown sand disaster controlling in Qidukou, Tongtianhe River, China. J. Desert Res. 39 (2), 70–78. doi:10.7522/j.issn.1000-694X.2018.00050
Xie, S., Qu, J., Han, Q., and Pang, Y. (2020). Wind dynamic environment and wind tunnel simulation experiment of bridge sand damage in Xierong section of Lhasa–Linzhi Railway. Sustainability 12 (14), 5689. doi:10.3390/su12145689
Xie, S., Qu, J., Lai, Y., Pang, Y., and Xu, X. (2016). The causes, distributions, characteristics of sand hazards and its controls for Lhasa-Shigatse Railway. J. Arid. Land Resourc.Environ. 30 (2), 170–175. doi:10.13448/j.cnki.jalre.2016.065
Xie, S., Yu, W., Qu, J., and Pang, Y. (2018). Dynamic environment of blown sand at honglianghe river of qinghai-tibet plateau. J. Desert Res. 38 (2), 219–224. doi:10.7522/j.issn.1000-694X.2016.00146
Xin, G., Cheng, J., Wang, L., Zhi, L., and Xin, L. (2016a). Research on the law of mutual feedback between ground surface condition and wind-sand field along the railway. Railw. Stand. Des. 60 (9), 22–27. doi:10.13238/j.issn.1004-2954.2016.09.005
Xin, G., Cheng, J., and Yang, Y. (2016b). Study on effect of characteristics of hanging-type concrete sand barrier opening and wind-sand field along railway. J. China Railw. Soc. 38 (10), 99–107. doi:10.3969/j.issn.1001-8360.2016.10.014
Yang, W., Yue, H., and Deng, E. (2023). Research on wind and sand resistance performance of high vertical sand barriers in desert hinterland highways. J. Railw. Sci. Eng. 20 (1), 178–189. doi:10.19713/j.cnki.43-1423/u.t20220250
Yu, G., Jia, X., Liu, J., Zhang, Q., Zhou, J., Hong, Y., et al. (2022). Application of a nomogram to radiomics labels in the treatment prediction scheme for lumbar disc herniation. Transpoworld 22 (29), 51–54. doi:10.1186/s12880-022-00778-6
Zhang, H., Pan, Z., Du, L., Yan, C., Ding, B., Song, Q., et al. (2008). Advanced gastric cancer and perfusion imaging using a multidetector row computed tomography: Correlation with prognostic determinants. Inn. Mong. Water Resourc 9 (3), 119–127. doi:10.3348/kjr.2008.9.2.119
Zhang, K., Wang, Q., Yang, Z., Liang, K., Zhao, K., and Cui, X. (2019). Numerical simulation study on windproof benefit of high vertical sand barrier of HDPE board of new Geku Railway. J. China Railw. Soc. 178 (3), 169–175. doi:10.3969/j.issn.1001-8360.2019.03.023
Zhao, C., Liu, D., Feng, L., Cui, J., Du, H., Wang, Y., et al. (2022). Research advances of in vivo biological fate of food bioactives delivered by colloidal systems. Railw. Stand. Des. 2022, 1–19. doi:10.1080/10408398.2022.2154741
Keywords: desert highways, sand accumulation disaster assessment, five-point ccale method, variable weight theory, cloud model
Citation: Han F, Wang C, Liu Z and Liu Z (2023) Assessment of sand accumulation hazard on desert highway based on variable weight-cloud model theory. Front. Earth Sci. 11:1208416. doi: 10.3389/feart.2023.1208416
Received: 25 April 2023; Accepted: 26 June 2023;
Published: 05 July 2023.
Edited by:
Chong Xu, Ministry of Emergency Management, ChinaReviewed by:
Hongchao Dun, Lanzhou University, ChinaZhilu Chang, Nanchang University, China
Danqing Song, South China University of Technology, China
Copyright © 2023 Han, Wang, Liu and Liu. This is an open-access article distributed under the terms of the Creative Commons Attribution License (CC BY). The use, distribution or reproduction in other forums is permitted, provided the original author(s) and the copyright owner(s) are credited and that the original publication in this journal is cited, in accordance with accepted academic practice. No use, distribution or reproduction is permitted which does not comply with these terms.
*Correspondence: Feng Han, aGFuZmVuZzc0MDQxMkBtYWlsLmx6anR1LmNu