 Wenchao Wang1
 Qiongying Liu
 Shunyun Chen
 Lichun Chen
94% of researchers rate our articles as excellent or good
Learn more about the work of our research integrity team to safeguard the quality of each article we publish.
Find out more
ORIGINAL RESEARCH article
Front. Earth Sci., 22 June 2023
Sec. Solid Earth Geophysics
Volume 11 - 2023 | https://doi.org/10.3389/feart.2023.1204714
Terrestrial heat flow plays an important role in the study of plate tectonics, geothermal resource exploration and earthquake genesis. The measurement of terrestrial heat flow usually utilizes deep boreholes, which is expensive and inconvenient for high altitudes or mountainous terrain. In hydrothermally active areas, the temperature distribution is disturbed by heat convection, resulting in difficulty in obtaining conductive heat flow. In fact, heat can be used as a tracer to quantify groundwater flow. This article presents a method for calculating terrestrial heat flow suitable for hydrothermally active areas, which can correct the influence of groundwater flow to obtain the conductive heat flow reflecting the deep thermal background. The method uses temperature-time series at multiple depths of the shallow crust to calculate the groundwater flow rate. The convective heat flux component is then removed based on information on groundwater movement, and the conductive heat flow can be acquired. The feasibility of the method is verified by a theoretical model. This method has been applied to estimate terrestrial heat flows in northwestern Yunnan, China, which is a hydrothermally active area. The heat flow obtained through our method range from 54.5 to 130.3 mW/m2, with an average of 94.5 mW/m2, consistent with the high-quality measured heat flow values in the boreholes. This study provides new perspectives for acquiring terrestrial heat flow in areas that are affected by fluid activities.
The terrestrial heat flux is a fundamental output of the dynamic solid Earth’s heat engine (Davies, 2013). Therefore, a better understanding of terrestrial heat flow provides a constraint on the thermal structure of the crust and lithospheric mantle and hence on lithospheric rheology (Liu et al., 2005; Furlong et al., 2013; He, 2015; Liu et al., 2016; Njinju et al., 2019; Zhu et al., 2022). The estimation of terrestrial heat flow can also play a role in applications such as hydrocarbon, geothermal and mineral exploration (Zhang C. et al., 2018; Prol-Ledesma and Morán-Zenteno, 2019).
Terrestrial heat flow is the heat energy transmitted from the Earth’s interior to the Earth’s solid surface by conduction or convection in units of time. Conductive heat flux refers to the heat flux transmitted along the geothermal gradient per unit area, which is determined by the product of the geothermal gradient and thermal conductivity and can better reflect the deep thermal state of a region (He and Wang, 2021). In a homogeneous medium, if heat is under pure conduction conditions, the temperature gradient should remain unchanged. When the curve is not linear, it indicates that there may exist a heat flux disturbance in the area (Hu and Xiong, 1994). In fact, when the subsurface fluid migrates, it causes thermal convection to change the temperature field. The heat flux in the hydrothermally active area is easily disturbed. How to eliminate the influence of groundwater flow on terrestrial heat flow estimation is an important topic in geothermic research (Mansure and Reiter, 1979; Wang et al., 2021). Hu and Xiong (1994) achieved good results in heat flow correction in the southeastern coastal areas of China. However, drilling to great depths is not easy to operate at high altitudes or in mountainous areas.
To remove the influence of fluid movement, it is necessary to obtain information on groundwater flow. The temperature of the near surface fluctuates periodically (Anderson, 2005; Soto-López et al., 2011), and periodic temperature fluctuations disappear at deep depths, with a stable geothermal gradient. Using heat as a tracer, subsurface fluid migration information can be effectively determined (Rau et al., 2014; Irvine et al., 2017; Kurylyk and Irvine, 2019; Liu et al., 2019). If we acquire the groundwater flow velocity, the convective heat flux can be corrected.
To calculate the groundwater flow rate using temperature information, researchers have carried out much work. As early as the 1960s, a classical solution was proposed by Bredehoeft and Papaopulos (1965). By setting the temperature at the top and bottom boundaries, the temperature-depth profile was used to estimate the groundwater flow rate, which was later named the Bredehoeft and Papaopulos method (BP method). In the 1970s, this solution was improved, and a graphical temperature-depth (TD) analysis method similar to the BP method was developed (Mansure and Reiter, 1979). Their method quantified the influence of horizontal and vertical heat fluxes on the TD profile and near-surface groundwater flow rate by mapping the relationship between the temperature gradient and temperature. At the beginning of the 21st century, the BP method was deduced as a multilayer algorithm (Shan and Bodvarsson, 2004). In this model, each layer can have different thermal conductivities, which makes the estimation of the groundwater flow rate relatively accurate. Later, the improved BP method obtained the analytical solution of the semi-infinite domain equation with only one boundary (Turcotte and Schubert, 2002). Their conceptual model has a large constant temperature thermal reservoir at a large depth, which is equivalent to a boundary without heat conduction at the bottom of the model to facilitate the calculation of the groundwater flow rate. At the end of the 20th century, some scientists realized that the transient effects of land surface temperature changes caused by deforestation, urbanization or climate change can induce changes in the slope of the temperature curve (Taniguchi et al., 1999a). The initial temperature and the top boundary temperature are expressed by linear functions, indicating a linear climate warming rate and a linear initial ground temperature gradient, which expanded the application field of the method (Taniguchi et al., 1999b). Later, some researchers questioned the use of the linear initial temperature to represent the steady-state temperature-depth distribution (Macquarrie and Kurylyk, 2014). Researchers recommend adding an additional exponential term to the initial conditions to take into account the curvature of the temperature change so that the initial temperature is sufficiently flexible. Based on these methods, a solution with flexible initial temperature and boundary conditions was derived (Kurylyk and Irvine, 2016). Then, a method for calculating the groundwater flow rate by the Excel table loading term was proposed and named Flux-LM (Kurylyk et al., 2017). The groundwater flow rate can be obtained by inputting temperature-depth data, a medium thermal conductivity and fluid volume heat capacity.
In this paper, a new method is proposed for estimating terrestrial heat flow through long-term observations of bedrock temperature, which can correct for the influence of hydrothermal activity on heat flux. The method can be implemented through temperature observations in shallow boreholes, which may be applied in mountainous areas where deep boreholes are rare. We first establish a terrestrial heat flow correction method based on long-term temperature observations to remove the influence of groundwater-induced heat convection and use a numerical model to verify its effectiveness. Then, based on multiyear observational data from six bedrock temperature observation stations in northwestern Yunnan, China, the groundwater flow velocity is obtained. Finally, the corrected terrestrial heat flow value is estimated and compared with the measured heat flow values of boreholes in the study area.
Assuming that the area of temperature measurement is lacking other heat sources, the heat transfer equation in a one-dimensional uniform medium is:
where T is the temperature of depth z at time t, ρ is the density of the fluid, c is the specific heat capacity of the fluid, K is the thermal conductivity of the bedrock, and v is the vertical velocity of the fluid (positive downward).
Assuming that the velocity of the fluid is constant in the temperature measurement interval, the uncorrected heat flux q(z)=K∙dT/dz is substituted into Eq. 1:
where z0 is the minimum depth of the temperature measurement, and z'=z-z0, that is, the thickness relative to the minimum temperature measurement depth; β=ρcvL/K, and it is a dimensionless constant. L=zb-z0, zb is the maximum depth of the temperature measurement.
By solving Eq. 2, the vertical heat flow distribution after the vertical disturbance of fluid flow can be obtained:
where q0 is the corrected heat flux at z0. The temperature distribution after perturbation in the permeable layer can also be expressed as a function of depth z’ and β/L:
where T0 is the temperature at z0. The corrected heat flux q0 can be obtained by least squares fitting of the temperature data at different depths.
Eq. 4 shows that if the temperature at different depths and the vertical velocity of groundwater are obtained, the influence of groundwater movement on heat flux can be removed to acquire the conduction heat flow reflecting the deep thermal background. It should be noted that Eq. 4 can be valid when flow velocity is greater than 1×10⁻²¹ m/s. When the groundwater flow rate is less than 1×10⁻²¹ m/s, the heat conduction equation is more applicable.
Kurylyk et al. (2017) proposed a method to calculate the fluid velocity of aquifers according to temperature data at more than three depths. The calculation can be performed by an Excel table named Flux-LM. In Flux-LM, more than three temperature-depth sequences, the specific heat capacity of the fluid, the thermal conductivity of the rock, and the thickness of the temperature measurements are input as required to obtain the velocity of the underground fluid in the temperature measurement segment. Then, the value of β can be calculated using the velocity of the underground fluid. When we obtain β, the least squares method can be used to fit the temperature-depth data, and the conduction heat flux q0 can be obtained according to Eq. 4.
To test whether the method is valid, we conducted a theoretical model that contains a bottom conductive heat flow and a seepage layer. The model is one-dimensional and 500 m long. It is assumed that the upper 30 m is the seepage layer with a vertical velocity of −6×10⁻⁹ m/s. The thermal conductivity of the saturated medium is 2.12 W/mK, and the volume heat capacity of the medium is 2.836×10⁶ J/m3K. The top boundary of the model is given a sinusoidal temperature boundary with an amplitude of 8°C and an average of 10°C. The bottom boundary is assumed to have a heat flux of 65 mW/m2. The model ran for 3 years and output a set of sinusoidal temperature time series at different depths. We calculated the conductive heat flow using the temperature data through the method in Section 2.1.
The temperature time series at depths of 0 m, 5 m, 10 m, 15 m, 20 m, 25 m and 30 m are used for calculation (Figure 1A). First, the average value of temperature fluctuation is obtained by fast Fourier transform for the temperatures with an obvious annual period, and those without an annual period were calculated as the mean value during the time period. Then, the multiyear average temperature value of each depth was obtained. The temperature gradient obtained from the temperature-depth sequence is 3.698×10⁻²°C/m, and the heat flux obtained directly from the measured temperature is 78.3 mW/m2, which is larger than the heat flow value given at the boundary of the theoretical model. This indicates that upward groundwater migration significantly increases the temperature gradient so that the heat flux value obtained from the measured temperature is higher than the given conductive heat flow. Then, using the Flux-LM table, the flow velocity of the model is calculated to be −6.07×10⁻⁹ m/s, and thus, β=−0.36. The temperature-depth data are fitted by the least squares method using Eq. 4, and the corrected heat flux q0=65.1 mW/m2, which coincides with the given value in the theoretical model.
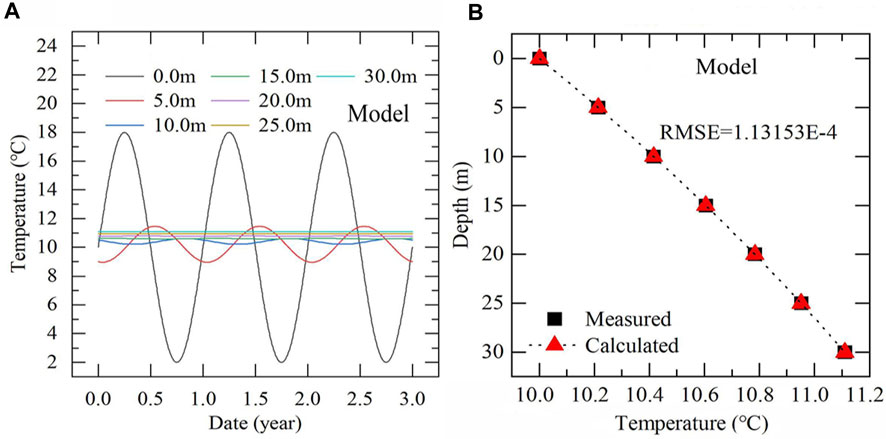
FIGURE 1. The temperature-time series obtained by the theoretical model (A) and the comparison between the calculated and theoretical temperature-profiles (B).
The corrected heat flux value is 14.2 mW/m2 lower than the heat flux obtained directly from the measured temperature. The influence of thermal convection on the heat flow calculation is almost completely eliminated. The absolute value of the difference between the theoretical temperature value and the estimated temperature calculated by Eq. 4 is less than 0.02°C, indicating that the above heat flow correction method is reliable.
The study area is located in the Lijiang-Midu subregion of Yunnan, China, which has a middle to high heat flow background (Wang et al., 1990). The area is the intersection zone of the Lijiang-Xiaojinhe fault, Weixi-Qiaohou-Weishan fault, Chenghai-Binchuan fault and NW-trending Red River fault. Since the Neoid, the vertical fault activity has been quite active, and there are Himalayan magmatic activities, such as the basic volcanic rock of Xiangguo Temple in the northeastern Erhai Lake and the trachyte of the Jianchuan Heihui River (Xing et al., 1986). Many earthquakes have occurred in the study area in the past 7 years; most of the magnitudes are 3-6, and one earthquake had a magnitude greater than 6 (Yang et al., 2022). There are 40°C–80°C hot springs in this area, with a total flow of 599 L/s and a total release of 1.35×10⁴ kcal/s, indicating that they are hydrothermal convection-type and residual magmatic heat-type hot springs. Carbonate rocks are widely distributed, and the thermal storage space is large (Yao et al., 1983).
At the end of 2017, a bedrock temperature observation network was established by the Institute of Geology, China Earthquake Administration (Figure 2). The measuring points are mainly located in the Chenghai-Binchuan fault, the middle section of the Red River fault, the Lijiang-Xiaojinhe fault and the Yushichang-Qiaohou section of the Weixi-Qiaohou-Weishan fault in northwest Yunnan. The specific information of the measuring points is shown in Table 1.
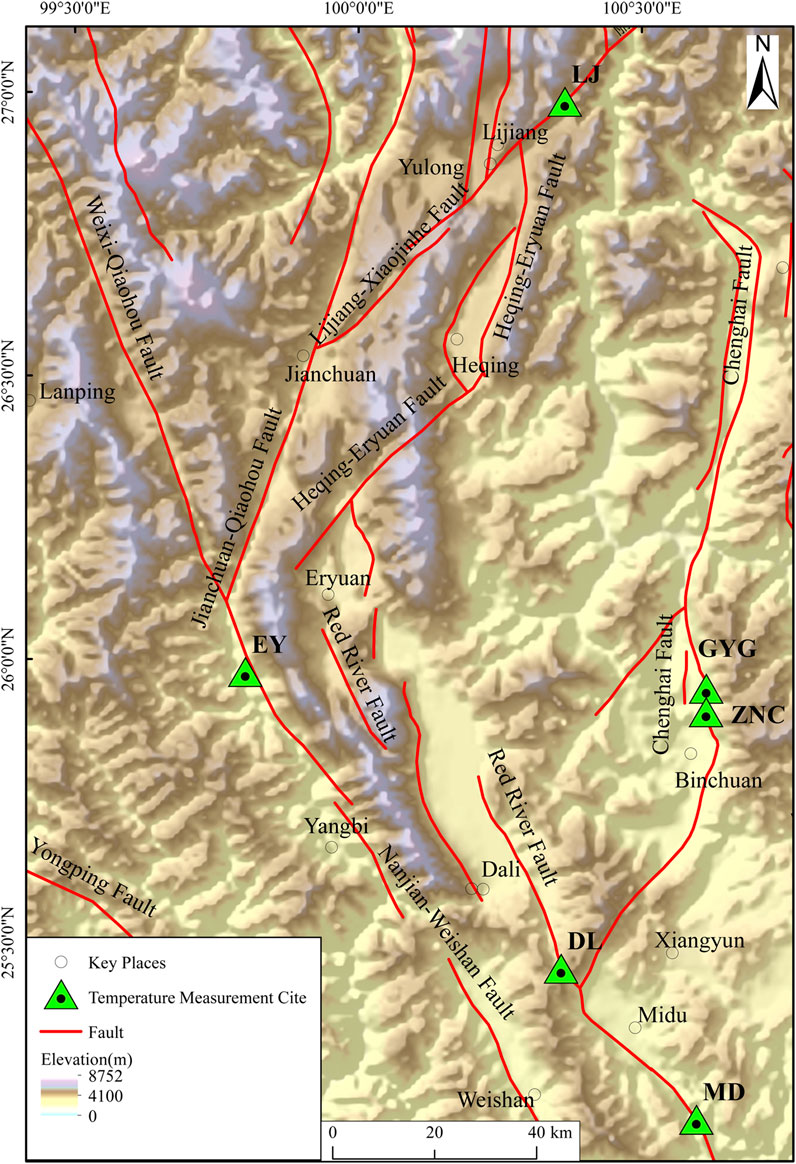
FIGURE 2. Distribution of the bedrock temperature observation sites in the northwestern Yunnan, China.
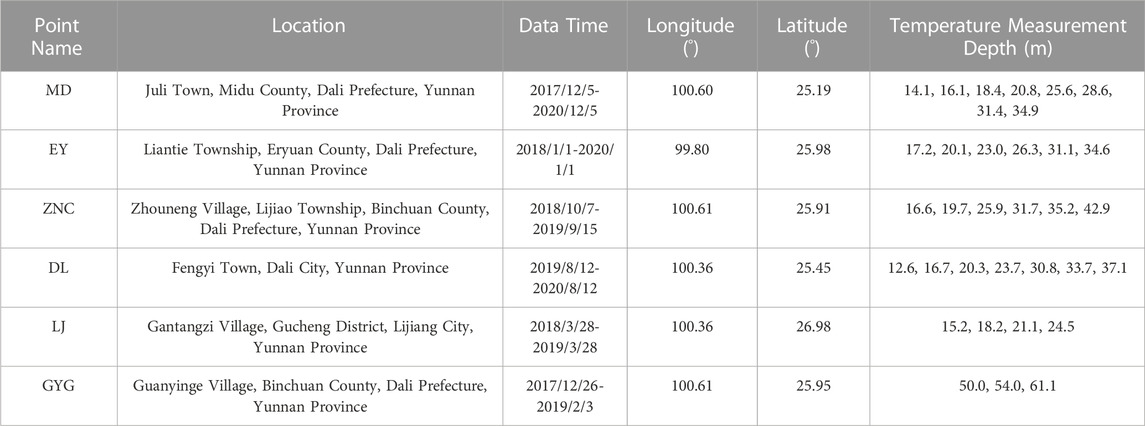
TABLE 1. Measuring point information in northwestern Yunnan.
The borehole diameter of each observation point is 89 mm. After installing the temperature sensor, the borehole was sealed with cement slurry to couple the temperature sensor with the bedrock. The sampling interval of the temperature sensor is 5 min, and the measurement resolution is 10−4°C (Zhang Z. H. et al., 2018). In each borehole, multiple temperature sensors were installed at different depths to carry out continuous temperature observations. Among them, eight temperature sensors were installed at the MD, DL and ZNC observation points, with maximum depths of 34.9 m, 37.1 m and 42.9 m, respectively. Six temperature sensors were installed at the EY site, with a maximum depth of 34.5 m. Four temperature sensors were installed at the LJ site, with a maximum depth of 24.5 m. Three temperature sensors were installed at the GYG site, with a maximum depth of 61.1 m.
The bedrock temperature in northwestern Yunnan has been continuously observed since July 2017. Four years of continuous data have been recorded thus far. Considering the influence of heat release during cement solidification, we selected the data of the first 3 months to fit the trend line of cement heat release and analyzed the data after removing the cement heat release trend. Figure 3 shows the temperature change with time at different depths for the six bedrock temperature measuring points. There are obvious annual periodic temperature variations in the near-surface, and temperature changes are small at deep depths.
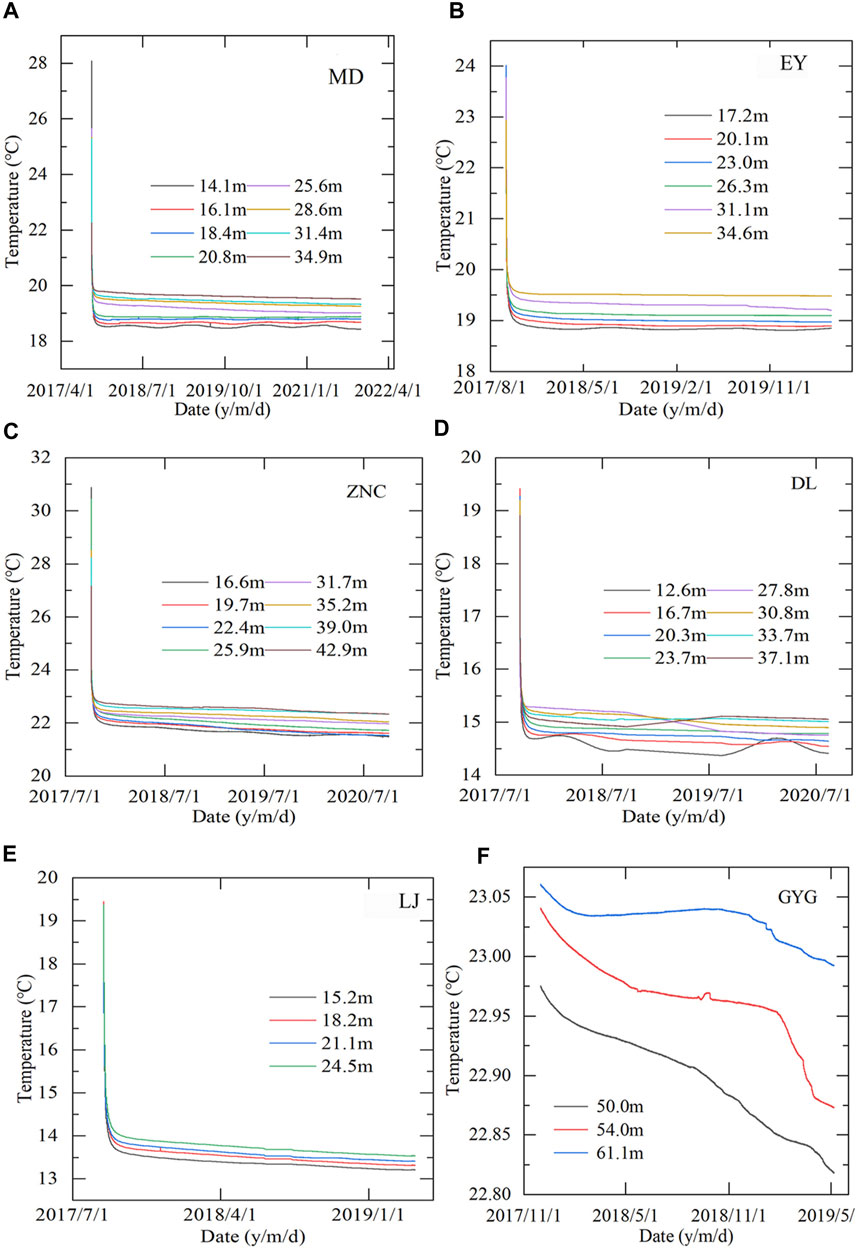
FIGURE 3. Recorded multidepth temperatures at the measurement points in the northwestern Yunnan. (A) The MD site. (B) The EY site. (C) The ZNC site. (D) The DL site. (E) The LJ site. (F) The GYG site.
Before estimating fluid movement characteristics from temperature information, the data need to be preprocessed. The preprocessing of temperature data mainly includes the following three steps.
(1) Data screening. The data segment with a complete annual period of multiyears is selected.
(2) Data filtering. The spurious data and high-frequency noise are eliminated.
(3) Supplementing the missing data through the linear interpolation method. If an abundance of data are missing, the TREND function in Excel is used to complete the temperature variation trend.
After preprocessing the temperature measurement data, the fluid movement information can be obtained by using the temperatures at different depths, and finally, the corrected heat flux can be acquired. The specific process includes the following.
(1) The temperature data of the first 2–3 months at each measuring point depth were used for curve fitting to obtain the heat release trend of cement. The cement exothermic value was then subtracted from the original bedrock temperature data.
(2) The bedrock temperature data were filtered to eliminate spurious data and high-frequency noise. The data affected by the filtering distortion at the beginning and end were not used.
(3) At depths with obvious annual cycle variations, the multiyear average temperature T was obtained using a fast Fourier transform, and the average temperature for multiple years was calculated at depths without an obvious annual cycle. The thermal conductivity K of the saturated rock was obtained by measurement of the drilled lithologic samples of the observation point. Then, the temperature information at different depths and thermal parameters were input into Flux-LM to obtain the groundwater flow velocity and flow direction.
(4) The thickness L of the permeable layer was estimated from the borehole lithology and local hydrogeological conditions. The corrected heat flux was calculated by Eq. 4 when the most approximate temperature-depth curve was fitted by the least squares method.
The change in the bedrock temperature with time after data preprocessing is shown in Figure 4. The temperature measured in the shallow layer has good annual periodic characteristics, and the temperature in the deep layer is relatively stable and does not show periodic fluctuation. The average bedrock temperature at each depth of the measuring point is shown in Figure 5. Some temperature-depth curves of the measuring point are close to linear, such as the LJ site, while the curves of some measuring points are obviously concave, such as the EY, DL and GYG sites, and the curves are convex at some measuring points, such as the MD and ZNC sites.
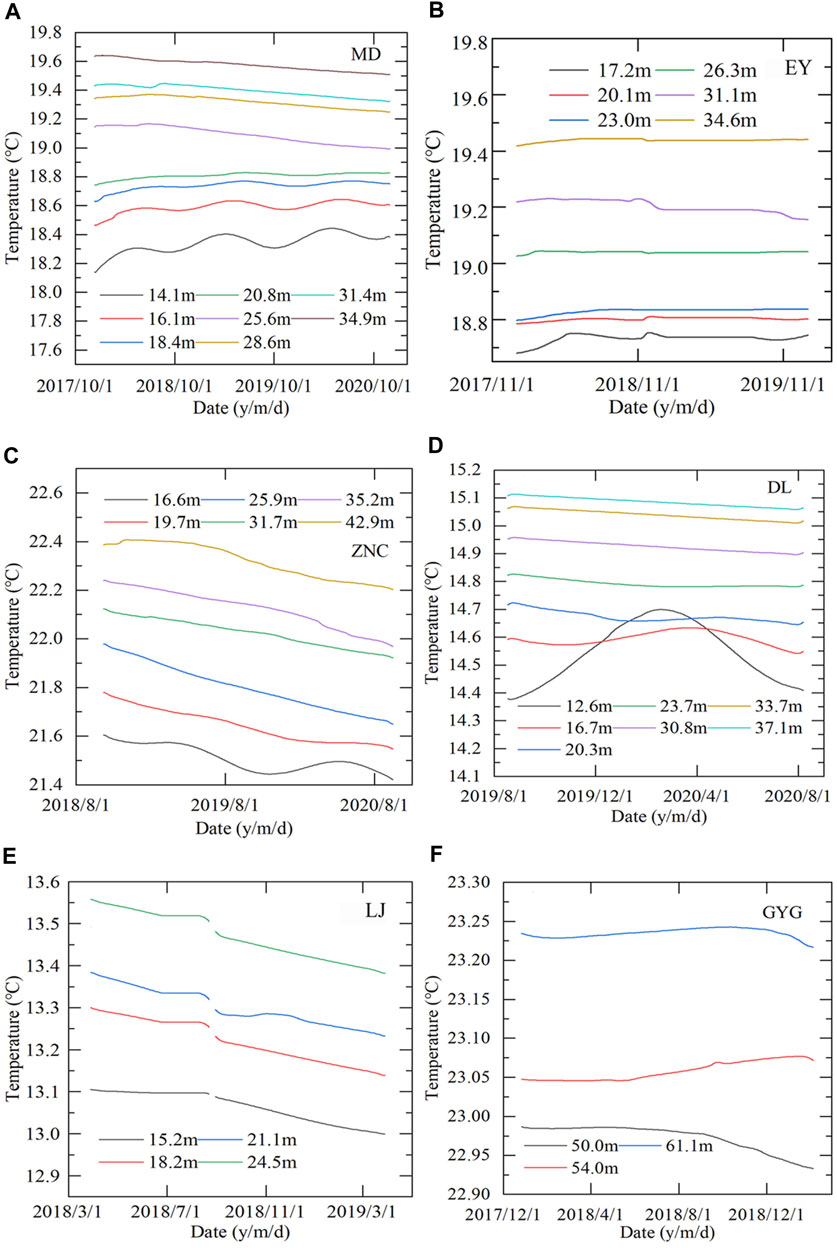
FIGURE 4. Temperatures-time series of the measuring points after removing the cement exothermic trend and filtering high-frequency noise. (A) The MD site. (B) The EY site. (C) The ZNC site. (D) The DL site. (E) The LJ site. (F) The GYG site.
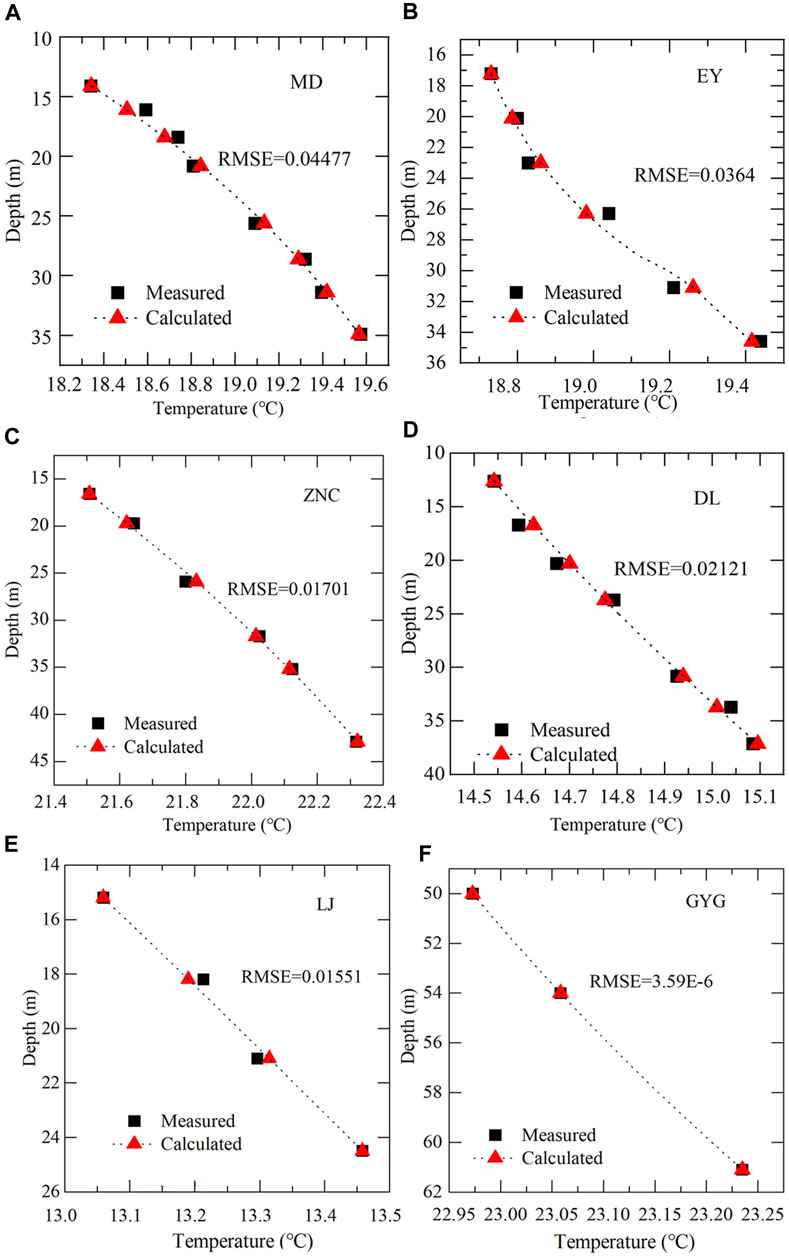
FIGURE 5. Comparison of the measured and calculated temperatures at the observed depths and their Root Mean Squared Errors (RMSE). (A) The MD site. (B) The EY site. (C) The ZNC site. (D) The DL site. (E) The LJ site. (F) The GYG site.
The thermal conductivity and volumetric heat capacity of the borehole cores were measured by a Hot Disk TPS2500S thermal constant analyzer at the Geothermic Geology Laboratory of China University of Petroleum (Beijing). The samples were derived from intact cores and tested in a saturated state in the laboratory to meet the field conditions as closely as possible. If in situ measurements were conducted, the thermal parameter values would be more accurate. For example, the thermal conductivity can be measured within an error of approximately ±10% with in situ thermal response tests (TRT), where a heat transfer fluid flowing in a ground heat exchanger is heated with an electric element and the resulting temperature perturbation is monitored (Wagner and Clauser, 2005; Raymond et al., 2011; Lee et al., 2012).
In the calculation, the uniform medium model was used to obtain the groundwater flow rate, except for the EY measuring point, which used the double-layer medium model. This is because there is an obviously different lithology in the observation depth range of the EY site, where the 17.2–30.0 m depth interval is gray sandstone with a thermal conductivity of 0.9698 W/mK, but the 30.0–34.6 m depth interval is red mudstone with a thermal conductivity of 2.276 W/mK. Due to the layered lithology, the piecewise function fitting curve is used in the process of calculating the corrected heat flux.
Following the calculation steps in Section 3.3, the groundwater flow rates for the measuring points of the MD, EY, ZNC, DL, LJ and GYG sites were calculated to be −2.085×10⁻⁸, 3.420×10⁻⁸, −6.275×10⁻⁹, 9.467×10⁻⁹, −3.3456×10⁻⁹ and 3.171×10⁻⁸ m/s, respectively. A positive value corresponds to downward flow, and a negative value represents upward flow. The fluid flow velocity is small at the ZNC and LJ sites, while the flow velocity is large at the GYG and EY sites, and the fluid flow velocity is moderate at the DL and MD sites. The geographical location shows that there are great differences in the flow velocity of the measuring points in different regions, indicating that the groundwater activity is regional.
When the flow direction is different, the shape of the temperature-depth curve is also different. Analysis shows that due to the existence of a geothermal gradient, if the fluid flows upward from the high-temperature zone to the low-temperature zone, the deep temperature gradient would be reduced, while the shallow temperature gradient can be increased; thus, the curve is convex. If the fluid flows downward from the low-temperature zone to the high-temperature zone, the shallow temperature gradient is reduced while the deep temperature gradient increases, so the curve is concave.
The heat flux value calculated directly by the measured temperature using the product of its temperature gradient and thermal conductivity is termed the uncorrected heat flux. The heat flux was corrected for the convective component by using the estimated groundwater flow rate. The corrected heat flux was obtained through the nonlinear least squares method by taking the measured temperature-depth into Eq. 4. The corrected heat flux and the estimated temperature at each measuring point depth can be acquired. Table 2 shows the results of the calculated fluid velocity, temperature gradient, uncorrected heat flux and corrected heat flux at each measuring point. Figure 5 shows the root mean squared error (RMSE) between the estimated bedrock temperature and the measured values at different depths. The calculated temperature value is very close to the measured value, and the RMSE is less than 0.2°C. This means that the corrected heat flux is basically reliable.
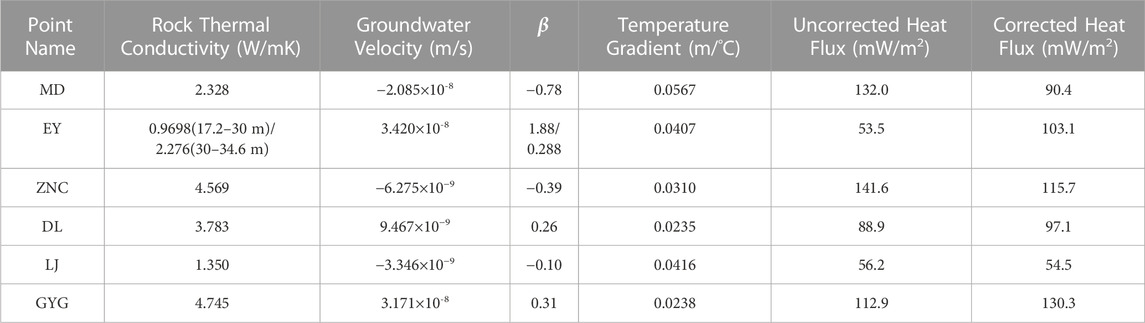
TABLE 2. Estimated groundwater velocity and corrected heat flux in northwestern Yunnan.
The relationship between the corrected heat flux and uncorrected heat flux is related to the groundwater flow rate. Downward groundwater flow would lead to a decrease in the heat flux, such as at the GYG, DL and EY sites, whereas the upward groundwater flow results in an increase in the heat flux, such as at the ZNC, LJ and MD sites. The correction of the heat flux can eliminate the influence of heat convection mentioned above. The greater the absolute value of the flow rate, the greater the portion to be corrected.
In this paper, the corrected heat flux calculated from multidepth temperature time series was compared with the heat flow data measured from boreholes in the study area. The measured data are from the quality A category in the terrestrial heat flow data compilation of mainland China (Jiang et al., 2019), the data of which are representative of the regional thermal state. The comparison of the corrected heat flux and the measured data from previous studies (Figure 6) indicates that the results of the two sets of data show good consistency.
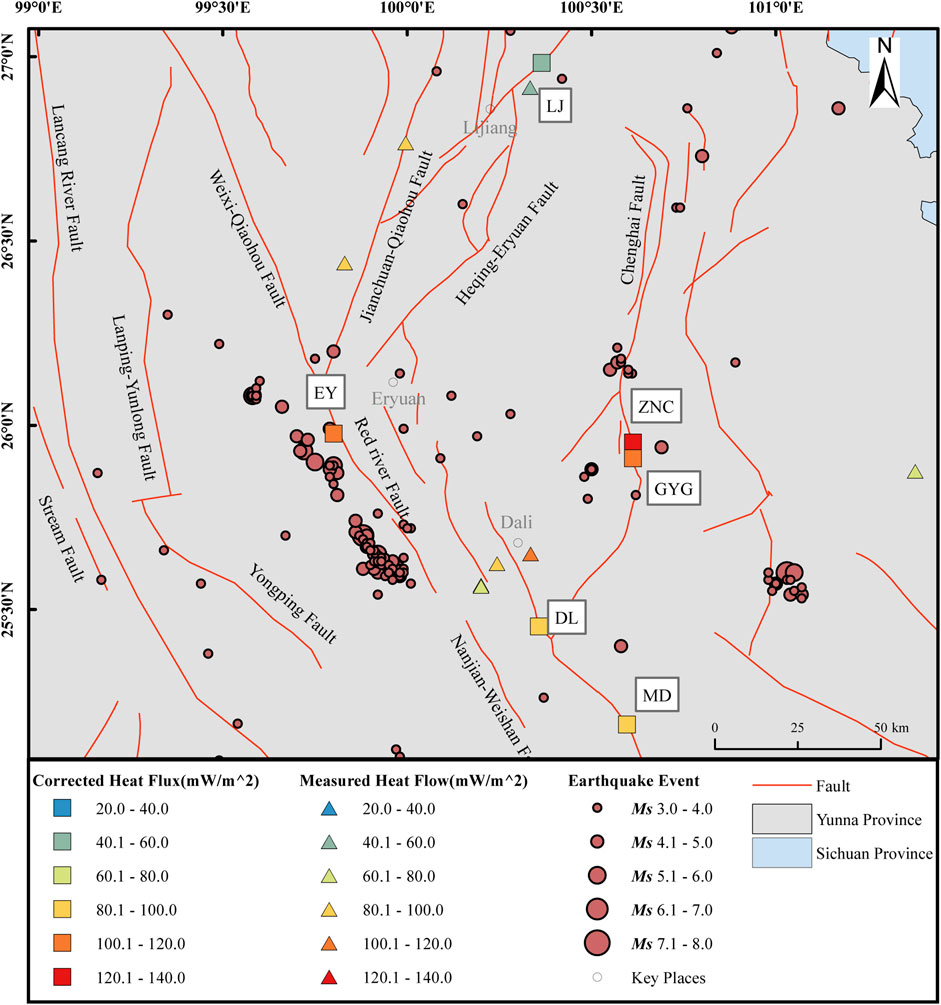
FIGURE 6. Estimated heat flux with convective effects removed, shown with the measured heat flow values from previous studies and the historical seismic events in the northwestern Yunnan. Measured heat flow data are from Jiang et al. (2019). Earthquake event refers to the historical earthquake list of China Earthquake Administration.
The terrestrial heat flow obtained through our method in the study area ranges from 54.5 to 130.3 mW/m2, with an average value of 98.5 mW/m2. Among them, the LJ sites in the northern part of the study area are in a medium heat flow area, and the ZNC, GYG and EY sites in the middle part of the area are in the high heat flow area. The DL and MD sites in the southern part of the area are in the middle to high heat flow area. The results are consistent with those of previous studies that indicated a significant horizontal geothermal change with a decreasing trend from west to east (Wang et al., 1990). The average heat flow in this area is high, and the variation between individual heat flow values is large, which is also consistent with the characteristics of the high heat flow area in the northern and southern parts of the region. These results indicate that the method in this paper is applicable to this area, which provides a new method for calculating the heat flow values in areas with strong groundwater activity and yields experience for heat flow studies in hydrothermally active areas.
The influence of tectonic activity may explain the heat flow distribution in the study area. The LJ site is located in the Gantangzi section of the Lijiang-Xiaojinhe fault. A fault event in this area might be formed by the overall collapse of the strata on the southern side of the basin due to strong vibration. The posterior edge of the collapse body is a normal fault, and the strata on the downthrown side are characterized by a reverse slope due to tilting. There is a significant extensional characteristic (Chen, 2007). Some studies have suggested that the fault is still in the earthquake cluster period but temporarily in the strain accumulation stage and is now in the quiet period (Wu et al., 2009). The geothermal background value in this area is low. The MD and DL sites are located at the intersection of the southern section of the Weixi-Qiaohou fault and the middle section of the Red River fault. Historically, the strong earthquake activity in the southern section of the Weixi-Qiaohou fault and the middle section of the Red River fault has not been significant. The largest earthquake that occurred was the 1984 Shanglan M 61/4 earthquake, so the area is characterized by a medium–high heat flow background. The EY site is located in the northern section of the Weixi-Qiaohou fault, close to Yangbi County, and the earthquake is active throughout history. The recent earthquakes in Yangbi County may indicate that the seismic activity in northwestern Yunnan has an increasing trend (Yang et al., 2022). This area is characterized by a high thermal background. The GYG and ZNC sites in Binchuan are located on the east side of the Binchuan Basin. The area has strong vertical fault movement, and the heat flow value is high.
The earthquakes in the study area are mostly in Yangbi County, Dali Prefecture, followed by Eryuan County, and there are also many seismic events with lower magnitudes in the towns surrounding Binchuan County. The comparison between the heat flow value and the seismic events might indicate that the strong neotectonic movement not only led to high geothermal characteristics in the activity center but also caused a relatively high geothermal background in the surrounding area.
At present, the calculation of terrestrial heat flow mainly occurs through oil boreholes in the basin (Liu et al., 2005; Zuo et al., 2020; Shi et al., 2022). There are many heat flow measurements in the basin relative to those in other areas, whereas few boreholes have been drilled in mountainous areas or plateaus. Our method that utilizes long-term temperature observations in shallow boreholes can be applied to some areas with high drilling costs, such as mountainous land. Furthermore, in areas with strong groundwater activity, the heat flux is often disturbed by groundwater migration. The movement of groundwater flow is accompanied by the migration of heat, which leads to misestimation of the heat flux from direct measurements of the temperature profile that cannot reflect the real thermal state of the area. Our method can correct the disturbance of convective heat flux to obtain a more accurate regional heat flow background. This method can be applied to the collection of preliminary data in engineering construction and scientific research because of its advantages of convenience, high efficiency and low-cost.
However, this method still has the following limitations. First, the difference between the corrected heat flux and the uncorrected heat flux is related to the flow rate of the groundwater, which indicates that the migration mode of groundwater affects the corrected heat flux. Our method is currently applicable to areas dominated by vertical heat flux. The influence of horizontal flow needs to be considered if it is significant compared to the influence of vertical flow in future work. Second, the temperature in shallow boreholes may be influenced by paleoclimate (Westaway and Younger, 2013), which would lead to overestimations of vertical groundwater flux and thus affect the corrected heat flux (Irvine et al., 2016). However, an accurate paleotemperature history of the study area is difficult to obtain, so we did not make a paleoclimate correction for the results. Third, the method requires collection of the borehole lithology or hydrogeological data of the local area to obtain the thickness of the local aquifer that is used to make absolute correction of the convective heat flux. Finally, we calculated the average fluid velocity for many years, which represents the stable change and cannot show the fluid changes in the short term. In fact, in the future, the process of dynamic change in the fluid velocity can be obtained by using a multidepth temperature-depth sequence (Munz and Schmidt, 2017; Liu et al., 2020), and the convective heat flux component can be corrected more accurately.
In this paper, a method for calculating the terrestrial heat flow by using long-term multidepth observational data of shallow temperature was proposed. The method was applied to northwestern Yunnan, China, based on the bedrock temperature data of six measuring points for 2–4 years. Temperature-depth sequence analysis was carried out, and the groundwater flow rate of the measuring points was estimated. The heat flux was corrected for the influence of groundwater movement, which can reflect the deep thermal background. The main conclusions are as follows.
(1) We proposed a method to calculate the terrestrial heat flow that corrects the convective heat flux using the groundwater flow velocity obtained from the temperature-depth sequence. This method can be applied to areas with strong hydrothermal activity and was verified by a theoretical model. The results show that the corrected heat flux obtained by this method is in good agreement with the heat flow given in the theoretical model, which indicates the reliability of the method.
(2) Taking northwestern Yunnan as an example, the groundwater flow velocity was calculated using a temperature time series of 2–4 years measured from six points in the study area. The results show that the groundwater flow rates at the measuring points of GYG, DL and EY are 3.171×10⁻⁸, 9.467×10⁻⁹ and 3.420×10⁻⁸ m/s, respectively, where the flow direction is downward. The fluid flow rates at the measuring points of ZNC, LJ and MD are −6.275×10⁻⁹, −3.346×10⁻⁹ and −2.085×10⁻⁸ m/s, respectively, with an upward flow direction.
(3) Using the calculated flow rate, the heat flux was corrected to obtain the heat flow without disturbance by thermal convection. The corrected heat fluxes at the measuring points of the MD, EY, ZNC, DL, LJ and GYG are 90.4, 103.1, 115.7, 97.1, 54.5 and 130.3 mW/m2, respectively, with an average of 94.5 mW/m2. The results are in good agreement with the previously measured heat flow data in deep boreholes of the quality A category.
(4) The comparative analysis of the corrected heat flux and the uncorrected heat flux reveals that the difference between these two fluxes is related to the groundwater flow rate. The corrected heat flux is greater than the uncorrected heat flux where downward migration of groundwater exists, and the corrected heat flux is smaller than the uncorrected heat flux where groundwater migrates upward. Thus, the mode of groundwater movement has an effect on the corrected heat flux.
This study provides an economical and efficient method that is suitable for heat flow estimation in hydrothermally active areas. Our research also supplements terrestrial heat flow data in northwestern Yunnan. In the future, long-term shallow temperature observations can be used to estimate the terrestrial heat flow in high-altitude and hydrothermally active areas.
The raw data supporting the conclusion of this article will be made available by the authors, without undue reservation.
The study was designed by QL, the writing and preparation of the original draft were conducted by WW, and the review and editing of the final manuscript were performed by QL, LC, and SC. All authors contributed to the article and approved the submitted version.
This research was supported by the Basic Research Funds from the Institute of Geology, China Earthquake Administration (IGCEA 2002, IGCEA 1910), the Scientific Research Fund of the Guilin University of Technology (GUTQDJJ2019032), the National Natural Science Foundation of China (42274079) and the National Key Research and Development Program of China (2018YFC1503304).
We thank Chuanqing Zhu and Bo Zhou for their help in measuring thermophysical parameters in the laboratory. We would also like to thank the reviewers and editors whose comments helped improve our article.
The authors declare that the research was conducted in the absence of any commercial or financial relationships that could be construed as a potential conflict of interest.
All claims expressed in this article are solely those of the authors and do not necessarily represent those of their affiliated organizations, or those of the publisher, the editors and the reviewers. Any product that may be evaluated in this article, or claim that may be made by its manufacturer, is not guaranteed or endorsed by the publisher.
Anderson, M. P. (2005). Heat as a ground water tracer. Ground Water 43 (6), 951–968. doi:10.1111/j.1745-6584.2005.00052.x
Bredehoeft, J. D., and Papaopulos, I. S. (1965). Rates of vertical groundwater movement estimated from the Earth's thermal profile. Water Resour. Res. 1 (2), 325–328. doi:10.1029/WR001i002p00325
Chen, X. (2007). Present-day horizontal deformation status of continental China and its driving mechanism. Sci. China Ser. D Earth Sci. 50, 1663–1673. doi:10.1007/s11430-007-0108-7
Davies, J. H. (2013). Global map of solid Earth surface heat flow. Geochem. Geophys. Geosystems 14 (10), 4608–4622. doi:10.1002/ggge.20271
Furlong, K. P., Chapman, D. S., and Sciences, P. (2013). Heat flow, heat generation, and the thermal state of the lithosphere. Annu. Rev. Earth 41, 385–410. doi:10.1146/annurev.earth.031208.100051
He, L. J. (2015). Thermal regime of the north China craton: Implications for craton destruction. Earth-Science Rev. 140, 14–26. doi:10.1016/j.earscirev.2014.10.011
He, L. J., and Wang, J. Y. (2021). Concept and application of some important terms in Geothermics and Geophysics such as terrestrial heat flow. China Termin. 23 (03), 3–9.
Hu, S. B., and Xiong, L. P. (1994). Correction for disturbance of vertical groundwater movement to heat flow measurement. Sci. Geol. Sin. 29 (1), 85–92.(in Chinese with English Abstract)
Irvine, D. J., Briggs, M. A., Lautz, L. K., Gordon, R. P., McKenzie, J. M., and Cartwright, I. (2017). Using diurnal temperature signals to infer vertical groundwater-surface water exchange. Ground Water 55 (1), 10–26. doi:10.1111/gwat.12459
Irvine, D. J., Cartwright, I., Post, V. E. A., Simmons, C. T., and Banks, E. W. (2016). Uncertainties in vertical groundwater fluxes from 1-D steady state heat transport analyses caused by heterogeneity, multidimensional flow, and climate change. Water Resour. Res. 52 (2), 813–826. doi:10.1002/2015WR017702
Jiang, G. Z., Hu, S. B., Shi, Y. Z., Zhang, C., Wang, Z. T., and Hu, D. (2019). Terrestrial heat flow of continental China: Updated dataset and tectonic implications. Tectonophysics 753, 36–48. doi:10.1016/j.tecto.2019.01.006
Kurylyk, B. L., and Irvine, D. J. (2016). Analytical solution and computer program (FAST) to estimate fluid fluxes from subsurface temperature profiles. Water Resour. Res. 52 (2), 725–733. doi:10.1002/2015wr017990
Kurylyk, B. L., Irvine, D. J., Carey, S. K., Briggs, M. A., Werkema, D. D., and Bonham, M. (2017). Heat as a groundwater tracer in shallow and deep heterogeneous media: Analytical solution, spreadsheet tool, and field applications. Hydrol. Process 31 (14), 2648–2661. doi:10.1002/hyp.11216
Kurylyk, B. L., and Irvine, D. J. (2019). Heat: An overlooked tool in the practicing hydrogeologist's toolbox. Ground Water 57 (4), 517–524. doi:10.1111/gwat.12910
Lee, C., Park, M., Park, S., Won, J., and Choi, H. (2012). Back-analyses of in-situ thermal response test (TRT) for evaluating ground thermal conductivity. Int. J. energy Res. 37 (11), 1397–1404. doi:10.1002/er.2929
Liu, Q. Y., Chen, S. Y., Chen, L. C., Liu, P. X., Yang, Z. Z., and Lu, L. L. (2020). Detection of groundwater flux changes in response to two large earthquakes using long-term bedrock temperature time series. J. Hydrology 590, 125245. doi:10.1016/j.jhydrol.2020.125245
Liu, Q. Y., Chen, S. Y., Jiang, L. W., Wang, D., Yang, Z. Z., and Chen, L. C. (2019). Determining thermal diffusivity using near-surface periodic temperature variations and its implications for tracing groundwater movement at the eastern margin of the Tibetan Plateau. Hydrol. Process. 33 (8), 1276–1286. doi:10.1002/hyp.13399
Liu, Q. Y., Zhang, L. Y., Zhang, C., and He, L. J. (2016). Lithospheric thermal structure of the North China Craton and its geodynamic implications. J. Geodyn. 102, 139–150. doi:10.1016/j.jog.2016.09.005
Liu, S. W., Wang, L. S., Gong, Y. L., Li, C., Li, H., and Han, Y. B. (2005). Thermal-rheological structure of the lithosphere beneath jiyang depression: Its implications for geodynamics. Sci. China (Series D Earth Sci. 48, 1569–1584. doi:10.1360/02yd0286
MacQuarrie, K. T. B., and Kurylyk, B. L. (2014). A new analytical solution for assessing climate change impacts on subsurface temperature. Hydrol. Process. 28 (7), 3161–3172. doi:10.1002/hyp.9861
Mansure, A. J., and Reiter, M. (1979). A vertical groundwater movement correction for heat flow. J. Geophys. Res. Solid Earth 84 (B7), 3490–3496. doi:10.1029/jb084ib07p03490
Munz, M., and Schmidt, C. (2017). Estimation of vertical water fluxes from temperature time series by the inverse numerical computer program FLUX-BOT. Hydrol. Process. 31 (15), 2713–2724. doi:10.1002/hyp.11198
Njinju, E. A., Kolawole, F., Atekwana, E. A., Stamps, D. S., Atekwana, E. A., Abdelsalam, M. G., et al. (2019). Terrestrial heat flow in the Malawi Rifted Zone, East Africa: Implications for tectono-thermal inheritance in continental rift basins. J. Volcanol. Geotherm. Res. 387, 106656. doi:10.1016/j.jvolgeores.2019.07.023
Prol-Ledesma, R. M., and Morán-Zenteno, D. J. (2019). Heat flow and geothermal provinces in Mexico. Geothermics 78, 183–200. doi:10.1016/j.geothermics.2018.12.009
Rau, G. C., Andersen, M. S., McCallum, A. M., Roshan, H., and Acworth, R. I. (2014). Heat as a tracer to quantify water flow in near-surface sediments. Earth-Science Rev. 129, 40–58. doi:10.1016/j.earscirev.2013.10.015
Raymond, J., Therrien, R., Gosselin, L., and Lefebvre, R. (2011). A review of thermal response test analysis using pumping test concepts. Groundwater 49 (6), 932–945. doi:10.1111/j.1745-6584.2010.00791.x
Shan, C., and Bodvarsson, G. (2004). An analytical solution for estimating percolation rate by fitting temperature profiles in the vadose zone. J. Contam. Hydrol. 68 (1-2), 83–95. doi:10.1016/S0169-7722(03)00126-8
Shi, Y. Z., Jiang, G. Z., Shi, S. M., Wang, Z. C., Wang, S. J., Wang, Z. T., et al. (2022). Terrestrial heat flow and its geodynamic implications in the northern Songliao Basin, Northeast China. Geophys. J. Int. 229 (2), 962–983. doi:10.1093/gji/ggab500
Soto-López, C. D., Meixner, T., and Ferré, T. P. A. (2011). Effects of measurement resolution on the analysis of temperature time series for stream-aquifer flux estimation. Water Resour. Res. 47, W12602. doi:10.1029/2011WR010834
Taniguchi, M., Shimada, J., Tanaka, T., Kayane, I., Sakura, Y., Shimano, Y., et al. (1999a). Disturbances of temperature-depth profiles due to surface climate change and subsurface water flow: 1. An effect of linear increase in surface temperature caused by global warming and urbanization in the tokyo metropolitan area, Japan. Water Resour. Res. 35 (5), 1507–1517. doi:10.1029/1999wr900009
Taniguchi, M., Williamson, D. R., and Peck, A. J. (1999b). Disturbances of temperature-depth profiles due to surface climate change and subsurface water flow: 2. An effect of step increase in surface temperature caused by forest clearing in southwest western Australia. Water Resour. Res. 35, 1519–1529. doi:10.1029/1998wr900010
Wagner, R., and Clauser, C. (2005). Evaluating thermal response tests using parameter estimation for thermal conductivity and thermal capacity. J. Geophys. Eng. 2 (4), 349–356. doi:10.1088/1742-2132/2/4/s08
Wang, J. A., Xu, Q., and Zhang, W. (1990). Heat flow data and some Geologocal-Geothermal problems in Yunnan Province. Seismol. Geol. 12 (4), 367–377.(in Chinese with English Abstract)
Wang, Z. T., Gao, P., Jiang, G. Z., Wang, Y. B., and Hu, S. B. (2021). Heat flow correction for the high-permeability formation: A case study for xiong’an new area. Lithosphere 2021 (Special 5), 9171191. doi:10.2113/2021/9171191
Westaway, R., and Younger, P. L. (2013). Accounting for palaeoclimate and topography: A rigorous approach to correction of the British geothermal dataset. Geothermics 48, 31–51. doi:10.1016/j.geothermics.2013.03.009
Wu, Z. H., Zhang, Y. S., Hu, D. G., Zhao, X. T., and Ye, P. S. (2009). Late Quaternary normal faulting and its kinematic mechanism of eastern piedmont fault of the Haba-Yulong Snow Mountains in northwestern Yunnan, China. Sci. China Ser. D Earth Sci. 52, 1470–1484. doi:10.1007/s11430-009-0148-2
Xing, Q. Y., Su, J., and Ma, J. (1986). Ne-Trending structures in Dali seismic zone, yunnan province. Earthquake 2 (2), 44–50.(in Chinese with English Abstract)
Yang, T., Li, B., Fang, L., Su, Y., Zhong, Y., Yang, J., et al. (2022). Relocation of the foreshocks and aftershocks of the 2021 Ms 6.4 Yangbi earthquake sequence, Yunnan, China. J. Earth Sci. 33, 892–900. doi:10.1007/s12583-021-1527-7
Yao, L. S., Li, Q. R., and Ma, W. H. (1983). Geothermal geological characteristics of Yunnan. Yunnan Geol. 1, 47–56.(in Chinese)
Zhang, C., Jiang, G. Z., Shi, Y. Z., Wang, Z. T., Wang, Y., Li, S. T., et al. (2018a). Terrestrial heat flow and crustal thermal structure of the Gonghe-Guide area, northeastern Qinghai-Tibetan plateau. Geothermics 72, 182–192. doi:10.1016/j.geothermics.2017.11.011
Zhang, Z. H., Chen, S. Y., and Liu, P. X. (2018b). A key technology for monitoring stress by temperature: Multichannel temperature measurement system with high precision and low power consumption. Seismol. Geol. 40 (2), 499–510. (in Chinese with English Abstract). doi:10.3969/j.issn.0253-4967.2018.02.015
Zhu, C. Q., Qiu, N. S., Chen, T. G., Xu, M., Ding, R., and Yang, Y. B. (2022). Thermal lithospheric thickness of the Sichuan Basin and its geological implications. Acta Geol. Sinica-English Ed. 96 (4), 1323–1330. doi:10.1111/1755-6724.14976
Keywords: terrestrial heat flow, temperature-time series, hydrothermal activity, heat flux correction, groundwater flow velocity, convective heat flux
Citation: Wang W, Liu Q, Chen S, Liu P and Chen L (2023) Estimation of terrestrial heat flow in hydrothermally active areas based on long-term bedrock temperature observations: a case study of northwestern Yunnan, China. Front. Earth Sci. 11:1204714. doi: 10.3389/feart.2023.1204714
Received: 12 April 2023; Accepted: 12 June 2023;
Published: 22 June 2023.
Edited by:
Paolo Capuano, University of Salerno, ItalyReviewed by:
Daniela Blessent, Universidad de Medellín, ColombiaCopyright © 2023 Wang, Liu, Chen, Liu and Chen. This is an open-access article distributed under the terms of the Creative Commons Attribution License (CC BY). The use, distribution or reproduction in other forums is permitted, provided the original author(s) and the copyright owner(s) are credited and that the original publication in this journal is cited, in accordance with accepted academic practice. No use, distribution or reproduction is permitted which does not comply with these terms.
*Correspondence: Qiongying Liu, bGl1cWlvbmd5aW5nQGllcy5hYy5jbg==
Disclaimer: All claims expressed in this article are solely those of the authors and do not necessarily represent those of their affiliated organizations, or those of the publisher, the editors and the reviewers. Any product that may be evaluated in this article or claim that may be made by its manufacturer is not guaranteed or endorsed by the publisher.
Research integrity at Frontiers
Learn more about the work of our research integrity team to safeguard the quality of each article we publish.