 Jaclyn Gehring
 Edward Beighley1,2
- 1Department of Civil and Environmental Engineering, Northeastern University, Boston, MA, United States
- 2Department of Marine and Environmental Sciences, Northeastern University, Boston, MA, United States
- 3Department of Chemistry and Chemical Biology, Northeastern University, Boston, MA, United States
The recently launched Surface Water and Ocean Topography (SWOT) satellite will simultaneously measure river surface water widths, elevations, and slopes. These novel observations combined with assumptions for unobserved bathymetry and roughness enable the derivation of river discharge. Derived discharge data will not be available until the fall of 2023, despite the satellite having completed approximately 6 months of observations for validation and calibration and transitioning into the nominal orbit phase. SWOT has an irregular flyover frequency, ranging from roughly 1 to 10 times per 21 days. Here, we present how best to use SWOT data when it becomes live, including consideration of how best to accommodate or utilize the irregular flyover frequency of SWOT as it intersects with river reaches. We investigate the predicted capabilities of SWOT for several major rivers using synthetic/theoretical SWOT time series data and evaluate how the characteristics of river discharge dynamics and SWOT sampling frequency impact discharge estimates. This analysis indicates the irregular frequency of SWOT best captures the hydrology of larger, more stable, rivers but presents challenges in smaller, flashier rivers, particularly when sampling frequency decreases (i.e., falls to once per 21 days). Further, the use of SWOT discharge for quantifying constituent fluxes is considered. We provide recommendations concerning how to best use SWOT data for applications related to hydrology and biogeochemistry, including how to design studies to accommodate its irregular orbit cycle.
1 Introduction
River discharge is a significant component of the hydrologic cycle. However, in situ measurements are in decline mainly as a result of the cost and effort of maintaining monitoring infrastructure (Gleason and Durand, 2020; Samboko et al., 2020; Gehring et al., 2022), leaving few regions with concentrated in-stream networks and some major rivers ungauged (Pavelsky et al., 2014; Frasson et al., 2021) Monitoring river discharge improves understanding of stream ecosystem health, water quality, potential for flooding, and water supply. Such measurements are critical for water resource management, plus the monitoring and modeling of changing hydrologic conditions due to anthropogenic climate forcing (Gleason and Durand, 2020; Gehring et al., 2022). Thus, there is a need for remote sensing as a means to augment the limited availability of in situ streamflow measurements.
The Surface Water and Ocean Topography (SWOT) mission launched in December 2022 and is dedicated to measuring Earth’s surface waters (Biancamaria et al., 2016), predominantly utilizing data from the KaRIn (Ka-band Radar Interferometer) instrument in its application to hydrology. SWOT followed a 6 month fast-sampling orbit (1-day repeat) in which the calibration and validation mission objectives were completed; the nominal orbit phase, which follows a 21-day repeat cycle, began in mid-July of 2023. While the operational period is only expected to last 3 years, many satellites tend to out-live such estimations (Nickles et al., 2019). The 21-day orbit and the unprecedented wide swath (120 km width) will provide global coverage and frequent sampling of major water bodies, including an average revisit time of 10–11 days at the equator (i.e., observations 1–2 times per 21-day orbit) that decreases to 1–2 days in the Arctic (i.e., observations 10+ times per 21-day orbit) (Biancamaria et al., 2016; Nickles et al., 2019). As SWOT will sample different areas at different frequencies, it is instructive to consider how best to utilizes these novel, temporally irregular observations for hydrologic and related research (Revel et al., 2021).
To enable estimations of river discharge, SWOT will simultaneously measure river water surface widths, elevations, and slopes (Biancamaria et al., 2016). Initial research focused on algorithms for processing SWOT data and deriving river discharges, with uncertainty mainly related to the flow laws used and unknown parameters such as bathymetry (Yoon et al., 2016). Biancamaria et al. (2016) report SWOT water surface elevation to have a minimum error of 10 cm for most rivers. Approximation of average SWOT discharge in ungauged basins is expected to be within 35% relative error (Durand et al., 2016). While SWOT has the potential to improve upon current remote sensing capabilities, it will not sample all rivers at the same temporal frequency—varying in both the frequency of return (i.e., the number of returns per 21-day orbit cycle will vary between 0- to 10-times depending on location) and the distribution of returns (e.g., if a river is sampled 3 times per 21 day orbit it may be sampled on days 1, 4, and 20 or days 1, 10, and 15—not every 7 days).
Although other studies have attempted to predict SWOT based discharge algorithm performance (Durand et al., 2016; Hagemann et al., 2017; Revel et al., 2021), there has not been a study highlighting the temporal nature of SWOT within the context of broader hydrological or biogeochemical studies. For instance, Nickles et al. (2019) focused only on temperate tributaries of the Mississippi with return cycles of 1–4 days and Elmer et al. (2021) used 10 Alaskan sub-basins with return cycles of 4–7 days and similar hydrologic patterns. Solander et al. (2016) evaluated SWOT temporal sampling in 63 California reservoirs, and determined the conversion of water storage data to monthly values would not cause severe aliasing effects. We move beyond these studies by considering the average annual discharges and the volume of water export captured using SWOT-based discharge for rivers of vastly different discharges, hydrographs, and latitudes, and do so while considering the impact of sampling frequency for each.
We also discuss the impact of the quality of discharge data attained upon resultant fluvial fluxes of other relevant materials including dissolved organic carbon (DOC) and sediment. The instantaneous and annual loads of materials exported by rivers is impacted by ephemeral hydrologic events, particularly floods (Moatar et al., 2020) which can be missed by the non-continuous sampling returns of satellites. For instance, DOC concentrations increase with increasing discharge making flood events more important for DOC fluxes annually than for water fluxes annually (Raymond et al., 2016).
In this study, we aim to highlight the significance of SWOT on a broader scale—demonstrating the potential of SWOT to capture river discharge for reaches around the world, including Arctic rivers, temperate rivers, and the largest river in the world, the Amazon, that drains the equatorial Amazon rainforest. Daily discharge from gauges were used to develop synthetic and “theoretical” SWOT discharge time series, with the intention of evaluating the effects of irregular sampling on the discharge estimated for rivers of different sizes, hydrologic patterns, and latitudes. The following research questions were evaluated: 1) How does the reliance on irregular sampling impact discharge timeseries and annual water fluxes? and 2) What do the captured flow dynamics mean in terms of the flux of materials (e.g., dissolved organic matter or sediment transport)?
2 Methodology
2.1 Site selection
In order to determine how frequently different river reaches will be observed by the SWOT satellite, the SWOT orbit shapefile (Centre National d’Etudes Spatiales) was overlain by the SWOT River Database (SWORD), which divides river reaches into approximately 10 km segments and archives spatial and reach attributes for SWOT-observable rivers (Altenau et al., 2021). Figure 1 displays the resulting observations for each reach per 21-day orbit cycle. Rivers at different latitudinal gradients were then considered for analysis, following the goal of demonstrating the applicability of SWOT in different areas. The resulting SWOT observations per 21-day orbit at select gauge locations were paired using the point location of the gauge and the orbit shapefile.
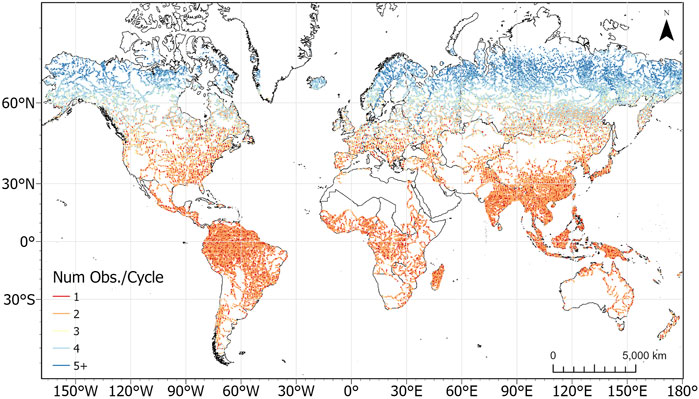
FIGURE 1. Number of observations per orbit cycle for the Surface Water and Ocean Topography (SWOT) satellite along rivers more than 50–100 km in width (represented by SWORD river reaches).
This study focuses on 4 rivers that span the latitudinal gradient from the Arctic to the equator and a large range in river size: Mackenzie (Canada), Iowa and Mississippi (United States), and Amazon (Brazil). At their gauging stations, these rivers’ reaches are SWOT observable, being greater than 50–100 m in width (Pavelsky et al., 2014; Durand et al., 2016). The rivers range in size, hydrologic patterns, and latitude providing valuable insights into how the flow dynamics of rivers interact with the different temporal frequencies of sampling by SWOT to impact remote sensed estimates of discharge (Table 1).
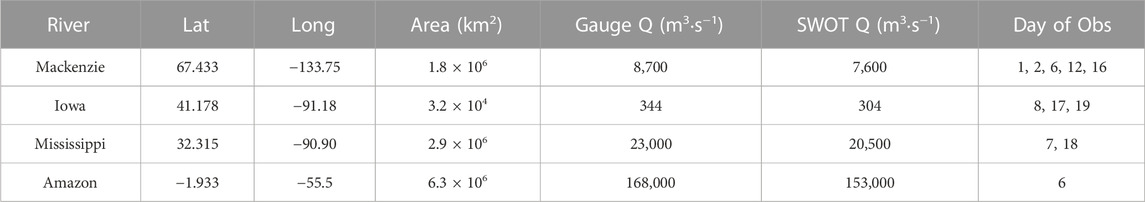
TABLE 1. Gauge metadata and the days of SWOT observations used for the synthetic time series for the rivers used in the study. The average annual flows (Q) observed by the gauge and synthetic time series are also shown.
Starting in the Arctic, the Mackenzie River is gauged at Tsiigehtchic, has a watershed area of 1.8 million km2, and is the 4th largest Arctic River based on annual discharge (McClelland et al., 2023). Discharge data were accessed from ArcticGRO (McClelland et al., 2023). The temperate Iowa River is a tributary to the Mississippi River with a watershed of 32,300 km2 upstream of the gauging station in Wapello, IA (USGS 05465500). The Mississippi River was sampled at Vicksburg (USGS 07289000), where it has an upstream watershed area of 2.9 million km2, which is similar to that of the Mackenzie. Daily discharge data for the Iowa and Mississippi Rivers were accessed through the United States Geological Survey (USGS) National Water Quality Information System (USGS, 2023). The Amazon River is the largest river on Earth with a watershed of approximately 6.3 million km2. Daily discharge data for the Amazon River were downloaded from the Óbidos gauging station supported by the Brazilian National Agency for Water. Table 1 shows the point coordinates for the gauged river locations, as well as the SWOT information obtained using the intersections of the SWOT orbit shapefile.
2.2 SWOT synthetic timeseries
Three years of gauge and modeled SWOT discharge data (2019–2021) are analyzed in this study to reflect the expected lifetime of SWOT. The approach of Nickles et al. (2019) for generating synthetic SWOT discharges at each gauge location is used, which follows obtaining discharge measurements at corresponding SWOT overpass dates and the incorporation of random uncertainty based on the described errors (Relative Root-Mean-Square Error and relative bias) in the Bayesian AMHG-Manning algorithm (Hagemann et al., 2017). In this study, one hundred iterations of uncertainty were added to each synthetic SWOT time series using normal distributions transformed in the log-space to capture the uncertainty in large and small discharge measurements (Nickles et al., 2019). This methodology allows the evaluation of the synthetic time series with respect to 1) temporal frequency and 2) uncertainty of the discharge related to the selected discharge algorithm [in this case, the uncertainty reported from the Bayesian AMHG-Manning algorithm from Hagemann et al. (2017), with an emphasis on the former in this study]. Realistically, the accuracy of real-time SWOT discharge will mainly be governed by flow laws used to derive discharge, discharge inversion algorithms for unobserved parameters, and physical observations of elevation, width, and slope (Yoon et al., 2016; Frasson et al., 2021). Notably, SWOT discharge estimates will be limited by bias (systematic error) that is not accounted for using the synthetic time series (Durand et al., 2023). Other studies have evaluated the accuracy of discharge and the sensitivity of measurements to selected algorithms in depth (Durand et al., 2016; Gleason and Durand, 2020; Altenau et al., 2021).
2.3 Effects of sub-sampling
In addition to generating synthetic SWOT time series at select gauge locations using the SWOT orbit, the impact of SWOT’s irregular temporal frequency on estimated hydrology is evaluated by sampling gauge discharge time series throughout its 21-day interval. The objective of this methodology is to demonstrate the effects of temporal sampling in rivers where flow characteristics vary. Using the gauge data, monthly maximum flows and subsequent reductions in flows from 0 to 21 days after the peak event were determined to assess how sensitive to under sampling a given river might be (i.e., to determine the percentage of peak discharge missed if the river is sampled 0–21 days after peak discharge).
Further exploring the various effects of sampling for different rivers, “conceptual” SWOT time series were generated by assuming SWOT will observe the rivers 1-, 3-, and 6-times per its 21-day cycle (representing a range from minimal to near-maximum observations for the selected rivers). Including these three observation rates per river allows the impact of theoretical observation frequency upon estimated discharge to be determined. Included in these observations is the actual observation rate for each river, which ranges from once per 21 days for the Amazon to five times per 21 days for the Mackenzie River (Table 1).
3 Results
3.1 Annual water flux
Daily discharge data available from the select gauges are used here as the “truth” time series. The synthetic SWOT time series for the four rivers (one hundred iterations) are shown in Figure 2, where random uncertainty has been added to simulate possible error from SWOT. In order to compare SWOT time series to the gauge time series, linear interpolation is assumed between observations for the SWOT synthetic data, allowing for a “daily” to daily comparison.
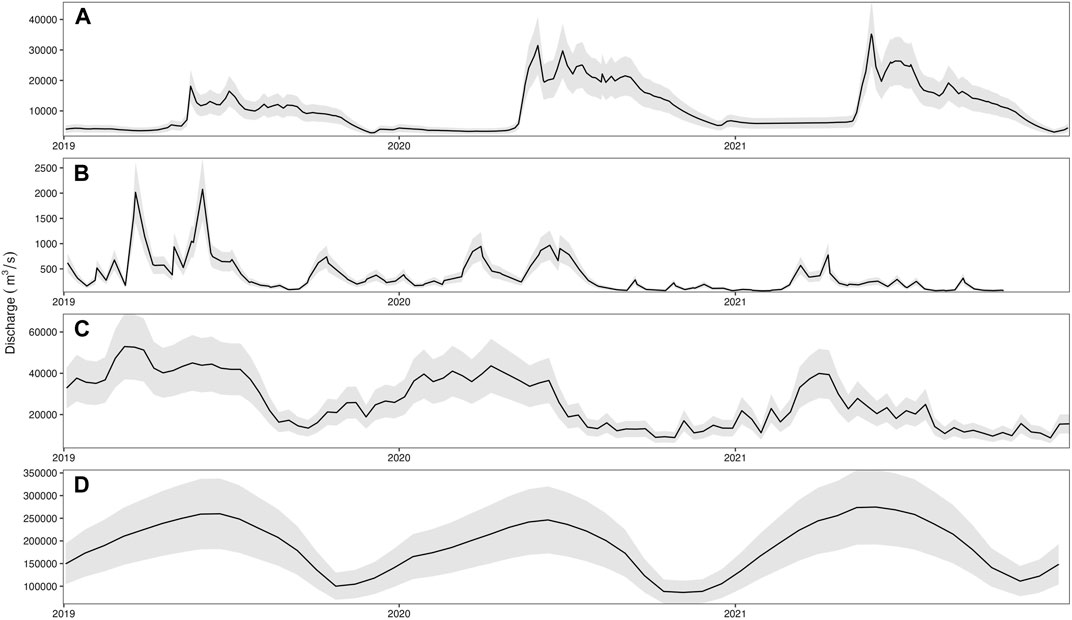
FIGURE 2. Example time series for the (A) Mackenzie River (Tsiigehtchic) in the Northwest Territories of Canada, (B) Iowa River (USGS 05465500), (C) Mississippi River (USGS 07289000) in the United States, and (D) Amazon River (Óbidos) in Brazil, where the gauge discharge is shown in black and the range in uncertainty on the time series is shown in grey using random normal distribution in the log space. 100 iterations of uncertainty were run for each time series.
Using a random synthetic time series (Figure 2), average discharge was 2.24 × 10⁸ m3·yr−1 for the Mackenzie, 8.77 × 10⁶ m3·yr−1 for the Iowa, 5.92 × 10⁸ m3·yr−1 for the Mississippi, and 4.41 × 10⁹ m3·yr−1 for the Amazon. Comparing to gauge-based estimates (Table 1), SWOT underestimated annual discharge by 11.7%, 11.5%, 10.6%, and 9%, for the Mackenzie, Iowa, Mississippi, and Amazon Rivers, respectively. The percent difference in average discharge from SWOT to gauge time series for each year ranges from −13% to −8% for the Mackenzie, −13% to −9% for the Iowa, −15% to −3% for the Mississippi, and −19% to −1% for the Amazon.
3.2 Sampling frequency and bias
Figure 4 displays the various effects of observation frequency for the rivers in this study. Here, the maximum monthly discharge is determined and subsequent discharge values are recorded, simulating what would happen if SWOT were to observe the river within x days of the peak monthly flow. The Amazon River displays the smallest change in discharge (∼10%) as the number of days from peak increase. The Mackenzie and Mississippi Rivers display a similar trend, although the differences in discharge were greater as observations move farther from the day of the peak. More than 15% of the peak monthly flow is not captured in the observation 10 days from the peak for the Mackenzie and Mississippi Rivers. In the Mackenzie River, the maximum percent difference occurs 19-days post peak (42%) and decreases (27%) 20-days post peak, although this is likely an artificial improvement. The Iowa River exhibited the greatest sensitivity to sampling frequency, with a 50% drop in estimated discharge between monthly peak discharge and a theoretical sampling occurring 10- or 20-days later.
The effects of sampling frequency are further evaluated in Figure 5, where the volume of water captured by each incremental flow value is compared to the volume of flow from the gauge. Across all four rivers, the cumulative volumes of water from the various SWOT time series are less than that of the gauges (i.e., annual discharge is underestimated by SWOT compared to gauges; Table 1). If the Mississippi River were to be observed once per SWOT’s 21-day orbit, the satellite would capture 68% of the total volume of water. In comparison, the Amazon River could be observed at any of the theoretical frequencies (1, 3, or 6), and at least 93% of the total volume would be accounted for.
Figure 6 displays flow exceedance curves for the gauged discharge data and SWOT time series. Flow exceedance curves show how frequently a given discharge value will occur, or how often this value is exceeded (i.e., by some percentage of time). The median daily flow is shown at 50% exceedance. In most of the rivers, the median flow values given by the curves of various SWOT temporal time series differ from those of the gauge. The median daily flow values given by the gauges for the Mackenzie, Iowa, Mississippi, and Amazon Rivers are approximately 6,600, 300, 23,000, and 188,600 m3·s−1, respectively. Median flow values given by the SWOT time series are between 5,500 and 6,6,00 m3·s−1 for the Mackenzie, 290–320 m3·s−1 for the Iowa, 18,900 and 20,000 m3·s−1 for the Mississippi, and 156,000 to 160,000 m3·s−1 for the Amazon.
4 Discussion
4.1 Variations in sampling frequency
On average, higher latitude reaches will be observed at higher frequencies, though the mainstems of some major tropical rivers will also include sites that are observed 4 to 5 times per orbit (Figure 1). In the tropics and elsewhere, the exact physical point location of a river’s gauging station may be observed infrequently in an orbit cycle. However, nearby reaches may be observed more frequently and used as surrogates to increase sampling frequency when desired (Patil and Stieglitz, 2012). The Amazon at Óbidos provides one such example, where although there is only one observation per 21-day orbit directly at Óbidos, nearby sites on the mainstem (15–20 km upstream) could provide surrogate observations at least 3 times per cycle. In such a case, SWOT data might be tuned to predict discharge three times per 21 days and performance assessed against the nearby gauge, an improvement of 5% on average discharge from sampling frequency alone for the Amazon. This observation is the basis for evaluating how different rivers may be observed by SWOT (e.g., using 1 observation per orbit cycle, 3 observations per orbit cycle, etc.).
4.2 The influence of sampling frequency upon estimate discharge in the Amazon
The method used here to add uncertainty to the synthetic SWOT time series (Nickles et al., 2019) added a large amount of error (Figure 2). This effect was most pronounced in the Amazon due to its high flow rate (Figure 3). This added error may overestimate or incorrectly scale true errors with discharge (Figure 3). Actual uncertainty for the future SWOT-derived discharge will result mainly from physical measurement precision and the algorithms used to calculate discharge (Yoon et al., 2016). However, the adopted approach (Nickles et al., 2019) provides a useful estimate of error. Beyond measurement and algorithm error, the irregular sampling and river hydrologic patterns and size interact to impact the accuracy of discharge estimates. For the Amazon, discharge was least sensitive to sampling frequency, only falling by 5.4% 10-days post peak monthly discharge and 11.1% nearly 20-days post monthly discharge. This result is likely due to the large size and stable hydrologic flow of the Amazon (Revel et al., 2021), which only varies by 20%–25% across its annual hydrograph (Figure 2). The synthetic and theoretical time series (Figures 5, 6) represent how well SWOT can capture the dynamics of flow for a given river (under different sampling regimes), with respect to the volume of water captured and the probability of flow events occurring. The total volume of water does not vary much across SWOT time series compared to the gauge in the Amazon (Figure 5). However, lower flows (e.g., 80,000 to 140,000 m3·s−1) account for nearly 40% of the total volume when using 3 SWOT observations per cycle as opposed to 29% using the minimal SWOT observations (e.g., once per 21-days). For the gauge flow, these discharge values account for only 20% of the total volume. This discrepancy points to the added uncertainty playing a greater role in the derived discharge than temporal frequency for the Amazon. Assuming uncertainty will be less for SWOT-derived discharge measurements on larger rivers given the larger widths and slopes of the channel reducing impact of cross-sectional averaging (Wilson et al., 2015), total errors will likely be lower that shown here for the Amazon and other major tropical rivers (e.g., Congo, Orinoco).
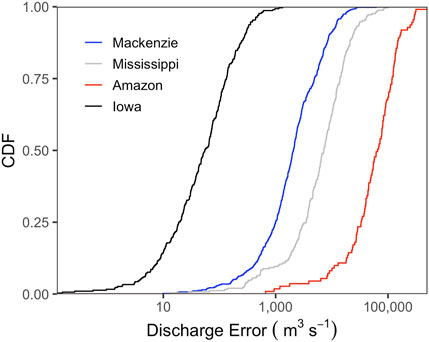
FIGURE 3. Cumulative distribution function (CDF) illustrating uncertainty in the river reaches used in this study. The CDF displays how larger errors using the random uncertainty distribution method are associated with rivers with larger discharge measurements.
4.3 The influence of sampling frequency upon estimate discharge in the Mackenzie and Mississippi
The Mackenzie and Mississippi are large rivers (annual average discharge of 8,700 and 23,000 m3·s−1), though considerably smaller than the Amazon (annual average discharge of 168,000 m3·s−1). Annual discharge across the 3-year range varies in these rivers by 58% and 45% (Figure 2). These rivers show considerably more sensitivity to sampling frequency than the Amazon, with an underestimation of at least 10% if peak discharge is missed by a week and increasing error (up to 42% for the Mackenzie and 23% for the Mississippi) as the lag increases to nearly 19 days after the peak (Figure 4). It is likely the improvement shown for the Mackenzie River 20 days after the peak occurs is artificial, given it does not make sense mechanistically for rivers and does not occur in the other three rivers in this analysis. Despite the similar size of these rivers, the hydrographs of the Mackenzie and Mississippi are quite different. The Mackenzie River, like other Arctic rivers, has a large spring freshet fueled by snowmelt, exhibits other discharge peaks through summer into fall due to rainfall events, and then returns to winter baseflow conditions as the watershed freezes in winter (Figure 2; Lesack et al., 2013). Although the Mississippi River also receives some inputs of snowmelt from its northern tributaries during the spring, this is followed by periods of lowest flow in the driest summer months (Reiman and Xu, 2019), and moderate flows in winter (Figure 2). The Mississippi River also demonstrates more variability on a year-to-year basis compared to the Mackenzie (Figure 2). In the Mackenzie River, nearly half of the total volume of water is accounted for, in all of the time series (gauge and SWOT), within flows between 2,000 and 12,000 m3·s−1 (Figure 5). Higher flows are not observed in the synthetic SWOT time series, as the cumulative volumes are between 81% and 91% of the gauge total. Daily values are generally underestimated across SWOT theoretical frequencies in the Mississippi River, resulting in significantly smaller cumulative volumes of water (Figure 5). Even for the SWOT time series which represents frequent observations (e.g., 6 times every 21 days), SWOT-estimated discharge values are lower for the Mississippi River (Figure 6).
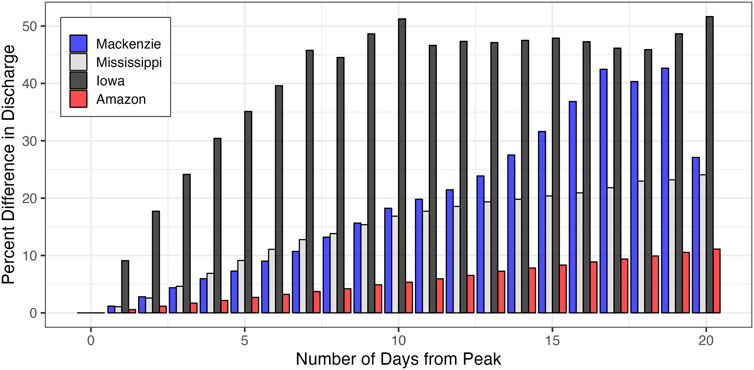
FIGURE 4. The percent change in discharge from the maximum monthly discharge compared to the subsequent discharge values observed 1–20 days later for the Amazon, Mississippi, Mackenzie, and Iowa Rivers.
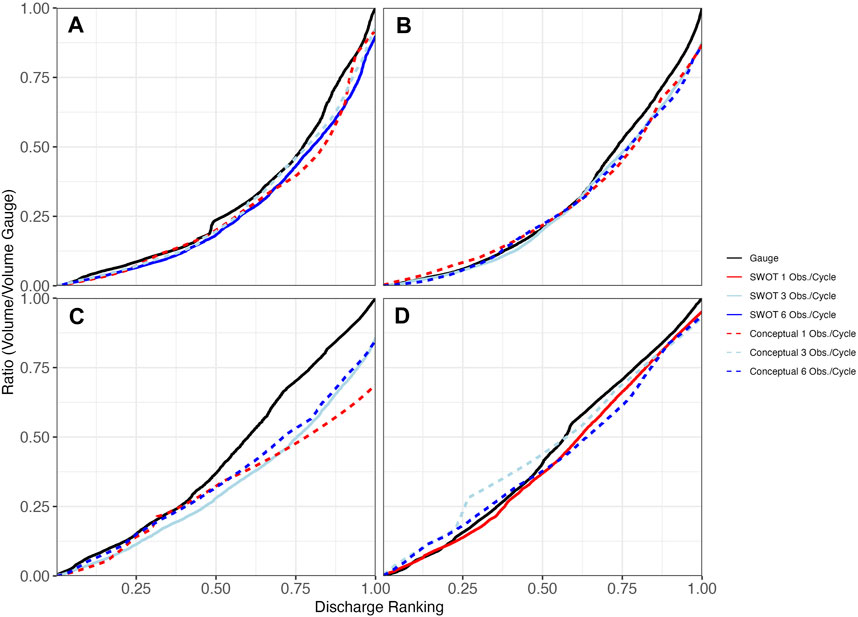
FIGURE 5. Ratio of the cumulative flow from the synthetic SWOT time series to the total volume of flow accumulated for the gauge for the (A) Mackenzie, (B) Iowa, (C) Mississippi, and (D) Amazon Rivers. The solid black line shows gauge data, the solid colored line shows conceptual SWOT data at the frequency SWOT will observe the site, and dashed lines are conceptual discharge time series (e.g., if SWOT were to observe the river x times per orbit cycle).
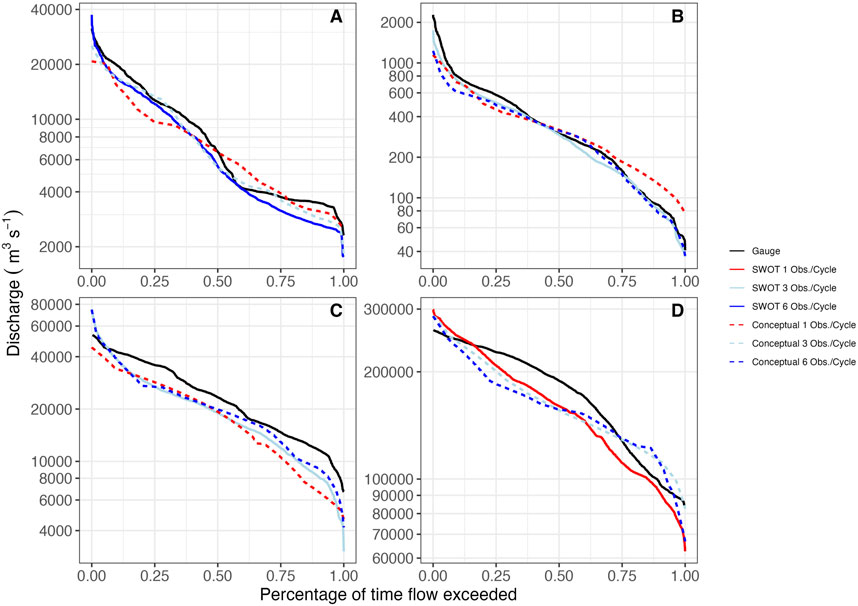
FIGURE 6. Flow exceedance curves for each site using the gauged time series and the synthetic SWOT time series for the (A) Mackenzie, (B) Iowa, (C) Mississippi, and (D) Amazon Rivers. The solid black line shows gauge data, the solid colored line shows conceptual SWOT data at the frequency SWOT will observe the site, and the dashed lines are conceptual SWOT time series. Linear interpolation was assumed for the days where there is no observation in order to make the comparison between daily observations.
4.4 The influence of sampling frequency upon estimate discharge in the Iowa
The Iowa River was the smallest river in our analysis and the flashiest, with variability of 74% in discharge values across the 3-year time period (Figure 2). As a result, the Iowa had the greatest sensitivity to sampling frequency with a difference in discharge underestimated by 9.1% should an observation occur just 1 day after peak discharge (Figure 4). This is consistent with research which concludes hydrologic regimes are often more difficult to capture using discontinuous satellite data in smaller, more variable rivers (Solander et al., 2016; Donchyts et al., 2022; Nielsen et al., 2022). Underestimation of peak discharge increased further to 51.2% assuming peak monthly discharge is missed by 10 days and 52% when missed by 20 days. The underestimation in peak discharge when sampled 10- or 20-days too late increasing with decreasing river size indicates that river size and the related river flashiness is a key driver of this trend and is a consequence of scale-dependent factors (flood routing and runoff) within the watershed (Baker et al., 2004). This is demonstrated further by the differences in the hydrograph of the Iowa versus the hydrographs of the Mackenzie and Mississippi River—given these two similarly sized rivers are similarly sensitive to sampling frequency (Figure 4). Further, median flow values of the Iowa River do not differ drastically between SWOT time series, but higher flows (e.g., near 0% exceedance) are consistently underestimated, likely as a result of being unobserved (Figures 5, 6). Flow duration curves, used here to describe the probability of daily discharge occurring, do not capture seasonal changes as hydrographs often do. Flashier rivers will have different exceedance curves at variable temporal scales (e.g., weekly, monthly; Searcy, 1969). Given the nature of some of the selected sites, there are a multitude of factors further impacting river discharge that could be explored further once SWOT data is released.
Previous research concluded the combination of SWOT temporal frequency and derived uncertainty was likely the cause of higher error in discharge (Nickles et al., 2019). Our findings suggest smaller rivers such as the Iowa may be subject to greater errors because the sampling frequency of SWOT will miss short-lived high discharge events in these flashy systems, while larger rivers which are relatively insensitive to sampling frequency, such as the Amazon, may be more sensitive to derived uncertainty in instantaneous discharge. Finally, even if SWOT is able to accurately measure instantaneous discharge for small rivers, a river that is minimally observed by SWOT (e.g., once or twice per orbit cycle) is expected to have larger errors in discharge.
4.5 How will irregular sampling impact constituent fluxes?
A broader question, branching out of hydrology, is what becomes of river discharge measurements? Discharge data are necessary for water management (e.g., flood protection; Wohl, 2020), biogeochemical studies (e.g., constituent or sediment transport; Bogen, 1980; Raymond et al., 2016), and monitoring environmental changes (e.g., climate or anthropogenic impacts; Depetris, 2021). Quantifying constituent transport through rivers is a significant field of research that is often limited to areas where gauges (or in situ measurements) are present (Glysson, 1988). Hydrologic events are critical for material export. For instance, dissolved organic carbon (DOC) concentrations generally increase with increasing river discharge, amplifying the importance of large events for DOC export (Raymond et al., 2016). In smaller rivers, this effect is perhaps most pronounced, with studies suggesting that the largest events that occur across less than 20 days can export over 70% of annual DOC fluxes (Raymond and Saiers, 2010). This trend is also observed in large Arctic Rivers, where nearly 60% of the total fluxes of sediment and DOC occur during the freshet (Fabre et al., 2019). Thus, it is critical that large events are captured and captured accurately when discharge data is used to estimate fluvial export of DOC and other biogeochemically relevant materials.
Here, we consider what would happen to constituent fluxes if we rely on irregular sampling using the volume of water captured with varying observations per orbit cycle. It appears there is the potential for underestimation. In the Amazon River, more than 20% of the annual discharge occurs when instantaneous discharge exceeds 220,000 m3·s−1, according to gauged time series; SWOT time series indicate less than 10% of the total flux occurs at these higher discharge values (Figure 7). For the Mississippi River, nearly 15% of the total estimated water flux using SWOT comes from discharge of approximately 20,000 m3·s−1. In comparison, the annual discharge estimated using gauged discharge data show most of the water (∼30%) is exported by instantaneous discharges of 35,000 to 40,000 m3·s−1. For the Iowa River, higher discharge values (>1,600 m3·s−1) account for 10% of the annual discharge, but these high flows are missing completely in the SWOT time series (regardless of frequency), further demonstrating the sensitivity of smaller rivers to missing large events. Thus, in each of these three cases, across a wide range of river sizes, discharges at high flows are underrepresented in the SWOT discharge record. As DOC concentrations increase with discharge in most rivers and makes large events disproportionately important to DOC export with respect to water export, missing or underestimating period of high instantaneous discharge in SWOT data will lead to similarly disproportionate underestimates of DOC fluxes.
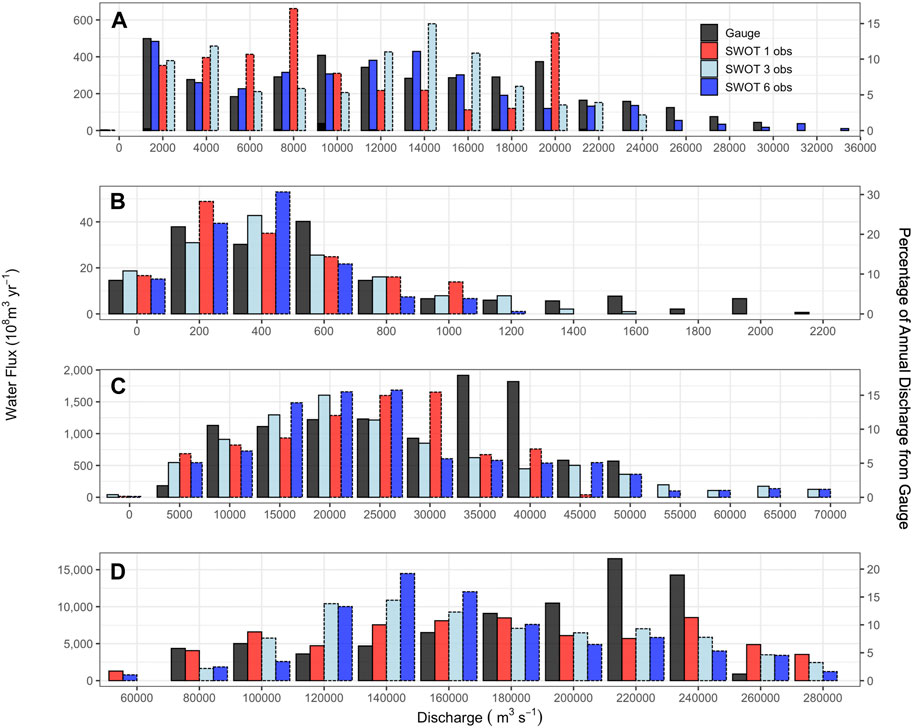
FIGURE 7. Sum of the total water flux for the instantaneous discharge represented at each bin for the (A) Mackenzie, (B) Iowa, (C) Mississippi, and (D) Amazon Rivers. The secondary axis displays the percent of flux for each of the SWOT time series compared to the total flux derived from the gauge. Dashed lines represent conceptual SWOT time series.
This effect appears less pronounced in the Mackenzie River, where fluxes at higher instantaneous discharges (20,000 to 30,000 m3·s−1) are comparable between gauge (∼15% of total) and SWOT data (∼11% of total), resulting in a more realistic estimate of both water and other constituent fluxes at higher discharges. The Mackenzie is included here as a representative of other large, Arctic rivers. The Arctic rivers export large amounts of water (and thus organic matter) to the Arctic oceans—more than previously thought according to a recent study (Feng et al., 2021), considering the hydrology of these rivers is generally complex and poorly understood (Lesack et al., 2013). Given the significance of the Arctic rivers to global biogeochemistry, more frequent SWOT observations at higher latitudes are promising (Biancamaria et al., 2016).
5 Conclusion
The novel observations provided by the Surface Water and Ocean Topography (SWOT) mission will improve remote sensed estimates of water discharge and should also improve flux estimates of the material water carries. However, to make the most of SWOT data, it is important to consider how sampling frequency will impact derived water and other fluxes at a given site on a given river. The error added to instantaneous estimates of discharge in our synthetic SWOT data may prove an overestimate of errors or at least an incorrect scaling, such that errors globally may be lower or may at least be much lower in important major world rivers such as the Amazon. We will soon know the answer to this question with the culmination of SWOT data calibration and the release of calibrated data. Many regions will benefit from additional discharge information and the frequency of this novel data will scale from highest sampling frequency (∼10 per 21 days) in the Arctic to low sampling frequencies in the tropics and throughout much of the southern hemisphere (Figure 1). For the Arctic Rivers, this will mean monthly peak discharge events may be observed within a few days of the event, improving our ability to observe water fluxes for these critical, remote, and climate-sensitive systems. Although rivers at lower latitudes will sampled less frequently, our findings suggest larger, more stable rivers will not be impacted by the temporal frequency of the satellite. In general, discharge in smaller, flashier systems may prove harder to observe in high fidelity. Thus, smaller tropical and southern hemisphere systems will likely benefit least from the SWOT mission. SWOT and any satellite or gauge measuring at lower frequency than a river’s flood response time will under sample short-lived periods of highest flow. As a result, annual discharge will likely be underestimated, and the fluxes of other materials rivers carry to the sea will likely be underestimated further still. These limitations need to be considered when using SWOT data but are inherent to all current satellites. Despite these limitations, SWOT provides a novel and powerful new tool with which to see Earth’s waters and determine the flows of ungauged rivers. We hope the insight provided here aids in realizing this potential.
Data availability statement
The original contributions presented in the study are included in the article/Supplementary Material, further inquiries can be directed to the corresponding author.
Author contributions
JG, EB, and AS contributed to conception and design of the study. JG organized the database. JG performed statistical analysis. JG wrote the first draft of the manuscript. JG, EB, and AS contributed to the revision, read, and approved submitted version. All authors contributed to the article and approved the submitted version.
Funding
This research was funded by the NASA’s GRACE-FO Science Team (80NSSC20K0742) and NASA’s Carbon Team (80NSSC22K0145).
Conflict of interest
The authors declare that the research was conducted in the absence of any commercial or financial relationships that could be construed as a potential conflict of interest.
Publisher’s note
All claims expressed in this article are solely those of the authors and do not necessarily represent those of their affiliated organizations, or those of the publisher, the editors and the reviewers. Any product that may be evaluated in this article, or claim that may be made by its manufacturer, is not guaranteed or endorsed by the publisher.
Author disclaimer
Any opinions, findings, and conclusions or recommendations expressed in this material are those of the authors and do not necessarily reflect the views of the research sponsors.
References
Altenau, E. H., Pavelsky, T. M., Durand, M. T., Yang, X., Frasson, R. P. de M., and Bendezu, L. (2021). The surface water and Ocean Topography (SWOT) mission River Database (SWORD): A global river network for satellite data products. Water Resour. Res. 57, e2021WR030054. doi:10.1029/2021WR030054
Baker, D. B., Richards, R. P., Loftus, T. T., and Kramer, J. W. (2004). A new flashiness index: characteristics and applications to midwestern rivers and streams. J. Am. Water Resour. Assoc. 44883, 503–522. doi:10.1111/j.1752-1688.2004.tb01046.x
Biancamaria, S., Lettenmaier, D. P., and Pavelsky, T. M. (2016). The SWOT mission and its capabilities for land hydrology. Surv. Geophys. 37, 307–337. doi:10.1007/s10712-015-9346-y
Bogen, J. (1980). The hysteresis effect of sediment transport systems. Nor. Geogr. Tidsskr. 34, 45–54. doi:10.1080/00291958008545338
Depetris, P. J. (2021). The importance of Monitoring river water discharge. Front. Water 3, 1–7. doi:10.3389/frwa.2021.745912
Donchyts, G., Winsemius, H., Baart, F., Dahm, R., Schellekens, J., Gorelick, N., et al. (2022). High-resolution surface water dynamics in Earth’s small and medium-sized reservoirs. Sci. Rep. 12, 13776–13813. doi:10.1038/s41598-022-17074-6
Durand, M., Gleason, C. J., Garambois, P. A., Bjerklie, D., Smith, L. C., Roux, H., et al. (2016). An intercomparison of remote sensing river discharge estimation algorithms from measurements of river height, width, and slope. Water Resour. Res. 52, 4527–4549. doi:10.1002/2015WR018434
Durand, M., Gleason, C. J., Pavelsky, T. M., Prata de Moraes Frasson, R., Turmon, M., David, C. H., et al. (2023). A framework for estimating global river discharge from the Surface Water and Ocean Topography satellite mission. Water Resour. Res. 59, e2021WR031614. doi:10.1029/2021WR031614
Elmer, N. J., McCreight, J., and Hain, C. (2021). Hydrologic model parameter estimation in ungauged basins using simulated SWOT discharge observations. Water Resour. Res. 57, 1–18. doi:10.1029/2021WR029655
Fabre, C., Sauvage, S., Tananaev, N., Noël, G. E., Teisserenc, R., Probst, J. L., et al. (2019). Assessment of sediment and organic carbon exports into the arctic ocean: the case of the yenisei river basin. Water Res. 158, 118–135. doi:10.1016/j.watres.2019.04.018
Feng, D., Gleason, C. J., Lin, P., Yang, X., Pan, M., and Ishitsuka, Y. (2021). Recent changes to Arctic river discharge. Nat. Commun. 12, 6917–6919. doi:10.1038/s41467-021-27228-1
Frasson, R. P. de M., Durand, M. T., Larnier, K., Gleason, C., Andreadis, K. M., Hagemann, M., et al. (2021). Exploring the factors controlling the error characteristics of the surface water and Ocean Topography mission discharge estimates. Water Resour. Res. 57, 1–29. doi:10.1029/2020WR028519
Gehring, J., Duvvuri, B., and Beighley, E. (2022). Deriving River discharge using remotely sensed water sur-face characteristics and satellite altimetry in the Mississippi river basin. Remote Sens. 14 (15), 3541. doi:10.3390/rs14153541
Gleason, C. J., and Durand, M. T. (2020). Remote sensing of river discharge: A review and a framing for the discipline. Remote Sens. 2, 1107–1128. doi:10.3390/rs12071107
Hagemann, M. W., Gleason, C. J., and Durand, M. T. (2017). Bam: bayesian AMHG-Manning inference of discharge using remotely sensed stream width, slope, and height. Water Resour. Res. 53, 9692–9707. doi:10.1002/2017WR021626
Lesack, L. F. W., Marsh, P., Hicks, F. E., and Forbes, D. L. (2013). Timing, duration, and magnitude of peak annual water-levels during ice breakup in the Mackenzie Delta and the role of river discharge. Water Resour. Res. 49, 8234–8249. doi:10.1002/2012WR013198
McClelland, J. W., Tank, S. E., Spencer, R. G. M., Shiklomanov, A. I., Zolkos, S., and Holmes, R. M. (2023). Discharge dataset. Rivers Obs: Arct. Gt.
Moatar, F., Floury, M., Gold, A. J., Meybeck, M., Piffady, J., Pinay, G., et al. (2020). Stream solutes and particulates export regimes: A new framework to optimize their monitoring. Front. Ecol. Evol. 7, 1–19. doi:10.3389/fevo.2019.00516
Nickles, C., Beighley, E., Zhao, Y., Durand, M., David, C., and Lee, H. (2019). How does the unique space-time sampling of the SWOT mission influence river discharge series characteristics? Geophys. Res. Lett. 46, 8154–8161. doi:10.1029/2019GL083886
Nielsen, K., Zakharova, E., Tarpanelli, A., Andersen, O. B., and Benveniste, J. (2022). River levels from multi mission altimetry, a statistical approach. Remote Sens. Environ. 270, 112876. doi:10.1016/j.rse.2021.112876
Patil, S., and Stieglitz, M. (2012). Controls on hydrologic similarity: role of nearby gauged catchments for prediction at an ungauged catchment. Hydrol. Earth Syst. Sci. 16, 551–562. doi:10.5194/hess-16-551-2012
Pavelsky, T. M., Durand, M. T., Andreadis, K. M., Beighley, R. E., Paiva, R. C. D., Allen, G. H., et al. (2014). Assessing the potential global extent of SWOT river discharge observations. J. Hydrol. 519, 1516–1525. doi:10.1016/j.jhydrol.2014.08.044
Raymond, P. A., and Saiers, J. E. (2010). Event controlled DOC export from forested watersheds. Biogeochemistry 100, 197–209. doi:10.1007/s10533-010-9416-7
Raymond, P. A., Saiers, J. E., and Sobczak, W. V. (2016). Hydrological and biogeochemical controls on watershed dissolved organic matter transport: pulse-shunt concept. Ecology 97, 5–16. doi:10.1890/14-1684.1
Reiman, J. H., and Xu, Y. J. (2019). Dissolved carbon export and CO2 outgassing from the lower Mississippi River – implications of future river carbon fluxes. J. Hydrol. 578, 124093. doi:10.1016/j.jhydrol.2019.124093
Revel, M., Ikeshima, D., Yamazaki, D., and Kanae, S. (2021). A framework for estimating global-scale river discharge by assimilating satellite altimetry. Water Resour. Res. 57, 1–34. doi:10.1029/2020WR027876
Samboko, H. T., Abas, I., Luxemburg, W. M. J., Savenije, H. H. G., Makurira, H., Banda, K., et al. (2020). Evaluation and improvement of remote sensing-based methods for river flow management. Phys. Chem. Earth 117, 102839. doi:10.1016/j.pce.2020.102839
Solander, K. C., Reager, J. T., and Famiglietti, J. S. (2016). How well will the Surface Water and Ocean Topography (SWOT) mission observe global reservoirs? Water Resour. Res. 52, 2123–2140. doi:10.1002/2015WR017952
USGS (2023). National water information system: Water data for the nation. Reston, VA: USGS Publications Warehouse. doi:10.5066/F7P55KJN
Wilson, M. D., Durand, M., Jung, H. C., and Alsdorf, D. (2015). Swath-altimetry measurements of the main stem Amazon River: measurement errors and hydraulic implications. Hydrol. Earth Syst. Sci. 19, 1943–1959. doi:10.5194/hess-19-1943-2015
Wohl, E. (2020). Rivers in the anthropocene: the U.S. Perspective. Geomorphology 366, 106600. doi:10.1016/j.geomorph.2018.12.001
Keywords: river discharge, remote sensing, hydrology, SWOT, biogeochemistry
Citation: Gehring J, Beighley E and Stubbins A (2023) Assessing the potential for the Surface Water and Ocean Topography (SWOT) mission for constituent flux estimations. Front. Earth Sci. 11:1201711. doi: 10.3389/feart.2023.1201711
Received: 07 April 2023; Accepted: 23 August 2023;
Published: 04 September 2023.
Edited by:
Stefania Camici, National Research Council (CNR), ItalyReviewed by:
Guoqing Zhang, Chinese Academy of Sciences (CAS), ChinaTed Langhorst, University of North Carolina, United States
Copyright © 2023 Gehring, Beighley and Stubbins. This is an open-access article distributed under the terms of the Creative Commons Attribution License (CC BY). The use, distribution or reproduction in other forums is permitted, provided the original author(s) and the copyright owner(s) are credited and that the original publication in this journal is cited, in accordance with accepted academic practice. No use, distribution or reproduction is permitted which does not comply with these terms.
*Correspondence: Jaclyn Gehring, Z2VocmluZy5qQG5vcnRoZWFzdGVybi5lZHU=