
94% of researchers rate our articles as excellent or good
Learn more about the work of our research integrity team to safeguard the quality of each article we publish.
Find out more
ORIGINAL RESEARCH article
Front. Earth Sci., 19 June 2023
Sec. Petrology
Volume 11 - 2023 | https://doi.org/10.3389/feart.2023.1200913
Exploring the geological factors that affect fluid flow has always been a hot topic. For tight reservoirs, the pore structure and characteristics of different lithofacies reveal the storage status of fluids in different reservoir environments. The size, connectivity, and distribution of fillers in different sedimentary environments have always posed a challenge in studying the microscopic heterogeneity. In this paper, six logging curves (gamma-ray, density, acoustic, compensated neutron, shallow resistivity, and deep resistivity) in two marker wells, namely, J1 and J2, of the Permian Lucaogou Formation in the Jimsar Basin are tested by using four reinforcement learning algorithms: LogitBoost, GBM, XGBoost, and KNN. The total percent correct of training well J2 is 96%, 96%, 96%, and 96%, and the total percent correct of validation well J1 is 75%, 68%, 72%, and 75%, respectively. Based on the lithofacies classification obtained by using reinforcement learning algorithm, micropores, mesopores, and macropores are comprehensively described by high-pressure mercury injection and low-pressure nitrogen gas adsorption tests. The multifractal theory servers for the quantitative characterization of the pore distribution heterogeneity regarding different lithofacies samples, and as observed, the higher probability measure area of the generalized fractal spectrum affects the heterogeneity of the local interval of mesopores and macropores of the estuary dam. In the micropore and mesopore, the heterogeneity of the evaporation lake showed a large variation due to the influence of the higher probability measure area, and in the mesopore and macropore, the heterogeneity of the evaporation lake was controlled by the lower probability measure area. According to the correlation analysis, the single-fractal dimension is well related to the multifractal parameters, and the individual fitting degree reaches up to 99%, which can serve for characterizing the pore size distribution uniformity. The combination of boosting machine learning and multifractal can help to better characterize the micro-heterogeneity under different sedimentary environments and different pore size distribution ranges, which is helpful in the exploration and development of oil fields.
Relative to traditional petroleum reservoirs, tight reservoirs possess a complicated pore structure. Their pore throats are connected at the nano and submicron scales, and different types of pores are connected differently (Garum et al., 2021). In tight reservoirs, pore space and connectivity take charge of controlling the performance of the reservoir and the capacity of seepage (Aljaberi et al., 2021). There are similarities and differences in pore characteristics of various lithofacies in the same area, which often indicate different sedimentary environments and characteristics (Tang et al., 2021). Different lithofacies undergo different diagenetic evolution processes and form different pore structures (Yang et al., 2022).
Nowadays, relative to other testing technologies, the high-pressure mercury injection (HPMI) test and the low-pressure nitrogen gas adsorption (LPN2GA) test can effectively characterize the adsorption pore structure in porous media (Karayiğ;it et al., 2018; Zhang et al., 2020; Tian et al., 2020). Nevertheless, due to the large diameter of N2 molecules (0.36 nm), the instrument is less accurate and suitable for micropore and small pore tests, which has limitations in accurately characterizing the micropore structure (Zhang et al., 2021; Zhao et al., 2016). In addition, in the HPMI text, mercury is injected into the rock sample using pressure to establish the relationship between the mercury volume and the pore volume (PV), resulting in the maximum flow of mercury into the pore, that is, the pore throat size (Wang J. et al., 2018). The results obtained by experimental experience have large errors in micropores and small pores.
Linear fitting of the experimental data of the HPMI test and the LPN2GA test by the 3D capillary model and the Frenkel−Halsey−Hill (FHH) model can well serve for describing the adsorption pore heterogeneity (Li et al., 2010; Tang et al., 2003). A large number of studies have shown that the curve fitted by HPMI data has a cut-off point when the pore is 50 nm. Macropores have a fractal dimension DM1 over 50 nm, and mesopores have a fractal dimension DM2 less than 50 nm, which physically characterizes the heterogeneity of mesopores and macropores (Wang X. X. et al., 2018; Li et al., 2010; Lai et al., 2015). However, the fitting curve of LPN2GA data yielded two fractal dimensions, namely, DN1 and DN2, and the demarcation point of the two segments appeared at P0/P of 0.5. Most studies have shown that both have physical significance, DN1 can serve for the characterization of adsorption pore surface heterogeneity, and DN2 can serve for the characterization of the PV heterogeneity (Tang et al., 2003; Cai et al., 2018; Lu et al., 2018). Obviously, they only apply to pores of diameters in the range of 2–100 nm and are incapable of characterizing the micropore heterogeneity (Zhao J. et al., 2019).
However, for tight reservoirs, which exhibit strong heterogeneity, the pore size distribution (PSD) curve usually represents a random fluctuation, and the self-similarity is different with the pore diameter interval (Memon et al., 2020). Hence, the PSD heterogeneity can be hardly characterized with a single-fractal dimension (Posadas et al., 2003; Anovitz et al., 2013). Compared with single-fractal dimensions, it is allowed to separate multiple-fractal dimensions into a lot of small regions which have various singularity exponents (Zhang et al., 2020; Liu et al., 2017; Han et al., 2022). The fractal of various regions can serve for the examination of the fine structure exhibited by the pore network. Based on lithofacies division, this paper analyzes the multifractal characteristics exhibited by micropores (below 2 nm) and mesopores and macropores (2–100 nm) in different lithofacies by combining LPN2GA and HPMI tests, studies and confirms the multifractal parameters of PSD of different pore sizes, and comprehensively characterizes the pore structure of the tight reservoir. This paper aims to provide a theoretical basis for quantitatively assessing PSD heterogeneity in tight reservoirs.
For the Permian Lucaogou Formation, the thickness is approximately 25–350 m (200 m on average) and the burial depth is 4000–4800 m. The total organic carbon (TOC) content is from 2 wt% to 15 wt% (6 wt% on average), and the vitrinite reflectance (Ro) of the specular formation changes from 0.7% to 1.0% (Cao et al., 2017). Normal rock types include shale, oil shale, and dolomitic shale (Yang et al., 2019), and the primary mineral types are dolomite, quartz, calcite, feldspar, and clay (Wu et al., 2016). After the Southern Tianshan Ocean was closed in the early Permian, the seawater in the Junggar Basin retreated (Wang X. X. et al., 2018). The Lucaogou Formation mainly features lake sedimentation, like deep lacustrine, semi-deep lacustrine, shallow lacustrine to nearshore, and deltaic and beach bar sedimentary facies (Figure 1) (Liu et al., 2019; Zhang et al., 2019). Water in the ancient Lucaogou Lake had intermittent salinity, and the ancient lake that features strong salinity, anoxia, and strong productivity contributes to a proper environment for OM fugacity. The Lucaogou formation has two sweet spots, namely, the upper spot (P2l2) and the lower spot (P2l1), and the OM source and the sedimentary paleoenvironment of the former present a frequent change relative to the latter (Qiu et al., 2016; Su et al., 2019).
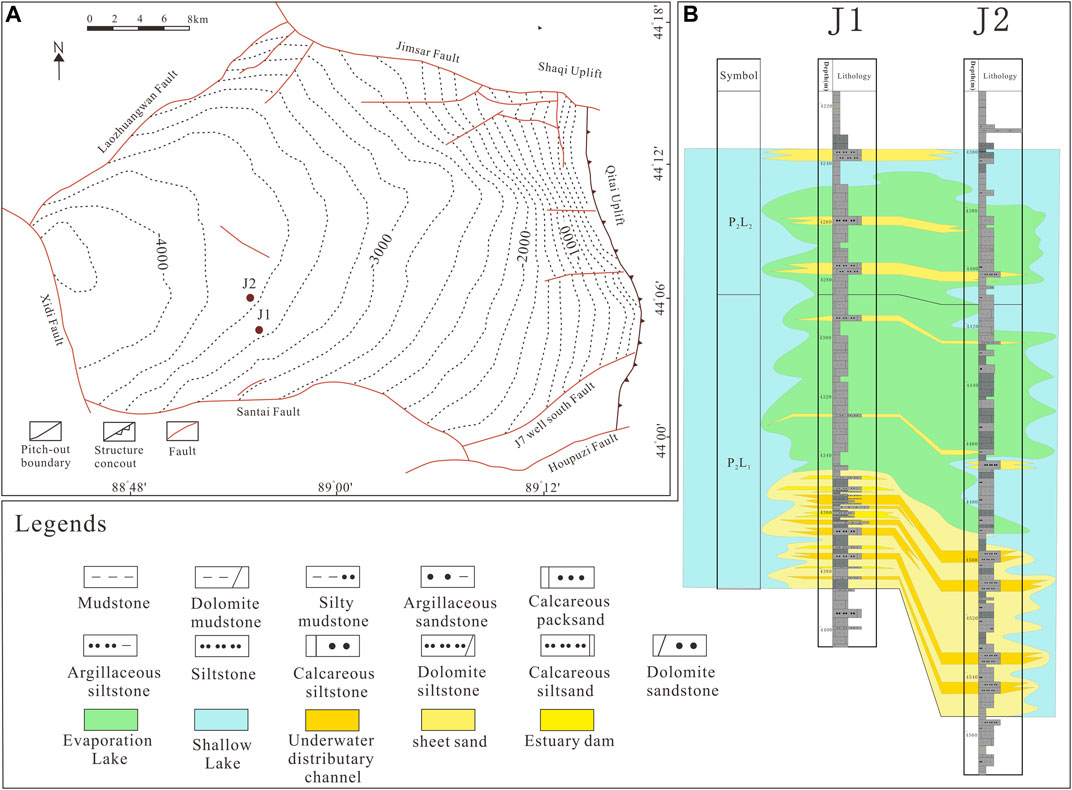
FIGURE 1. (A) Regional geological map; (B) formation profile of the Lucaogou Formation (including the lithology of predicted well J1 and training well J2).
It is allowed to group facies that are related to genetics or environment considering the depositional environment interpretations into the facies associations (Reading et al., 1996). It is also allowed to sub-group facies considering their data source, like the lithofacies from data or the electrofacies from well-log clusters (Al-Mudhafar et al., 2022). Lithofacies can be considered to more accurately describe the genetic or environment rocks relative to those from electrofacies cluster analysis (Kim et al., 2022). Nevertheless, as the whole-rock cores cannot be well collected and recovered, the vertical lithofacies distributions of the wellbore-transected reservoir sections can be hardly obtained (Nauyen et al., 2022). Hence, the association of the discrete lithofacies distribution with the well-log data records shall be essentially constructed, for completely explaining the lithofacies classification. Prior to adopting lithofacies classification, existing logging data (Table 1), i.e., gamma-ray (GR), density (DEN), acoustic (AC), compensated neutron (CN), shallow resistivity (RI), and deep resistivity (RT), were integrated with discrete lithology. As shown in Figure 2, the characteristics of the logging curve coincide with the petrophysical values provided by the core analysis.
We obtained the samples from the cores of two wells in the tight reservoir section of the Lucaogou Formation in Jimusar Sag. Dry sealing served for preserving the cores. We dissected the surface layers in laboratory tests. Thirty horizons with representative depth and lithological characteristics were selected for the sample.
A PoroPDP-200 overburden pressure meter served for testing the 30 samples in terms of porosity and permeability (Chinese oil and gas industry standard SY/T 6385-2016). We installed the core column samples (diameter: 2.5 cm) in a core holder and connected it to the control module. The formation overburden pressure was simulated (70 MPa being the largest) for related testing under the assistance of a manual hydraulic pump. The non-stationary method and Boyle’s law served for measuring the permeability (0.00001–10 mD) and the porosity (0.01%–40%), respectively.
A fully automated analyzer regarding specific surface area (SSA) and porosity assisted in the N2 adsorption tests on the 30 samples (micro active for ASAP 2460 2.01). The procedures of our experiments conformed to those of previous ones (Labani et al., 2013; Liu et al., 2021). A mortar and pestle were used for crushing 1 g of samples. A 60-mesh sieve served for the screening (Wei et al., 2016). The obtained samples underwent 24 h of ultra-vacuum treatment for removing the adsorbed water and volatiles. We measured 42 relative pressure (P/P0) points in the adsorption/desorption process, which changed in the range of 0.009–0.990. The measured pore sizes changed in the range of 1.7–300 nm. Tight reservoir pore sizes fell into three categories based on the International Union of Pure and Applied Chemistry (IUPAC) classification: micropores < 2 nm, mesopores 2–50 nm, and macropores >50 nm (Rouquerol et al., 1994). The Brunauer–Emmet–Teller (BET) theory was taken into account for SSA calculation (Brunauer et al., 1938). The density functional theory (DFT) was taken into account for the calculation of pore volume and distribution, which was more strongly sensitive for micropores and mesopores relative to the Barrett–Joyner–Halenda model (Adesida et al., 2011; He et al., 2021). MICP testing (Chinese national standard GB/T21650.2–2008) served for examining the pore–throat distribution of 30 samples under the assistance of PoreMaster-60. Oil on the samples was removed after washing. 2 g of ground samples received ultra-vacuum drying at 105°C after reaching a constant weight. With the pressure reaching 60,000 psi, the mercury slowly entered the sample, and the smallest pore–throat diameter was approximately 3 nm. After the test was completed, we conducted a baseline correction for eliminating possible errors resulted from incomplete mercury filling. The calculation of the pore structure parameters was based on Washburn’s equation, which assumed that the mercury surface tension was 485 dyn/cm and the contact angle was 130° (Washburn et al., 1921).
Boosting machine learning (ML) takes into account results from the decision trees assessed in series for achieving a strong learner from a lot of weak learners with sequential connectivity, with the process defined as the ensemble-tree learning (Marc et al., 2017; Chen et al., 2016; Zong et al., 2017; Sarker et al., 2021). To be more specific, weak learners stand for trees added in sequence, with each tree focusing on minimizing the errors made by the previous one. Also, boosting ML algorithms pays attention to the identification of stronger classifiers from some initial weaker classifiers (Al-Mudhafar et al., 2022; Kim et al., 2022; Sarker et al., 2021). In addition, the sequential training iterations introduce a larger number of classifiers for reducing the prediction errors, till achieving a certain limit. Despite the prolonged training time, the learning process is capable of achieving effective and reproducible prediction results (Sarker et al., 2021). The learning rate, which is capable of quantifying the model learning speed during the addition of new trees, and the total tree number in each model constitute the primary hyperparameter in the boosting ML algorithm. It is necessary to carefully tune the aforementioned two parameters, particularly the tree number, for lowering the model overfitting risk.
In the study, the adopted method used the supervised ML boosting algorithm of the Mishrif-cored well for modeling the identified lithofacies. The distribution of lithofacies in other non-cored drilled sections was also estimated. The well-log data that can be applied to the classification of lithofacies include gamma-ray, density, acoustic, compensated neutron, shallow resistivity, and deep resistivity curves, which were recorded throughout the reservoir interval. Evaluation of four established boosting algorithms was conducted for classifying lithofacies. Figure 3 displays the lithofacies prediction technical workflow.
Logistic Boosting is a new approach in machine learning under supervision, which is a method that combines weak misclassified specimens to generate powerful classifiers. In this study, LogitBoost was performed with the caTools software, which is existent in computer coding systems. Generalized Boosting is an efficient method to capture nonlinear relations between the response variate and a group of seers by decreasing a specific objective(loss) function. In this research, GBM assay was carried out with the gbm software, which is existent in the computer coding system. Extreme Gradient Boosting (XGBoost) XGBoost is a realization of gradient enhancement that facilitates grouping and regression forecasting models with accelerated implementation, modeling properties, and measurability. XGBoost analysis was carried out with the xgboost software, which is existent in the computer coding system in this research. K-Nearest Neighbor (KNN) is a non-parametric learning classifier under supervision, which is used to interpret the features of a database as spatial points. In this experiment, KNN analysis was carried out with the e1071 software, which is existent in computer coding systems.
The 3D capillary model served for calculating the fractal dimension of the HPMI data. Based on assumption, the nanopores are constituted by capillary bundles. The fractal power–law function is taken into account to calculate the mercury saturation (Eq. 1 (Li et al., 2010)). The Younge−Laplace law can serve for confirming the association of the pore radius r with the capillary pressure (Schmitt et al., 2013; Gao et al., 2014).
where VHg denotes the total mercury volume; SHg denotes the mercury saturation level (%); r is the pore radius; l is the core length; Vp stands for core sample pore volume (%); Pc stands for the capillary pressure (MPa); DM is the capillary model fractal dimensions in 3D; σ is the surface tension; θ denotes the contact angle (deg); and b denotes the coefficient for Eq. 2.
The FHH model can serve for the calculation of the fractal dimension on the basis of LPN2GA (Tang et al., 2003; Pomonis et al., 2009). It is possible to directly obtain the fractal dimension using nitrogen adsorption isotherms. In the multi-layer adsorption region, the capillary condensation regime is not considered, and the adsorption volume V and the relative pressure of the adsorption phase (P0/P) follow the FHH equation (Zhang et al., 2020; Fu et al., 2017):
In aforementioned equation, V denotes the adsorbed gas volume at the equilibrium pressure P; V0 denotes the monolayer adsorption gas volume; P0 stands for the gas saturation pressure; C is a constant; K is the linear fitting slope of ln (V/V0) and ln (ln (P0/P)). DN is the FHH model fractal dimensions.
Multifractal theory acts as an extended version of conventional fractal dimensions, capable of describing hidden information neglected by the latter. For reservoirs that show strong heterogeneity, the distribution curve of the pore size usually represents a random fluctuation or jumping. Additionally, different pore spacing parts present different self-similarity types; hence, it is difficult to fully characterize the pore size homogeneity using a single-fractal dimension (Zhao P. et al., 2019). Figure 4 shows the technical workflow of multifractal. The physical meaning of each parameter is that the parameter Dq can fall into Dmin, Dmax, D0, D1, D2, D0 − D1, D0−D2, Dmin−Dmax, D0−Dmax, and Dmin−D0. Dq is a sigmoidal-shape monotone decreasing function. When the distribution of Dq is narrow, the measures in the multifractal set present a poor heterogeneity. Dmin and Dmax can be impacted by the measure areas with the lowest and highest probability, respectively. D1 refers to the information dimension, characterizing the disorder degree in the PSD. D1 = 1 means that the pore size is distributed uniformly. D2 refers to the correlation dimension, characterizing the relationship between the measures in the multifractal set. D0−Dmax and Dmin−D0 stand for the amplitudes of the right and left branches of Dq, respectively, representing the heterogeneity of high-probability and low-probability measure areas (Han et al., 2022; Yu et al., 2018). The f(α)-related parameters involve αmin, αmax, α0, α0-αmax, αmin-α0, and A. The variable αmin is the singularity index of the minimum q that can serve for characterizing the heterogeneity of the measure area with the lowest probability. In a similar way, αmax stands for the singularity index regarding the maximum q, capable of characterizing the heterogeneity of the measure area with the highest probability. In addition, α0 denotes the singularity index that corresponds to the peak in the singularity spectrum (Liu K. et al., 2018; Zheng et al., 2019). Larger width of the right (αmin-α0) and left branches (α0-αmax) denotes the primary heterogeneity in the lower probability measure areas (LPMAs) and the higher probability measure areas (HPMAs), respectively. A = (αmin-α0)/(α0-αmax) explains the singularity spectrum symmetry. A left-skewed shape (A > 1) and a right-skewed shape (A < 1) reveal the impact of large and small fluctuations on the measured value, respectively. Δf = f (αmin)−f (αmax) explains the ratio of the largest number of elements to the smallest number of elements in relation to the physical parameter subset, reflecting the multifractal spectrum asymmetry (Li et al., 2012; Liu M. et al., 2018). The multifractal spectrum curve is slanted to the right and left with Δf < 0 and Δf > 0, respectively (Han et al., 2022; Wang et al., 2014).
Through the training of four ML models and the sedimentological analysis of the core section of the Lucaogou Formation, three main lithofacies associations were identified. Each lithofacies assemblage denotes a discrete sedimentary environment.
The total percent correct (TPC) of the classification was calculated for evaluating the classification accuracy, which was expressed as a confusion matrix with respect to the core-interpreted lithofacies and predicted lithofacies. The confusion matrix can visualize well the matching degree between the actual and the predicted lithofacies intervals. The correct classification rate index refers to the percentage of data points correctly estimated from the total data point number after evaluation, reflecting the accuracy of each model in different lithofacies. Figure 5 displays the statistical indices and the pairwise scatter plot regarding independent and response variables in the study.
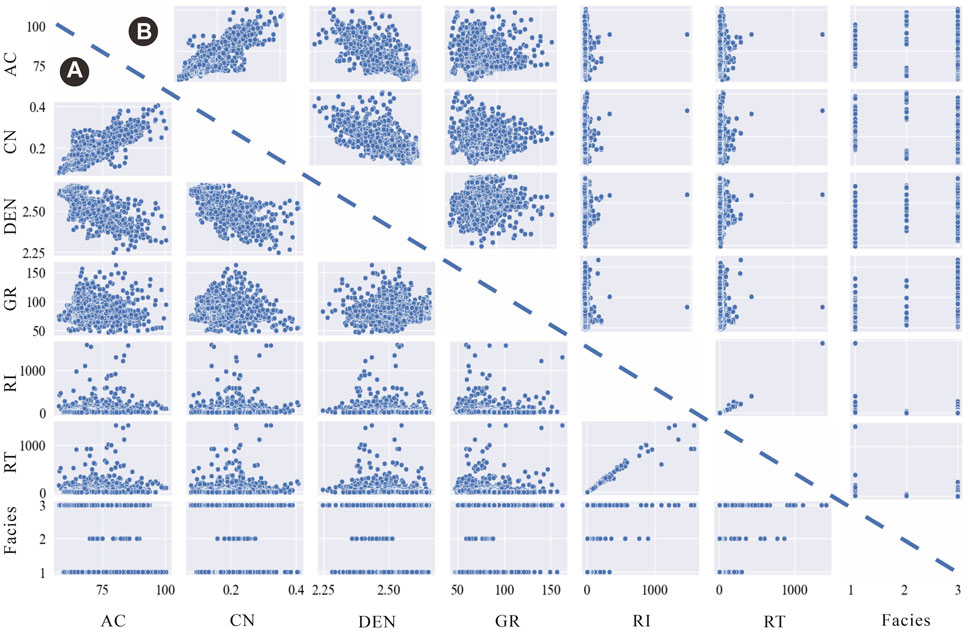
FIGURE 5. Visualized data distribution of seven wireline logs ((A) prediction well J1; (B) training well J2).
Lithofacies prediction regarding each ML model is based on the performance specific to the whole dataset and the validation subset. The measured lithofacies and predicted lithofacies are displayed in box and whisker plots, i.e., box plots, representing the algorithm performance. The box plots give an accurate graphical image of the lithofacies distribution and dispersion, thereby showing the distance between the extreme values, i.e., the potential outliers and the majority of the data. One box plot is composed of five values, the smallest value, the first quartile (Q1), the median value, the third quartile (Q3), and the largest value. In the box, the middle line is the median value, and the lines on either side are the first and the third quartile. The whiskers reach the smallest and largest value from both ends of the box. There are fewer triangles outside the whiskers, which stand for potential outliers with an obvious difference from most data points. The difference between Q1 and Q3 is the interquartile range (IQR). The box plot gives a valuable visualization of the lithofacies variation considering that the data fall into a lot of quartiles. To be more specific, it illustrates the number of samples represented in each lithotype. There are only few triangles outside the box plots, indicating that lithofacies are the most accurately classified. In this study, as each facies features strong overlapping, lithofacies cannot be well distinguished by a single wireline dog. The intersection plot of prediction well J1 and training well J2 is as shown in Figure 6.

FIGURE 6. Lithofacies distribution in wireline logs (schematic representation of (A) J1 lithofacies and depth, (B) J2 lithofacies and depth, and (C) box plot).
The confusion matrices in Figure 7 and 8 display the model performance in detail. The confusion matrices regarding the results give the TPC accuracy measures specific to LogitBoost, GBM, XGBoost, and KNN. The TPC for training well J2 was 96%, 96%, 96%, and 96%, and the TPC for validation well J1 subsets was 75%, 68%, 72%, and 75%. According to the numerical results, a lower TPC accuracy measure indicates that one class of algorithms misclassified some input values, and it is possible to identify these values from the confusion matrices of the training well and validation well. The higher the TPC accuracy measures, the higher the accuracy of lithofacies classification. Traditional cross-plotting methods can hardly achieve the classification of lithofacies using wireline log data because the cross-plots are overlapped somewhat; comparatively, the machine learning model that combines localized filtering and a logical network is capable of finding the lithofacies classification criteria by a great deal of computations. In addition, the ML algorithm in the study can avoid the uncertainty of bias or accidental errors in the interpretation of human electrical logging data.

FIGURE 7. Evaluation map of prediction and training wells: (A) evaluation map of GBM for validation well J1; (B) evaluation map of LogitBoost for validation well J1; (C) evaluation map of KNN for validation well J1; (D) evaluation map of XGBoost for validation well J1; (E) evaluation map of GBM for training well J2; (F) evaluation map of LogitBoost for training well J2; (G) evaluation map of KNN for training well J2; and (H) evaluation map of XGBoost for training well J2.
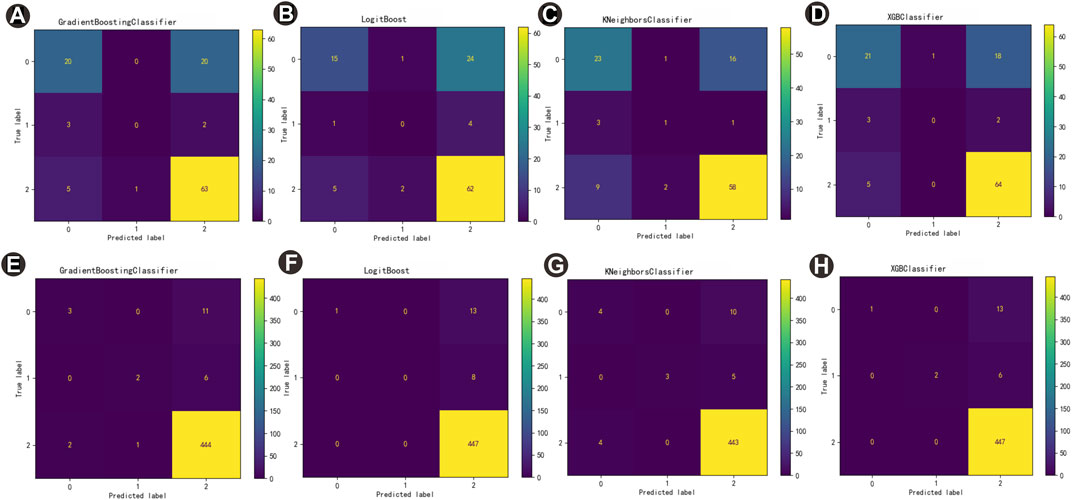
FIGURE 8. Confusion matrices of prediction and training wells: (A) confusion matrix diagram of GBM for validation well J1; (B) confusion matrix diagram of LogitBoost for validation well J1; (C) confusion matrix diagram of KNN for validation well J1; (D) confusion matrix diagram of XGBoost for validation well J1; (E) confusion matrix diagram of GBM for training well J2; (F) confusion matrix plot of LogitBoost for training well J2 (G) confusion matrix plot of KNN for training well J2; and (H) confusion matrix plot of XGBoost for training well J2.
According to the overburden pressure tests regarding the porosity and permeability, the porosity is in the range of 0.3%–9.2% (3.9% on average; Figure 9). The total porosity of the samples in lithofacies 1 (1.1%–9%, average 3.7%) is smaller than that of the samples in lithofacies 3 (0.3%–92%, average 3.9%), which is smaller than that of the samples in lithofacies 2 (average 4.7%). The porosity represents a strong linear correlation with the matrix permeability (R2 = 0.7). The linear relationship of lithofacies 3 samples is poor (R2 = 0.14). The total permeability (1.8 × 10⁻⁴−1.75 × 10² nD, average 48.2 nD) of the samples in lithofacies 3 is smaller than that of the samples in lithofacies 1 (5.9 × 10⁻⁴−1.9 × 10² nD, average 61 nD), which is smaller than that of the samples in lithofacies 2 (average 70nD).
The pore throat distribution of HPMI showed that the HPMI test could not fully reflect the micropores less than 2 nm, highlighting the characterization of mesopores and macropores. The distribution characteristics of the pore throat of liquid nitrogen adsorption show that the diameter of the lower pore throat of all lithofacies is between 50 nm and 100 nm (Figure 10), while the upper pore throat has an obvious peak at 10 nm. The pores at 50 nm are dominant. In general, lithofacies 1 has fewer micropores, more mesopores, and almost no macropores. Lithofacies 2 is mostly concentrated in the mesopore range of 10–50 nm. Lithofacies 3 has more micropores and mesopores, and the macropores are mostly concentrated around 100 nm.
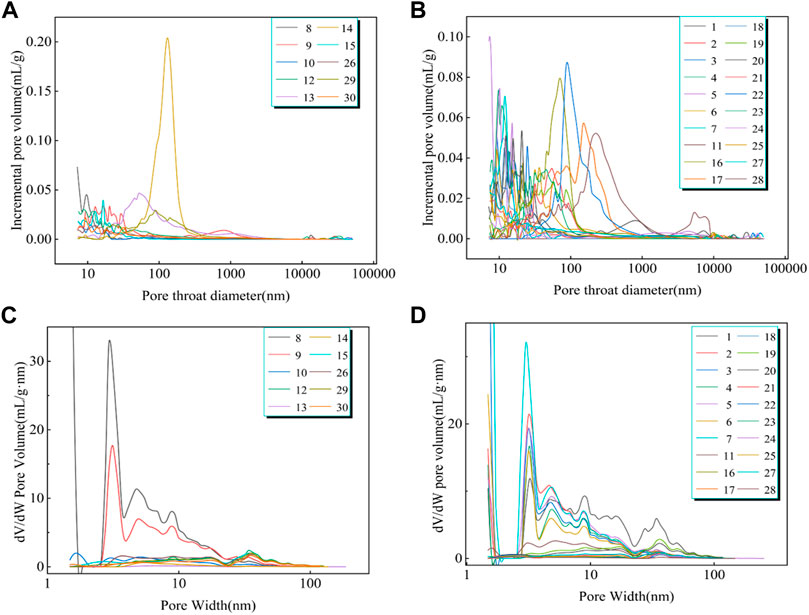
FIGURE 10. PSD of the three lithofacies. (A) HPMI test of lithofacies 1 and 2; (B) HPMI test of lithofacies 3; (C) LPN2GA test of lithofacies 1 and 2; and (D) LPN2GA test of lithofacies 3.
The statistical table in Table 2 was obtained by linear fitting of the scatter plot (Figure 11) according to Eqs 1–4. The correlation between the fractal dimensions of HPMI and LPN2GA shows a high degree of fitting, which can be used as the basis for the fractal dimension. Results: The DM1 of facies 1 = 2.92 is larger than that of facies 2 = 2.87 and that of facies 3 = 2.78. The DM2 of lithofacies 2 = 2.83 is larger than that of lithofacies 3 = 2.77 and that of lithofacies 1 = 2.6. DN1=1.62 of lithofacies 1 is larger than DN1 = 1.6 of lithofacies 3 and DN1 = 1.35 of lithofacies 2. The DN2 = 1.24 of lithofacies 2 is larger than the DN2 = 1.16 of lithofacies 3 and the DN2 = 1.07 of lithofacies 1.
To define an object that possesses multifractal characteristics, it should meet the three conditions: Dq and α (q) present a strict monotonic decrease with q; τ (q) stands for an ascending convex function of q; and F (α) denotes a convex function of a. Multifractal spectra were produced using HPMI data and LPN2GA test data from representative samples of different lithofacies, and the results proved that the aforementioned conditions were satisfied (Figure 12) τ (q) presents a strict monotonic elevation as q increases, indicating the multiple-fractal features of sample PSD.
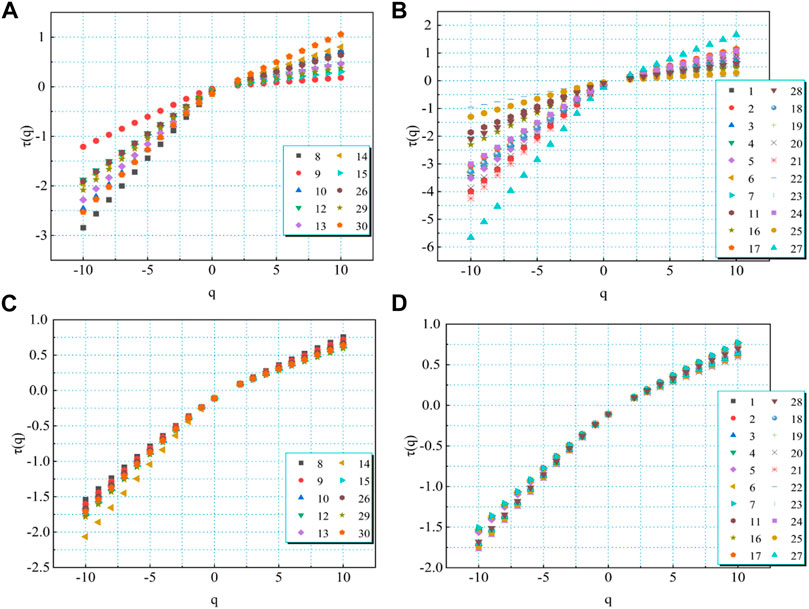
FIGURE 12. Moment (q = 10 to q = 10 at 1 increments) as a function of mass exponent function (τq) of three types of lithofacies PSDs. (A) Generalized fractal dimension of the HPMI test of lithofacies 1 and 2. (B) Generalized fractal dimension of the HPMI test of lithofacies 3. (C) Generalized fractal dimension of the LPN2GA test of lithofacies 1 and 2. (D) Generalized fractal dimension of the LPN2GA test of lithofacies 3.
Figure 13 confirms the obvious and shows a reverse-shaped curve regarding the q versus D (q) spectra of all samples that more clearly confirms the multifractal features of PSD. The spectral curve is capable of characterizing the PSD complexity at various q values. Figure 14 displays the obvious parabolic-shaped distribution in the a versus f (α) spectra regarding all the samples. For promoting the analysis of the map characteristics of each lithofacies, the multifractal parameters of three lithofacies are illustrated in the figures to discuss the fractal characteristics of pores of each lithofacies.
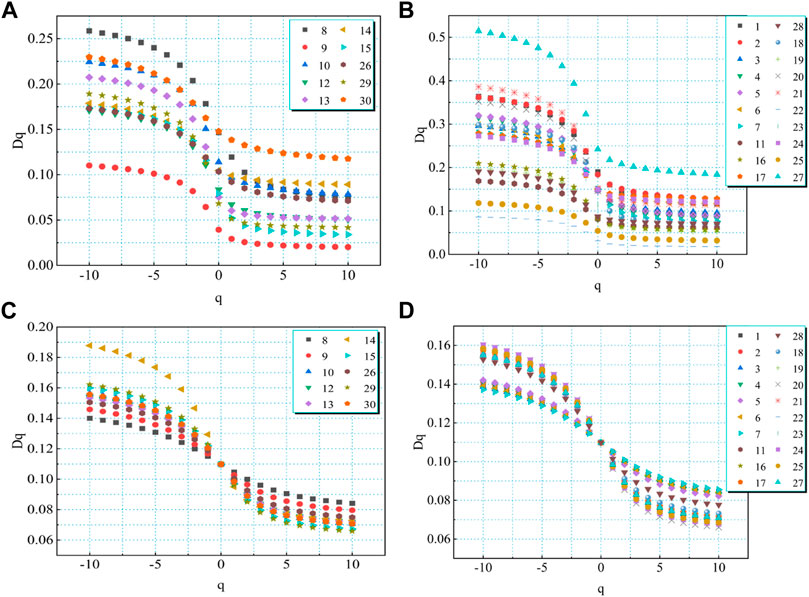
FIGURE 13. Generalized fractal parameters of the fractal Dq versus index q of three types of lithofacies PSDs. (A) GFP of the HPMI test of lithofacies 1 and 2. (B) GFP of the HPMI test of lithofacies 3. (C) GFP of the LPN2GA test of lithofacies 1 and 2. (D) GFP of the LPN2GA test of lithofacies 3.
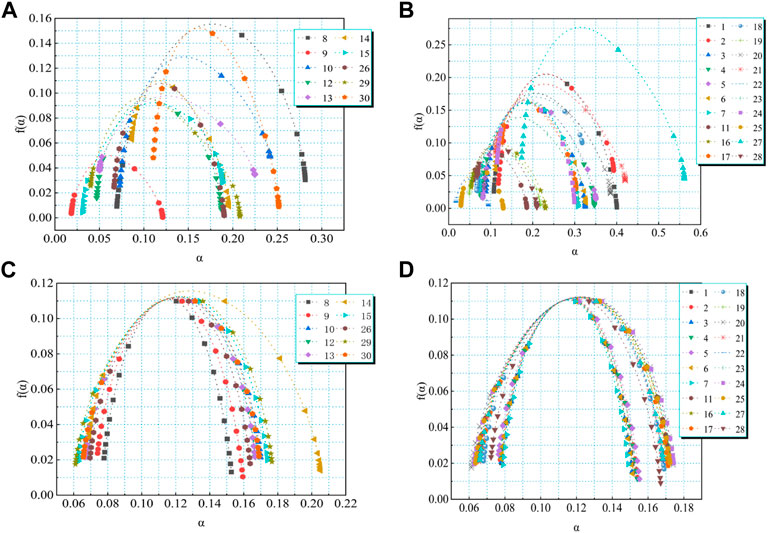
FIGURE 14. Multifractal singularity spectrum of three types of lithofacies PSDs. (A) Singular-fractal parameter of the HPMI test of lithofacies 1 and 2. (B) SFP of the HPMI test of lithofacies 3. (C) SFP of the LPN2GA test of lithofacies 1 and 2. (D) SFP of the LPN2GA test of lithofacies 3.
Figure 15 and Figure 16 show the statistics regarding GFP and SFP. The physical meaning of the parameters was introduced in the previous section. Figure 15 reveals the different D0 of all samples, demonstrating the different PV values in each divided box. The average value of D-10−D0 in lithofacies 3 is 0.15, which is greater than the mean value of D-10−D0 in lithofacies 1, which is 0.095, and the mean value of D-10−D0 in lithofacies 1 and 2 is the same. Thus, the lithofacies 3 sample group has larger generalized spectral width relative to the lithofacies 1 sample group, showing the stronger heterogeneity of the former. Spectral width D−10−D10 conducts a characterization on the overall change of the heterogeneity exhibited by mesopores and macropores at 10–250 nm. The mean value of the lithofacies 3 sample group (0.2) is larger than that of the lithofacies 1 sample group (0.13) and the lithofacies 2 sample group (0.12), indicating that the distribution of mesopores and macropores in lithofacies 3 groups is more heterogeneous. The samples of the same lithofacies have obvious changes in D−10−D10, revealing the impact of other factors on D−10−D10. The variation of D−10−D0 with respect to D0−D10 is larger in the lithofacies 3 sample group than in the lithofacies 2 sample group, and larger than that of the lithofacies 1 sample group, indicating that the heterogeneity of the lithofacies 3 sample group is controlled by LPMA. D−10−D0 and D0−D10 are different within the lithofacies 3 sample group, which confirms the obvious change of the pore volume in each pore diameter range. The lithofacies 2 sample group represents a smaller 0.029 average variation value of D0−D10 relative to the lithofacies 1 sample group, even smaller than that of the lithofacies 3 sample group, demonstrating the larger HPMA heterogeneity variation in the lithofacies 2 sample group than the latter.
The HPMI multifractal spectrum presents larger generalized spectral width relative to the LPN2GA multifractal spectrum, which reveals the stronger heterogeneity of the former. In the HPMI data, the pore size is more concentrated in larger than 10 nm, demonstrating the stronger heterogeneity of macropores and the weak heterogeneity of micropores and mesopores. In addition, the two maps show that the overall width of lithofacies 3 is larger than that of lithofacies 1 or 2, indicating that the heterogeneity of mesopores and macropores of lithofacies 3 is stronger than that of lithofacies 1 or 2, and the micropores and mesopores of lithofacies 3 are weaker than that of lithofacies 2 or 1.
The spectral width Δα = αmin-αmax is capable of characterizing PSD complexity, and when the value is high, it means that the multifractal system presents a large difference. According to Figure 16, the lithofacies 1 sample group possesses a larger singular spectrum width relative to the lithofacies 3 sample group, and the lithofacies 2 sample group has the smallest singular spectrum width. The left branch in group 1 has the largest singular spectral width, and the right branch in the three groups has almost the same singular spectral width, demonstrating the stronger PSD heterogeneity in the lithofacies 1 sample group. The average value of αmin for the lithofacies 2 sample group is 0.2, which is less than that of 0.21 for the lithofacies 3 sample group (the values for groups 1 and 3 are the same). Accordingly, a minimum pore volume can be observed. The lithofacies 2 sample group has a smaller 0.06 average αmax value relative to the lithofacies 3 sample group (the values for lithofacies 1 sample group and 2 are the same). The singularity index α0 denotes the PSD uniformity degree. As observed, the lithofacies 2 sample group possesses the smallest average value, the average values for lithofacies 1 and 3 sample groups are approximately the same. Nevertheless, the value presents a clear variation for different samples, which confirms the impact of other factors.
Because different lithofacies correspond to different sedimentary environments, lithofacies 1 corresponds to the underwater distribution channel, lithofacies 2 corresponds to the estuary dam, and lithofacies 3 corresponds to the evaporation lake. In general, the mesopores and macropores of the evaporation lake have strong heterogeneity and are controlled by LPMA. The heterogeneity of mesopores and macropores in the estuary dam is controlled by HPMA. The PSD of the underwater distributary channel is more complex, with the estuary dam having the most uneven distribution of mesopores and macropores.
D0 of all samples is 0.11, showing the existence of a value of PV in each divided box. The average value of D-10−D0 in lithofacies 1 is 0.046, which is larger than the mean value of D-10−D0 in lithofacies 3, which is 0.041, and the mean value of D-10−D0 in lithofacies 1 and 2 are approximately the same (Figure 17; Figure 18). Thus, the lithofacies 2 sample group has a larger generalized spectral width relative to the lithofacies 3 sample group, confirming the stronger heterogeneity of the former. The distribution of micropores and mesopores in lithofacies 2 groups is more heterogeneous. The variation of D−10−D0 with respect to D0−D10 is larger in the lithofacies 1 sample group than in the lithofacies 2 sample group, and greater than that of the lithofacies 3 sample group, indicating that the heterogeneity of the lithofacies 1 sample group is controlled by the LPMA. D−10−D0 and D0−D10 are obviously different in the lithofacies 1 sample group, revealing the clear change of the pore volume in the diameter range of pores. The lithofacies 3 sample group has smaller 0.034 average change value of D0−D10 relative to the lithofacies 1 sample group and the lithofacies 2 sample group, confirming the greater change of HPMA heterogeneity in the lithofacies 3 sample group.
Figure 18 shows that, lithofacies 3 sample group possesses the larger singular spectrum width relative to the lithofacies 2 sample group, and the lithofacies 1 sample group has the smallest singular spectrum width. The singular spectral width of the three groups was almost the same. The average value of αmin for the lithofacies 1 sample group is 0.17, which is less than that of 0.173 for the lithofacies 3 sample group (the values for groups 1 and 2 are the same). Hence, the smallest pore volume can be observed. The lithofacies 3 sample group presents the smaller 0.065 average αmax value relative to the lithofacies 1 sample group. The singularity index α0 of the three groups are approximately the same.
In general, the micropores and mesopores of the estuary dam are highly heterogeneous. The heterogeneity of micropores and mesopores in the underwater distributary channel is controlled by LPMA, and the heterogeneity of micropores and mesopores in the evaporation lake is controlled mostly by HPMA. PSD complexity of the micropores and mesopores in the underwater distributary channel are basically similar, and the mesopores and micropores of the evaporated lake are the most uneven. However, in the same group of lithofacies, the pore radius of different ranges reflects different characteristics. In order to summarize these rules, the correlation analysis of each multifractal parameter is illustrated in the following.
The fractal spectrum parameters undergo correlation analysis, with results shown in Figures 15–18. That is followed by the calculation of the correlation coefficients (Figure 21; Figure 22). As observed, some parameters are well correlated. In the mesopore and macropore of the underwater distributary channel, GFPs show strong positive correlation with each other, and the individual parameters show weak negative correlation. The overall correlation between DM1 and GFPs was negative, and some of them showed weak positive correlation. The overall correlation between DM2 and GFPs was not obvious, and individually, DM2 and D0–D2 show a higher positive correlation. SFPs are strongly and positively correlated. The single-fractal dimension is poorly related to SFPs, and the rule is not obvious.
In the micropore and mesopore of the underwater distributary channel, due to the particularity of D0 value, the correlation analysis aims at the parameter range other than D0. The results show an obvious correlation between GFPs, and the overall correlation between DM2 and GFPs is stronger than that between DM1 and GFPs, but the regularity is not obvious. The features of positive and negative correlations are quite different. SFPs show strong positive correlations among themselves and weak negative correlations individually, but the overall characteristics are stronger than the correlation between the middle and large pores. DN2 is clearly negatively correlated with SFPs, and the overall correlation is stronger than the overall correlation between DN1 Figure 19; Figure 20 SFPs.
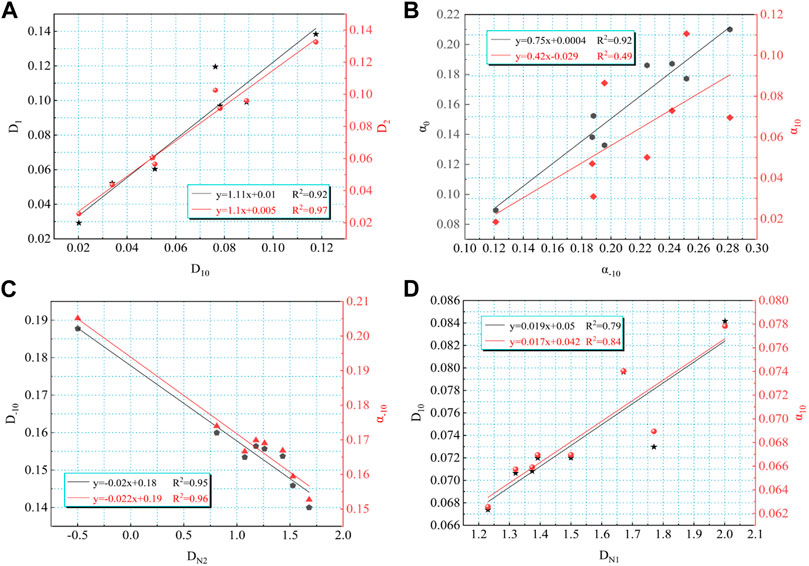
FIGURE 19. Diagram of the relationship among the multiple-fractal parameters and the single-fractal dimension of lithofacies 1 ((A) relationship among D1, D2, and D10 of mesopores and macropores; (B) relationship among a-10, α0, and α10 of mesopores and macropores; (C) relationship among DN2, D-10, and a-10 of micropores and mesopores; and (D) relationship among DN1, D10, and α10 of micropores and mesopores).
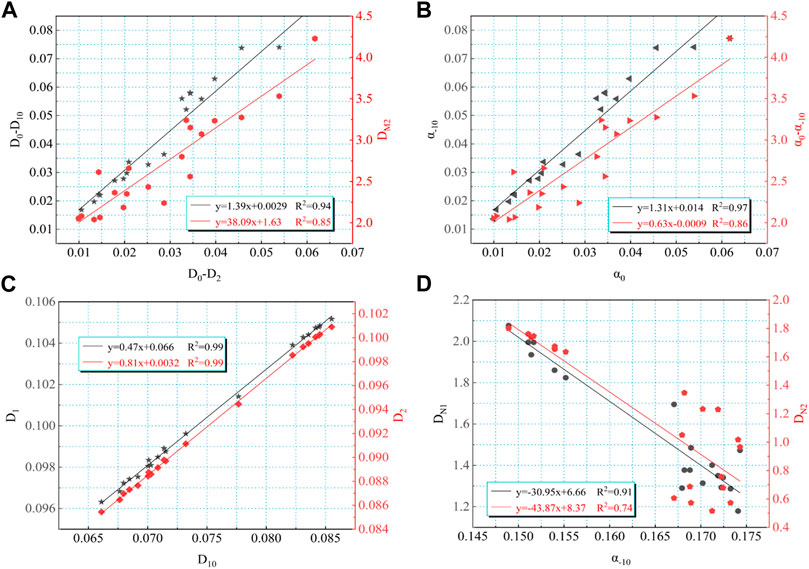
FIGURE 20. Diagram of the relationship among the multiple-fractal parameters and the single-fractal dimension of lithofacies 3 ((A) relationship among D0−D2, D0−D10, and DM2 of mesopores and macropores; (B) relationship among α0, a-10, and α0–α-10 of mesopores and macropores; (C) relationship among D10, D1, and D2 of micropores and mesopores; and (D) relationship among DN1, DN2, and a-10 of micropores and mesopores).
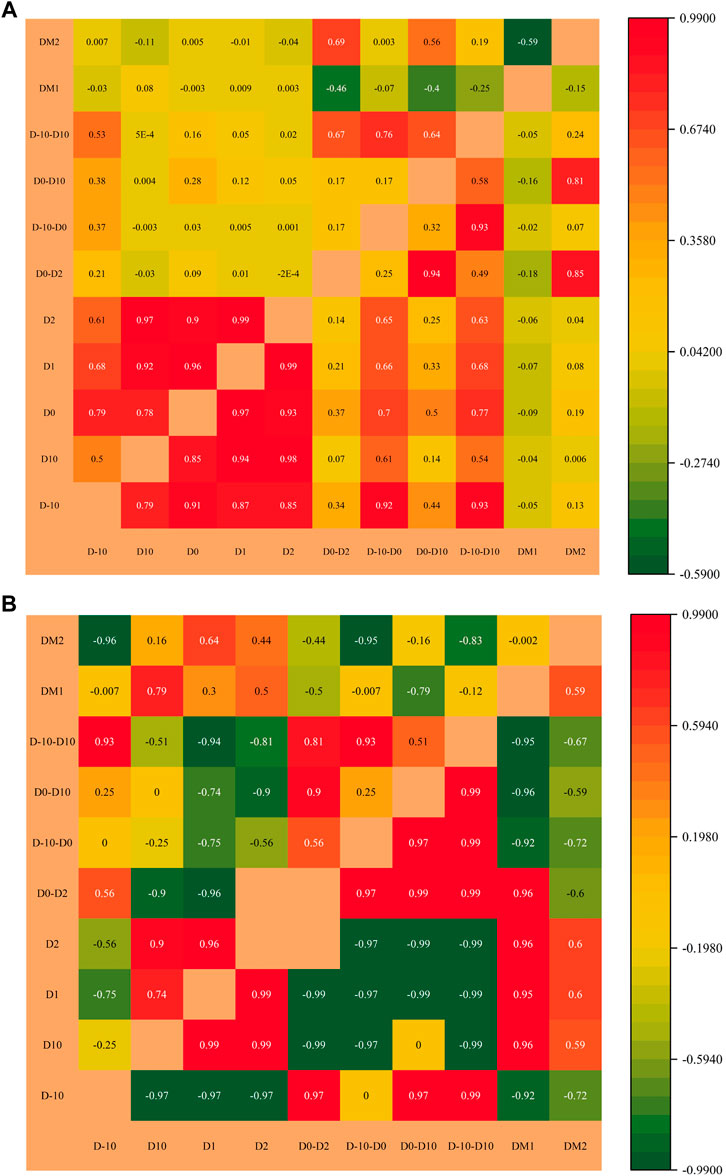
FIGURE 21. Correlation analysis of GFPs and single-fractal dimensions ((A) correlation analysis of HPMI shows that the upper left part is lithofacies 1 and the lower right part is lithofacies 3; (B) correlation analysis of LPN2GA shows that the upper left part is lithofacies 1 and the lower right part is lithofacies 3).
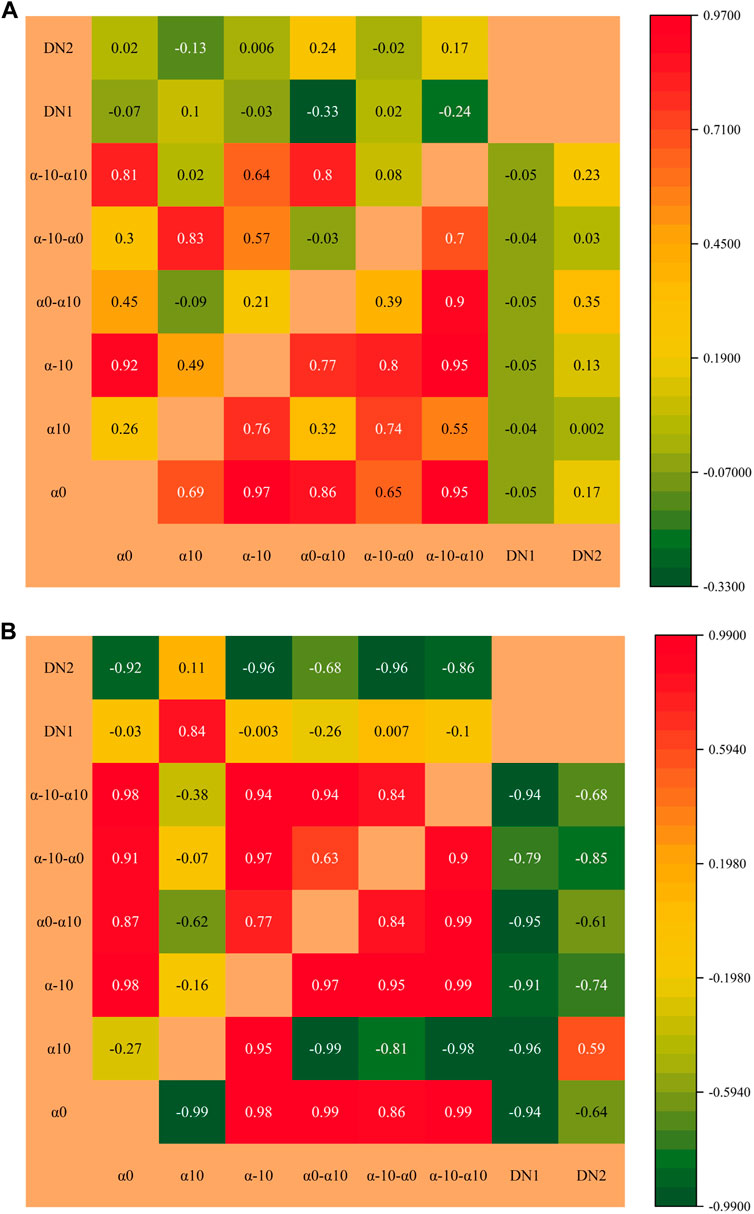
FIGURE 22. Correlation analysis of SFPs and single-fractal dimensions ((A) correlation analysis of HPMI shows that the upper left part is lithofacies 1 and the lower right part is lithofacies 3; (B) correlation analysis of LPN2GA shows that the upper left part is lithofacies 1 and the lower right part is lithofacies 3).
In the mesopore and macropore of the evaporation lake, GFPs are strongly and positively correlated and individual parameters are weakly and negatively correlated. DM1 and DM2 are negatively and positively correlated with GFPs, respectively. An obvious positive correlation exists between SFPs. DM1 and DM2 are weakly negatively and positively correlated with SFPs, respectively. Accordingly, GFPs and SFPs in mesopores and macropores of lithofacies 3 have strong regularity. When the value is high, the local distribution fluctuates greatly, the distribution interval is narrower, and pores undergo local agglomeration.
In the micropore and mesopore of the evaporation lake, a strong correlation can be observed between GFPs, and the overall correlation is stronger than the correlation between the micropore and mesopore of the underwater distributary channel and the correlation between the mesopore and macropore of the evaporation lake. The single-fractal dimension is strongly correlated with GFPs, but the regularity is not obvious, and the characteristics of positive and negative correlation are different. The correlation between SFPs is also strong, with individual R2 = 0.99, but the overall law does not meditate. The overall correlation between DN1 and SFPs is stronger than the overall correlation between DN2 and SFPs, which is a strong negative correlation. It is shown that SFPs can serve for characterizing PSD uniformity.
(1) Based on the ML algorithm, six kinds of logging curves and lithofacies of two landmark wells in Lucaogou of Jimusar Permian are matched and trained. Confusion matrices were constructed for examining the BML algorithm accuracy, together with calculating the TPC classifications. These results indicate that TPC for LogitBoost, GBM, XGBoost, and KNN for training well J2 was 96%, 96%, 96%, and 96%, while for validation well J1 subsets, it was 75%, 68%, 72%, and 75%, respectively. LogitBoost and KNN algorithms are reliable for lithofacies prediction of the Lucaogou Formation.
(2) Based on the classification of lithofacies, the micropores, mesopores, and macropores were comprehensively described by HPMI and LPN2GA tests, and the multifractal theory served for quantitatively characterizing the heterogeneity of pore distribution of different lithofacies samples. It is concluded that the distribution of pores with different pore sizes in the three lithofacies shows typical multifractal behavior, and the correlation between multifractal parameters and influencing factors of micropores, mesopores, and macropores is significantly different.
(3) PSD map and the generalized fractal spectrum show that there are fewer micropores, more mesopores, and almost no macropores in lithofacies 1. Lithofacies 2 is mostly concentrated in the mesopore range of 10–50 nm. Lithofacies 3 has more micropores and mesopores, and the macropores are mostly concentrated around 100 nm.
(4) For micropores and mesopores, the PSD of the estuary dam is not uniform, and the distribution of micropores and mesopores is more heterogeneous. The heterogeneity of the underwater distributary channel is controlled by LPMA, while the heterogeneity of HPMA in the evaporation lake shows a large variation and the pore volume of the underwater distributary channel changes significantly. The mesopore and macropore of the evaporation lake have high heterogeneity, which is controlled by LPMA. The heterogeneity of HPMA in the estuary dam shows a large variation.
(5) In the SFP map, the pore volume is approximately the same under similar parameter characteristics. In the range of 10–250 nm mesopore and macropore, the PSD of the underwater distributary channel is the most complex, and the PSD of the underwater distributary channel is highly heterogeneous. The evaporation lake is the most complex in the microporous and 2–50 nm range.
(6) An obvious positive correlation exists between SFPs of the underwater distributary channel, and an obvious negative correlation exists between DN2 and SFPs in the range of micropore and mesopore. SFPs of the evaporation lake are positively correlated with each other. In micropores and mesopores, the single-fractal dimension is strongly and negatively correlated with SFPs, which can serve for characterizing PSD uniformity.
The original contributions presented in the study are included in the article/Supplementary Material; further inquiries can be directed to the corresponding author.
CH and GL: Conceptualization and writing—original draft. ZZ: Project administration, data curation, investigation, and resources. YY and GL: Writing—review and editing, methodology, and validation. XH: Supervision and resources. CH and YJ: Formal analysis. MQ: Visualization. All authors contributed to the manuscript and approved the submitted version.
The authors extend their gratitude to Autonomous Region Graduate Student Innovation Project (XJ2-23G112), Professional degree Graduate Teaching Case Base Construction project (XJDX2023YALK17) and the National Natural Science Foundation of China (grant no. 42062010). They also thank the reviewers for their insightful and constructive comments that helped in improving the manuscript.
The authors declare that the research was conducted in the absence of any commercial or financial relationships that could be construed as a potential conflict of interest.
All claims expressed in this article are solely those of the authors and do not necessarily represent those of their affiliated organizations, or those of the publisher, the editors, and the reviewers. Any product that may be evaluated in this article, or claim that may be made by its manufacturer, is not guaranteed or endorsed by the publisher.
Adesida, A. G., Akkutlu, I. Y., Resasco, D. E., and Rai, C. S. “Kerogen pore size distribution of Barnett shale using DFT analysis and Monte Carlo simulations” in Proceedings of the SPE Annual Technical Conference, Denver, Colorado, USA, October 2011. doi:10.2118/147397-MS
Al-Mudhafar, W. j., Abbas, M. A., and Wood, D. A. (2022). Performance evaluation of boosting machine learning algorithms for lithofacies classification in heterogeneous carbonate reservoirs. Mar. Petroleum Geol. 145, 105886. doi:10.1016/j.marpetgeo.2022.105886
Aljaberi, J., Alafnan, S., Glatz, G., Sultan, A. S., and Afagwu, C. (2021). The impact of Kerogen tortuosity on shale permeability. SPE J. 26 (02), 765–779. doi:10.2118/204469-PA
Anovitz, L., Cole, D., Rother, G., Allard, F., Jackson, A., and Littrell, K. (2013). Diagenetic changes in macro-to nano-scale porosity in the St. Peter Sandstone: An (ultra) small angle neutron scattering and backscattered electron imaging analysis. Acta. 102, 280–305. doi:10.1016/j.gca.2012.07.035
Brunauer, S., Emmett, P. H., and Teller, E. (1938). Adsorption of gases in multimolecular layers. J. Am. Chem. Soc. 60 (2), 309–319. doi:10.1021/ja01269a023
Cai, Y., Li, Q., Liu, D., Zhou, Y., and Lv, D. (2018). Insights into matrix compressibility of coals by mercury intrusion porosimetry and N2 adsorption. Int. J. Coal Geol. 200, 199–212. doi:10.1016/j.coal.2018.11.007
Cao, Z., Liu, G., Xiang, B., Wang, P., Niu, G., Niu, Z., et al. (2017). Geochemical characteristics of crude oil from a tight oil reservoir in the Lucaogou Formation, jimusar sag, Junggar Basin. AAPG Bull. 101 (1), 39–72. doi:10.1306/05241614182
Chen, T., and Guestrin, C. “XGBoost: A scalable tree boosting system,” in Proceedings of the 22nd ACM SIGKDD International Conference on Knowledge Discovery and Data Mining, New York, NY, United States, August 2016. doi:10.1145/2939672.2939840
Fu, H. J., Tang, D. Z., Xu, T., Xu, H., Tao, S., Li, S., et al. (2017). Characteristics of pore structure and fractal dimension of low-rank coal: A case study of lower jurassic xishanyao coal in the southern Junggar Basin, NW China. Fuel 193, 254–264. doi:10.1016/j.fuel.2016.11.069
Gao, H., Yu, B., Duan, Y., and Fang, Q. (2014). Fractal analysis of dimension less capillary pressure function. Int. J. Heat. Mass Transf. 69, 26–33. doi:10.1016/j.ijheatmasstransfer.2013.10.006
Garum, M., Glover, P. W., Lorinczi, P., Micklethwaite, S., and Hassanpour, A. (2021). Integration of multiscale imaging of nanoscale pore microstructures in gas shales. Energy and Fuels 35 (13), 10721–10732. doi:10.1021/acs.energyfuels.1c00554
Han, C. C., Li, G., Dan, S. H., Yang, Y., He, X. D., Qi, M., et al. (2022). Study of fractal and multifractal features of pore structure in tight sandstone reservoirs of the permian Lucaogou Formation, jimsar sag, Junggar Basin, northwest China. ACS Omega 7 (35), 31352–31366. doi:10.1021/acsomega.2c03717
He, H., Liu, P., Xu, L., Hao, S., Qiu, X., Shan, C., et al. (2021). Pore structure representations based on nitrogen adsorption experiments and an FHH fractal model: Case study of the block Z shales in the Ordos Basin, China. J. Petroleum Sci. Eng. Geol. 203, 108661. doi:10.1016/j.petrol.2021.108661
Karayiğit, A. İ., Mastalerz, M., Oskay, R. G., and Buzkan, İ. (2018). Bituminous coal seams from underground mines in the Zonguldak Basin (NW Turkey): Insights from mineralogy, coal petrography, Rock-Eval pyrolysis, and meso-and micro-porosity. Int. J. Coal Geol. 199, 91–112. doi:10.1016/j.coal.2018.09.020
Kim, J. (2022). Lithofacies classification integrating conventional approaches and machine learning technique. J. Nat. Gas Sci. Eng. 100, 104500. doi:10.1016/j.jngse.2022.104500
Labani, M. M., Rezaee, R., Saeedi, A., and Al Hinai, A. (2013). Evaluation of pore size spectrum of gas shale reservoirs using low pressure nitro-gen adsorption, gas expansion and mercury porosimetry: A case study from the perth and canning basins, western Australia. J. Petroleum Sci. Eng. Geol. 112, 7–16. doi:10.1016/j.petrol.2013.11.022
Lai, J., and Wang, G. W. (2015). Fractal analysis of tight gas sandstones using high-pressure mercury intrusion techniques. J. Nat. Gas Sci. Eng. 24, 185–196. doi:10.1016/j.jngse.2015.03.027
Li, K. (2010). Analytical derivation of Brooks–Corey type capillary pressure models using fractal geometry and evaluation of rock heterogeneity. J. Pet. Sci. Eng. 73, 20–26. doi:10.1016/j.petrol.2010.05.002
Li, L., Chang, L. Y., Ke, S. K., and Huang, D. F. (2012). Multifractal analysis and lacunarity analysis: A promising method for the automated assessment of muskmelon (cucumis melo L) epidermis netting. Comput. Electron. Agric. 88, 72–84. doi:10.1016/j.compag.2012.06.006
Liu, B., Teng, J., Mastalerz, M., Schieber, J., Schimmelmann, A., and Bish, D. (2021). Compositional control on shale pore structure characteristics across a maturation gradient: Insights from the devonian new albany shale and marcellus shale in the eastern United States. Energy and Fuels 35 (9), 7913–7929. doi:10.1021/acs.energyfuels.1c00526
Liu, K., Ostadhassan, M., Sun, L., Zou, J., Yuan, Y., Gentzis, T., et al. (2019). A comprehensive pore structure study of the Bakken Shale with SANS, N2 adsorption and mercury intrusion. Fuel 245, 274–285. doi:10.1016/j.fuel.2019.01.174
Liu, K., Ostadhassan, M., Zou, J., Gentzis, T., Rezaee, R., Bubach, B., et al. (2018a). Multifractal analysis of gas adsorption isotherms for pore structure characterization of the Bakken Shale. Fuel 219, 296–311. doi:10.1016/j.fuel.2018.01.126
Liu, K. Q., and Ostadhassan, M. (2017). Quantification of the microstructures of Bakken shale reservoirs using multi-fractal and lacunarity analysis. J. Nat. Gas Sci. Eng. 39, 62–71. doi:10.1016/j.jngse.2017.01.035
Liu, M., Xie, R., Guo, J., and Jin, G. (2018b). Characterization of pore structures of tight sandstone reservoirs by multifractal analysis of the NMR T2 distribution. Energy fuels. 32, 12218–12230. doi:10.1021/acs.energyfuels.8b02869
Lu, G., Wang, J., Wei, C., Song, Y., Yan, G., Zhang, J., et al. (2018). Pore fractal model applicability and fractal characteristics of seepage and adsorption pores in middle rank tectonic deformed coals from the Huaibei coal field. J. Pet. Sci. Eng. 171, 808–817. doi:10.1016/j.petrol.2018.07.074
Marc, G. (2017). LogitBoost autoregressive networks. Comput. Stat. Data Anal. 112 (C), 88–98. doi:10.1016/j.csda.2017.03.010
Memon, A., Li, A., Jacqueline, N., Kashif, M., and Ma, M. (2020). Study of gas sorption, stress effects and analysis of effective porosity and permeability for shale gas reservoirs. J. Petroleum Sci. Eng. Geol. 193, 107370. doi:10.1016/j.petrol.2020.107370
Nauyen, D. V., Kim, D., and Choo, Y. W. (2022). Optimized extreme gradient boosting machine learning for estimating diaphragm wall deflection of 3D deep braced excavation in sand. Structures 45, 1936–1948. doi:10.1016/j.istruc.2022.10.027
Pomonis, P. J., and Tsaousi, E. T. (2009). Frenkel-halsey-hill equation, dimensionality of adsorption, and pore anisotropy. Langmuir ACS J. Surfaces Colloids. 25, 9986–9994. doi:10.1021/la901121c
Posadas, A., Giménez, D., Quiroz, R., and Protz, R. (2003). Multifractal characterization of soil pore systems. Soil Sci. Soc. Am. J. 67, 1361–1369. doi:10.2136/sssaj2003.1361
Qiu, Z., Tao, H., Zou, C., Wang, H., Ji, H., and Zhou, S. (2016). Lithofacies and organic geochemistry of the middle permian Lucaogou Formation in the jimusar sag of the Junggar Basin, NW China. J. Petroleum Sci. Eng. Geol. 140, 97–107. doi:10.1016/j.petrol.2016.01.014
Reading, H. (1996). Sedimentary environments: Processes, facies and stratigraphy. Hoboken, New Jersey, United States: Wiley. doi:10.1038/278486a0
Rouquerol, J., Avnir, D., Fairbridge, C., Everett, D., Haynes, J., Pernicone, N., et al. (1994). Recommendations for the characterization of porous solids (Technical Report). Pure Appl. Chem. 66 (8), 1739–1758. doi:10.1351/pac199466081739
Sarker, I. H. (2021). Machine learning: Algorithms, real-world applications and research directions. SN Comput. Sci. 2, 160. doi:10.1007/s42979-021-00592-x
Schmitt, M., Fernandes, C. P., Neto, J. A. B. C., Wolf, F. G., and Santos, V. S. S. (2013). Characterization of pore systems in seal rocks using nitrogen gas adsorption combined with mercury injection capillary pressure techniques. Mar. Pet. Geol. 39, 138–149. doi:10.1016/j.marpetgeo.2012.09.001
Su, Y., Zha, M., Ding, X., Qu, J., Gao, C., Jin, J., et al. (2019). Petrographic, palynologic and geochemical characteristics of source rocks of the Permian Lucaogou Formation in Jimsar Sag, Junggar Basin, NW China: Origin of organic matter input and depositional environments. J. Petroleum Sci. Eng. 183, 106364. doi:10.1016/j.petrol.2019.106364
Tang, P., Chew, N. Y. K., Chan, H. K., and Raper, J. A. (2003). Limitation of determination of surface fractal dimension using N2 adsorption isotherms and modified Frenkel-Halsey-Hill Theory. Langmuir 19, 2632–2638. doi:10.1021/la0263716
Tang, X., Guo, Y. C., Zhou, T. Q., and Guo, S. (2021). Distribution characteristics of nanopores and discriminant characteristics of sedimentary environment of the Longmaxi Formation in the southern Sichuan Basin. J. Nanosci. Nanotechnol. 7, 431–437. doi:10.1166/jnn.2021.18741
Tian, Q. G., Kang, Y. L., You, L. J., Xu, F., and Meng, S. (2020). A comprehensive insight into the multiscale pore structure characterization of saline-lacustrine tight carbonate reservoir. J. Petroleum Sci. Eng. 187, 106744. doi:10.1016/j.petrol.2019.106744
Wang, J., Cao, Y. C., Wang, X. T., Liu, K. Y., Wang, Z. K., and Xu, Q. S. (2018a). Sedimentological constraints on the initial uplift of the west bogda mountains in mid-permian. Sci. Rep. 8 (1), 1453. doi:10.1038/S41598-018-19856-3
Wang, J. M., Zhang, M., Bai, Z. K., Yang, R. X., and Guo, L. L. (2014). Multi-fractal characteristics of the particle distribution of reconstructed soils and the relationship between soil properties and multi-fractal parameters in an opencast coal-mine dump in a loess area. Trans. Chin. Soc. Agric. Eng. 30, 4749–4762. doi:10.1007/s12665-014-3761-0
Wang, X. X., Hou, J. G., Song, S. H., Wang, D. M., Gong, L., Ma, K., et al. (2018b). Combining pressure-controlled porosimetry and rate-controlled porosimetry to investigate the fractal characteristics of full-range pores in tight oil reservoirs. J. Petroleum Sci. Eng. 171, 353–361. doi:10.1016/j.petrol.2018.07.050
Washburn, E. W. (1921). The dynamics of capillary flow. Phys. Rev. 17 (3), 273–283. doi:10.1103/physrev.17.273
Wei, M., Xiong, Y., Zhang, L., Li, J., and Peng, P. (2016). The effect of sample particle size on the determination of pore structure parameters in shales. Int. J. Coal Geol. 163, 177–185. doi:10.1016/j.coal.2016.07.013
Wu, H., Hu, W., Cao, J., Wang, X., and Liao, Z. (2016). A unique lacustrine mixed dolomitic-clastic sequence for tight oil reservoir within the middle Permian Lucaogou Formation of the Junggar Basin, NW China: Reservoir characteristics and origin. Mar. Petroleum Geol. 76, 115–132. doi:10.1016/j.marpetgeo.2016.05.007
Yang, W., Hou, J., Liu, Y., Dou, L., and Wang, X. (2022). The pore structures of different lithofacies in low-permeability sandy conglomerate reservoirs and their diagenetic impacts: A case study from the Es4 member of the northern steep slope in dongying depression, bohai bay basin, NE China. Mar. Petrol. Geol. 136, 105481. doi:10.1016/j.marpetgeo.2021.105481
Yang, Z., Zou, C., Hou, L., Wu, S., Lin, S., Luo, X., et al. (2019). Division of fine-grained rocks and selection of “sweet sections” in the oldest continental shale in China: Taking the coexisting combination of tight and shale oil in the Permian Junggar Basin. Mar. Petroleum Geol. 109, 339–348. doi:10.1016/j.marpetgeo.2019.06.010
Yu, S., Bo, J., Pei, S., and Wang, J. H. (2018). Matrix compression and multifractal characterization for tectonically deformed coals by Hg poro-simetry. Fuel 211, 661–675. doi:10.1016/j.fuel.2017.09.070
Zhang, J. J., Wei, C. T., Chu, X. X., Vandeginste, V., and Ju, W. (2020). Multifractal analysis in characterizing adsorption pore heterogeneity of middle- and high-rank coal reservoirs. ACS Omega 5, 19385–19401. doi:10.1021/acsomega.0c01115
Zhang, J., Liu, G., Cao, Z., Tao, S., Felix, M., Kong, Y., et al. (2019). Characteristics and formation mechanism of multi-source mixed sedimentary rocks in a saline lake, a case study of the Permian Lucaogou Formation in the Jimusaer Sag, northwest China. Mar. Petroleum Geol. 102, 704–724. doi:10.1016/j.marpetgeo.2019.01.016
Zhao, J., Tang, D., Qin, Y., and Xu, H. (2019a). Fractal characterization of pore structure for coal macro-lithotypes in the Hancheng area, southeastern Ordos Basin, China. J. Pet. Sci. Eng. 178, 666–677. doi:10.1016/j.petrol.2019.02.060
Zhao, J., Xu, H., Tang, D., Mathews, J. P., Li, S., and Tao, S. (2016). A comparative evaluation of coal specific surface area by CO2 and N2 adsorption and its influence on CH4 adsorption capacity at different pore sizes. Fuel 183, 420–431. doi:10.1016/j.fuel.2016.06.076
Zhao, P., Wang, X., Cai, J., Luo, M., Zhang, J., Liu, Y., et al. (2019b). Multifractal analysis of pore structure of Middle Bakken formation using low temperature N2 adsorption and NMR measurements. J. Pet.Sci. Eng. 176, 312–320. doi:10.1016/j.petrol.2019.01.040
Zheng, S., Yao, Y., Liu, D., Cai, Y., Liu, Y., and Li, X. (2019). Nuclear magnetic resonance T2 cutoffs of coals: A novel method by multifractal analysis theory. Fuel 241, 715–724. doi:10.1016/j.fuel.2018.12.044
Keywords: multifractal, low-pressure nitrogen gas adsorption, high-pressure mercury intrusion, pore structure, boosting machine learning
Citation: Li G, Han C, Zhang Z, Hu C, Jin Y, Yang Y, Qi M and He X (2023) Multifractal analysis of the heterogeneity of nanopores in tight reservoirs based on boosting machine learning algorithms. Front. Earth Sci. 11:1200913. doi: 10.3389/feart.2023.1200913
Received: 05 April 2023; Accepted: 30 May 2023;
Published: 19 June 2023.
Edited by:
Mehdi Ostadhassan, Northeast Petroleum University, ChinaCopyright © 2023 Li, Han, Zhang, Hu, Jin, Yang, Qi and He. This is an open-access article distributed under the terms of the Creative Commons Attribution License (CC BY). The use, distribution or reproduction in other forums is permitted, provided the original author(s) and the copyright owner(s) are credited and that the original publication in this journal is cited, in accordance with accepted academic practice. No use, distribution or reproduction is permitted which does not comply with these terms.
*Correspondence: Changcheng Han, Mjk2MzgzMjk3QHFxLmNvbQ==; Zizhao Zhang, MTUwMjkzNTE0NjJAMTYzLmNvbQ==
Disclaimer: All claims expressed in this article are solely those of the authors and do not necessarily represent those of their affiliated organizations, or those of the publisher, the editors and the reviewers. Any product that may be evaluated in this article or claim that may be made by its manufacturer is not guaranteed or endorsed by the publisher.
Research integrity at Frontiers

Learn more about the work of our research integrity team to safeguard the quality of each article we publish.