 Jingye Zhang
 Ke Sun
 Chen Du1†
95% of researchers rate our articles as excellent or good
Learn more about the work of our research integrity team to safeguard the quality of each article we publish.
Find out more
ORIGINAL RESEARCH article
Front. Earth Sci. , 09 June 2023
Sec. Solid Earth Geophysics
Volume 11 - 2023 | https://doi.org/10.3389/feart.2023.1199320
This article is part of the Research Topic Pre-, Co-, and Post-Seismic Processes of Recent Earthquakes in Mainland China View all 9 articles
The relationship between satellite thermal infrared anomalies and earthquakes or fault activity has been studied for more than 30 years. In this study, five strong earthquakes (the MS6.1 earthquake in Biru, Tibet; the MS7.4 earthquake in Madoi, Qinghai; the MS6.0 earthquake in Delingha, Qinghai; the MS6.1 earthquake in Lushan, Sichuan; and the MS6.8 earthquake in Luding, Sichuan) that occurred on the western mainland of China over the past 2 years were studied. Based on monthly MODIS land surface temperature (LST) data and daily NOAA satellite longwave radiation data, the departure algorithm and the Robust Satellite Techniques (RST) algorithm were used to extract and analyze the characteristics of thermal infrared anomaly information for blocks and faults around the earthquake from different temporal and spatial scales. The results showed the following: 1) In the medium-term scale study based on monthly data, blocks near the epicenters of five earthquakes showed temperature increase anomalies of 1–6 months before the earthquakes; the areas of temperature increase anomalies were clearly controlled by the spatial distribution of the blocks, and earthquakes mostly occurred within blocks with frequent temperature increase anomalies. 2) In the short-term, thermal infrared anomaly feature tracking based on daily data meant that obvious thermal anomalies were also found. The thermal anomalies before the five seismic events all appeared within a period of 3 months before the earthquake, and there were multiple consecutive days of anomalies. The significant temperature increases generally occurred a month before the earthquake, and the distribution of the anomalies was mostly in the form of strips, which is basically consistent with the trend of the fault zone. The use of thermal infrared remote sensing data to summarize the dynamic evolution of thermal infrared anomalies of blocks and faults before strong earthquakes can provide a basis for the long-term monitoring of fault activity and seismic monitoring by satellite thermal infrared technology.
Tectonic activities are often accompanied by the movement of material and energy, which change the state of thermal radiation at the surface. With rapid developments in space technology, the thermal infrared information obtained by satellite infrared remote sensing technology can reflect the dynamic changes of thermal radiation. As one of the manifestations of tectonic activities, studying the pattern between thermal infrared anomalous information and block as well as fault activities in the seismogenic zone may provide new methods when exploring the mechanism of seismogenesis and monitoring tectonics activities.
A large number of earthquake case studies have found that active massif boundary zones are zones of strong seismic activity, and the majority of strong earthquakes in the world occur in or near active fault zones of a large scale (Zhang and Zhang, 2000; Shao et al., 2008). The thermal infrared anomalies associated with earthquakes are controlled by active tectonics, and anomalies tend to be distributed in stripes along the active faults. In the 1980s, ГОРНЫЙ В И. (1990) analyzed many years of thermal infrared photographs of Central Asia and found that tectonic activity in seismically active regions was characterized by strong and persistent thermal infrared radiation on spatial and temporal scales. At the end of the 20th century, Chinese scholars successively used satellite thermal infrared information to study earthquake prediction and tectonic activity. Qiang et al. (1988) used thermal infrared information to analyze thermal anomalies before several earthquake cases and achieved many meaningful research results, summarizing the main characteristics of thermal infrared temperature increase anomalies through three aspects: time, space and the intensity of earthquakes. Taking the 1997 Mani 7.9 magnitude earthquake as an example, Ma and Shan. (2000) proposed a new method in which to probe fault activity with remote sensing technology. Using the thermal infrared band of the NOAA satellite to detect the surface temperature near the earthquake area, they found a significant temperature increase strip in the Altun fault zone about 20 days before the earthquake. They concluded that there was a correspondence between the Mani earthquake and the enhanced activity of the Altun Tagh fault zone. Xu and Xu. (2001) summarized pre-earthquake infrared anomaly characteristics and spatial and temporal evolution patterns by analyzing the satellite thermal infrared images of more than 40 earthquakes in and around mainland China. They concluded that the anomalies associated with earthquakes did not disappear quickly and may have lasted from a few to 10 days, that the anomaly temperature increase process was generally from the initial to climax and then tended to be quiet, the anomaly area was positively correlated with the magnitude of the earthquake, and the anomaly became more pronounced when Ms>5. Chen et al. (2003) used the 2001 Kunlun Mountain 8.1 magnitude earthquake as an example and found that infrared increasing temperature anomalies appeared on the seismogenic rupture using the Bright Temperature (BT) difference method. The anomalous temperature increase was distributed in a strip-shaped pattern, and the maximum temperature increase occurred within a month and a half before the earthquake before returning to normal after the earthquake. They concluded that the temperature anomalies of this earthquake were related to seismogenic rupture. Deng et al. (2003) analyzed the characteristics of the infrared anomalies of three earthquakes of magnitude six or higher in mainland China and found that active faults were closely related to infrared anomalies; the seismogenic location was often close to the high-value area of infrared anomalies, and the distribution pattern of infrared anomalies related to regional tectonics and could not be generalized; Chen et al. (2006) used the wavelet theory to classify thermal infrared radiation into three frequencies: high, medium, and low and analyzed the correspondence between the three frequency bands and tectonic activity by combining meteorological data and seismic activity information and found that low-frequency thermal anomalies were closely related to tectonic and seismic movements, which could provide support for the further study of dynamic characteristics in fault activities. Meanwhile, some other scholars successively demonstrated the greater potential of satellite thermal infrared technology in identifying pre-earthquake tectonic activity (Zhang, 2014; Shi et al., 2020).
In this paper, based on monthly MODIS surface temperature data and daily Outgoing Longwave Radiation (OLR) data, combined with the departure algorithm and Robust Satellite Techniques (RST) algorithm, we selected five strong earthquakes in western mainland China and carried out a gradual tracking of pre-seismic thermal infrared anomalies from the mid-term to short-term. In addition to searching for earthquake precursors, we focused more on the process of tectonic movement. From block to fault, we explored the link between earthquakes, tectonic movements and thermal infrared anomalies in the seismogenic zone. The paper is organized as follows. The data and methods are presented in Section 2. The results are given in Section 3 and are discussed in Section 4. Finally, the conclusions are provided in Section 5.
In this paper, five strong earthquakes that occurred in the Qinghai-Tibetan Plateau region of western mainland China over the last 2 years were selected for study, all of which occurred on the eastern edge of the earthquake-prone Qinghai-Tibetan Plateau. During geodynamic evolution, the overall stress state of the Qinghai-Tibetan Plateau was different throughout the region, roughly bounded by 90°E. Due to the compression of the Indian plate, stresses west of 90°E showed a tendency to continue moving northward, while stresses east of 90°E continued to move eastward (Zhang et al., 2012), causing stresses to accumulate along the eastern edge of the Tibetan Plateau, so that tectonic movements were mainly concentrated in this region. Over the past decade or so, a series of strong earthquakes occurred in this region, including the 2008 Wenchuan MS8.0, the 2012 Yushu MS7.1, and the 2017 Jiuzhaigou MS7.0, etc. The five seismic events selected for this study also occurred in this tectonic context. Among the five earthquakes, the largest magnitude earthquake was the Madoi MS7.4 earthquake, and the smallest magnitude earthquake was the Delhi MS6.0 earthquake. Figure 1 shows the locations and tectonic contexts of these earthquakes, and Table 1 summarizes the information related to these earthquakes from the China Earthquake Network Center (http://www.ceic.ac.cn/).
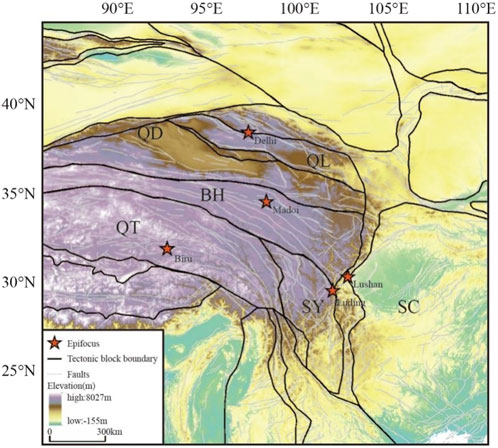
FIGURE 1. Geological structure map of the study area. BH—Bayanhar block; QT—Qiangtang block; QD—Qaidam block; LS—Lhasa block; SY—Sichuan–Yunnan block; SC—South China block.
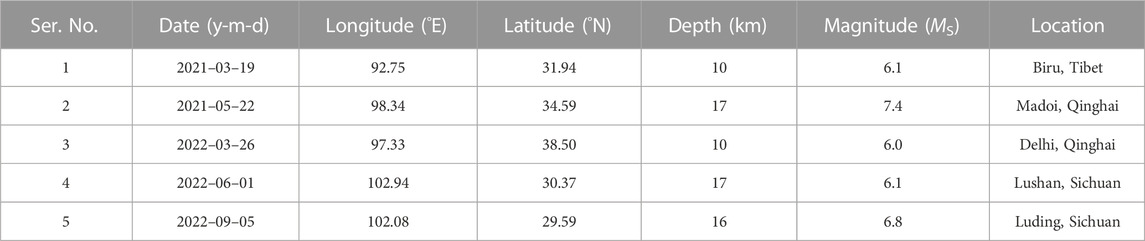
TABLE 1. Information of five earthquakes.
The two types of data used in this paper were the monthly MOD11C3 surface temperature data provided by the National Aeronautics and Space Administration (NASA) and the daily OLR data provided by the National Oceanic and Atmospheric Administration (NOAA). The land surface temperature (LST) values in the MOD11C3 product were derived by combining and averaging the values of the corresponding month from the MOD11C1 daily file with a temporal resolution of 1 month and a spatial resolution of 0.05°×0.05°. Data were accumulated from the year 2000 to the present, and with the data unit symbol K. OLR, data were obtained by matching and calculating the NOAA satellite infrared channel (10.5–12.5 um) data with the total measured values of the broadband (4–50 um) acquired by the Large Meteorological Experiment Satellite (NIMBUS), which was downloaded for free via the web (http://www.cdc. noaa.gov). The temporal resolution was 1 day, the spatial resolution was 1°×1°, and the data unit symbol was W/m2. The NOAA series satellites have accumulated long-wave radiation data information since the 1970s, and long-wave radiation data are a reflection of the energy condition between the earth’s surface and the atmosphere, which can record the energy change process of the earth-atmosphere system in the seismogenic zone.
In this study, we used the departure algorithm and RST algorithm to extract and track thermal infrared anomaly feature information on monthly and daily scales; the departure algorithm was based on MOD11C3 data, and the dataset used was from January 2001 to September 2022. The RST algorithm was based on OLR data, and the dataset used was from January 1996 to December 2022. Considering that the strain background of the tectonic block on the eastern edge of the Tibetan Plateau was mainly manifested as an extrusion (Xu et al., 2003), and rock tests confirmed that the rocks were heated by extrusion (Deng et al., 1993; Deng et al., 1997), in this paper we defined the infrared radiation enhancement (temperature increase) as an anomaly and did not consider the weakening or cooling phenomenon for the time being.
The departure algorithm calculated the difference between a certain value in a data set, the average value of all data in the data set and the single pixel LST departure represented the difference between the LST of an image and the average LST of that image over the same period of years. The spatial LST departure image was obtained by calculating the LST departure of all pixels in the study area (Eq. 1); the spatial LST departure image could reflect the spatial distribution of LST relative to the historical background field (Zhang et al., 2013).
R (x, y) is the departure at the coordinates (x, y) of the month, V (x, y) is the pixel value at coordinates (x, y) regarding the image of the month, and μ(x, y) is the multi-year contemporaneous average of pixels at coordinates (x, y).
RST is a multi-temporal data analysis method that constructs the background field of the signal and calculates the local bias index through a long time series of satellite data. Compared with other satellite data analysis techniques, RST can better capture the transient signal of thermal infrared anomalies; therefore, it can reflect thermal infrared anomalies in a calm state (Tramutoli et al., 2013). The ALICE index (Eq. 2) was obtained by the RST algorithm, which was beneficially applied in several seismic events (Di Bello et al., 2004; Genzano et al., 2007).
where
Lu et al. (2021) used the departure algorithm to study earthquakes in the Sichuan-Tibet region and found that concentrated temperature-rise anomalies of 3.5 K above the background field and an area larger than 20,000 km2 occurred in the region before multiple earthquakes. In addition, from a statistical perspective, the OLR anomaly extracted using the RST algorithm, when the value was more than twice the standard deviation, already belonged to the anomaly category. Therefore, the values above 3.5 k on the background field extracted by the departure algorithm and the values of ALICE greater than two extracted by the RST algorithm were defined as thermal anomalies in this study.
A total of 27 monthly scale thermal infrared anomaly images were acquired using the departure algorithm from July 2020 (the first large thermal anomaly before the Biru earthquake) to September 2022 (the end of the Luding earthquake) (Figure 2). Figure 2 clearly shows the gestation and development process of the thermal infrared anomaly before each earthquake. The general pattern arose in the western part of the Qinghai-Tibet Plateau and gradually moved eastward, with a gradual increase in intensity during the eastward movement. Before the Biru earthquake, the anomalies first appeared in the Indian subcontinent and the Tibetan Plateau in July 2020. The anomaly area gradually increased to about 1.7 million km2 in August and September. It continued to move eastward, reaching its maximum area in October, with anomalies concentrated in the eastern part of the Qiangtang and Bayanhar blocks before gradually disappearing in the following 2 months. The anomalies reappeared in January 2021, covering the Lhasa block, and continued to increase in size from February, reaching nearly 6.5 million km2. The anomalies gradually disappeared from March to May, followed by the March 19 earthquake of MS6.1 in Biru and the May 21 earthquake of MS6.8 in Madoi, respectively. From June to September, the anomalies were relatively quiet. Although occasional anomalies occurred, these anomalies were small in their extent, and the anomaly’s high values were scattered. The anomalies reappeared in October, and the anomaly high values were concentrated in the eastern part of the Qinghai-Tibetan Plateau. Such anomalies largely disappeared from November onward, and quiet conditions lasted until February 2022. In March 2022, the anomalies began to appear again on a large scale, covering almost the entire Tibetan Plateau area; when the anomaly peaked, the Delhi MS6.0 earthquake occurred that month. The anomalies showed a weakening-intensifying-weakening trend from April to June, and the Lushan MS6.1 earthquake occurred in June. From July, the anomalies converged to the eastern part of the Qinghai-Tibetan Plateau, concentrating at the junction of the Sichuan-Yunnan block, Bayanhar block and South China block, where a high value of anomalies coincided with the epicenter of the Luding MS6.8 earthquake that occurred in September.
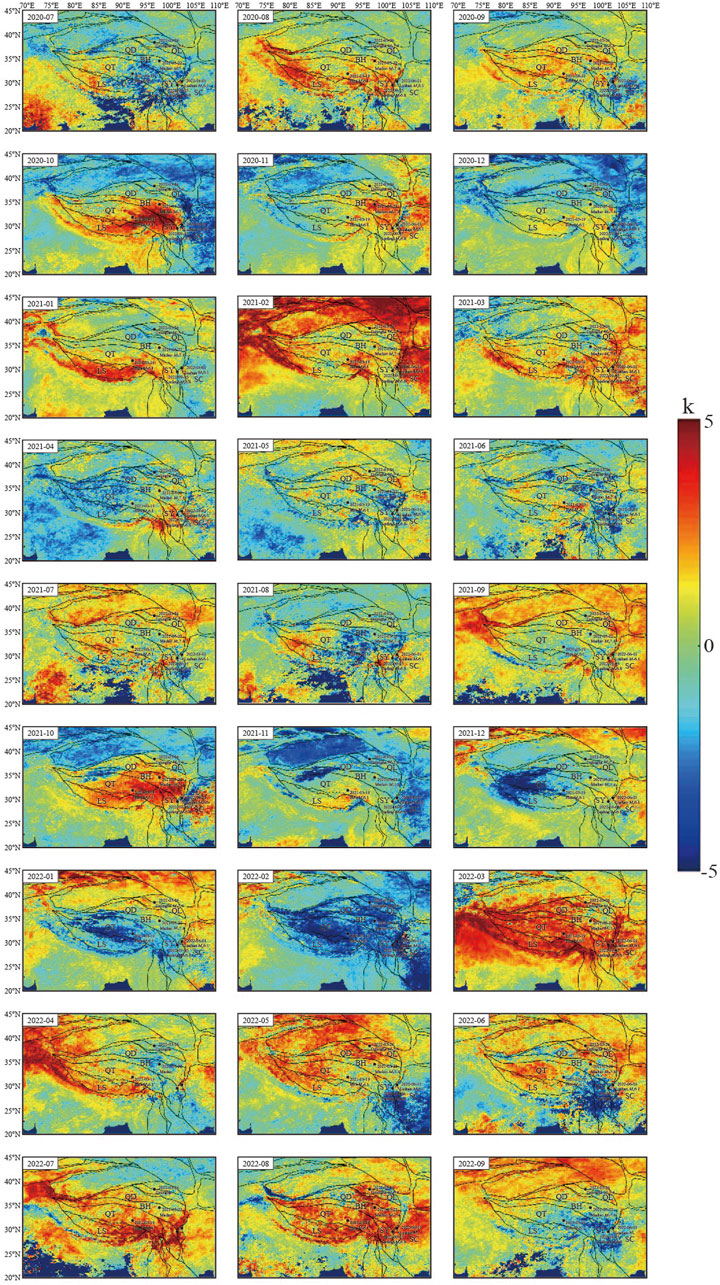
FIGURE 2. Monthly scale thermal infrared anomalies on the Qinghai-Tibetan Plateau.
The Biru earthquake occurred in an area with large topographic relief within the Qiangtang block in the Qinghai-Tibetan Plateau. The seismogenic fault was only 16 km away from the Amdo South Rim Fault, adjacent to the Nerong North Fault and the western section of the Bangong-Nujiang Fault (Li and Li., 2022). A total of 12 days of thermal anomalies were observed before the Biru earthquake occurred (Figure 3). These anomalies first appeared within the Bayanhar block to the northwest of the epicenter on February 17, and then the anomalies moved eastward along the Bayanhar block until February 20, when the largest anomaly area was concentrated in the northeastern part of the epicenter and the eastern part of the Bayanhar block in a clump; after this, the anomalies disappeared. The anomalies gradually increased in size during a week or so from Feb. 25, spreading in an east–west direction along the Amdo fault zone, covering the Bayanhar and Qiangtang blocks, and peaked on Feb. 27 with an ALICE value of 3 and the center of the anomaly close to the epicenter. On March 12 and 14, anomalies appeared again in the northeast and north of the epicenter, respectively, and both anomalies lasted for 1 day.
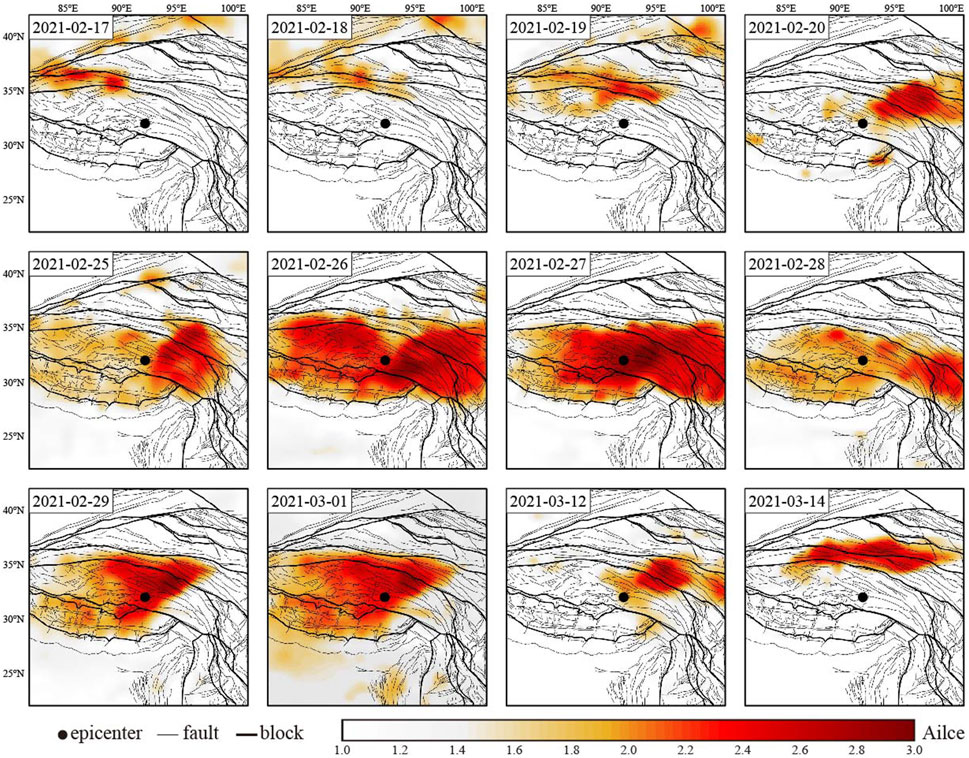
FIGURE 3. Daily-scale thermal infrared anomaly of the Biru earthquake.
The Madoi earthquake occurred within the Bayanhar block in the north-central Qinghai-Tibetan Plateau: one of the most representative laterally extruded active blocks (Li et al., 2019). The seismogenic fault zone was the Maduo-Gande fault zone, adjacent to the East Kunlun fault zone. A total of 12 days of thermal anomalies were observed before the Madoi earthquake (Figure 4). The first anomalies close to the epicenter appeared on March 12 and then disappeared immediately, and the anomalies reappeared on March 14, covering the seismogenic fault zone in a strip-like spread. During the 3 days from March 21, the anomalies began in the western part of the Bayanhar block and disappeared after passing through the epicenter movement to the junction of the Bayanhar and South China blocks. After a quiet state that lasted for about a month, the anomalies were again concentrated within the Sichuan-Yunnan block southeast of the epicenter on April 23 and 24. On May 6, the anomalies appeared in the northwestern part of the epicenter and again approached the epicenter along the seismogenic fault zone, while anomalies became more pronounced. Four days later, the anomalies reappeared in the northern part of the epicenter for 2 days and then disappeared in the western part of the epicenter.
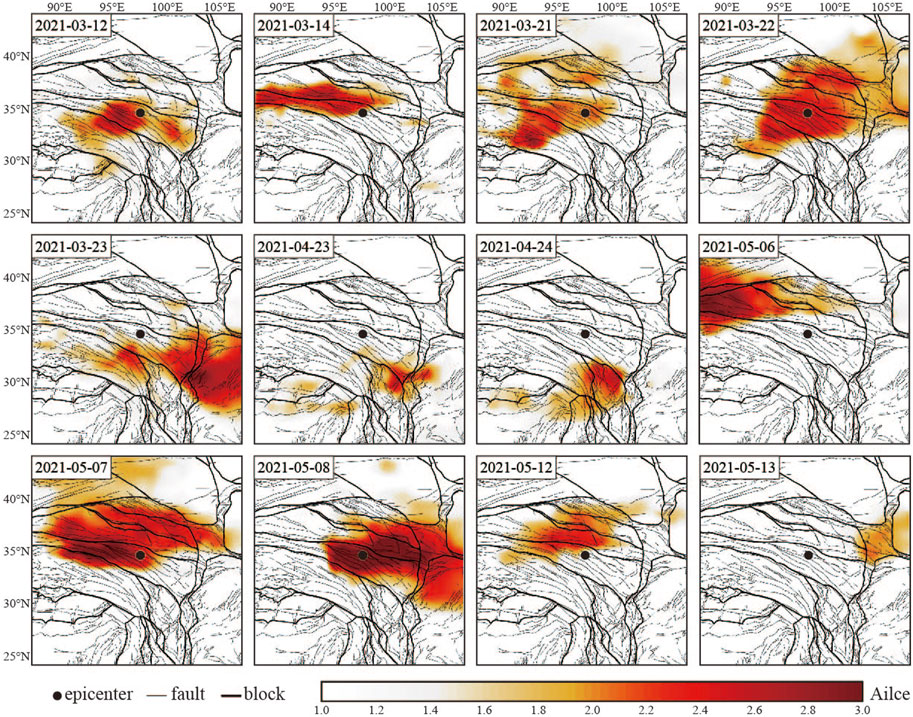
FIGURE 4. Daily-scale thermal infrared anomaly of the Madoi earthquake.
The Delingha earthquake occurred at the northeast edge of the Qinghai-Tibetan Plateau, where the Qinghai-Tibetan, Alxa, and Ordos blocks meet. The earthquake’s seismogenic structure was similar to that of the Madoi earthquake, which is a typical slip-type seismic event (Xiong et al., 2022). A total of 24 days of thermal anomalies were observed before the Delhi earthquake (Figure 5). The anomalies first appeared in the northwestern part of the epicenter on January 16 and lasted for 5 days. During this period, the anomalies gradually increased in size as they expanded eastward and then gradually weakened and disappeared from the eastern part of the epicenter in the following 2 days after the anomaly peaked in size on January 18. After a month and half quiet period, cotton wool-like anomalies and clump-like anomalies appeared continuously in the southern part of the epicenter for 18 days from March 6 to 3 days before the earthquake, and the intensity of the anomalies showed a repeated strengthening and weakening trend. The earthquake occurred on the third day after the end of the anomaly period.
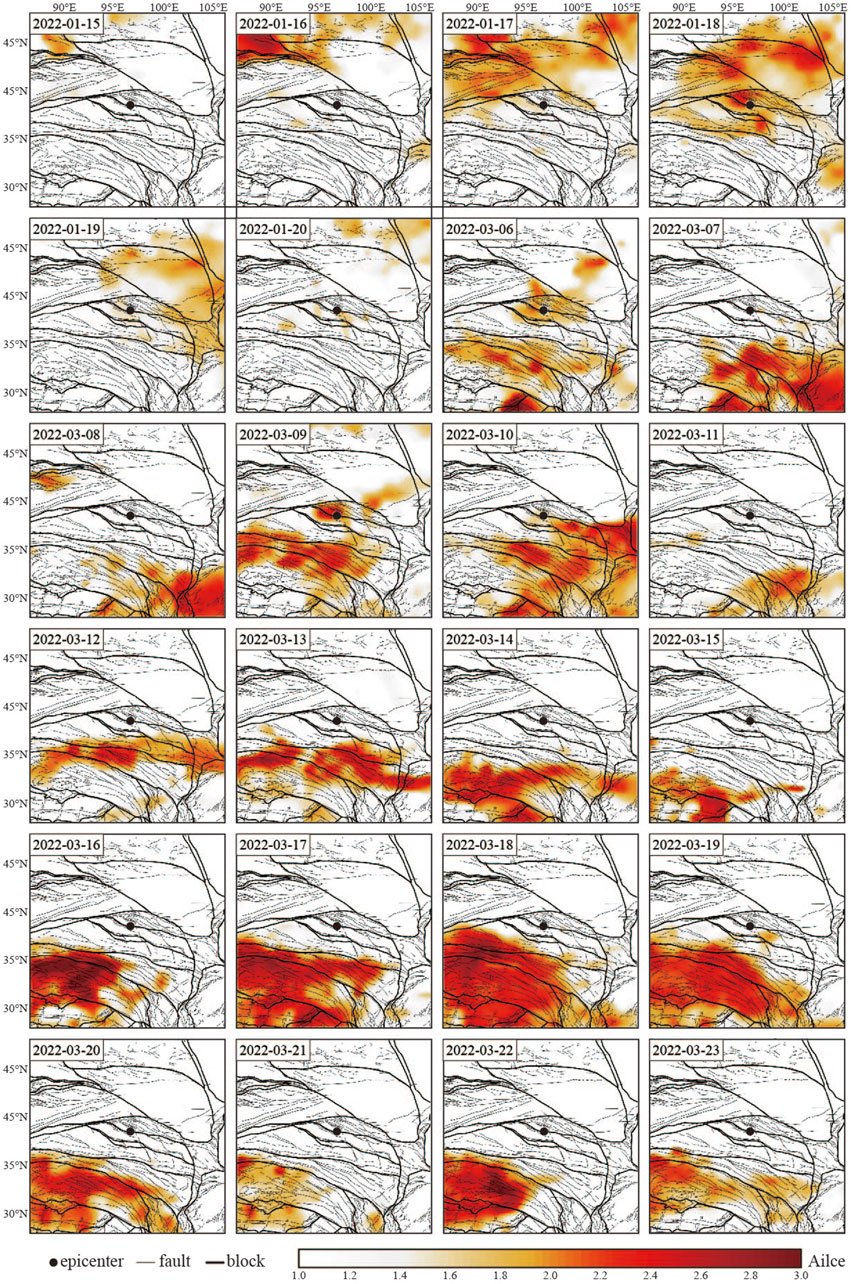
FIGURE 5. Daily-scale thermal infrared anomaly of the Delhi earthquake.
The Lushan earthquake occurred on the southern section of the Longmen-Shan fault zone at the junction of the north-western edge of the Sichuan Basin and the eastern edge of the Qinghai-Tibetan Plateau, which has long been influenced by the eastward movement of the Qinghai-Tibetan Plateau on the Sichuan Basin, with complex tectonic activities (Yang et al., 2022). A total of 16 days of thermal anomalies were observed before the Lushan earthquake (Figure 6). These anomalies first appeared northwest of the epicenter on April 6, lasted for 5 days, and finally disappeared east of the epicenter. The anomalies reappeared on April 19 and lasted for 2 days before disappearing. On May 3, the anomalies spread along the Bayanhar block in a strip-like pattern for 5 days, with the evolution of the anomalies showing a process of emergence-intensification-contraction-disappearance. The last anomaly before the quake occurred on May 21, and for 4 days, the anomalies moved from the northwest to the north of the epicenter and disappeared.
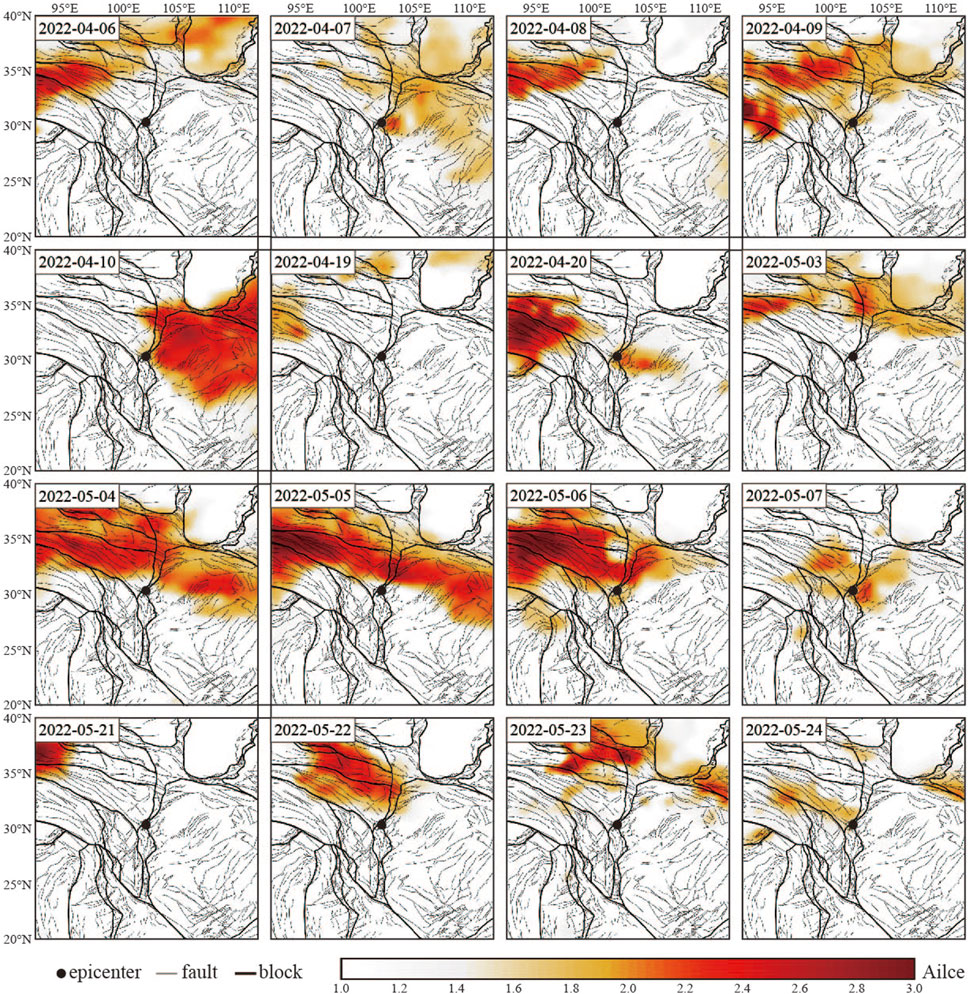
FIGURE 6. Daily-scale thermal infrared anomaly of the Lushan earthquake.
The Luding earthquake occurred in the southeastern section of the Xianshuihe fault. A total of 20 days of thermal anomalies were observed before the Luding earthquake (Figure 7). On June 13, the anomalies first appeared in the north-western part of the epicenter and moved to the junction of the Bayanhar and South China blocks in the north-eastern part of the epicenter within 3 days before disappearing. On July 1, the anomalies reappeared in a cluster shape and gradually increased in size, reaching a peak on July 6. After July 7, the anomalies began to contract with the epicenter as the center and disappeared 2 days later. On July 12, the anomalies appeared in the epicenter’s southern part and disappeared after 4 days. After August, the anomalies appeared intermittently. The last significant anomaly before the earthquake occurred on August 21 and the anomalies were distributed around the epicenter in a cluster shape for 3 days.
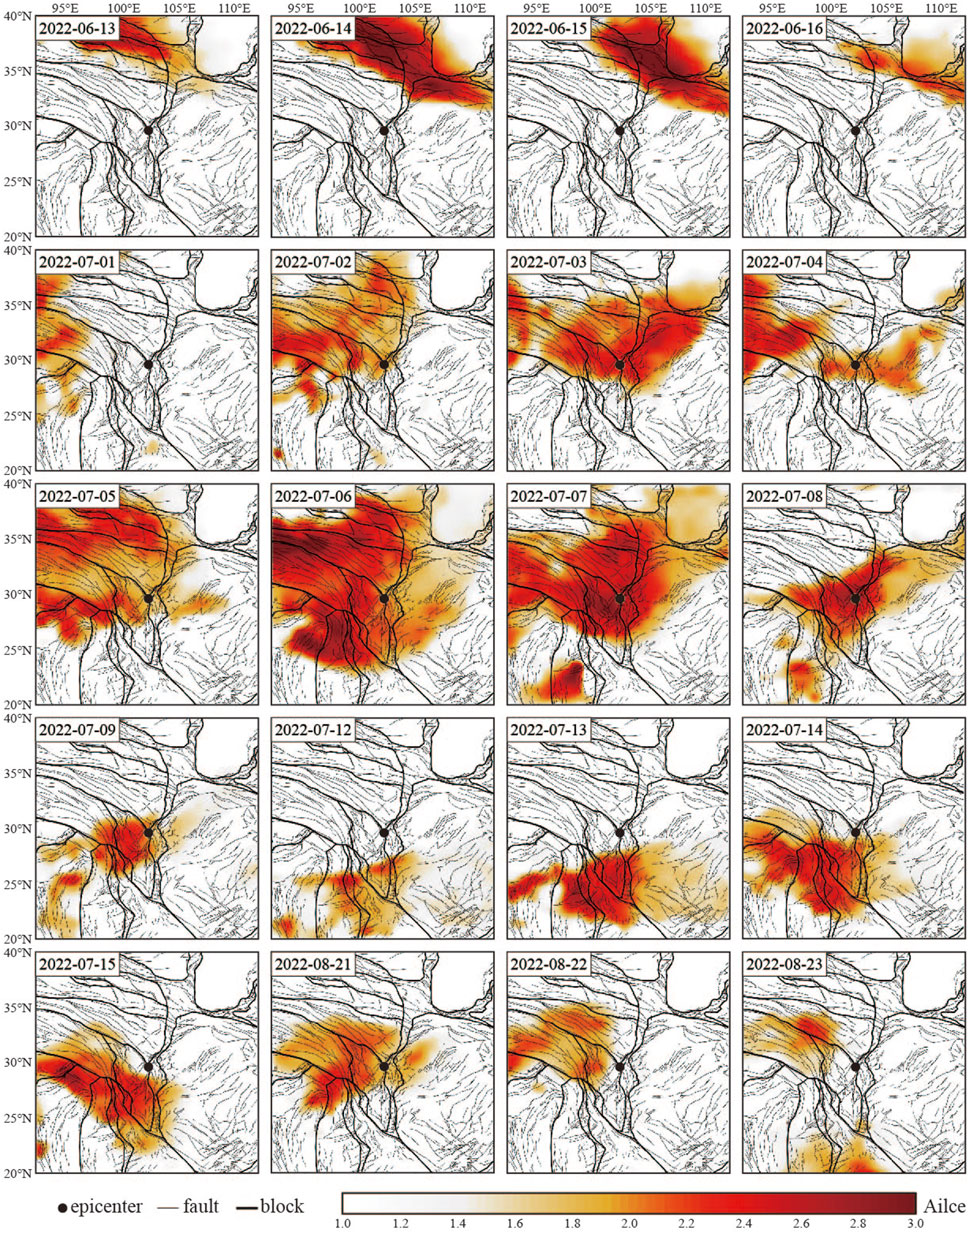
FIGURE 7. Daily-scale thermal infrared anomaly of the Luding earthquake.
Thermal infrared anomaly images (Figure 2) recorded the spatial and temporal migration characteristics of thermal infrared anomalies in the Qinghai-Tibetan Plateau region before these earthquakes. There was a certain pattern in the evolution of these thermal anomalies, most of which occurred in the western part of the Qinghai-Tibetan Plateau and then gradually spread to the east; these anomalies showed an emergence-enhancement-contraction-disappearance pattern during the evolution. These changes could be related to geodynamic processes on the Qinghai-Tibetan Plateau. The lithospheric mantle convection removal phenomenon of the Qinghai-Tibetan Plateau and the compression of the Indian plate and the Eurasian plate caused the uplift of the northeastern margin of the Qinghai-Tibet Plateau, and the lateral tectonic stress accompanying the uplift led to the expansion of the Qinghai-Tibet Plateau to the north and east. The lithospheric material inside the Qinghai-Tibet Plateau flowed to the east, while a tensional shear environment was generated inside the plateau. These geodynamic processes were accompanied by the occurrence of earthquakes, resulting in normal fault earthquakes inside the plateau and thrust fault earthquakes, which occurred around the plateau at low altitudes (Molnar et al., 1993; Zhang et al., 2022). Therefore, the occurrence of a series of earthquakes, including the Biru and Madoi earthquakes, may correspond with their geodynamic background. At the same time, the disappearance of the extensive post-earthquake spatiotemporal thermal anomalies may be attributable to the complete release of stress accumulation during seismic events, which also signals that this phase of anomaly development may have ended.
Zhang et al. (2005) found that more than 80% of strong earthquakes at a magnitude of seven or higher in mainland China occurred on active block boundaries, and zonal differences and zonal activation were evident, which could be well explained by their hypothesis that strong earthquakes in mainland China are controlled by active blocks and tectonics. In this section, the largest earthquake (Madoi MS7.4) can be taken as an example to discuss the correlation between thermal infrared anomalies in the epicenter block and the earthquake. With the help of monthly scale thermal infrared anomaly migration results in Figure 2, focusing on the 10°×10° range of the epicenter, the blocks covered by radiation enhancement monthly departure images in the high-frequency period before the earthquake were counted, as shown in Table 2. From Table 2, we can see that the blocks with more occurrences of radiometric enhancement before the Madoi earthquake were the Bayanhar block and the Qiangtang block. The monthly departure anomaly images of several periods counted in the table were calculated and averaged to obtain the departure superimposed images. In this way, increased temperature anomalies that occurred in a fixed area for a long time could be highlighted while weakening the rising temperature that occurred randomly, facilitating an analysis of the relationship between tectonic blocks frequently increasing in temperature and earthquakes. The departure and superimposed image (Figure 8) showed that, before the Madoi earthquake, a recurrent temperature increase area appeared in the eastern part of the Bayanhar block and the Qiangtang block. In general, temperature rise anomalies were clearly controlled by block tectonics, and the Madoi earthquake occurred within blocks with frequent temperature rises, leading us to speculate that these blocks were closely related to the occurrence of earthquakes.
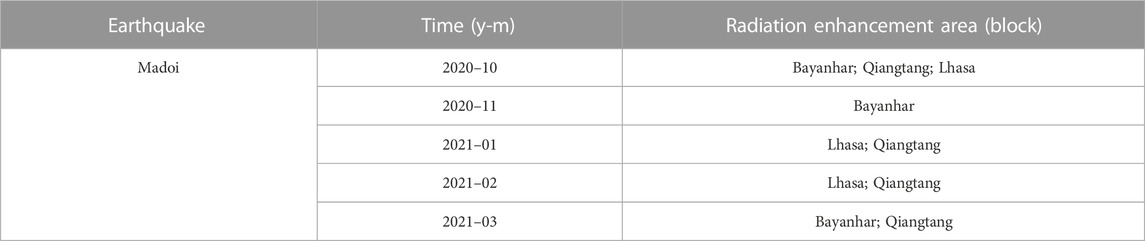
TABLE 2. Statistics of the areas where large radiation enhancement occurred before the earthquake.

FIGURE 8. Madoi earthquake departure superimposed image.
In Section 4.2, we explore the thermal anomaly characteristics of the block near the epicenter before the Madoi earthquake. Based on this, we continue to use this earthquake as an example in this section to further explore the correlation between the thermal anomaly near the seismogenic fault and the earthquake through a significance test method proposed by Zhang et al. (2021a). A spatial extent of 3°×3° (33°–36°N, 97°–100°E) centered on the epicenter, with a total of nine pixels, was selected as the area of focus, and the ALICE values for these nine pixels from January 2016 to December 2021 were based on the RST method. First, we set up a threshold rule and temporal persistence rule that was used to extract thermal anomalies in the significance test experiments: we set ALICE >2 as the threshold. The temporal persistence rule—unlike some thermal anomalies caused by short-term and instantaneous changes in the weather—means that the thermal anomalies of earthquakes can be extended in time so that seismic thermal anomalies can appear for at least two consecutive days (Zhang and Meng, 2019; Zhang et al., 2021a).
In this way, we extracted 17 thermal anomalies, which were A1, A2.A17, as shown in Figure 9. We then looked for earthquakes that might be associated with these thermal anomalies. The “SERIES OF EARTHQUAKE CASES IN CHINA” is an important scientific material when studying Chinese earthquakes and exploring earthquake predictions (Chen et al., 2002a; Chen et al., 2002b; Chen et al., 2002c; Jiang et al., 2014; Jiang et al., 2018). In the compilation of the series, the statistics of fixed-point anomaly data are as follows: MS ≥ 7.0 earthquake, within 500 km; 6 ≤ MS < 7.0 earthquake, within 300 km; 5.0 ≤ MS < 6 earthquakes, within 200 km. In addition, Zhang and Meng. (2019) conducted an experiment on the statistical analysis of the correlation between earthquakes and thermal infrared anomalies, and the results showed that higher magnitude earthquakes were more likely to correspond to thermal infrared anomalies and found no significant correlation between earthquakes below a magnitude of 5 and the thermal anomalies extracted by the RST algorithm in some regions. Based on these empirical conclusions, we selected earthquakes with magnitudes ≥5 that occurred within 300 km of the epicenter between January 2016 and December 2021 for testing. There were four such earthquakes, as shown in Table 3 and Eqs 1–4 in Figure 9.
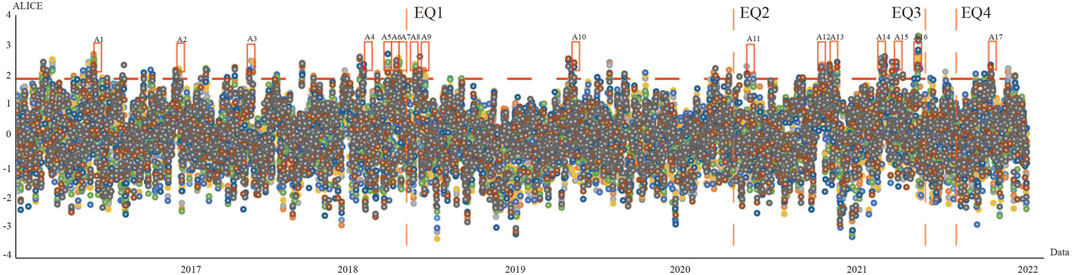
FIGURE 9. Long-term variation in temperature around the epicenter area (33°-36°N, 97°-100°E). Different colored dots in the figure represent different pixels.
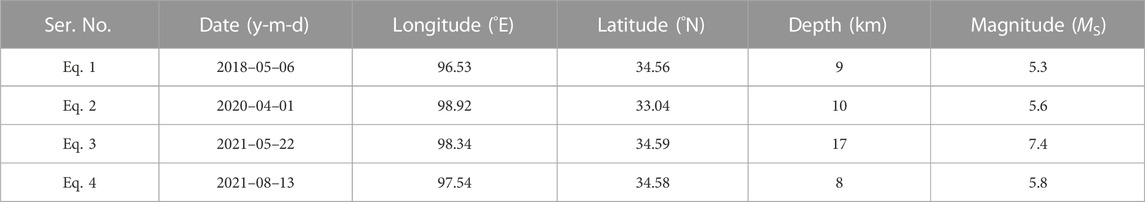
TABLE 3. Earthquakes occurring within 32°–37°N, 95°-100°E with magnitude ≥5 from January 2016 to December 2021; Eq. 3 is the Madoi earthquake.
In this study, the performance of thermal anomalies was used as precursors when compared with random guessing. Random guessing meant that there was no relation between the earthquakes and thermal anomalies and that they both occurred at any time with equal probability. To determine the correspondence between earthquakes and thermal anomalies, we needed to set a time window in which to judge the correlation of these anomalies with earthquakes. Some scholars concluded that the thermal anomalies associated with earthquakes usually appeared 90 days before and 15 days after the earthquake (Lu et al., 2016; Zhang and Meng, 2019; Eleftheriou et al., 2021); therefore, we set the time window to 105 days. For example, anomaly A was judged to be associated with Eq. 1 if it occurred 90 days before Eq. 1 and 15 days after Eq. 1. In return, using this temporal window and the earthquake catalog, we could determine a group of days; as such, if these thermal anomalies occurred (even randomly) on these days, they would correspond to earthquakes. For earthquake i occurring at ti, if alarms occurred at times {ti − 90, . . . ti − 1, ti, ti + 1… ti + 15}, they would correspond to earthquake i, and these alarms were regarded as true positives. Similarly, we could obtain N groups of days for all the N earthquakes, where Φ was the union of these N groups of days. We could then obtain the prior probability Q for the anomaly as follows:
The number of true positives for alarms follows a binomial distribution:
where m is the number of hit events or the number of true positives, and NA is the total number of alarms. Finally, we could obtain the P (m ≤ H ≤ NA) as follows:
Our null hypothesis is that thermal anomalies were not related to earthquakes. If P (m ≤ H ≤ NA) < α, where α was the significance level, and if α << 1, we rejected the null hypothesis, and thermal anomalies were related to earthquakes. In this study, we set α = 0.05 and finally obtained a p-value of 0.0085 < 0.05, from which we rejected the null hypothesis. Similarly, we also conducted such experiments on thermal anomalies at the seismogenic faults before several other seismic events, and the results were as follows: the p-value of the Biru earthquake was 0.4848, which accepted the null hypothesis; the p-value of the Delhi earthquake was 0.1769, which accepted the null hypothesis; since the epicenter locations of Lushan and Luding were adjacent, their results were the same, with p-values of 0.0415, which rejected the null hypothesis.
Before giving our conclusions, note that Zhang et al. (2021b) mentioned how readers could choose geometric distances or other parameters to determine the correspondence between earthquakes and infrared anomalies. The optimal parameters are spatially variable in different geological, meteorological, and environmental backgrounds. Therefore, we tentatively concluded that the thermal anomalies around the epicenters of the Madoi earthquake, the Luding earthquake, and the Lushan earthquake extracted by RST were related to the earthquakes. As for the pre-earthquake thermal anomalies of the Biru and Delingha earthquakes, follow-up studies with long-time series are still needed. Zhang et al. (2021b) proposed a “heating core filter,” which could help us distinguish thermal infrared anomalies caused by earthquakes or weather changes. At the same time, the “heating core filter” can effectively eliminate the influence of non-seismic thermal anomalies and significantly improve the signal-to-noise ratio of seismic thermal anomalies.
When exploring the mechanism of thermal infrared anomalies, it is essential to explain the causes of thermal anomalies that arise from fault activity and seismogenic processes. There are four main views on the interpretation of pre-earthquake thermal anomalies: 1) The rock stress-strain heating theory (Deng et al., 1997; Ma et al., 2007; Chen et al., 2009). Rock stress experiments demonstrate that the temperature inside the rock increases significantly with increasing stress. Most rock specimens develop high-temperature strips before fracture; these, along which fracture, eventually occur; 2) The earth outgassing heating theory (Qiang et al., 1997; Wang et al., 2021). The increase in ground stress before the earthquake causes surface ruptures, and gases such as CO2 and CH4 that escape along these ruptures absorb solar and ground radiation before increasing in temperature and exotherm. 3) The electromagnetic field effect heating theory (Freund, 2007a; Freund, 2007b; Freund et al., 2009). Crustal activity activates the charge in the rock in its steady state, and the electrical conductivity of the rock is affected by changing the physical or chemical properties of the rock, resulting in thermal infrared radiation. Another study found that the spatial and temporal relationships between the large electrostatic anomalies monitored before the earthquake and increasing temperature anomalies corresponded well; therefore, it was believed that the polarization effect of atmospheric electrostatic anomalies on the atmosphere before the earthquake was an important factor that resulted in the atmosphere heating up significantly under solar radiation (Hao, 1988). 4) Radon decay latent heat release heating theory (Pulinets et al., 2006; Pulinets and Dunajecka, 2007). The radon released by the active faults ionizes the air to produce a large number of ions, and the condensation of these ions with H2O is accompanied by the release of latent heat and an increase in atmospheric temperature. Liperovsky et al. (2011) proposed the lithosphere-atmosphere-ionosphere (LAI) multi-layer coupling effect to explain the mechanism of a pre-earthquake thermal anomaly generation by taking the release of latent heat from air ionization caused by radon decay and the change in the near-surface atmospheric electric field as the main physical process.
After demonstrating the correlation between the pre-earthquake thermal anomaly and the Madoi earthquake, in this section, we continue to investigate the mechanism and generation of the pre-earthquake thermal infrared anomaly in the study area using the Madoi earthquake as an example (Table 4). Yang et al. (2022) used MODIS BT data to analyze BT anomalies in the Bayanhar block time series from 2004 to 2021. They found that, during this period, most seismic events, including the Madoi earthquake, were preceded by a systematic increase in BT. Integrating the tectonic evolution of the Tibetan Plateau, they suggested that lithospheric extrusion and its stress accumulation may be the main reason for the appearance of BT anomalies. Satellite electron density data recorded ionospheric disturbances in the pregnant seismic region before and after the Madoi earthquake. Anomalous disturbances in the ionosphere started to appear about 40 days before the earthquake, and the morphology of electron density changed very drastically about 20 days before the earthquake, and the anomaly disappeared after the earthquake (Du and Zhang, 2022). Using the Zuoshu seismic station 132 km away from the epicenter, Su et al. (2022) observed abnormal changes in underground fluids under the station before the Madoi earthquake. The anomalous dynamic water level in Zuoshu showed a sudden drop change on February 25, with a maximum drop of 0.27 m. The variation in the water level could reflect the modulation effect of active faults on rock stress. In addition to this, they noted that the
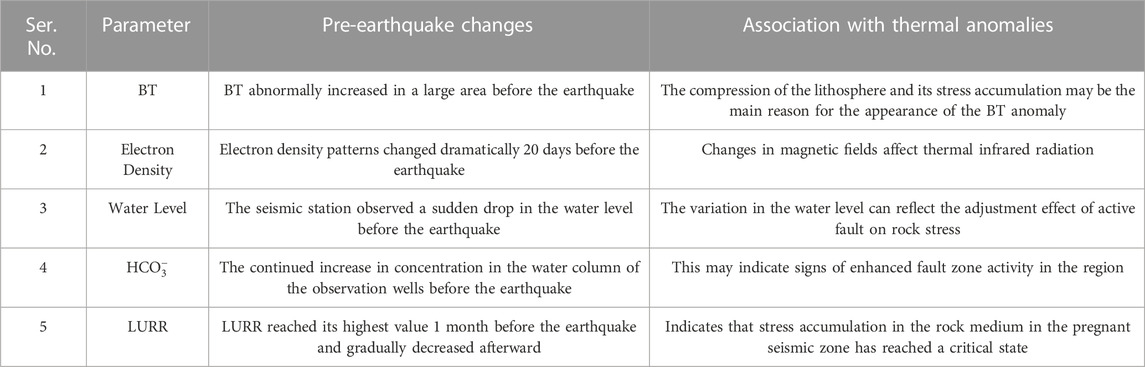
TABLE 4. Summary of the effects of different parameters on pre-earthquake thermal anomalies.
Combining the above findings, we believe that stress changes were not the only cause of seismic thermal infrared anomalies in the study area; another possible explanation was the combined effect of multiple other mechanisms (greenhouse gas outgassing, electromagnetic field anomalies, etc.). However, we must also emphasize that different analytical models may obtain different results for the same influence parameter. Taking the study on the effect of CH4 on thermal anomalies of the Wenchuan earthquake as an example, Meng and Zhang (2021) extracted changes in CH4 concentration using 8-day CH4 concentration data. They found that the thermal infrared anomalies and the CH4 anomalies appeared at different times; thermal infrared anomalies appeared before the earthquake, and CH4 anomalies appeared after the earthquake; from this, they determined a causal relationship between the CH4 anomalies and thermal anomalies with the help of the Granger Causality Test. They finally concluded that the CH4 anomalies were not the leading cause of the thermal anomaly. Other studies have found that CH4 anomalies occurred before the earthquake: Cui et al. (2019) used AIRS inversion data to examine the spatiotemporal variation in CH4 in the middle to upper troposphere of the Wenchuan earthquake and explored the causal mechanism of CH4 anomalies. They detected a large CH4 anomaly zone at the epicenter 8 days before the earthquake and showed a trend of enhancement, weakening and strengthening over time. Cui et al. (2016) research showed that CH4 anomalies first appeared one and a half months before the earthquake. On April 10 (1 month before the earthquake), the anomalies appeared in the Longmenshan fault zone and its southern region. On April 25, the anomalies were apparent and lasted until the end of May. The anomalies finally disappeared at the end of June. They believed that the occurrence of the Wenchuan earthquake promoted the release of underground gases.
In this study, based on monthly MODIS surface temperature data and daily NOAA satellite long-wave radiation data, we summarized a progressive tracking method for thermal infrared anomalies from medium-term to short-term using the departure algorithm and RST algorithm to obtain the spatial and temporal distribution characteristics of thermal infrared anomalies of blocks and faults in the seismogenic zone before strong earthquakes. The results show that tectonic activity was closely related to the occurrence of earthquakes and the occurrence of thermal infrared anomalies. On a monthly scale, thermal anomalies were observed in all earthquake cases before the earthquakes. Most of the thermal anomalies were generated in the western part of the Qinghai-Tibetan Plateau, this range gradually expanded during the eastward movement, and the length of time was generally about three to 6 months, during which the thermal anomalies showed an emergence–augmentation–contraction or repeated enhancement–contraction pattern. A departure superimposed image analysis of the pre-earthquake multi-period anomalies showed that the recurrent temperature increase block corresponded well with the occurrence of earthquakes. The results of the monthly-scale anomalies indicate that the pre-seismic temperature increase anomaly region corresponds well with the block spatial location and the geodynamic background of the seismogenic region. On a daily scale, the thermal anomalies generally appeared from one to 3 months before the earthquake, mostly in the form of clusters and strips. The closer the moment of seismogenesis, the clearer the thermal anomaly strips formed by a gradual contraction that was in basic agreement with the fault trend. At the same time, we speculated that the frequent occurrence of thermal anomalies within 3 months before the earthquake could be related to the accumulation of regional stress and the increase in surface cracks before the earthquake, which led to the overflow of underground greenhouse gases and an increase in the bottom atmospheric temperature. After the occurrence of anomalies, we need to pay more attention to the locked fault zone and fault around the relevant geological body, which may be a dominant seismic location in the future. The mechanisms for triggering these events are not yet known, but our preliminary results could help us better understand the physical mechanisms of thermal anomalies in seismotectonic activity.
Publicly available datasets were analyzed in this study. This data can be found here: http://www.cdc. noaa.gov.
JiZ conceived the research with the help of KS; JiZ and JuZ wrote the paper; JiZ performed the experiments and analysed the results; CD provided technical support. All authors contributed to the article and approved the submitted version.
This work was supported by State Key Laboratory of Earthquake Dynamics (Project No. LED2019B03), National Natural Science Foundation of China (Project No. U2039202), and the National Key Research and Development Program of China (Project No. 2019YFC1509202).
The authors thank to the National Aeronautics and Space Administration for providing the MODIS data and the National Oceanic and Atmospheric Administration for providing the OLR data.
The authors declare that the research was conducted in the absence of any commercial or financial relationships that could be construed as a potential conflict of interest.
All claims expressed in this article are solely those of the authors and do not necessarily represent those of their affiliated organizations, or those of the publisher, the editors and the reviewers. Any product that may be evaluated in this article, or claim that may be made by its manufacturer, is not guaranteed or endorsed by the publisher.
Chen, M. H., Deng, Z. H., and Jia, Q. H. (2003). The relationship between the satellite infrared anomalies before earthquake and the seismogenic fault: A case study on the 2001 Kunlun earthquake. Seismol. Geol. 25 (1), 100–108. doi:10.3969/j.issn.0253-4967.2003.01.010
Chen, Q. F., Zheng, D. L., and Che, S. (2002a). Earthquake cases in China (1992-1994). Beijing: Seismological Press.
Chen, Q. F., Zheng, D. L., and Gao, R. S. (2002b). Earthquake cases in China (1997-1999). Beijing: Seismological Press.
Chen, Q. F., Zheng, D. L., Liu, G. P., and Li, M. (2002c). Earthquake cases in China (1995-1996). Beijing: Seismological Press.
Chen, S. Y., Liu, L. Q., Liu, P. X., Ma, J., Chen, G. Q., et al. (2009). Theoretical and experimental study on relationship between strees-strain and temperature variation. Sci. China(Series D). 39 (10), 1446–1455. doi:10.1007/s11430-009-0183-z
Chen, S. Y., Liu, P. X., Liu, L. Q., Ma, J., and Chen, G. Q. (2006). Wavelet analysis of thermal infrared radiation of land surface and its implication in the study of current tectonic activities. Chin. J. Geophys. 49, 717–723. doi:10.1002/cjg2.886
Cui, Y. J., Du, J. Y., Li, Y., and Guo, Q. N. (2016). Detecting Anomalies of Atmospheric Total Column CH_4 and CO Related to the 2008 Wenchuan M_s 8.0 and 2013 Lushan M_s 7.0 Earthquakes. Petrology and Geochemistry 35 (5). doi:10.3969/j.issn.1007-2802.2016.05.023
Cui, J., Shen, X. H., Zhang, J. F., Ma, W. Y., and Chu, W. (2019). Analysis of spatiotemporal variations in middle-tropospheric to upper-tropospheric methane during the Wenchuan Ms = 8.0 earthquake by three indices. Natural Hazards and Earth System Sciences 19 (12), 2841–2854. doi:10.5194/nhess-19-2841-2019
Deng, M. D., Cui, C. Y., and Geng, N. G. (1993). Application of principle of remote sensing to earthquake prediction and the experimental results. Earthq. Res. China 9 (2), 163–169.
Deng, M. D., Geng, N. G., Cui, C. Y., Zhi, Y. Q., Fan, Z. F., and Ji, Q. Q. (1997). The study on the variation of thermal state of rocks caused by the variation of stress state of rocks. Earthq. Res. China 13 (2), 179–185.
Deng, Z. H., Wang, Y., Chen, M. H., Tang, F. T., and Chu, Q. Z. (2003). Satellite infrared anomaly of several strong earthquakes in China mainland. Seismol. Geol. 25 (2), 327–337. doi:10.3969/j.issn.0253-4967.2003.02.018
Di Bello, G., Filizzola, C., Lacava, T., Marchese, F., Pergola, N., Pietrapertosa, C., et al. (2004). Robust satellite techniques for volcanic and seismic hazards monitoring. Ann. Geophys. 47 (1), 49–64. doi:10.4401/ag-3258
Du, X., and Zhang, X. (2022). Ionospheric disturbances possibly associated with yangbi Ms6.4 and Maduo Ms7.4 earthquakes in China from China seismo electromagnetic satellite. Atmosphere 13 (3), 1. doi:10.3390/atmos13030438
Eleftheriou, A., Filizzola, C., Genzano, N., Lacava, T., Lisi, M., Paciello, R., et al. (2021). Long-term RST analysis of anomalous TIR sequences in relation with earthquakes occurred in Greece in the period. Pure Appl. Geophys. 178 (4), 1529. doi:10.1007/s00024-021-02692-4
Freund, F. T., Kulahci, I. G., Cyr, G., Ling, J., Winnick, M., Tregloan-Reed, J., et al. (2009). Air ionization at rock surfaces and pre-earthquake signals. J. Atmos. Solar-Terrestrial Phys. 71 (17-18), 1824–1834. doi:10.1016/j.jastp.2009.07.013
Freund, F. T. (2007a). Pre-earthquake signals - Part I: Deviatoric stresses turn rocks into a source of electric currents. Nat. Hazards Earth Syst. Sci. 7 (5), 535–541. doi:10.5194/nhess-7-535-2007
Freund, F. T. (2007b). Pre-earthquake signals - Part II: Flow of battery currents in the crust. Nat. Hazards Earth Syst. Sci. 7 (5), 543–548. doi:10.5194/nhess-7-543-2007
Genzano, N., Aliano, C., Filizzola, C., Pergola, N., and Tramutoli, V. (2007). A robust satellite technique for monitoring seismically active areas: The case of Bhuj-Gujarat earthquake. Tectonophysics 431 (1-4), 197–210. doi:10.1016/j.tecto.2006.04.024
Hao, J. G. (1988). Near Earth surface anomalies of the atmospheric electric field and earthquakes. Acta Seisemologica Sin. 10 (2), 206–212. doi:10.3969/j.issn.1003-3246.2000.04.007
Jiang, H. K., Fu, H., Yang, M. L., and Ma, H. S. (2014). Earthquake cases in China (2003-2006). Beijing: Seismological Press.
Jiang, H. K., Yang, M. L., and Fu, H. (2018). Earthquake cases in China (2011-2012). Beijing: Seismological Press.
Li, P. E., Liao, L., Feng, J. Z., and Liu, P. (2019). Numerical simulation of relationship between stress evolution and strong earthquakes around the Bayan Har block since 1900. Chin. J. Geophys. 62 (11), 4170–4188. doi:10.6038/cjg2019M0660
Li, Y. L., and Li, Q. L. (2022). Preliminary study of the seismogenic structure of the Biru, Tibet M6.1 earthquake. J. Seismol. Res. 45 (1), 54–65. doi:10.20015/i.cnki.ISSN1000-0666.2022.0007
Liperovsky, V. A., Meister, C. V., Mikhailin, V. V., Bogdanov, V. V., Umarkhodgaev, P. M., and Liperovskaya, E. V. (2011). Electric field and infrared radiation in the troposphere before earthquakes. Nat. Hazards And Earth Syst. Sci. 11 (12), 3125–3133. doi:10.5194/nhess-11-3125-2011
Lu, Q., Zhang, T. B., Cui, J., and Yang, X. (2021). Anomalies of therma-infrared radiation based on remote sensing in the sichuan-yunnan block before medium to strong earthquakes: A case study of ninglang M5.7 and ludian M6.5 earthquakes. China Earthq. Eng. Jouenal 43 (3), 565–574. doi:10.3969/j.issn.1000-0844.2021.03.565
Lu, X., Meng, Q. Y., Gu, X. F., Zhang, X. D., Xie, T., and Geng, F. (2016). Thermal infrared anomalies associated with multi-year earthquakes in the Tibet region based on China's FY-2E satellite data. Adv. Space Res. 58 (6), 989–1001. doi:10.1016/j.asr.2016.05.038
Ma, J., Liu, L. Q., Liu, P. X., and Ma, S. L. (2007). Thermal precursory pattern of fault unstable sliding: An experimental study of en echelon faults. Chin. J. Geophys. 50 (4), 995–1004. doi:10.3321/j.issn:0001-5733.2007.04.021
Ma, J., and Shan, X. J. (2000). An attempt to study fault activity using remote sensing technology: A case of the Mani earthquake. Seismol. Geol. 22 (3), 210–215. doi:10.3969/j.issn.0253-4967.2000.03.002
Meng, Q. Y., and Zhang, Y. (2021). Discovery of spatial-temporal causal interactions between thermal and methane anomalies associated with the wenchuan earthquake. Eur. Phys. Journal-Special Top. 230 (1), 247–261. doi:10.1140/epjst/e2020-000252-9
Molnar, P., England, P., and Martinod, J. (1993). Mantle dynamics, uplift of the Tibetan plateau, and the Indian monsoon. Rev. Geophys. 31 (4), 357–396. doi:10.1029/93RG02030
Pulinets, S. A., and Dunajecka, M. A. (2007). Specific variations of air temperature and relative humidity around the time of michoacan earthquake M8 1 sept 19, 1985 as a possible indicator of interaction between tectonic plates, Tectonophysics 431 (1-4), 221–230. doi:10.1016/j.tecto.2006.05.044
Pulinets, S. A., Ouzounov, D., Ciraolo, L., Singh, R., Cervone, G., Leyva, A., et al. (2006). Thermal, atmospheric and ionospheric anomalies around the time of the Colima M7.8 earthquake of 21 January 2003. Ann. Geophys. 24 (3), 835–849. doi:10.5194/angeo-24-835-2006
Qiang, Z. J., Kong, L. C., Guo, M. H., Wang, G. P., and Zheng, L. Z. (1997). An experimental study on temperature increasing mechanism of satellitic thermo-infrared. Acta Seimological Sin. 10 (2), 247–252. doi:10.1007/s11589-997-0093-0
Qiang, Z. J., Lin, C. G., Li, L. Z., Xu, M., and Ge, F. S. (1988). Satellite thermal infrared brightness temperature anomaly image: Short-term and impending earthquake precursors. Sci. China(Ser D). 42 (3), 313–324.
Shao, Z. G., Zhang, G. M., Li, Z. X., and Xia, H. (2008). Research on the process and tendency of seismicity along the active tectonic boundaries in Chinese mainland. Earthquake 28 (3), 33–42.
Shi, C., Huang, C., Nie, F., and Li, S. (2020). Using satellite thermal infrared images in land surface temperature inversion for identifying hidden faults: A case of lishan piedmont fracture. Geotechnical Investigation Surv. 48 (3), 45–50.
Su, W. G., Liu, L., and Sun, X. H. (2022). Characteristics of underground fluid anomalies in Zuoshu station before Maduo Ms7.4 and menyuan Ms6.9 earthquakes. China Earthq. Eng. J. 44 (03), 700–706+712. doi:10.20000/j.1000-0844.20220215005
Tramutoli, V., Aliano, C., Corrado, R., Filizzola, C., Genzano, N., Lisi, M., et al. (2013). On the possible origin of thermal infrared radiation (TIR) anomalies in earthquake-prone areas observed using robust satellite techniques (RST). Chem. Geol. 339, 157–168. doi:10.1016/j.chemgeo.2012.10.042
Wang, S. Y., Tian, H., Ma, K. X., Yu, C., Ma, W. Y., and Yu, H. Z. (2021). Correlation between short-term and imminent anomalies of LURR and OLR berfore the Maduo Ms7.4 earthquake in Qinghai Province, 2021. China Earthq. Eng. J. 43 (4), 847–852. doi:10.3969/i.issn.1000-0844.2021.04.847
Xiong, S. Z., Liu, G., Lin, M., Wang, D. J., Xiong, W., Zhao, L. J., et al. (2022). Coseismic Static and Kinematic Deformation Field of 2021 Maduo Mw7.4 Earthquake Derived by GPS. Journal of Geodesy and Geodynamics 42 (10), 1041–1046. doi:10.14075/j.jgg.2022.10.010
Xu, X. D., and Xu, X. M. (2001). The basic characteristics and mechanism of infrared anomaly before earthquake. Northwest. Seismol. J. 23 (3), 310–312. doi:10.3969/j.issn.1000-0844.2001.03.021
Xu, X. W., Wen, X. Z., Zheng, R. Z., Ma, W. T., and Song, F. M. (2003). Pattern of latest tectonic motion and its dynamics for active blocks in Sichuan-Yunnan region, China. Sci. China Ser. D:Earth Sci. 46 (2), 210–226. doi:10.3321/j.issn:1006-9267.2003.z1.017
Yang, F., Song, C. Z., Ren, S. L., and Ji, M. H. (2022). The mesozoic tectonic transition from compression to extension in the South China block: Insight from structural deformation of the lushan massif, SE China. Minerals 12 (12), 1531. doi:10.3390/MIN12121531
Yang, X., Zhang, T. B., Lu, Q., Long, F., Liang, M. J., Wu, W. W., et al. (2022). Variation of thermal infrared brightness temperature anomalies in the Madoi earthquake and associated earthquakes in the Qinghai-Tibetan plateau (China). Front. Earth Sci. 10, 1. doi:10.3389/feart.2022.823540
Zhang, G., Ma, H., Wang, H., and Wang, X. (2005). Boundaries between active-tectonic blocks and strong earthquakes in the China mainland. Chin. J. Geophysics-Chinese Ed. 48 (3), 602–610. doi:10.5194/npg-1-209-1994
Zhang, G. M., and Zhang, P. Z. (2000). Academic progress on "the mechanism and forecast for continental strong earthquake" in the first two years. China Basic Sci. 10, 4–10.
Zhang, H., Gao, Y., Shi, y. T., Liu, X. F., and Wang, Y. X. (2012). Tectonic stress analysis based on the crustal seismic anisotropy in the northeastern margin of Tibetan plateau. Chin. J. Geophysics-Chinese Ed. 55 (1), 95–104. doi:10.6038/j.issn.0001-5733.2012.01.009
Zhang, P. Z., Wang, W. T., Gan, W. J., Zhang, Z. Q., Zhang, H. P., Zheng, D. W., et al. (2022). Present-day deformation and geodynamic processes of the Tibetan Plateau. Acta Geol. Sin. 96 (10), 3297–3313. doi:10.19762/j.cnki.dizhixuebao.2022295
Zhang, T. B., Lu, Q., Liu, F., and Xin, H. (2013). Analysis on infrared anomalous increase of MODIS satellite before wenchuan M8.0 and Yushu M7.1 earthquakes. Joural Seismoloaical Res. 36 (4), 496–501. doi:10.3969/j.issn.1000-0666.2013.04.014
Zhang, X. (2014). Study on the activity of faults by using of infrared remote sensing data. Lanzhou: Lanzhou Institute of Seismology, CEA. [D].
Zhang, Y., and Meng, Q. Y. (2019). A statistical analysis of TIR anomalies extracted by RSTs in relation to an earthquake in the Sichuan area using MODIS LST data. Nat. Hazards Earth Syst. Sci. 19 (3), 535–549. doi:10.5194/nhess-19-535-2019
Zhang, Y., Meng, Q. Y., Ouillon, G., Sornette, D., Ma, W. Y., Zhang, L. L., et al. (2021b). Spatially variable model for extracting TIR anomalies before earthquakes: Application to Chinese Mainland. Remote Sens. Environ. 267, 1. doi:10.1016/j.rse.2021.112720
Zhang, Y., Meng, Q. Y., Wang, Z., Lu, X., and Hu, D. (2021a). Temperature variations in multiple air layers before the mw 6.2 2014 ludian earthquake, yunnan, China. Remote Sens. 13 (5), 1. doi:10.3390/rs13050884
Keywords: thermal infrared remote sensing, tectogenesis, earthquake, thermal anomaly, spatio-temporal correlation analysis
Citation: Zhang J, Sun K, Du C and Zhu J (2023) Characterization of thermal infrared medium- and short-term anomaly information from block to fault in mainland China. Front. Earth Sci. 11:1199320. doi: 10.3389/feart.2023.1199320
Received: 03 April 2023; Accepted: 16 May 2023;
Published: 09 June 2023.
Edited by:
Huaizhong Yu, China Earthquake Networks Center, ChinaCopyright © 2023 Zhang, Sun, Du and Zhu. This is an open-access article distributed under the terms of the Creative Commons Attribution License (CC BY). The use, distribution or reproduction in other forums is permitted, provided the original author(s) and the copyright owner(s) are credited and that the original publication in this journal is cited, in accordance with accepted academic practice. No use, distribution or reproduction is permitted which does not comply with these terms.
*Correspondence: Ke Sun, c3Vua2VAY2VhLWllcy5hYy5jbg==
†Present addresses: Chen Du, Piesat Information Technology Co., Ltd., Beijing, China
Disclaimer: All claims expressed in this article are solely those of the authors and do not necessarily represent those of their affiliated organizations, or those of the publisher, the editors and the reviewers. Any product that may be evaluated in this article or claim that may be made by its manufacturer is not guaranteed or endorsed by the publisher.
Research integrity at Frontiers
Learn more about the work of our research integrity team to safeguard the quality of each article we publish.