 Gang Zhang
 Syed Taseer Abbas Jaffar2
 Jahanzaib Israr
 Turab Jafri
- 1Institue of Solid Mechanics, School of Physics and Electronic and Electrical Engineering, Ningxia University, Yinchuan, Ningxia, China
- 2University of Management and Technology, Lahore, Lahore, Punjab, Pakistan
- 3University of Engineering and Technology, Lahore, Pakistan
- 4National Institute of Civil Engineering, National University of Sciences and Technology, Islamabad, Pakistan
- 5Department of Civil and Environmental Engineering, Pusan National University, Busan, Republic of Korea
Crack development in a changing environment is the controlling factor for the stability and strength of expansive soils. Expansive soils exhibit large volumetric changes with changes in their moisture conditions that may occasionally lead to reduced bearing capacity and foundation failures. This study purports to model crack initiation and its spatial progression in relation to the moisture content and drying period, respectively. Volumetric soil shrinkage is determined using high-definition digital camera imaging and Vernier scale methods, while the soil settlement under vertical shrinkage deformation could be captured through a tensile stress model for soils. It was revealed that a small change in suction could trigger crack initiation, which would propagate further under different environmental conditions. Furthermore, it was observed that the crack volume increased rapidly at specific moisture content and could penetrate as deep as 1 m after nearly 1.5 months that is fully consistent with the current model predictions. A comparison between the performance of the model proposed in this study and that of two existing models shows that the former predicts the vertical shrinkage strain values in closer agreement with those observed experimentally and is less conservative than those predicted by both models. Nevertheless, the findings from this study could be used to quantify the detrimental behavior of expansive soil present in pavement subgrades and shallow foundations for lightweight structures.
1 Introduction
Expansive (or swelling) soils are problematic clays, which are abundantly found in different parts of the world. For construction purposes, such soils often warrant pre-requisite treatments for the sustainable transfer of applied loads. Every year, untreated expansive soils cause huge damage to properties and loss of invaluable lives. For instance, more than 60% of the 250,000 new housing units built annually on expansive soils in the US suffer from minor damages, while 10% bear significant damages (Holtz and Hart, 1978; Tang et al., 2010). Swell–shrink behavior is a well-understood problem, whereby expansive soils exhibit large volume changes (swell–shrink) due to changes in their moisture content that lead to crack initiation, and this has been reported as a temperature-dependent phenomenon (Israr et al., 2014; Mumtaz et al., 2020). These cracks produce favorable conditions for rain infiltration that leads to an increase in crack depth and eventually a marked decrease in the soil’s shear strength. Moisture evaporation results in anisotropic shrinkage of expansive soils, while the same expansive soils are prone to shrink by significant volumes in extreme drying conditions. Studies reported that vertical shrinkage causes more detrimental effects to structures constructed on expansive soils (Kodikara et al., 2014). Therefore, it is vital to understand the swell–shrink characteristics of expansive soil to predict the initiation and progression of a crack. Lately, Zhang et al. (2023) adopted the thermo-time domain reflectometry technique (thermo-TDR) to accurately capture the soil’s shrinkage and swelling dynamics, and hydro-thermal regimes during the wet–dry cycles. Similarly, Gheris and Hamrouni (2020) used a processed vegetable fiber to control the swelling cracking potential of expansive soils in Algeria.
Thus far, several laboratory and field studies have investigated the cracking induced by the swell and shrink phenomena in expansive soils (Costa et al., 2013; Adem and Vanapalli, 2015). For example, the mercury displacement method could accurately delineate the shrunken volume by excluding the volume of cracks (Chaney et al., 2000; Tripathy et al., 2002); however, the ASTM standard for the mercury displacement method (ASTM, 2008) has been withdrawn due to potential health risks to users caused by mercury. Nevertheless, the Vernier scale could also be used to determine the volumetric deformation of the soil (Alazigha et al., 2016). Lately, image analysis techniques have been significantly utilized as a reliable method to investigate both the swell–shrink behavior and cracking patterns of expansive soils (Al-Jeznawi et al., 2020). For instance, an investigation of water retention using image analysis techniques was carried out in a study with micro-pressure plate apparatus (Alazigha et al., 2018). Crack monitoring is also performed with the help of image analysis, which has significantly improved the assessment of the severity and morphology of cracks in expansive soils. A simple method to investigate the shrunken volume excluding the volume of cracks had been proposed by Bicalho et al. (2007), whereby the digital camera image (DCI) technique could be successfully implemented for capturing the photographs of cracked soil through binary image processing using ‘ImageJ’ software.
Given that a crack initiates when the tensile stresses exceed the tensile strength of a soil, the variations in magnitudes of both tensile stress and tensile strength may be considered a controlling factor in crack initiation in expansive soils. The change in tensile stress is a very complex phenomenon that may comprise several factors such as drying time, characteristics of the soil, moisture content, and suction. For instance, the tensile stresses in soil increase upon both a decrease in the moisture content and a change in temperature (Sih, 1968), whereas the relationship between tensile stress and suction is also important. Chen and Bulut (2017) proposed a practical model to predict the tensile stress from suction and concluded that the distribution of tensile stress throughout the depth of the soil is controlled by the suction compression index, diffusion coefficient, and drying time in tandem. Although many efforts have been made to address the cracking pattern in expansive soils, this complex phenomenon has not been fully understood yet. The prediction of crack depth in relation to temperature or the drying period has not been addressed in most of the existing studies so far. Therefore, this study aims at presenting an in-depth laboratory analysis of a highly expansive soil collected from the field where shrinkage cracks were prominent at the surface. In this work, an attempt is made to predict crack initiation and its spatial progression in relation to the moisture content and drying period. For brevity, crack initiation is presented using the soil water characteristic curve (SWCC), while crack depth and drying time are also predicted based on the local climatic conditions that may be useful for prompt and preliminary geotechnical site investigation.
2 Materials and methodology
2.1 Basic soil properties
Figure 1 shows the particle size distribution curve of the expansive soil tested in this study. The soil has been characterized as a highly swelling soil using a twofold rationale: (1) a rigorous experimental campaign comprising multiple odometer tests to quantify swelling in terms of both swell potential and pressure and (2) historical perspective, whereby published studies reported that the Nandipur clays exhibit very high swelling potential (Akbar and Farooq, 2002; Israr et al., 2014; Mumtaz et al., 2020). First, the soil has been classified based on visual and physical observations at the sampling site in Nandipur, Pakistan. The natural expansive soil was collected from 1 m depth with the help of a shovel, preserved in sealed plastic bags, and conveyed to the laboratory. Table 1 presents the physical properties of the soil specimen used in this study. It is to be noted that the aforementioned rationale could sufficiently establish that the currently tested soil is a high-swelling clay and that the observed cracking has been the result of shrinkage due to the loss of moisture. The double punch test method was performed to determine the tensile strength of the soil (Fang and Chen, 1971). The tensile strength (σt) value was obtained from Eq. 1.
where tensile strength (σt) is in psi, P is the applied load in lbs, a is the radius of the punch in inches, b is the radius of the specimen in inches, and H is the height of the specimen in inches. The values of a, b, and H are 12.7 mm (0.5 in), 101.6 mm (4 in), and 116.84 mm (4.6 in), respectively.
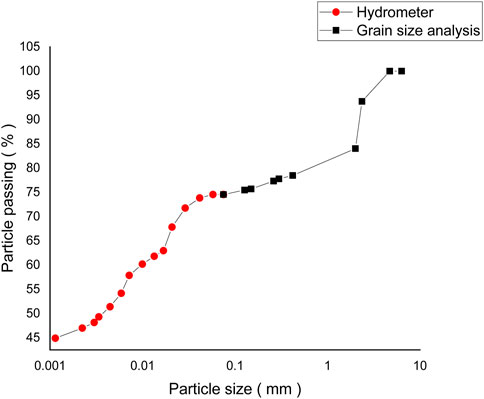
FIGURE 1. Particle size distribution of a soil sample.
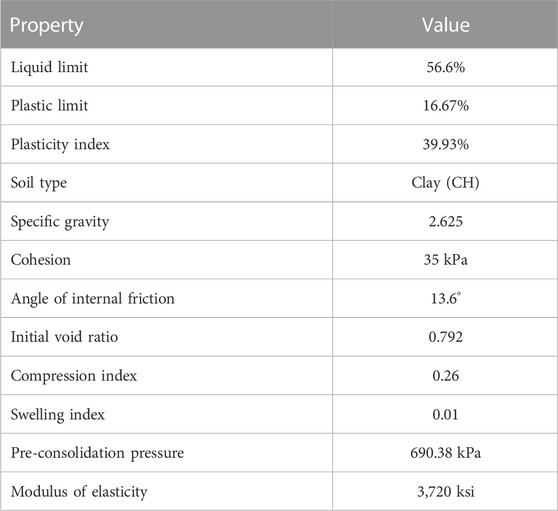
TABLE 1. Soil properties determined by ASTM standards.
The relationship between tensile strength at different moisture contents is plotted in Figure 2. The maximum value of tensile strength was noted as 65.086 kPa at 24% moisture content with 55 blows using the modified compaction test procedure, and the same value was carried out for further analysis.
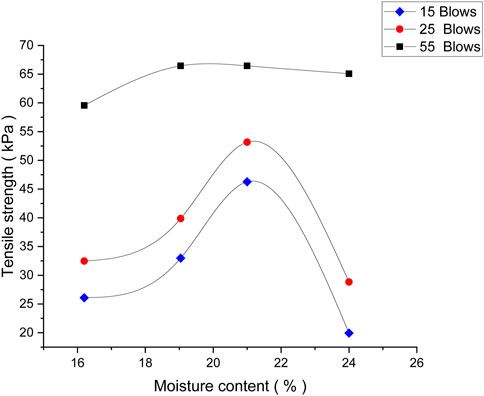
FIGURE 2. Correlation between the tensile strength (KPa) and moisture content (%).
2.2 Volumetric and vertical shrinkage of soil
A shrinkage strain test was performed on the soil samples, and an image-based technique called the DCI method was used to study the shrinkage behavior of both the soil and the cracking area. The samples were compacted at different moisture contents of 16%, 19%, 21%, and 24%. For brevity, the compacted samples were placed between two filter papers and porous stones for wet and dry cycles in the modified odometer assembly. In this study, a wet–dry cycle consisted of submerging the soil sample in water until saturation and air-drying to the desired moisture content, after which no further shrinkage occurred (Ekrem Kalkan, 2011). The saturation was ensured when the Skempton’s B-value exceeded 0.95 (i.e., the ratio between monitored pore water pressure and the applied total stress). The cyclic swell–shrink test was performed on the prepared sample under 12 kPa pressure. The sample was allowed to fully swell in the wet cycle, and a constant temperature of 45
The 20-MP digital cameras were used in this test to capture the images of the soil specimens. The binary image processing technique using ‘ImageJ’ software is suitable for various sample shapes. The selected total surface area of the soil specimen, including the crack area (AT), and then, the whole area of the image (A1) were measured using the ‘Analyze–Measure’ command; the white area (A2) which includes the area of cracks and the surrounding white area other than the soil surface, were also measured. The next step involved the separation of the crack area from the total surface area. The area of the shrunken soil As and the area of the cracks Ac were measured by Eqs. 2, 3, respectively.
The area of cracks obtained at the end of the second wet–dry cycle was 0.511, 0.845, 2.533, 2.748, and 5.787 cm2 at 16.2, 19.04, 21, 24%, and 28.2% moisture contents, respectively. From the areas As and Ac, the volume of the crack and soil was measured through Eqs. 4, 5, and then compared with the Vernier caliper readings.
where Act is the crack area obtained from top surface images and Acb is the crack area obtained from bottom surface images.
The volume of cracks obtained at the end of the second wet–dry cycle was 1.2264, 1.859, 5.5726, 6.3204, and 12.7314 cm3 at 16.2, 19.04, 21, 24%, and 28.2% moisture, respectively.
Table 2 shows the original images of the soil sample prepared for the DCI method before and after cracking. The relationship between the vertical shrinkage strain and moisture content was determined by shrink testing using Briaud’s method (Briaud et al., 2003). A total of four samples were prepared in a cylinder of 70 x 100 mm size at 16.2, 19.04, 21, and 24% moisture contents. Volumetric deformation was computed with the help of Eq. 6. Notably, Figure 3 shows the volumetric deformation of soil at different moisture contents.
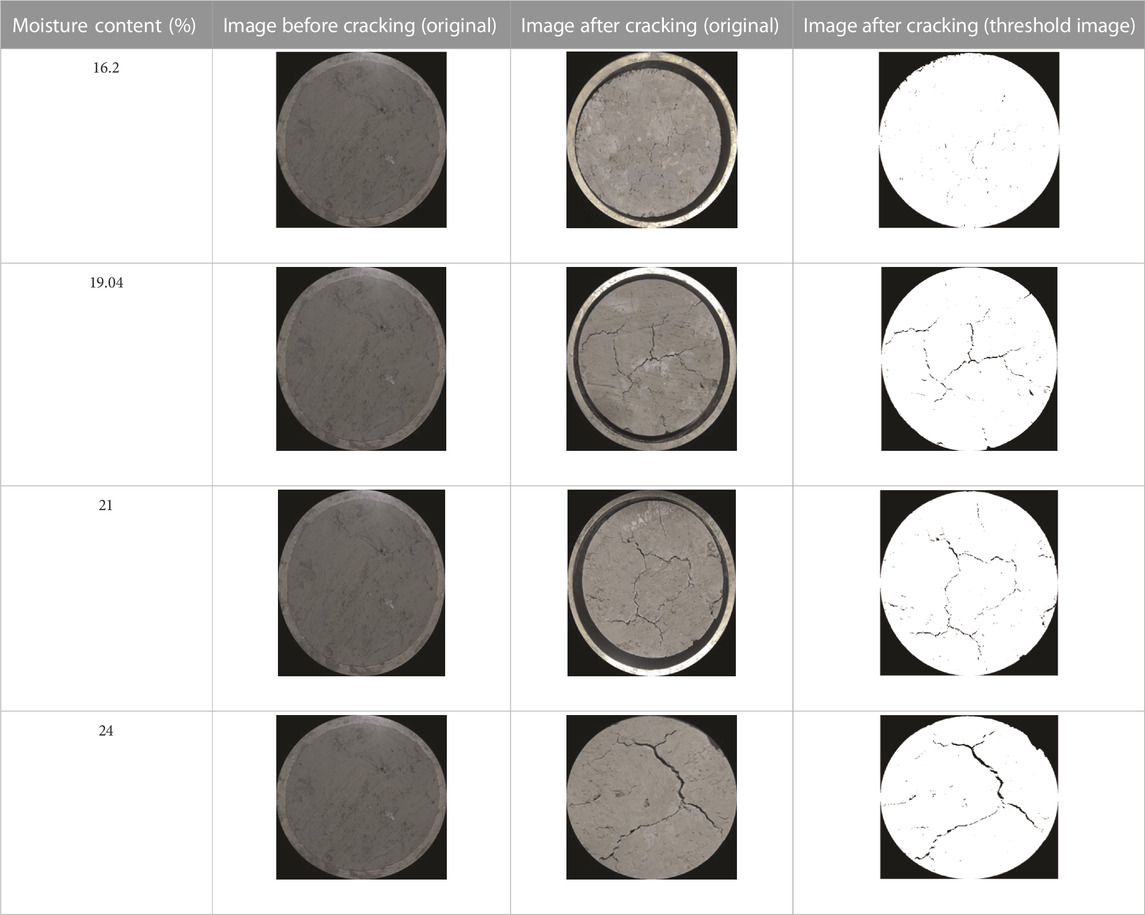
TABLE 2. Cracking pattern at different moisture contents.
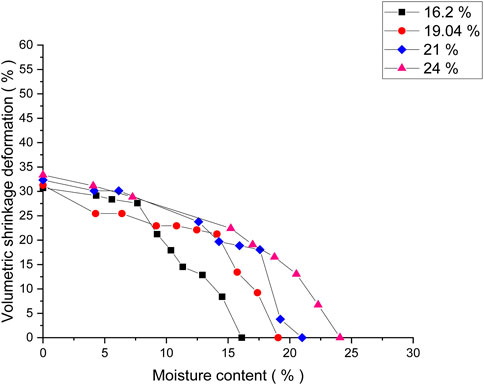
FIGURE 3. Variation of volumetric shrinkage deformation at different moisture contents.
where ΔV is the change in volume and V is the actual volume of the soil sample.
The values obtained from the shrink test were computed to obtain the swell–shrink modulus (Ew) and shrinkage ratio parameters by substituting the values in Eqs. 7, 8.
where Δw=wo-w represents change in the water content, wo is initial water content corresponding to zero volume change, and w is the water content corresponding to relative volume change (
These parameters were then used to obtain the vertical shrinkage strain at different moisture contents by substituting the value in Eq. 9 as shown as follows:
where H is the height of the sample and Δw is the change in moisture content as a function of depth. It is noteworthy that surface soil was analyzed in this study and no depth was involved, so only the initial moisture content was considered. Another shrinkage test was performed on the same soil samples using Dhowian’s method (1990).
where
In this study, the volume compressibility factor
2.3 Measurement of suction
The filter paper test was performed to determine the matric suction values of the soil samples (Bicalho et al., 2007). The suction values were determined using Eqs. 12, 13 in tandem (Marinho and Oliveira, 2006):
where ωf is the filter paper water content break point, w is the moisture content in %, and
where ω is the gravimetric moisture content and
Figure 4 shows both the theoretical and experimental SWCC, which agree closely with the previously developed mathematical models (Javid et al., 2020).
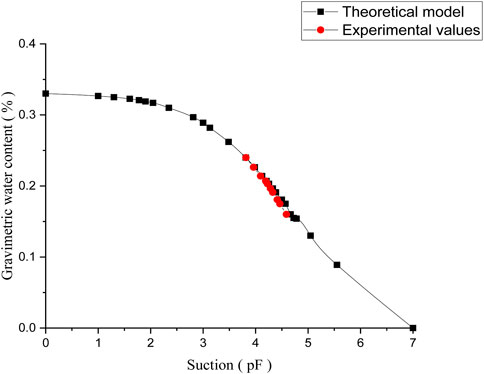
FIGURE 4. Combined soil water characteristic curve.
2.4 Climatic parameters
The value of the diffusivity coefficient is obtained through the following Eq. 16:
The
Eq. 17 was used to obtain the suction compression index (Mckeen, 1992):
where
where R is the annual rainfall and ETo is the annual potential evapotranspiration. The data on average annual rainfall were obtained from the National Center for Environmental Information (NCEI), as shown in Figure 5.
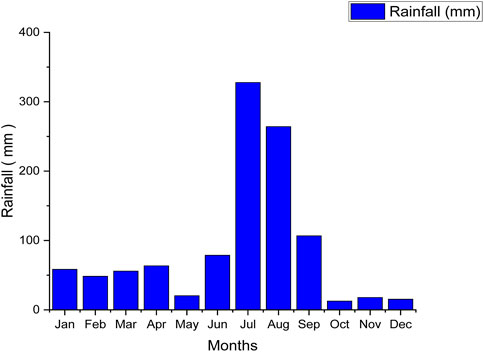
FIGURE 5. Annual rainfall at the Nandipur site.
where
Tmax and Tmin are monthly maximum and minimum temperatures shown in Figure 6.
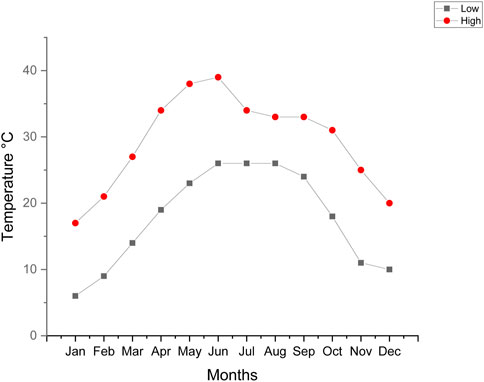
FIGURE 6. Variation of monthly temperature at the Nandipur site.
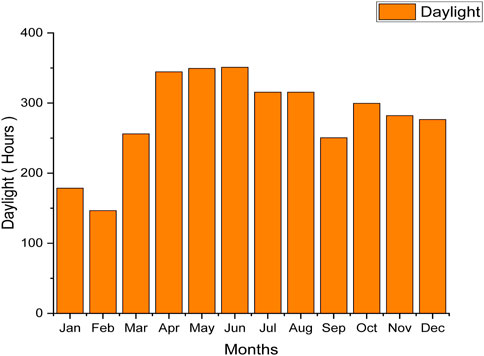
FIGURE 7. Daylight pattern at the Nandipur site.
3 Results and discussion
This study validated the tensile strength by considering soil suction at various moisture contents. The tensile stress equation was proposed by Chen and Bulut (2017) for unsaturated expansive soils using Eq. 21. The equation is based on assuming the soil to be an elastic material before cracking. As there is no overburden pressure in this case, therefore, the first term of Eq. 21 is neglected in the analysis:
where σx is tensile stress,
The tensile stresses are calculated on the soil surface; hence, diffusivity coefficient and drying time are neglected. The value obtained for compression index from Eq. 22 is 0.01386. Poisson’s ratio used in Eq. 21 for the soil is 0.3. The initial suction value used in Eq. 21 is 3 pF. Tensile stresses are obtained at different final suctions. The tensile strength at each suction value is then compared with the tensile stress. The point on the curve where tensile stress coincides with the tensile strength is the point of crack initiation.
In Figure 8, the relationship between tensile strength and suction has been established at the various moisture contents. The crack appears on the soil at a low suction value because the tensile stresses increase more rapidly than the tensile strength of the soil. There is a point where the tensile stress curve intersects the tensile strength curve. At 3.8 pF, the tensile strength is 65 kPa and the tensile stress is 59.8 kPa. As the tensile stresses increase, it intersects the tensile strength curve at 3.892 pF. Therefore, it can be stated that 1%–2% change in water content would be sufficient to initiate crack development in the expansive soils, making them more vulnerable for construction. These results can be utilized to investigate the relationship between local climate conditions and performance of the foundation or pavement constructed on highly expansive soils. The difference between the cracking point suction and the initial suction value is 0.892 pF that is also supported by previous research.
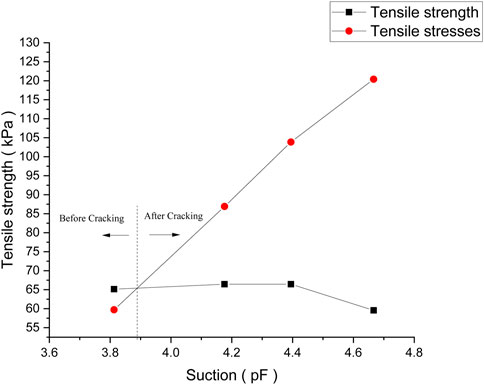
FIGURE 8. Relationship between tensile strength and suction.
3.1 Analysis of volumetric and vertical shrinkage
Figure 9 shows the variation of volumetric deformation obtained from the Vernier scale and DCI methods at 16.2, 19.04, 21, 24%, and 28% moisture content under two wet–dry cycles. At the end of the second wet–dry cycle, values of volumetric shrinkage deformation by the Vernier scale method were −21.868, −23.14, −23.66, −24.54, and-25.132 %at 16.2, 19, 21, 24, and 28% moisture content, respectively. However, the DCI method showed the volumetric shrinkage deformation to be −26.84, −28.661, −29.46, −29.846, and −32.92 %at 16.2, 19, 21, 24, and 28% moisture content, respectively. The circular gap along the crack increased during the successive drying cycles; therefore, it becomes evident that the Vernier scale method underestimates the volumetric deformation. Shrunken soil shows predominant cracks appearing at the circumference of the soil sample. These cracks extend from the top surface to the bottom surface of the soil sample, which supports the assessment of the cracking pattern using the DCI method. The vertical shrinkage strain could be computed through Eq. 23:
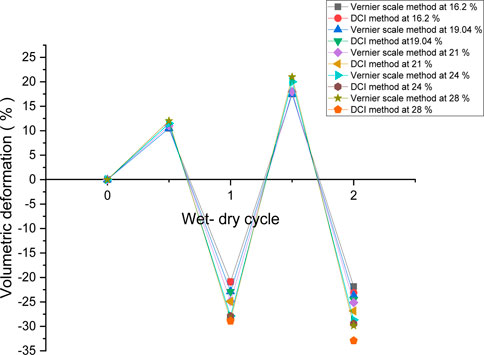
FIGURE 9. Variation of volumetric deformation with wet–dry cycles at different moisture contents.
Figure 10 shows the comparison of predictions from the current model, Briaud’s method, and Dhowian’s method against the experimentally observed vertical shrinkage strain values. The results showed that the currently proposed suction-based method of this study slightly overestimates the vertical shrinkage, whereas the moisture-based methods of both Briaud and Dhowian overestimate the vertical shrinkage deformation. This difference can be attributed to the different indices utilized in both types of methods. For instance, the moisture-based methods consider the change in volumetric water content at the middle of the soil layer, whereas the current suction-based methods more realistically consider the suction change at the surface of the soil. In essence, the comparison shows that the values predicted by the current model are in good agreement with those observed during the experiments. Similarly, the two existing models overestimate the vertical shrinkage strain values more than the current model, which yields conservative values that agree closely with the observed values, thus validating the current model.
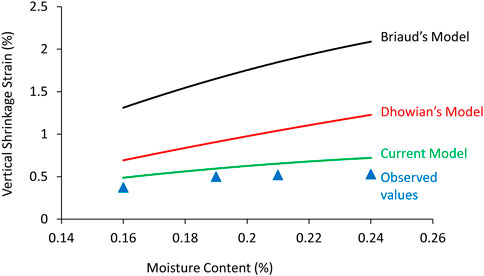
FIGURE 10. Comparison of the actual vertical shrinkage strain with Briaud’s and Dhowian’s method.
3.2 Prediction of crack depth
The model developed based on Eq. 21 predicts the tensile stress profile in relation to soil depth. However, none of the published studies have reported the relation between crack depth and drying period. This study uses climate data such as average drying temperature and annual rainfall for the study area. The time was estimated based on the hit and trial method for 1, 2, and 3 months. For instance, time t was kept constant, and the crack depth z was estimated against different values (0–85 kPa) of tensile stress σx during the period of a month.
Figure 11 shows that the crack will reach 0.7, 1.3, and 1.8 m depth after 1, 2, and 3 months, respectively. Moreover, the dotted line on the figure against a tensile stress of 65 kPa shows the actual depth of the crack for the soil specimen tested in the present study. It is to be noted that the crack remains within the dry cycle and achieves a depth of 1 m during the second month.
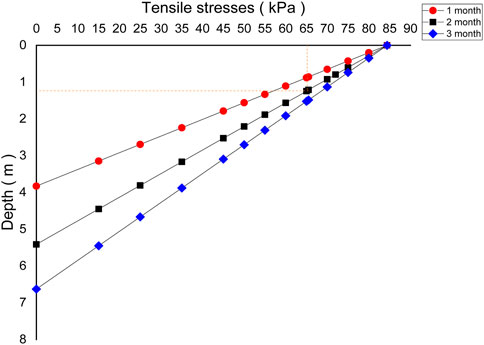
FIGURE 11. Relationship between tensile stresses and soil depth.
Figure 12 graphically depicts the correlation between tensile stress and crack depth using previous Eq. 21, which was used to estimate the drying time for the same soil against varying tensile stresses. For brevity, curves at three different crack depths, i.e., 0.8 m, 1 m, and 1.48 m, have been plotted, and the tensile stress magnitude corresponding to 1 m deep crack has been determined (i.e., 65 kPa). It can be observed that the crack will reach a depth of 1 m at 40th day of drying time. In essence, the results obtained from both Figures 11, 12 could have considerable direct implications for designing safer pavements and shallow foundations on expansive soils. Although laboratory experiments still remain the most reliable approach to ascertaining the mechanical response of expansive soils, the current propositions may be used with caution for prompt and preliminary assessments only.
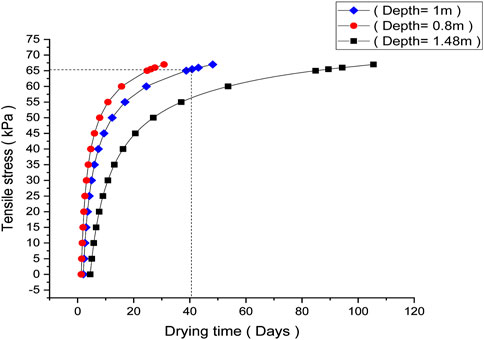
FIGURE 12. Relationship between tensile stress and drying time.
4 Scope and limitations to this study
In this study, a highly swelling soil has been experimentally examined to model the cracking pattern under controlled laboratory conditions. The current study presented a simple and handy process with sufficient accuracy to be adopted at the preliminary and feasibility stages of an engineering project with specific cautions. It is to be noted that the scale of current laboratory testing may not be comparable with that in the actual field, where conditions may be significantly different and uncontrollable. Needless to mention, many such experimental studies involving only one soil type have been carried out in the past (see, e.g., Haque et al., 2007; Israr et al., 2014; Mumtaz et al., 2020). Through analysis, this study proposes an observational model based on local in situ conditions, such as soil suction. Nevertheless, comparisons have been made between vertical shrinkage strain values computed from the current model with actual values observed experimentally and those predicted by two well-accepted models. The comparison shows that the values predicted by the current model are in good agreement with those observed during the experiments. In essence, the presented concept is novel and provides a framework for future studies to develop a more rigorous and accurate model based on both the field’s and soil’s constitutive properties in tandem.
5 Conclusion
This study aimed at assessing and predicting the cracking pattern of highly expansive soil. A suction-based model to predict the cracking pattern is presented that has been verified through laboratory test results on highly swelling soil. Unlike the existing models, the proposed model captures the effects of climatic conditions and is based on real-time monitoring of moisture content and suction data. The current model’s performance has also been compared with that of two well-accepted existing models for predicting crack initiation and its depth under local climatic conditions. Based on the results and discussion, following general conclusions can be drawn.
• The cracking pattern evolved sequentially, whereby cracking was initiated by dividing the soil surface into cells, and subsequent shrinkage contributed to subdividing these cells in the form of secondary and tertiary openings. Moreover, it was observed that the distribution of tensile stress depends on both boundary conditions and stiffness of the soil, which control the initiation and progression of cracking in tandem.
• At 23% moisture content, suction exceeds the tensile strength of the soil, which results in crack initiation. Wet–dry cycles of rainfall and sunlight control the spatial progression of cracks both in vertical and horizontal directions that may lead to additional distress to the structure founded on such soils.
• As compared to the Vernier scale method, the DCI method provides more accurate information about volume shrinkage and deformation of soil after crack initiation. Under different stress and climate conditions, cracks reach a depth of 1 m after 1.5 month approximately, and this prediction can make a healthy contribution to the geotechnical site investigation of expansive soils.
• A comparison between the performances of the suction-based model proposed in this study and that of two well-accepted existing moisture-based models shows that the former predicts the vertical shrinkage strain values in closer agreement with those observed experimentally and is less conservative than those predicted by both models.
Data availability statement
The original contributions presented in the study are included in the article/Supplementary material; further inquiries can be directed to the corresponding author.
Author contributions
SJ and GZ jointly supervised this research conducted by MA at the UMT Lahore. MA and SJ performed laboratory testing. The initial draft was prepared by JI and SJ, while the analysis was conducted by JI and GZ. SJ developed the mathematical model, which was cross-verified and calibrated by JI and GZ. SJ provided his invaluable input in finalizing this manuscript. All authors contributed to the article and approved the submitted version.
Funding
The paper is supported by the Projects of the Natural Science Foundation of Ningxia Province (Granted No: 2023AAC02024).
Acknowledgments
Authors gratefully acknowledge the technical staff at the University of Management and Technology (UMT) for providing the on-campus laboratory facilities to conduct the test series. Both financial and technical assistance received from Ningxia University China through the Helan Mountain Research Program are heartily acknowledged.
Conflict of interest
The authors declare that the research was conducted in the absence of any commercial or financial relationships that could be construed as a potential conflict of interest.
Publisher’s note
All claims expressed in this article are solely those of the authors and do not necessarily represent those of their affiliated organizations, or those of the publisher, the editors, and the reviewers. Any product that may be evaluated in this article, or claim that may be made by its manufacturer, is not guaranteed or endorsed by the publisher.
References
Adem, H. H., and Vanapalli, S. K. (2015). Review of methods for predicting in situ volume change movement of expansive soil over time. J. Rock Mech. Geotechnical Eng. 7, 73–86. doi:10.1016/j.jrmge.2014.11.002
Akbar, A., and Farooq, K. (2002). Expansive soils IN Pakistan-case histories. J. Eng. Appl. Sci. 21 (1), 119–129.
Al-Jeznawi, D., Sanchez, M., and Al-Taie, A. A. J. (2020). Using image analysis technique to study the effect of boundary and environment conditions on soil cracking mechanism. Geotechnical And Geol. Eng. 39 (1), 25–36. doi:10.1007/s10706-020-01376-5
Alazigha, D. P., Indraratna, B., Vinod, J. S., and Ezeajugh, L. E. (2016). The swelling behaviour of lignosulfonate-treated expansive soil. Proc. Institution Civ. Engineers-Ground Improv. 169 (3), 182–193. doi:10.1680/jgrim.15.00002
Alazigha, D. P., Indraratna, B., Vinod, J. S., and Heitor, A. (2018). Mechanisms of stabilization of expansive soil with lignosulfonate admixture. Transp. Geotech. 14, 81–92. doi:10.1016/j.trgeo.2017.11.001
American Society for Testing and Materials (2008). Standard test method for shrinkage factors of soils by wax method. West Conshohocken, Pa: ASTM.
Bicalho, K., Correia, A., and Ferreira, S. (2007). Filter paper method of soil suction measurement. XIII Panam. Available at: http://repositorium.sdum.uminho.pt/handle/1822/12305.
Blaney, H. F., and Criddle, W. D. (1950). Determining water requirements in irrigated areas from climatological and irrigation data. Tech. Bull. U. S. Soil Cons. Serv. (96).
Bratton, W. L. (1996). Slab-on-ground foundations constructed over expansive clay: Parameters to predict volume change potential Doctoral Thesis. United States: Texas Tech University.
Briaud, J.-L., Zhang, X., and Moon, S. (2003). Shrink test–water content method for shrink and swell predictions. J. Geotech. Geoenvironmental Eng. 129 (7), 590–600. doi:10.1061/(asce)1090-0241(2003)129:7(590)
Chaney, R. C., Demars, K. R., Rao, K. S. S., and Gangadhara, S. (2000). Swelling behavior of a desiccated clay. Geotechnical Test. J. 23, 193. doi:10.1520/gtj11043j
Chen, L., and Bulut, R. (2017). Development and application of A new tensile stress model for expansive soils. Geotechnical And Geol. Eng. 35 (3), 1067–1077. doi:10.1007/s10706-017-0163-6
Costa, S., Kodikara, J., and Shannon, B. (2013). Salient factors controlling desiccation cracking of clay in laboratory experiments. Géotechnique 63, 18–29. doi:10.1680/geot.9.p.105
Dhowian, A. W. (1990). Heave prediction techniques and design consideration on expansive soils. J. Of King Saud Univ. - Eng. Sci. 2 (2), 355–376. doi:10.1016/s1018-3639(18)30533-6
Ekrem Kalkan, E. (2011). Impact of wetting–drying cycles on swelling behavior of clayey soils modified by silica fume. Appl. Clay Sci. 52 (4), 345–352. doi:10.1016/j.clay.2011.03.014
Fang, H., and Chen, W. (1971). New method for determination of tensile strength of soils. Highw. Res. Rec. 34, 62–68.
Fredlund, D. G., and Xing, A. (1994). Equations for the soil-water characteristic curve. Can. Geotech. J. 31 (4), 521–532. doi:10.1139/t94-061
Gheris, A., and Hamrouni, A. (2020). Treatment of an expansive soil using vegetable (DISS) fibre. Innov. Infrastruct. Solutions 5, 30. doi:10.1007/s41062-020-0281-5
Haque, A., Kabir, E., and Bouazza, A. (2007). Cyclic filtration apparatus for testing subballast under rail track. J. Geotech. Geoenvironmental Eng. 133 (3), 338–341. doi:10.1061/(asce)1090-0241(2007)133:3(338)(2007)133:3(338)
Holtz, W. G., and Hart, S. S. (1978). Home construction on shrinking and swelling soils. Virginia, United States: National Science Foundation.
Israr, J., Farooq, K., and Mujtaba, S. (2014). Modelling of swelling parameters and associated characteristics based on index properties of expansive soils. Pak. J. Eng. Appl. Sci. 15 (2), 1–9.
Javid, K., Akram, M. A. N., Ranjha, M. M., and Pervaiz, S. (2020). GIS-based assessment of aridity over Punjab Province, Pakistan, by using climatic indices. Arab. J. Geosci. 13 (7), 289. doi:10.1007/s12517-020-5236-9
Kodikara, J., Rajeev, P., Chan, D., and Gallage, C. (2014). Soil moisture monitoring at the field scale using neutron probe. Can. Geotechnical J. 51 (3), 332–345. doi:10.1139/cgj-2012-0113
Marinho, F. A. M., and Oliveira, O. M. (2006). The filter paper method revisited. Geotech. Test. J. 29 (3), 250–258. doi:10.1520/gtj14125
Mckeen, R. G. (1992). A model for predicting expansive soil behavior. 7th Int. Conf. Expans. Soil., 1–6.
Mumtaz, J., Rashid, I., and Israr, J. (2020). Laboratory modelling of strength and deformation characteristics of a high swelling soil treated with industrial wastes. Arabian J. Geosciences 13, 762. doi:10.1007/s12517-020-05786-w
Sih, G. C. (1968). Some elastodynamic problems of cracks. Int. J. Of Fract. Mech. 4 (1), 51–68. doi:10.1007/bf00189147
Tang, C. S., Cui, Y. J., Tang, A. M., and Shi, B. (2010). Experiment evidence on the temperature dependence of desiccation cracking behavior of clayey soils. Eng. Geol. 114 (3-4), 261–266. doi:10.1016/j.enggeo.2010.05.003
Tripathy, S., Rao, K. S. S., and Fredlund, D. G. (2002). Water content - void ratio swell-shrink paths of compacted expansive soils. Can. Geotechnical J. 39, 938–959. doi:10.1139/t02-022
Keywords: expansive soil, tensile stress model, volumetric deformation, crack progression, pavement subgrade, lightweight structures
Citation: Zhang G, Jaffar STA, Israr J, Atta M and Jafri T (2023) Laboratory modeling of thermal and temporal cracking in swelling clays. Front. Earth Sci. 11:1192406. doi: 10.3389/feart.2023.1192406
Received: 23 March 2023; Accepted: 31 May 2023;
Published: 13 June 2023.
Edited by:
Karoly Nemeth, Institute of Earth Physics and Space Sciences, HungaryReviewed by:
Adam Hamrouni, Mohamed-Cherif Messaadia University, AlgeriaTien Dung Le, Université de Lorraine, France
Copyright © 2023 Zhang, Jaffar, Israr, Atta and Jafri. This is an open-access article distributed under the terms of the Creative Commons Attribution License (CC BY). The use, distribution or reproduction in other forums is permitted, provided the original author(s) and the copyright owner(s) are credited and that the original publication in this journal is cited, in accordance with accepted academic practice. No use, distribution or reproduction is permitted which does not comply with these terms.
*Correspondence: Jahanzaib Israr, amlzcmFyQHVldC5lZHUucGs=