 Shu Wang
 Tianyi Wang2
- 1School of Geophysics and Information Technology, China University of Geosciences, Beijing, China
- 2School of Geophysics, Hebei Geo University, Shijiazhuang, Hebei, China
To study the electrical characteristics of rocks and ores, two- and three-phase medium models with different mineral contents, attenuation coefficients, relaxation times, and ellipticities were established based on the generalized effective medium theory of induced polarization (GEMTIP) model and the Debye decomposition method. Furthermore, the corresponding program was written for numerical simulation, and the complex resistivity (CR) spectral characteristics and relaxation time distribution (RTD) characteristics were analyzed. At the same time, seven representative ore samples from different mining areas were selected, their structural compositions were observed, and their complex resistivity was measured to obtain the variation characteristics and Nyquist curves of ore phase spectra. The differential evolution (DE) algorithm was employed to write a curve parameter fitting program based on which parameter fitting was performed for the theoretical model and the measured curves of ore samples. The physical and electrical parameters of the curves were obtained, and the variation characteristics of each parameter were analyzed. The generalized effective medium theory of induced polarization model could be adopted to further study the induced polarization (IP) anomaly from the structural and electrical properties of rocks and ores, which has important guiding significance for energy resource exploration, deep prospecting beyond 500 m, and environmental investigation by electrical (magnetic) methods.
1 Introduction
The time-domain and frequency-domain induced polarization (IP) is a common exploration method in geophysics and plays an important role in mineral resources, petroleum energy, and other fields. As society has prospered, the use of this method has been gradually extended to exploring groundwater, geological disasters, and ecological environments. To clarify the mechanisms for this method and explain it more accurately, many scholars have conducted many experimental studies on the polarization effects of rocks and ores. Many geophysicists introduce the IP effects of rocks and ores into various circuit models according to the electrochemical characteristics of the rocks and ores, such as the Cole–Cole model, multi-Cole–Cole model, Dias model, Debye model, Davidson–Cole model, and Warburg model (Pelton et al., 1978; Dias, 2000). These models describe the charging rate, relaxation time, and attenuation coefficients of the polarization effects of rocks and ores. By employing these models, many scholars have conducted a succession of studies by theory construction, experimentation, testing, inversion, etc., with fruitful results (Zhang et al., 1984; Zhang et al., 1994; Liu, 1998; Tong et al., 2005; Xiao et al., 2006; Cheng et al., 2010; Liu, 2017; Lishan et al., 2014; Tian et al., 2019). To delve into the structural model of the polarization effects of rocks and ores, Zhdanov and his team deduced an expression for the generalized effective medium theory of the induced polarization (GEMTIP) model that characterizes the polarization effects of rocks and ores on the basis of said theory through numerous measurements on said rocks and ores (Zhdanov, 2008). The physical and mathematical expression better reflects the shape, size, percentage content, resistivity, relaxation time, attenuation coefficient, and other structural and physical parameters of mineral particles in the study of the complex resistivity (CR) of rocks and ores. Given the GEMTIP model, many scholars around the world have conducted ore sample testing and multiphase medium CR simulation calculations (Phillips, 2010; Burtman and Zhdanov, 2015; Liu et al., 2015; Revil et al., 2015; Zhang et al., 2019), model parameter characteristic studies (Zhdanov et al., 2013; Wu et al., 2017; Chang et al., 2018), parameter fitting and inversion studies (Fu, 2013; Zhdanov M. et al., 2018; Sharifi et al., 2019), and practical application studies (Zhang et al., 2016; Zhdanov M. S. et al., 2018; Alfouzan et al., 2020) with meaningful results. Therefore, the anomaly characteristics of the CR spectra of two-phase, three-phase, and multiphase media in rocks and ores, as well as anisotropic distribution characteristics, can be studied based on the GEMTIP model. This model provides an effective quantitative analysis method for studying the structural compositions of rocks and ores. Based on the GEMTIP model, studies were conducted on the CR anomalous characteristics of mineral particle content and other parameters and the CR spectral distribution patterns of different types of rocks and ores. Considering the correlation between the characteristic relaxation time of polarized media and information, such as mineral compositions and the porosity of rocks and ores, the Cole–Cole model was employed as a relaxation model for the decomposition method (Tarasov and Titov, 2007; Florsch et al., 2012) based on the Debye decomposition (DD) method (Nordsiek and Weller, 2008). Thus, the characteristic relaxation time of polarized media was obtained, with further studies conducted on the CR and relaxation time distribution (RTD) characteristics.
2 GEMTIP model and RTD characteristics
Based on GEMTIP theory and considering the electrochemical and electromagnetic properties of rocks and ores, Zhdanov proposed a GEMTIP model by constructing heterogeneous multiphase conductive media for effective media and rigorously deducing physical and mathematical processes (Zhdanov, 2008; Burtman and Zhdanov, 2015). The model considers the electromagnetic effect and IP effects of rocks and ores. The model can be used to study the CR characteristics and physical properties of rocks and ores from their structural compositions and model parameter information, respectively.
According to generalized effective medium theory, assuming that the matrix minerals of gold-containing pyrite (Figure 1A) were spherical particles of different radii (Figure 1B), the basic formula of the GEMTIP model (Zhdanov, 2008) (see Table 1 for the parameters in the formula) is
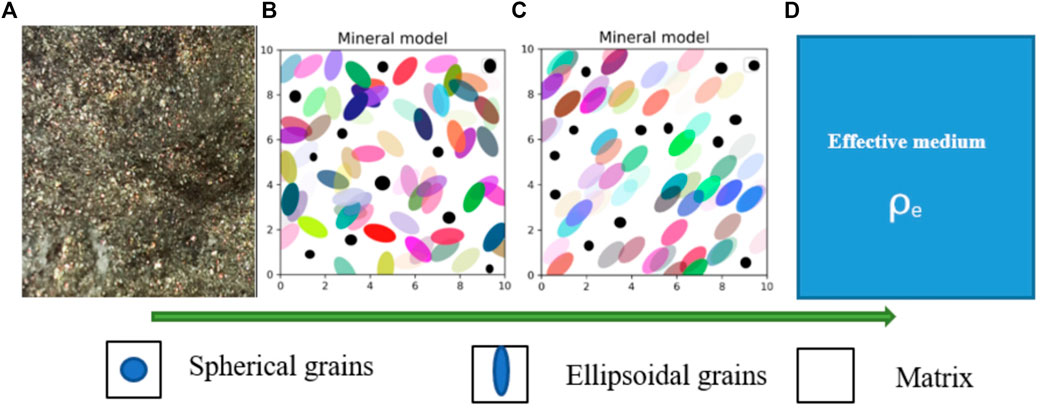
FIGURE 1. Schematic of the effective model of the complex resistivity of rocks and ores. (A) microscopic photos of gold-bearing pyrite; (B) schematic of isotropic multiphase mineral particles; (C) schematic of anisotropic multiphase mineral particles; (D) effective CR model.
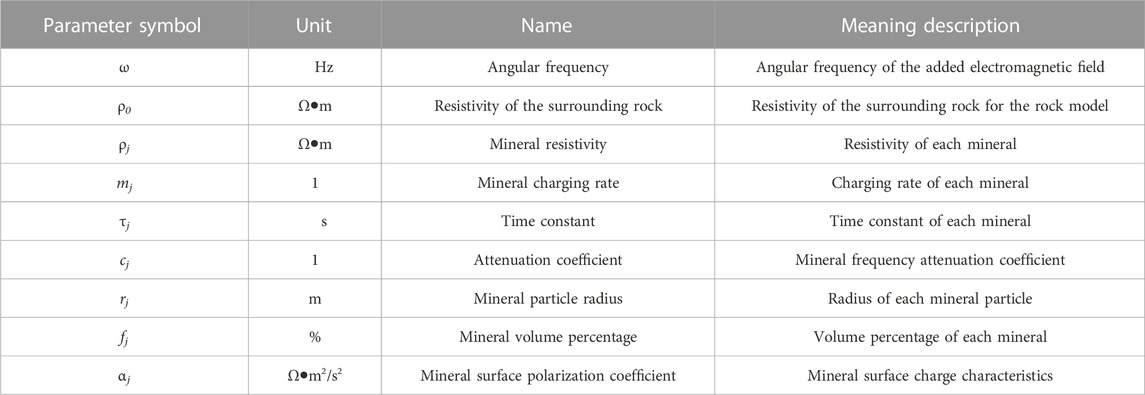
TABLE 1. Description of GEMTIP model parameters.
Considering the boundary effect of the polarized medium, Tong Xiaolong et al. modified the GEMTIP model expression (Xiaolong et al., 2020) to obtain:
When the polarized mineral particles in the rocks and ores are ellipsoids arranged in any direction or directionally (Figures 1B, C), the effective CR of the mineral (Figure 1D) is the average value of the CR in the x-, y- and z-directions. Therefore, the expression of the multiphase effective model for ellipsoid mineral filling (Zhdanov, 2008; Burtman and Zhdanov, 2015; Wu et al., 2017) is
where
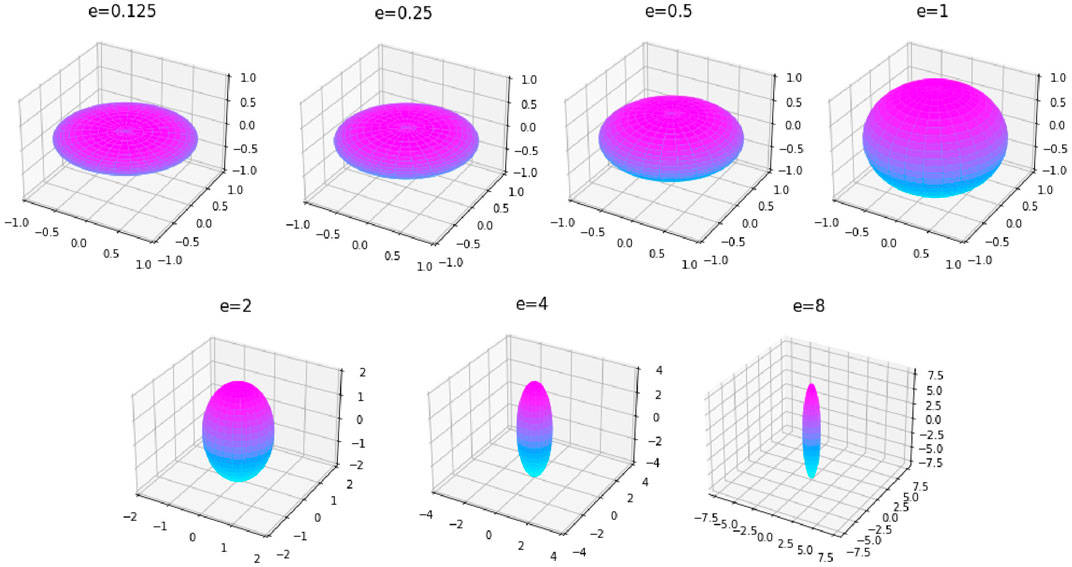
FIGURE 2. Shapes of different e-polarized ellipsoids (
When
Regarding the time-domain and frequency-domain spectral IP method, many scholars have discussed various CR models and analysis functions (Dias, 2000). These relational expressions are closely related to the relaxation time of the polarized medium, and the relaxation time reflects the parameters, such as the grain size and surface area of the polarized medium (Revil and Florsch, 2010). Therefore, studying RTD helps the further understanding of the physical properties of rock and ore structures. According to the inherent structural complexity of rock and ore samples and various low-frequency polarization mechanisms, the Debye decomposition method provides an effective theoretical basis for accurately describing the RTD of CR curves (Lesmes and Morgan, 2001; Tong et al., 2020):
where m is the charge rate,
For the multi-polarization model, the RTD function is represented by the superposition of multiple kernel functions (Ustra et al., 2016):
where
The Debye model in Equation Eq. 9 is similar to the basic Equation Eq. 1 of the GEMTIP model (
To study the CR physical characteristics of rocks and ores, a forward calculation program was written for different phases of the GEMTIP model on a Python language open-source programming platform. Moreover, the CR of different ellipticities, relaxation times, and polarized mineral particle percentage contents and the attenuation coefficient changes in the two-phase and multiphase models underwent simulation calculations. The anomaly characteristics of CR were described by its phase spectrum, amplitude-phase frequency characteristic curve (Nyquist curve) diagram, and RTD.
2.1 Spectral characteristics of the two-phase model
Assuming that the rocks and ores shown in (Figure 1) contained only one type of two-phase media with an anisotropic distribution of ellipsoidal polarized mineral particles, the GEMTIP model with the three parameter variations shown in Table 2 was established for simulation calculations, and the phase curves and Nyquist curves of CR in the x-, y-, and z-directions (Rx, Ry, and Rz) were obtained (Figures 3–5).
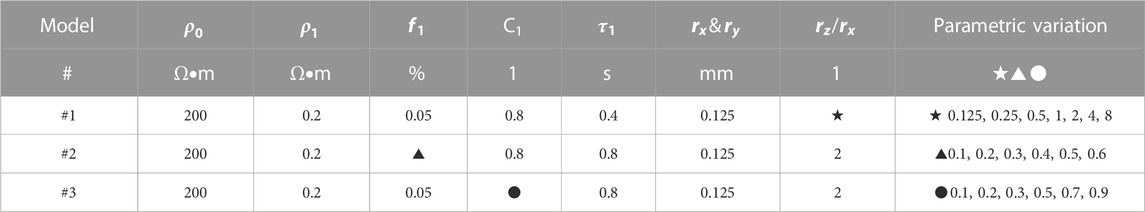
TABLE 2. Parameters of the GEMTIP model for two-phase media.
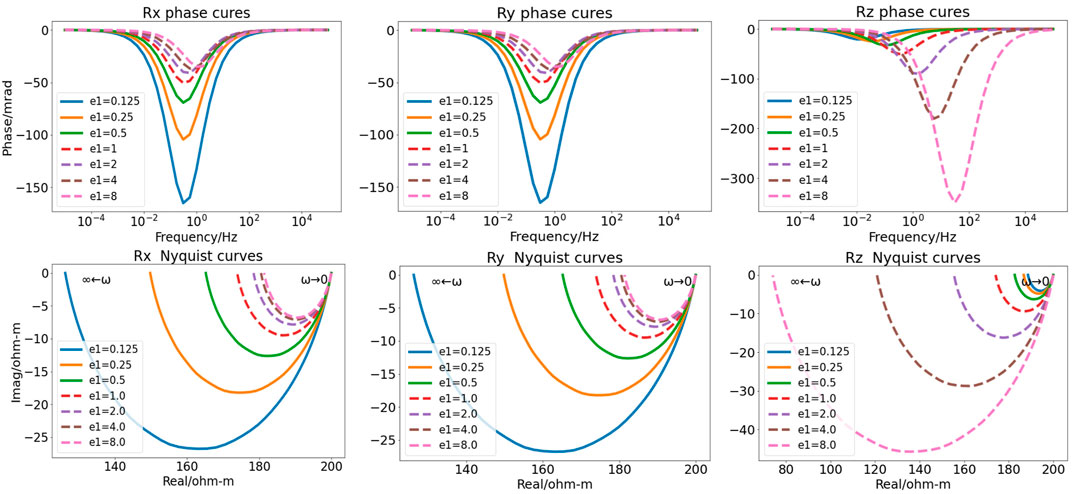
FIGURE 3. Phases and Nyquist curves of minerals with different ellipticities in the first GEMTIP model.
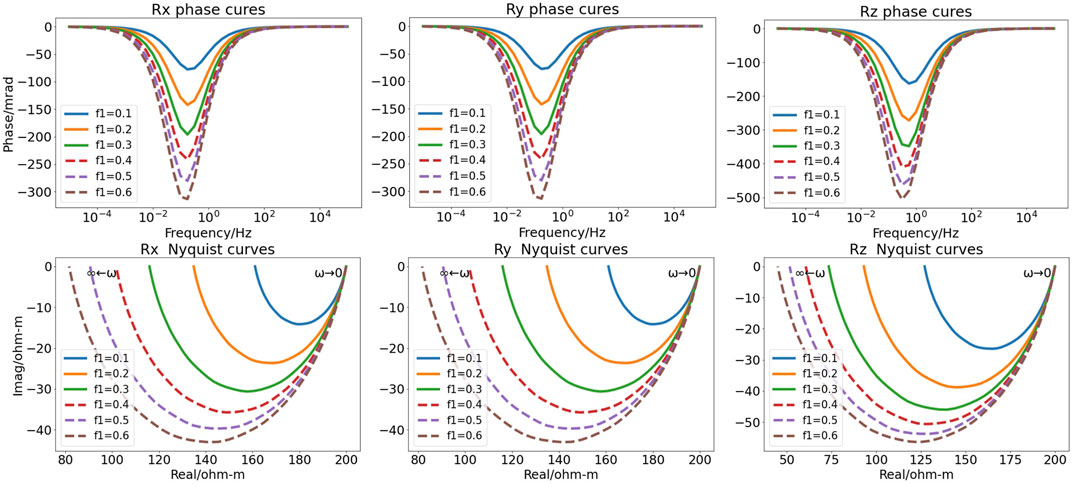
FIGURE 4. Phases and Nyquist curves of different mineral particle contents in the second GEMTIP model.
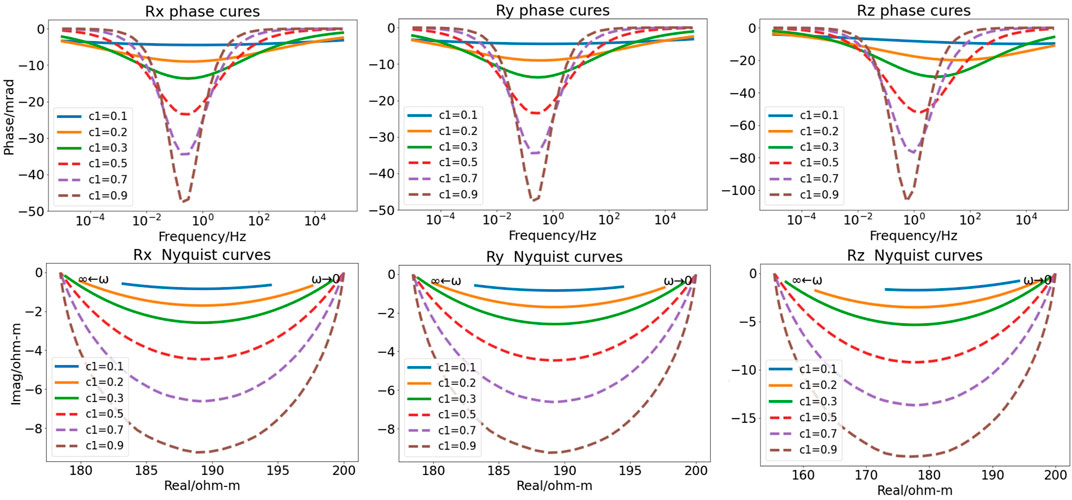
FIGURE 5. Phases and Nyquist curves of different attenuation coefficients in the third GEMTIP model.
Figure 3 shows the phase spectra and Nyquist curves of rotating ellipsoid minerals with different ellipticities in the first GEMTIP model. With increasing ellipticity e, the amplitude of the phase anomalies decreases (by approximately 150 mrad) for Rx and Ry and increases (by approximately 350 mrad) for Rz. On the Nyquist curve, the real and imaginary components of Rx and Ry become progressively smaller in anomaly amplitudes as ellipticity e increases (the real and imaginary components of the amplitude decrease from 80 Ω•m to 20 Ω•m and increase from −25 Ω•m to −5 Ω•m, respectively). The real and imaginary components of Rz become progressively larger in anomaly amplitude as e increases (increasing from 10 Ω•m to 120 Ω•m and −5 Ω•m to −45 Ω•m, respectively). The figure indicates that when the mineral particle changes from discus-shaped to football-shaped, the anomaly amplitude and variation trend of the anisotropy of CR vary greatly. The horizontal anomaly has a larger discus shape, and the vertical anomaly has a larger football shape.
Figure 4 shows the GEMTIP phase spectrum and Nyquist curves of different mineral particle contents in the second GEMTIP model. The anomaly amplitude of Rx (Ry) and Rz increases with mineral particle content f. The phase amplitude increases accordingly to 300 mrad and 500 mrad, the real component increases by approximately 80 Ω•m, and 85 Ω•m, and the imaginary component increases by approximately 30 Ω•m and 35 Ω•m, respectively. As the volume percentage content of mineral particles increases, the anomaly of the spectrum curve in the GEMTIP model becomes more obvious.
Figure 5 shows the phase spectra and Nyquist curves for different attenuation coefficients in the third GEMTIP model. The anomaly amplitude of Rx (Ry) and Rz increases with the attenuation coefficient c, and the amplitudes of the phase, real component, and imaginary component of Rz increase more evidently than those of Rx (Ry). The anomaly amplitude increases with c, indicating an increasingly stronger degree of polarization.
2.2 Spectral characteristics of the three-phase model
For the three-phase medium GEMTIP model for the rocks and ores containing two kinds of rotating ellipsoid mineral particles, the model parameters in Table 3 were selected to simulate the CR anomaly of different model parameters, and the anomaly curves of the effective model were obtained (Figures 6–8).
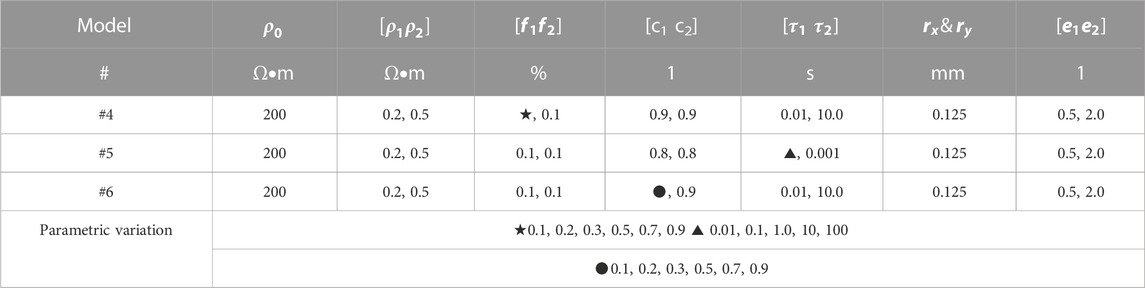
TABLE 3. Parameters of the GEMTIP model for three-phase media.
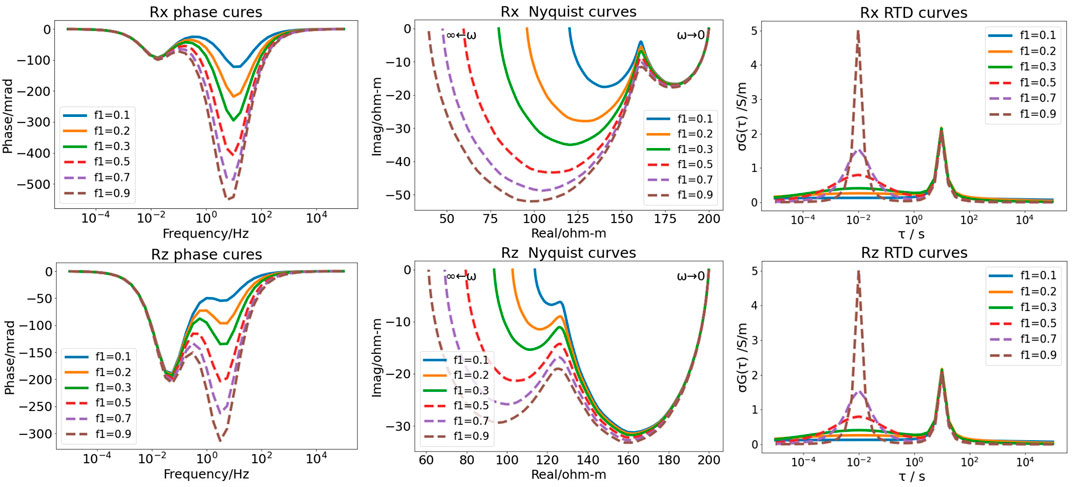
FIGURE 6. Phases and Nyquist curves of different mineral particle contents in the fourth GEMTIP model for three-phase media.
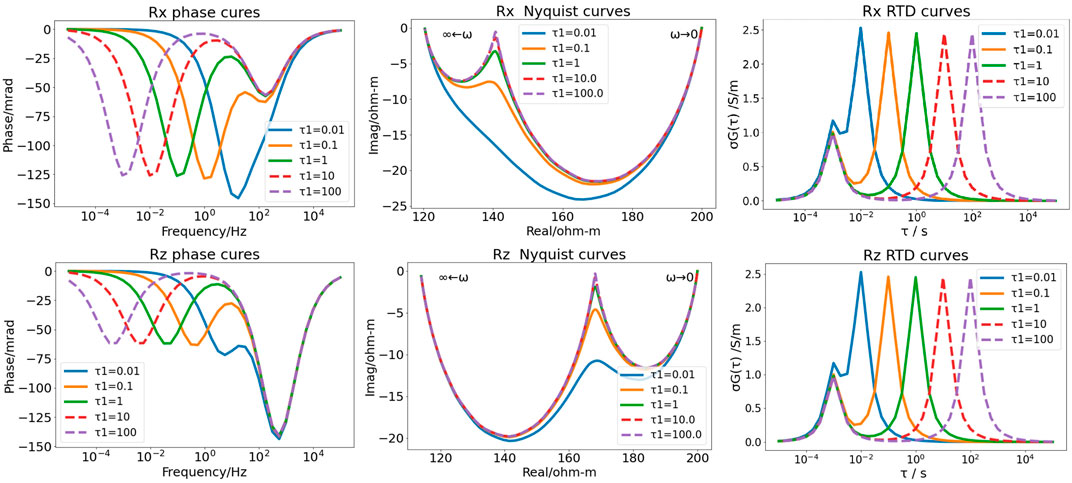
FIGURE 7. Phases and Nyquist curves of different relaxation times in the fifth GEMTIP model for three-phase media.
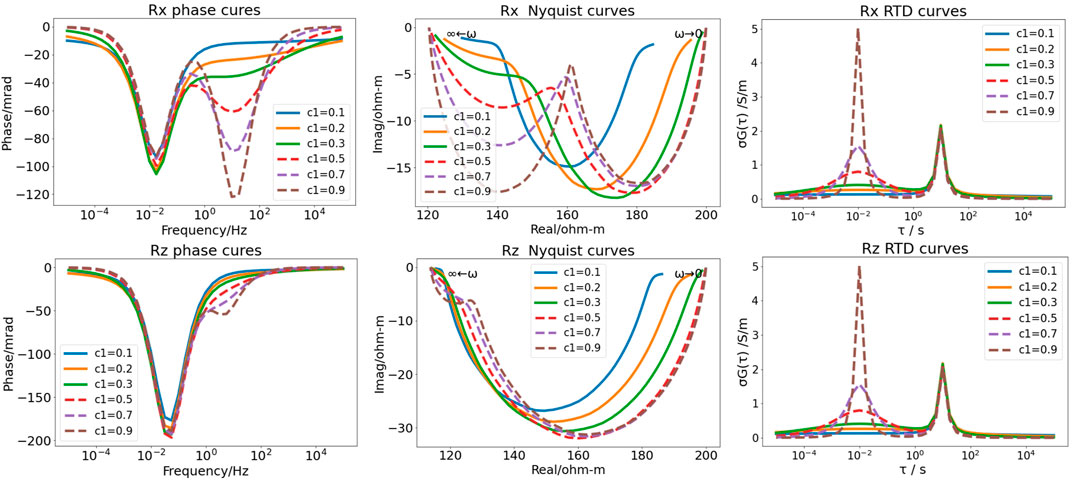
FIGURE 8. Phases and Nyquist curves of different attenuation coefficients in the sixth GEMTIP model for three-phase media.
Figure 6 shows the phase spectra, Nyquist curves, and RTD of different volume contents of two kinds of mineral particles in the fourth GEMTIP model for three-phase media. In the phase curves, two minimum values reflect two kinds of mineral particles. The first minimum value reflects the polarization anomaly of the prolate ellipsoidal (e = 2) particle, where the Rx direction is less anomalous than the Rz direction; the second minimum value reflects the polarization anomaly of the oblate ellipsoidal (e = 0.5) particle, where the Rx direction is more anomalous than the Rz direction. The Nyquist curves also show the characteristics of large anomaly amplitude in the Rz direction of prolate ellipsoidal particles and in the Rx direction of oblate ellipsoidal particles. The anomaly curve amplitudes of the phase spectra and Nyquist curves increase with the mineral particle content. The RTD curve is the same in the Rx- and Rz-directions and has two peaks. The first peak reflects the relaxation time of the oblate ellipsoid particle, and the second peak reflects the relaxation time of the prolate ellipsoid particle; the amplitude of the first peak is larger than that of the second peak, indicating that the conductivity of the oblate ellipsoid particle is larger. The relaxation time of mineral particles determines the peak position of the curve, and the conductivity of mineral particles determines the size of the peak.
Figure 7 shows the phase spectra, Nyquist curves, and RTD of different relaxation times of two kinds of mineral particles in the fifth GEMTIP model for three-phase media. The two minimum values of anomalies on the phase curves, Nyquist curves, and RTD curves reflect the existence of two kinds of particles. When different relaxation times are taken for the oblate ellipsoid particles (e = 0.5) from small to large, the frequency corresponding to the phase anomaly minimum value decreases, the Nyquist curve anomaly decreases, and the time corresponding to the RTD peak increases accordingly.
Figure 8 shows the phase spectra, Nyquist curves, and RTD of different attenuation coefficients of two kinds of mineral particles in the sixth GEMTIP model for three-phase media. The two extrema on the phase curve in the Rx and Rz directions reflect the existence of two kinds of particles. The first and second extrema reflect the presence of prolate and oblate ellipsoid particles, respectively. As the attenuation coefficient increases, the phase amplitude of the oblate ellipsoid particles changes greatly in the Rx direction and slightly in the Rz direction. On the Nyquist curves in the Rx and Rz directions, the minima reflect the presence of the mineral particles of the oblate ellipsoid and prolate ellipsoid, respectively. When the attenuation coefficient of the oblate ellipsoid changes from small to large, the Nyquist curve changes obviously in the Rx direction and slightly in the Rz direction. For the RTD of these two directions, the two peaks correspond to the relaxation time of the oblate and prolate ellipsoid particles, respectively. As the attenuation coefficient of the oblate ellipsoid increases, its relaxation time amplitude changes from small to large. The attenuation coefficient and the anomaly amplitude of the curve increases. The anomaly amplitude is larger in the Rz and Rx directions for the prolate and oblate ellipsoids, respectively.
3 CR testing of ore samples
Samples of natural chalcopyrite, lead–zinc ore, pyrite, and magnetite were collected to observe their structures, mineral compositions, particle sizes, and contents under a microscope (Table 4).
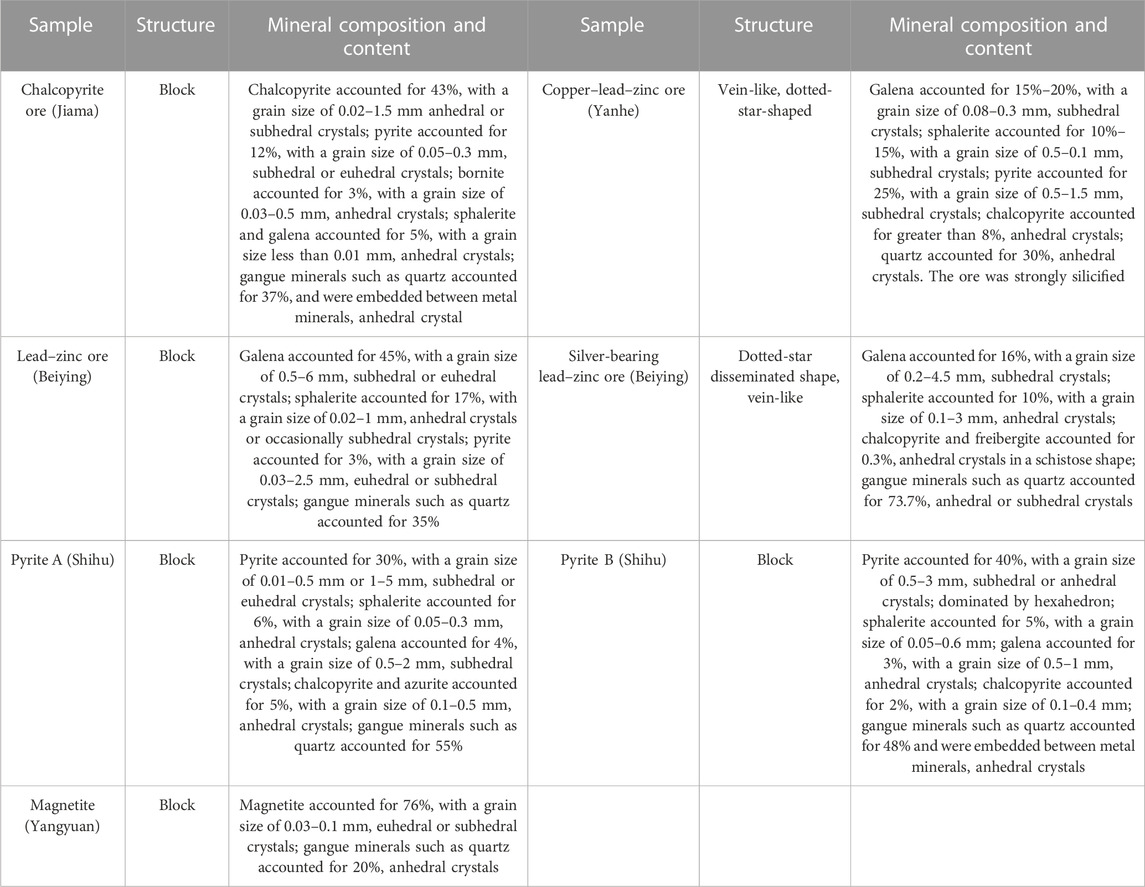
TABLE 4. Mineral compositions and contents of metal ore samples.
The real and imaginary components of the CR of different metal ore samples were measured in the range of 10−3–105 Hz (51 measuring frequency points) by using a spectrometer (Solartron SI-1260) and a frequency spectrum induced polarization instrument (SIP Field/Lab Unit, PSIP, Portable) according to a symmetrical quadrupole device. The frequency acquisition range of the instrument can be from 10 μHz to 32 MHz, with a maximum resolution of 10 μHz. The phase curve of the sample (Figure 9A) and the normalized Nyquist curve (Figure 9B) were obtained.
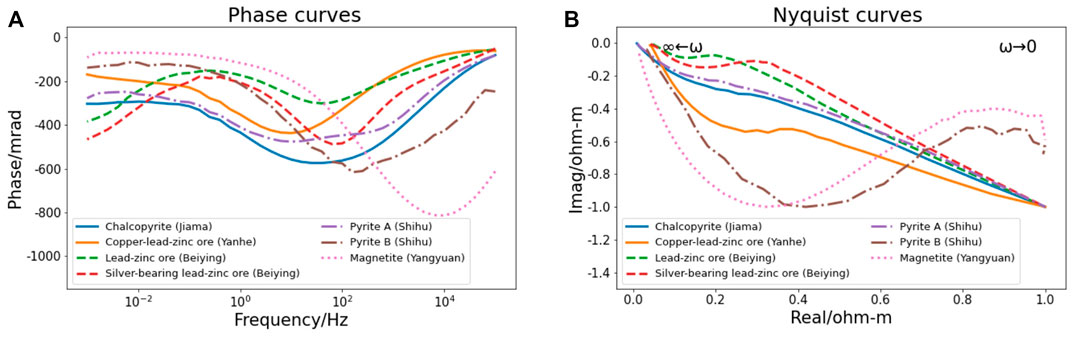
FIGURE 9. Measured phase curve (A) and Nyquist (normalized) curve (B) of rock and ore samples.
From Figure 9A, the phase curves of chalcopyrite, copper–lead–zinc ore, and pyrite samples are concave, while the phase curve of the lead–zinc ore is convex-concave. Except for magnetite, the phase change range of other types of ore is between −100 and −600 mrad, and the corresponding frequency of the minimum value is between 1 and 100 Hz. On the normalized Nyquist curve of Figure 9B, as the frequency changes from high to low, the curves of chalcopyrite and lead–zinc ore first decrease in a small arc and then decrease linearly, while the curves of pyrite B and magnetite are concave-convex.
4 Fitting the CR curves of rock and ore samples
4.1 Differential evolution (DE) algorithm
The DE algorithm is a global optimization algorithm guided by the principle of survival of the fittest. This algorithm mainly uses its own difference vector guidance in global optimization and achieves the global optimal solution through a series of operations, such as mutation, crossover, and selection. The specific process of DE algorithm operation is as follows (Wang, 2015):
(1) Determination of the algorithm parameters (including population size NP, mutation operator F, crossover operator CR, and maximum iteration algebra t)
Let the minimum value problem of the objective function be:
Let
(2) Population initialization
First, the initial population is randomly generated in n-dimensional space:
where
(3) Mutation operation
In the DE algorithm, other random model vectors different from the random quantity itself are used to generate differential vectors to mutate random vectors. The three vectors
where
(4) Crossover operation
To ensure that the population retains the characteristics of the previous generation during the search process, the corresponding component of the previous generation xi(t) must be retained in the xi(t+1) generation at least, which can be achieved by the following operations. Let:
where
(5) Operation selection
The purpose of the selection operation is to use a greedy search strategy to determine whether xi(t) after a crossover and a mutation can enter the next-generation model vector group. The test vector
The formula for the selection operation can be expressed as
Steps 3 to 5 are repeated until the number of iterations is met or the minimum target difference is reached, and the iteration ends.
4.2 Theoretical model curve fitting
To verify the correctness and validity of the DE algorithm for fitting the CR spectrum parameters, with the help of Matlab for scientific computing and a Python language programming platform, a DE algorithm parameter fitting program was written for the GEMTIP model for the three-phase medium of spherical mineral particles. In the model parameter fitting, first, the amplitude spectrum and phase spectrum of the model were obtained by the forward calculation module with the given model parameters; second, a random error of 5% was added to the data obtained by the forward calculation to obtain the model data for parameter fitting; third, the model data were fitted and inverted through the written DE algorithm parameter fitting program to obtain the fitting parameters; finally, the fitting parameters were compared and evaluated for a convergence effect and fitting difference.
The GEMTIP model for three-phase media was adopted, and the model parameters shown in Table 5 were selected for forward calculation. The calculation results included a 5% random noise before the DE algorithm was applied for parameter fitting. The parameters with a population size of 200, iteration number of 100, mutation factor of 0.5, and crossover factor of 0.8 were selected for fitting, and the fitted phase curve, Nyquist curve, and RTD curve were obtained (Figure 10). As Figure 10 demonstrates, the DE algorithm has high curve-fitting accuracy (the overall fitting difference (mean square error) is 0.0057). Although the DE algorithm has no initial parameter settings, the fitted curve is relatively complete (Figures 10A–C), the parameter fitting closeness is high (Table 5), and the convergence speed is fast (Figure 10D). The example indicates that for the CR curves of rock and ore samples, the optimal solution estimation of the DE inversion algorithm is stable, and the degree of adaptation is high.
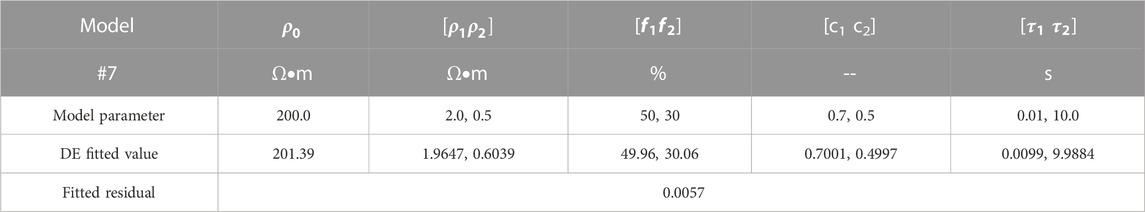
TABLE 5. Information of DE inversion fitting parameters for model curves.
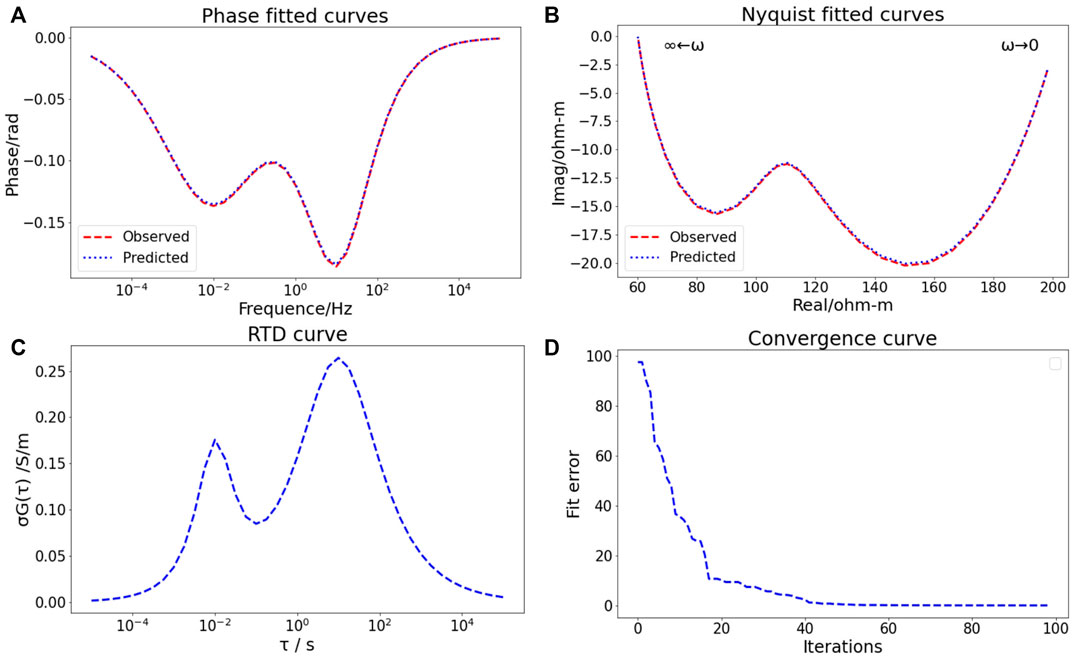
FIGURE 10. GEMTIP model #7 curve and DE inversion fitted curve. (A) Phase fitted curves (B) Nyquist fitted curves (C) RTD curve (D) Convergence curve.
4.3 Parameter fitting of the CR curves of rock and ore samples with the DE algorithm
The DE algorithm fitting program was employed to perform parameter fitting for the measured CR curves of natural chalcopyrite, lead–zinc ore, pyrite, and magnetite samples from different mining areas. In the parameter fitting, first, the parameters with a population size of 300, iteration number of 200, variation factor of 0.5, crossover factor of 0.8, and model parameter dimension of 9 were selected for CR amplitude normalization. Second, the amplitude spectrum and phase spectrum after CR normalization underwent curve fitting to determine the attenuation coefficient, relaxation time, and volume content of spherical mineral particles for the GEMTIP model fitting for the samples. Finally, the phase fitted curve, Nyquist fitted curve, and RTD curve based on the Cole–Cole distribution were drawn according to the fitting parameters. The fitted curves and RTD curves of the natural rock and ore samples are given in Figure 11, and the fitting parameters are shown in Table 6.
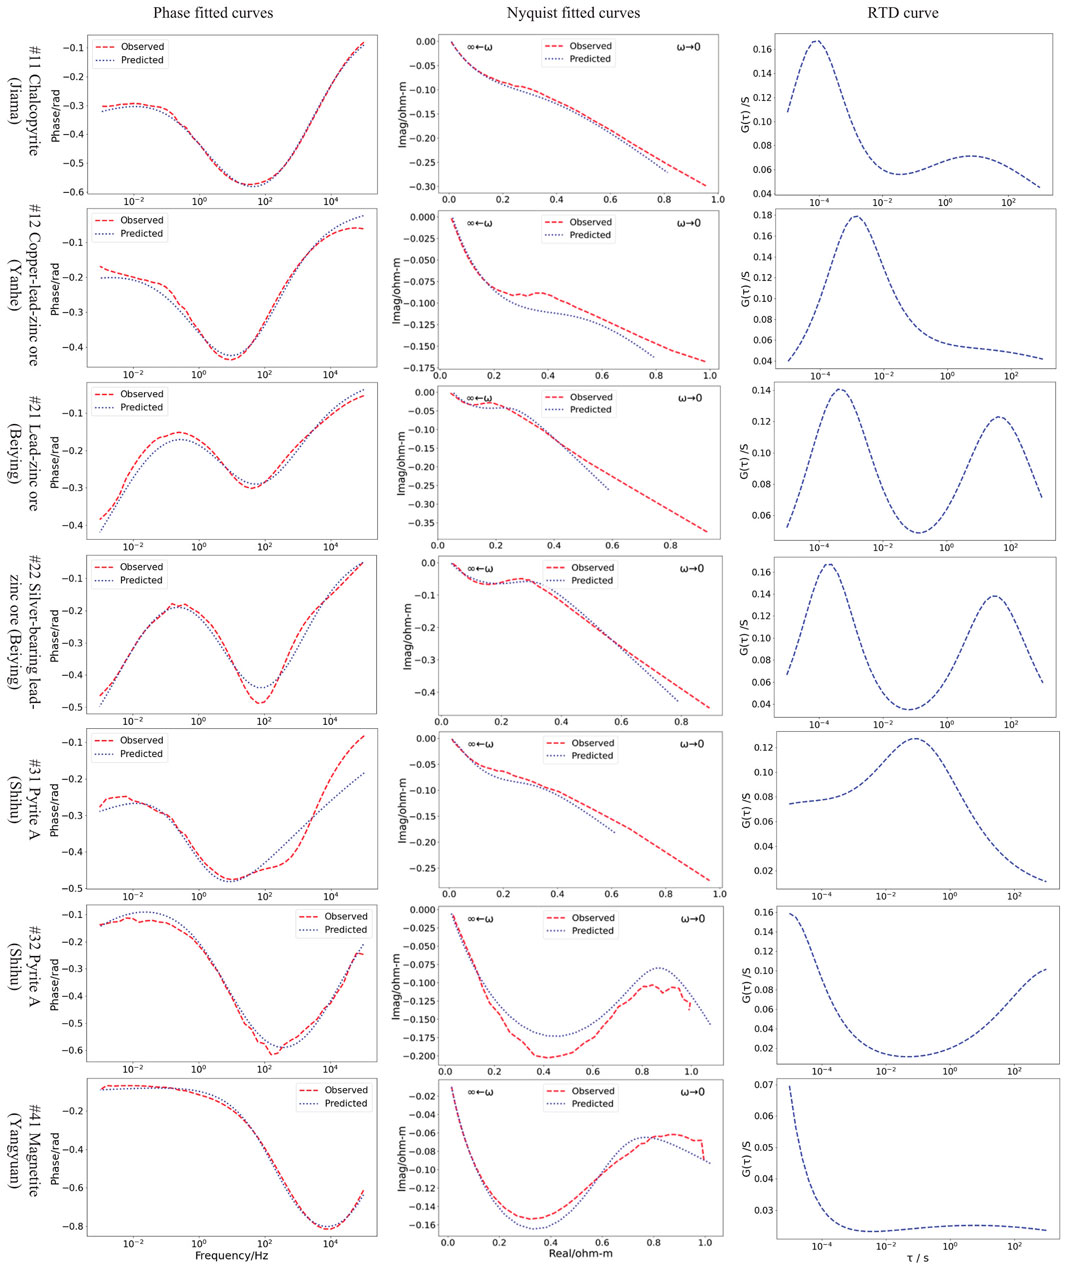
FIGURE 11. DE algorithm parameter fitted curves and RTD curves of the measured curves of rock and ore samples.
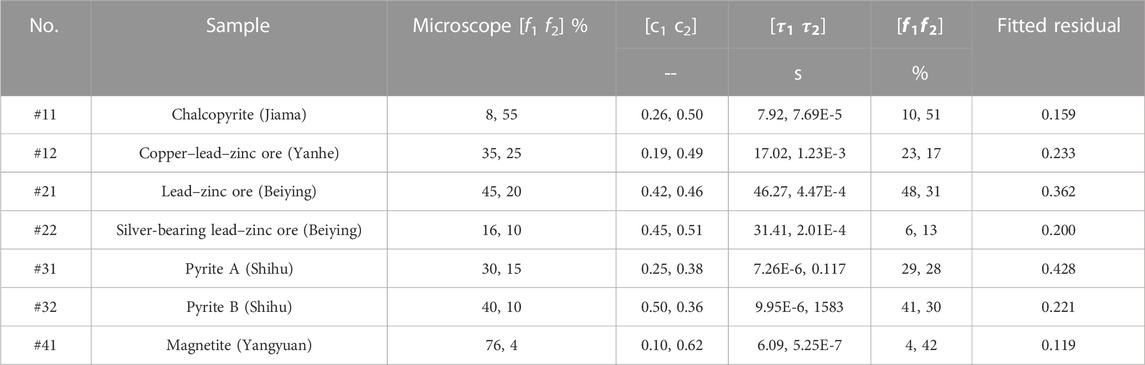
TABLE 6. DE inversion parameter information of sample measurement curves.
Figure 11 shows the GEMTIP three-phase media model DE algorithm parameter fitted curves and RTD curves of the measured phase curve of chalcopyrite, lead–zinc ore, pyrite, and magnetite samples, and the Nyquist curves of CR normalization. Figure 11 reveals that the phase curve fittings of block-shaped chalcopyrite (#11) and dotted-star-shaped copper–lead–zinc ore (#12) are more complete and have a higher fitting accuracy; however, the Nyquist curves with normalized amplitudes are poorly fitted, with fitting differences of 0.159 and 0.233, respectively; the obtained RTD curves show double peaks and single peaks, respectively. Because they have fewer silver-containing minerals, lead–zinc ores (#21) and silver-bearing lead–zinc ores (#22) have the same basic shapes of fitting curves, with fitting differences of 0.362 and 0.200, respectively. Their RTD curves all show bimodal characteristics. The two blocks of pyrite (#3 and #32) from different mining points have similar phase curve shapes but different Nyquist curve shapes, with fitting differences of 0.428 and 0.221, respectively; their RTD curves are convex and concave, respectively. For magnetite (#41), the phase curve fitting is more complete, while the Nyquist curve-fitting accuracy is higher, with a fitting difference of 0.119. The RTD curve is higher in the lower frequency band, with an inconspicuous bulge near 1 Hz.
Table 6 shows the parameters of the GEMTIP three-phase medium model DE algorithm fitting of the measured CR curve of chalcopyrite, lead–zinc ore, pyrite, and magnetite samples. The maximum value of the attenuation coefficient fitted to the curves of different rock and ore samples is 0.62, and the minimum value is 0.10 (Table 6). The relaxation time constant fitted to the curves of the samples is large, with a maximum of 1,583 s and a minimum of 5.25 E-7 s, indicating a large variation. The RTD curves reflect the characteristics of the three-phase media of the samples. In the volume content of minerals in the sample media obtained by fitting the sample curve, the mineral content in chalcopyrite (#11, #12), lead–zinc ore (#21), and pyrite (#31, #32) conforms to the change trends of mineral content observed under a microscope; however, the mineral content in silver-containing lead–zinc ore (#22) and magnetite ore (#41) is opposite to the mineral order observed under the microscope. Although the fitted mineral contents deviate from the measured mineral contents, they can also reflect the mineral composition of the samples to a certain extent.
5 Discussion
Empirical models are commonly use to describe the IP effects of rocks and ores, while the GEMTIP model is an IP model strictly derived completely based on the generalized effective medium theory. Empirical models and the GEMTIP model can characterize the IP effects of rocks and ores, but the GEMTIP model depicts in detail the structures of rocks and ores, as well as the shapes, sizes, contents, and electrical properties of mineral particles. Many parameters were incorporated into the GEMTIP model. The forward simulation of natural ore samples could expound the CR characteristics of the ore samples, which, however, were difficult to achieve by full-parameter fitting and inversion.
The charging rate Mj in the GEMTIP model reflected the polarizability of rocks and ores. In most cases, because the resistivity was high (generally 103–106 Ω.M) for the ore matrix and low (usually 10–3–100 Ω.M) for the minerals, the charging rate was approximately 3. Relaxation time is related to the sizes, surface areas, resistivities, and attenuation coefficients of minerals in ores. Relaxation time is a comprehensive parameter that reflects the discharge process of ores. The physical meaning of these parameters requires clarification by further studies.
The parameter fitting and inversion of the GEMTIP model were conducted on the test data for the selected ore samples, and a preliminary understanding was obtained by comparing different types of ores under a microscope. However, only a few ore samples were collected, and the particles were assumed to be spherical in the fitting inversion. Therefore, more rock and ore samples are required for further research and validation.
6 Conclusion
(1) The simulation results indicate that for the mineral particles in the polarized unit, a higher content led to a larger anomaly amplitude; a greater attenuation coefficient led to a greater anomaly amplitude; a larger relaxation time led to a smaller peak frequency of the curve. The polarization anomaly of flat ellipsoid particles is larger along the transverse direction, while the polarization anomaly of long ellipsoid particles is obvious along the long axial direction.
(2) The phase curves were concave for the chalcopyrite and pyrite samples and convex-concave for lead–zinc ore. The phase variation range of rock and ore samples was between −100 and −600 mrad, and the corresponding frequency of the minimum value was between 1 and 100 Hz.
(3) The fitting parameters of the rock and ore sample curve and the parameters observed under a microscope were compared and analyzed. Although the fitting of the particle content parameters had certain errors, it could roughly reflect the structure and content characteristics of mineral particles.
(4) The GEMTIP model was demonstrated to have sufficient applicability to the structural and electrical study of the IP characteristics of rocks and ores.
(5) This study has elucidated the basic formulas and relaxation time distribution expression of the GEMTIP model for rock and ore samples, derived through the generalized effective medium theory and Debye decomposition method. Forward and inverse programs for the GEMTIP model were designed and developed. Theoretical models were simulated and actual samples were parameter-inverted by curve fitting, providing a computational tool and laying a foundation for studying the piezo-electric effects of rocks and ores.
Data availability statement
The original contributions presented in the study are included in the article/supplementary material, further inquiries can be directed to the corresponding author.
Author contributions
SW: investigation, data curation, software, validation, writing and editing. TW: software. JY: conceptualization, methodology. All authors contributed to the article and approved the submitted version.
Funding
This work was supported by the National Natural Science Foundation of China (No. 41374133).
Conflict of interest
The authors declare that the research was conducted in the absence of any commercial or financial relationships that could be construed as a potential conflict of interest.
Publisher’s note
All claims expressed in this article are solely those of the authors and do not necessarily represent those of their affiliated organizations, or those of the publisher, the editors and the reviewers. Any product that may be evaluated in this article, or claim that may be made by its manufacturer, is not guaranteed or endorsed by the publisher.
References
Alfouzan, F. A., Alotaibi, A. M., Cox, L. H., and Zhdanov, M. S. (2020). Spectral induced polarization survey with distributed array system for mineral exploration: Case study in Saudi Arabia. Minerals 10 (9), 769. doi:10.3390/min10090769
Burtman, V., and Zhdanov, M. S. (2015). Induced polarization effect in reservoir rocks and its modeling based on generalized effective-medium theory. Resource-efficient Technol. 1 (1), 34–48. doi:10.18799/24056529/2015/1/27
Chang, Y., Tohniyaz, T., and Wang, H. (2018). Influence factors of frequency-dependent coefficient with GEMTIP model. Oil Geophys. Prospect. 53 (5), 1103–1109.
Cheng, H., Di, Q., and Li, D. (2010). The discussion electrical properties of rocks base on frequency response characteristics. Prog. Geophys. 25 (3), 918–925.
Dias, C. A. (2000). Developments in a model to describe low-frequency electrical polarization of rocks. Geophysics 65 (2), 437–451. doi:10.1190/1.1444738
Florsch, N., Camerlynck, C., and Revil, A. (2012). Direct estimation of the distribution of relaxation times from induced-polarization spectra using a Fourier transform analysis. Near Surf. Geophys. 10 (6), 517–531. doi:10.3997/1873-0604.2012004
Fu, H. (2013). Interpretation of complex resistivity of rocks using GEMTIP analysis:[Dissertation]. Department of Geology and Geophysics, University of Utah, 1–86. Salt Lake City, UT, USA.
Kavian, M., Slob, E., and Mulder, W. (2012). A new empirical complex electrical resistivity model. Geophysics 77 (3), E185–E191. doi:10.1190/geo2011-0315.1
Lesmes, D. P., and Morgan, F. D. (2001). Dielectric spectroscopy of sedimentary rocks. J. Geophys. Res. Solid Earth 106 (B7), 13329–13346. doi:10.1029/2000jb900402
Liu, M. (2017). Study on the model and experiment of spectrum characteristics of rock mineral in natural field IP:[Dissertation]. Beijing, China: China University of Geosciences, 1–92.
Liu, Y., Xiong, B., Luo, T., and Cai, H. (2015). Research on 2.5-D response characteristics of IP method based on the generalized effective CR model. Prog. Geophys., 30, (3), 1337–1344.
Nordsiek, S., and Weller, A. (2008). A new approach to fitting induced-polarization spectra. Geophysics 73 (6), F235–F245. doi:10.1190/1.2987412
Pelton, W., Ward, S., Hallof, P., Sill, W., and Nelson, P. H. (1978). Mineral discrimination and removal of inductive coupling with multifrequency IP. Geophysics 43 (3), 588–609. doi:10.1190/1.1440839
Phillips, C. R. (2010). Experimental study of the induced polarization effect using Cole-Cole and GEMTIP models:[Dissertation]. The University of Utah, 1–79. Salt Lake City, UT, USA.
Revil, A., and Florsch, N. (2010). Determination of permeability from spectral induced polarization in granular media. Geophys. J. Int. 181 (3), 1480–1498. doi:10.1111/j.1365-246x.2010.04573.x
Revil, A., Florsch, N., and Mao, D. (2015). Induced polarization response of porous media with metallic particles—Part 1: A theory for disseminated semiconductors. Geophysics 80 (5), D525–D538. doi:10.1190/geo2014-0577.1
Sharifi, F., Arab Amiri, A. R., and Kamkar Rouhani, A. (2019). Using a combination of genetic algorithm and particle swarm optimization algorithm for GEMTIP modeling of spectral-induced polarization data. J. Min. Environ. 10 (2), 493–505.
Tarasov, A., and Titov, K. (2007). Relaxation time distribution from time domain induced polarization measurements. Geophys. J. Int. 170 (1), 31–43. doi:10.1111/j.1365-246x.2007.03376.x
Tian, G., Tang, X., Xiang, K., and Chi, M. (2019). Study on complex resistivity of artificial sandstone containing conductive mineral under high pressure. Coal Geol. Explor. 2, 183–194.
Tong, M., Li, L., Wang, W., Zhang, J., Jiang, Y., and Wang, R. (2005). Experimental study on complex resistivity of shaly sands. Well Logging Technol. 29 (3), 188–190.
Tong, X., Yan, L., and Xiang, K. (2020). Modifying the generalized effective-medium theory of induced polarization model in compacted rocks. Geophysics 85 (4), MR245–MR255. doi:10.1190/geo2019-0718.1
Ustra, A., Mendonça, C. A., Ntarlagiannis, D., and Slater, L. D. (2016). Relaxation time distribution obtained from a Debye decomposition of spectral induced polarization data. Geophysics 81 (2), E129–E138. doi:10.1190/geo2015-0095.1
Wang, T. (2015). Comprehensive research on the iterative finite element and the improved differential evolution of magnetotelluric:[Dissertation]. China University of Geosciences, 1–110. Wuhan, China.
Wu, Y., Xiong, B., Luo, T., Guo, S., Chen, X., Liang, Z., et al. (2017). The analysis of spectrum characteristic based on the model of generalized effective medium theory induced polarzation. Chin. J. Eng. Geophys. 14 (2), 217–224.
Xiao, Z., Xu, S., Luo, Y., Wang, D., and Zhu, S. (2006). Study of mechanisms of complex resistivity frequency dispersion property of rocks. J. Zhejiang Univ. Sci. Ed. 33 (5), 584–587. (in Chinese with English Abstract).
Zhang, R., Yan, L., Sun, S., Jiang, S., Xie, X., and Jin, G. (2016). IP parameter extraction from TFEM data in the time domain. Oil Geophys. Prospect. 51 (6), 1227–1232. (in Chinese with English Abstract).
Zhang, S., Li, Y., Zhang, S., Zhang, G., Wang, S., and Zheng, P. (1984). The low frequency electrical phase spectra of mineralized rocks (ores) and some factors which influence them in some sulfide ore deposits in China. Acta Geophys. Sin. 27 (2), 176–189. (in Chinese).
Zhang, S., Xiong, B., Luo, T., Wang, J., Cai, H., Zhang, Q., et al. (2019). Spectrum characteristics of ellipsoid based on Model GEMTIP. Juornal Guilin Univ. Technol. 39 (3), 615–621. (in Chinese with English Abstract).
Zhang, S., Zhou, J., and Li, Y. (1994). Spectral induced polarization characteristics, structures and conductive mineral composition of rocks (ores). Beijing, China: China Science and Technology Press.
Zhdanov, M., Endo, M., Cox, L., and Sunwall, D. (2018). Effective-medium inversion of induced polarization data for mineral exploration and mineral discrimination: Case study for the copper deposit in Mongolia. Minerals 8 (2), 68. doi:10.3390/min8020068
Zhdanov, M. (2008). Generalized effective-medium theory of induced polarization. Geophysics 73 (5), F197–F211. doi:10.1190/1.2973462
Zhdanov, M. S., Burtman, V., Endo, M., and Lin, W. (2018b). Complex resistivity of mineral rocks in the context of the generalised effective-medium theory of the induced polarisation effect. Geophys. Prospect. 66 (4), 798–817. doi:10.1111/1365-2478.12581
Zhdanov, M. S., Burtman, V., and Marsala, A. (June 2013). Proceedings of the 75th EAGE conference & exhibition incorporating SPE EUROPEC 2013. Salt Lake City, UT, United States: European Association of Geoscientists & Engineers, 348–01027.Carbonate reservoir rocks show induced polarization effects, based on generalized effective medium theory, Amsterdam, Netherlands
Keywords: GEMTIP model, rock and ore spectra, relaxation time distribution (RTD), differential evolution (DE) algorithm, Debye decomposition method
Citation: Wang S, Wang T and Yang J (2023) Spectral characteristics analysis of rocks and ores based on the generalized effective medium theory of induced polarization. Front. Earth Sci. 11:1190243. doi: 10.3389/feart.2023.1190243
Received: 20 March 2023; Accepted: 02 June 2023;
Published: 14 June 2023.
Edited by:
Michael Zhdanov, The University of Utah, United StatesReviewed by:
Arkoprovo Biswas, Banaras Hindu University, IndiaSanjit Kumar Pal, Indian Institute of Technology Dhanbad, India
Copyright © 2023 Wang, Wang and Yang. This is an open-access article distributed under the terms of the Creative Commons Attribution License (CC BY). The use, distribution or reproduction in other forums is permitted, provided the original author(s) and the copyright owner(s) are credited and that the original publication in this journal is cited, in accordance with accepted academic practice. No use, distribution or reproduction is permitted which does not comply with these terms.
*Correspondence: Jin Yang, eWFuZ2pAY3VnYi5lZHUuY24=