 Zhenlin Liu
 Maosheng Gao
 Qiming Sun2,3,5
- 1Faculty of Engineering, China University of Geosciences, Wuhan, Hubei, China
- 2Qingdao Institute of Marine Geology, China Geological Survey, Qingdao, Shandong, China
- 3Chinese Academy of Geological Sciences, Beijing, China
- 4Laboratory for Marine Geology, Pilot National Laboratory for Marine Science and Technology, Qingdao, China
- 5Hubei Key Laboratory of Yangtze Catchment Environmental Aquatic Science, School of Environmental Studies, China University of Geosciences, Wuhan, China
- 6Geological Bureau of Ningxia Hui Autonomous Region, Yinchuan, China
The Ningxia Plain, situated in the arid zone of northwest China, is a typical dryland plain that faces significant challenges to sustainable agricultural development due to soil salinization. In this study, we employed multivariate analysis and geostatistical methods to investigate the degree and distribution types of soil salinization and the hydrochemical characteristics of shallow groundwater. We also examined the relationship between soil salinization and hydrogeochemical characteristics by analyzing the sources of groundwater ions. This study developed a hydrogeochemical model to describe the soil salinization process in the Ningxia Plain. The results indicate that the majority of surface soils are alkaline type soils, followed by chloride-sulfate type soils. The groundwater is mainly fresh water and brackish water, with a hydrochemical type of SO4·HCO3–Ca·Mg or SO4·Cl–Ca·Mg. Saline water and salt water are represented by Cl–Na·Mg or Cl·SO4–Na·Mg. We also observed spatial trends in groundwater depth and total dissolved solids (TDS) concentrations that were opposite to soil salinity, which suggests a certain degree of second-order trend effect. Furthermore, the degree of soil salinization increased and then decreased from the pre-mountain alluvial plain to the Yellow River alluvial plain, while the groundwater chemistry ranged from simple to complex. The most severe area of soil salinization was found to be concentrated between Hongguang and Yaofu, which is also the area where shallow groundwater salinity accumulation is mainly influenced by continental salinization. In summary, this study provides valuable insights into the hydrogeochemical characteristics of the Ningxia Plain, which can inform strategies for mitigating soil salinization and promoting sustainable agriculture development in arid regions.
1 Introduction
Soil salinization is a serious geological problem that has far-reaching consequences on agricultural sustainability and global crop production. The accumulation of salt in soil results in a significant reduction in soil fertility, leading to land degradation and jeopardizing agricultural productivity (Aragüés et al., 2015). The presence of excess salt in soil adversely impacts the availability of nutrients and water, thereby reducing plant growth and productivity (Litalien and Zeeb, 2020). Moreover, high soil salinity levels have a detrimental effect on the physiological and biochemical processes of plants (Corwin, 2021), making them more susceptible to abiotic stresses (Machado and Serralheiro, 2017). Therefore, soil salinization is a critical issue that demands immediate attention to mitigate its adverse effects on agricultural productivity and global food security.
In recent years, there has been significant research devoted to the characteristics and causes of soil salinization, which has revealed a strong association with groundwater. Saline soils are prevalent globally, particularly in arid and semi-arid regions where shallow groundwater evaporation is the dominant factor in soil salinization (Chandio et al., 2013). Moreover, soil salinization in arid areas is influenced by the shallow groundwater level and rapid fluctuation (Ibrahimi et al., 2014), groundwater abstraction (McCallum et al., 2013), and the irrigation of farmland (Chen et al., 2020) and drainage water (Davoodi et al., 2019), which indirectly affects the process of soil salinization. Effective management of groundwater and surface water has been found to be a key approach for reducing soil salinization (Machado and Serralheiro, 2017; Li et al., 2018; Yu et al., 2021). Soil salinization occurs primarily due to the accumulation of soluble salts, including Na+, Mg2+, and Ca2+, which originate from various sources such as the evaporation of saline groundwater, irrigation with saline water, seawater intrusion, and the original salt in soil parent material (Acosta et al., 2011). The salt content of surface soil is closely linked to the salt content and chemical composition of groundwater, particularly in arid and desert regions (Cui et al., 2019), and is generally proportional to the salinity of groundwater and negative burial depth (Ibrakhimov et al., 2007; He et al., 2021). While multivariate statistical analysis is a valuable tool for investigating the relationship between soil salinization and groundwater, it has been underutilized in soil salinization research, with most studies focusing on comprehensive evaluations of groundwater quality-related indicators (Mas-Pla et al., 2013; O'Shea and Jankowski, 2006).
The Ningxia Plain, located in the arid inland region of Northwest China, is an important agricultural base and commodity grain producer. However, the area’s reliance on Yellow River flood irrigation due to scarce rainfall and strong evaporation has led to shallow groundwater and high salinity in the soil parent material, resulting in prominent soil salinization issues. This problem is a key factor restricting agricultural development and poses a major environmental challenge for sustainable development in the region (Zhang et al., 2009). Therefore, conducting research to investigate the mechanism of soil salinization in the Ningxia Plain is necessary.
To address the pressing issue of soil salinization in Ningxia Plain, this study investigate the association between component content and type as well as the spatial distribution of soil and groundwater based on soil and shallow groundwater data. Geostatistical methods (Cay and Uyan, 2009; Juan et al., 2011) and multivariate statistical methods are applied to explore the correlation between soil salinization and hydrogeochemical processes and to reveal the mechanisms of soil salinization. The findings could provide a theoretical foundation for controlling and preventing soil salinization in Ningxia Plain, and could potentially provide a reference for the rational allocation and utilization of groundwater resources.
2 Materials and methods
2.1 Study area
The Ningxia Plain, also referred to as the Yinchuan Plain, spans from the Loess Plateau in the south to Shizuishan in the north, connects the Ordos Plateau in the east, and the Helan Mountain in the west, covering a northwest region of China between 105° 30′–107° 00′E and 37° 30′–39° 30′N at an altitude ranging between 970 and 1797 m (Figure 1). This region is characterized by aridity, drought, and high evaporation rates, with little rainfall, resulting in a high evaporation-precipitation ratio of up to 10. Cultivated land covers over half of the Ningxia Plain area, approximately 4,069 km2, representing 57.4% of the region, while the urban space accounts for 1,249 km2 or 17.6%.
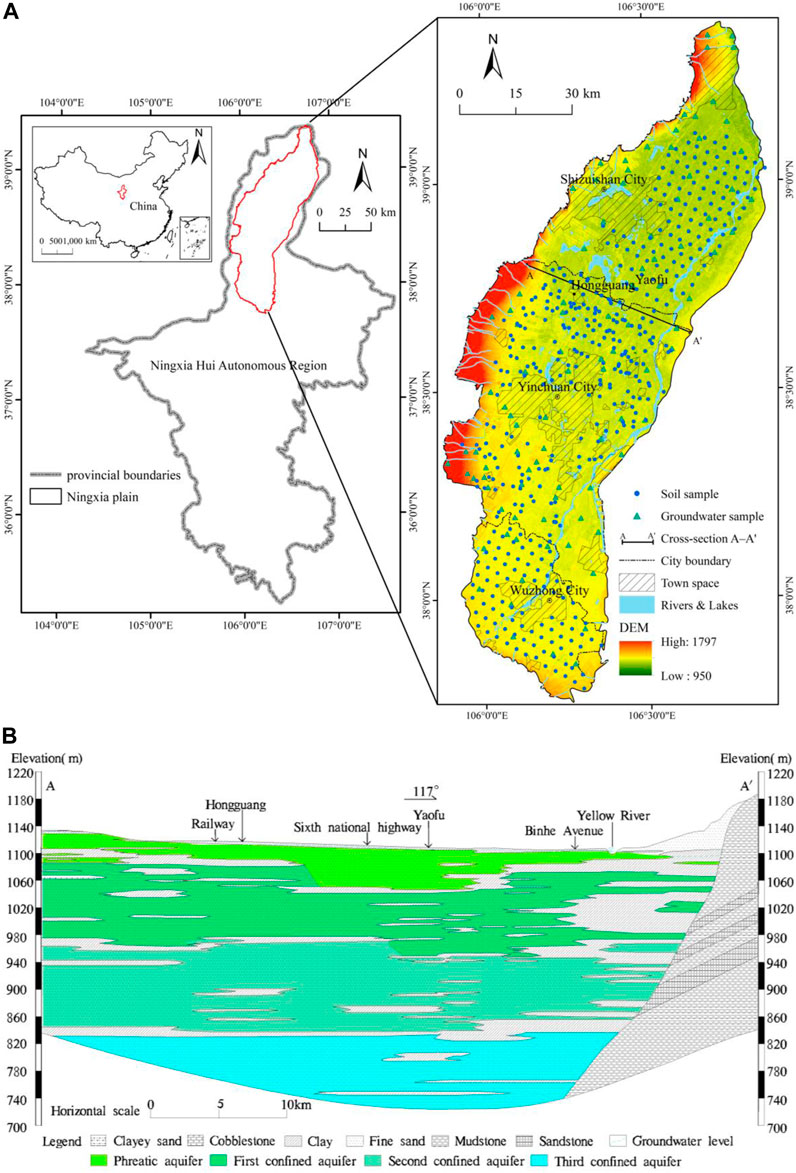
FIGURE 1. (A) Location of Ningxia Plain and DEM elevation map of soil and groundwater samples (B) Cross-section map of A–A′.
The present study collects meteorological data of meteorological observation stations in counties and cities in Ningxia Plain region spanning the period from 1959 to 2016, as shown in Figure 2. The analysis reveals an annual average temperature of 9.23°C, with the lowest average temperature occurring in January (−7.57°C). Additionally, the extreme minimum temperature observed was −30.6°C, while the highest average temperature occurred in July at 23.85°C, with the extreme maximum temperature recorded at 41.4°C. The total annual evaporation amounts to 1,727.9 mm, with a concentration primarily from March to September, which constitutes 81.51% of the annual evaporation. Meanwhile, the average annual precipitation amounts to 188.3 mm, mainly concentrated from June to September, and accounts for 71.53% of the annual precipitation.
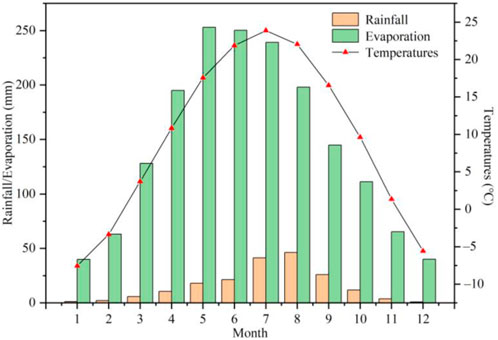
FIGURE 2. Monthly average meteorological elements of Ningxia Plain from 1959 to 2016.
2.2 Sample collection and analysis
To ensure a stable period of soil salinity and groundwater properties and reduce the impact of human factors, the sampling period was selected from September to November 2021 after the end of irrigation. The study area was divided into the urban space and the planting area, and sampling points were evenly distributed within and outside the planting area. Saline soil areas were preliminarily identified, and a total of 431 shallow soil samples (0–30 cm) and 314 deep soil samples (30–60 cm) were collected using a ring knife after artificial excavation. Furthermore, 95 groundwater samples were collected from phreatic aquifers and placed into polyethylene bottles for transportation to the laboratory where they were kept at 4°C for further analysis. The distribution of soil and groundwater sampling points in Ningxia Plain is depicted, and the geological section of the central Ningxia Plain in the north-south direction from A to A′ is illustrated in Figure 1.
Eight major ions (Na+, K+, Ca2+, Mg2+, Cl−, SO42−, CO32−, HCO3−) in addition to pH and salt content were quantified and calculated in soil samples. Air-dried soil samples were first sieved to a size of 1 mm before being added to newly prepared distilled water in a shaking flask using a soil/water ratio of 1:5. The resulting soil extract was analyzed following the forest soil water-soluble salt analysis method, with the exception of pH, which was measured using an SM210 digital acidity meter to determine the water/soil ratio of 2:1 leaching solution. The content of each ion in the soil leaching solution was then determined as follows: flame spectrophotometry was used for K+ and Na+; EDTA complexometric titration for Ca2+ and Mg2+; double indicator neutralization titration for CO32− and HCO3−; silver nitrate titration for Cl−; and EDTA indirect titration for SO42−. The sum of the measured 8 ions yielded the total salt content.
To this end, Cl− and SO42− ions were quantified using ion chromatography (IC, DIONEX DX500), while the pH and TDS concentrations were measured using a portable detector. The HCO3− and CO32− ions were determined by titration, and the cations were quantified using atomic absorption spectrophotometer (FAAS PE5100PC). The error associated with the measurements was less than 1.0%.
2.3 Statistical analysis
Upon completion of preliminary data processing, the spatial distribution map of the samples was projected and drawn using ArcGIS 10.7. The soil salt content data was then interpolated using the kriging method and evaluated for accuracy. The collected samples underwent correlation analysis, and factor analysis.
In order to investigate the relationship between soil salinity and salt ions (Jordán et al., 2004) and to better understand the interrelationship between various soil indicators, the correlation analysis (CA) method was conducted between soil salinity and ions. Pearson analysis was employed to evaluate the linear correlation between different ion species in the soil and to examine the intrinsic link between different ion species in the soil (Tong et al., 2017; Wang et al., 2019). The Pearson correlation coefficient (generally presented in terms of r) is employed to determine the degree and direction of the linear relationship between variables X and Y of equal interval measure, as shown in Eq. 1 (Abd El-Hamid and Hong, 2020):
Where
The factor analysis (FA) method (Akramkhanov et al., 2011) was introduced to analyze the indicators of shallow soil salinity. After the Kaiser-Meyer-Olkin (KMO) of the correlation matrix and Bartlett’s sphericity test, the data were suitable for factor analysis.
The complexity of geographical phenomena and problems, along with the limitations of our understanding, often renders the relationship between many factors uncertain. To address this issue, Hu (2008) employed Grey Relation Analysis (GRA) method to investigate the dominant and non-dominant factors influencing soil salinization. As the magnitudes of these factors vary, it is necessary to eliminate raw data and standardize the values before conducting correlation analysis. The standardized transformation method was utilized, where the raw data was transformed by subtracting the mean and dividing by the standard deviation to obtain a standardized series.
Gibbs diagram (Gibbs, 1970) can qualitatively judge the influence of atmospheric precipitation, evaporation and concentration, and regional rock weathering on groundwater, so as to explore the origin of ions. The salinity of most groundwater (especially deep groundwater) depends on the reaction with the main rock on the flow path, which can be explained by mixing and water-rock interaction (Marandi and Shand, 2018).
The saturation index (SI) and TDS concentrations relationship diagram were utilized to further investigate the hydrochemical evolution of groundwater (Song et al., 2015). The SI of minerals was calculated using the PHREEQC software (Parkhurst and Appelo, 2013):
Where
3 Results and analysis
3.1 Soil salinization characteristics and spatial variability analysis
3.1.1 Statistical characteristics
The present study examined the major ions content of shallow soils in a specific region (Table 1). Results indicate an alkaline overall pH range of 8.05–10.62 with a mean value of 8.83. Salinity values ranged from 0.72 to 231.17 g kg−1 with a mean value of 12.35 g kg−1, which is considerably higher than the range of 6–10 g kg−1 reported in surface soil salinity in April 1979. Among the anions, chloride exhibited the highest concentration, followed by sulfate, bicarbonate, and carbonate, indicating significant evaporation in summer. This phenomenon leads to the relative enrichment of chloride in the surface soil layer and a decrease in the content of carbonate and bicarbonate ions, reflecting the characteristic of surface soil salinity over alkalinity. The cation distribution revealed a clear trend of greater alkali than alkaline earth metals, with sodium accounting for more than 60% of the total cations. The coefficient of variation (C.V.) values for HCO3− and Ca2+ were 100.75% and 125.16%, respectively, indicating relatively low spatial variability in the local content of carbonates. Conversely, the C.V. for Na+ + K+, Mg2+, Cl−, SO42−, and salt content generally exceeded 100%, suggesting significant spatial variability in these components. The combined effects of climate, land use type, irrigation system, and tillage practices lead to wide variation in salinity in farmland or grassland (Yao et al., 2008). The coefficients of variation for sodium, calcium, and magnesium ions ranged from 125.16% to 298.40%, indicating that the study area experiences frequent alternation between soil salt accumulation and desalination, and the exchange of sodium, calcium, and magnesium occurs in shallow soils, which can easily cause soil salinization.
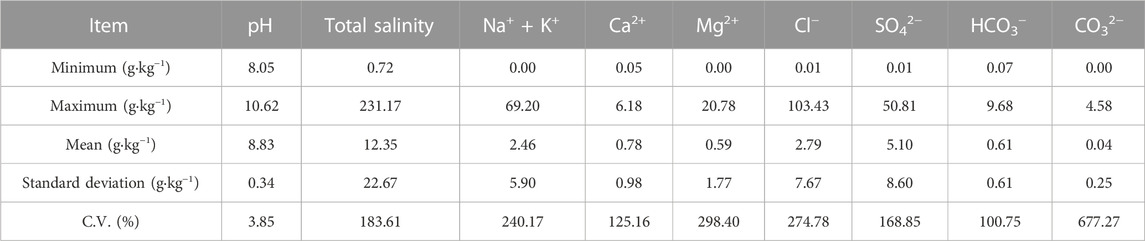
TABLE 1. Statistics of water-soluble ion content in soil and shallow groundwater.
3.1.2 Soil salinization degree and type division
Shallow soils were classified into different categories based on their salt content (Table 2) (Hosseini et al., 1994; Wu et al., 2014). To estimate the unknown attribute points optimally, the covariance function model with Kriging interpolation was utilized using finite variable change characteristics (Huang et al., 2016). The salinity content present in the soil samples was then used as interpolated data to obtain the salinity degree zoning. Based on the grading of the degree of soil salinization, the soil types were classified into chloride type, sulfate-chloride type, chloride-sulfate type, sulfate type, and alkaline type soils according to the nature of the salt-containing class (Table 3). In addition, if the soil has (2CO32− + HCO3−)/(Cl− + 2SO42−), soil salinization can also be influenced by alkalis. Preliminary calculations indicated that 29% of the soil samples had a high content of bicarbonate and carbonate ions. Therefore, it is crucial to differentiate whether the soil samples are caused by salinization or alkalinization before superimposing the soil salinity classification to obtain the soil salinity classification and type zoning (Figure 3).

TABLE 2. Salinization degree grading index.
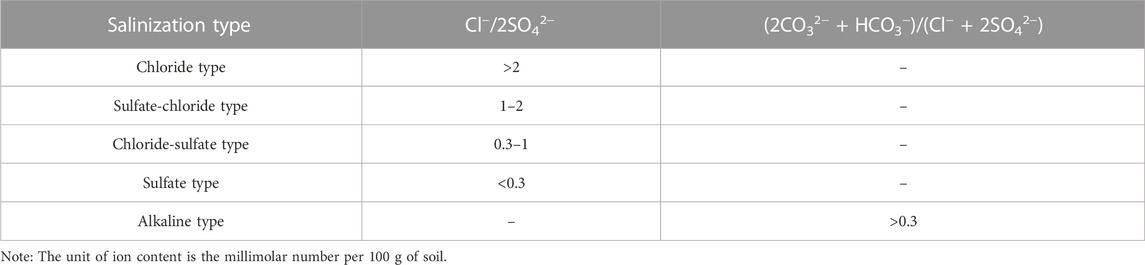
TABLE 3. Saline soil is classified by the chemical composition of salt type.
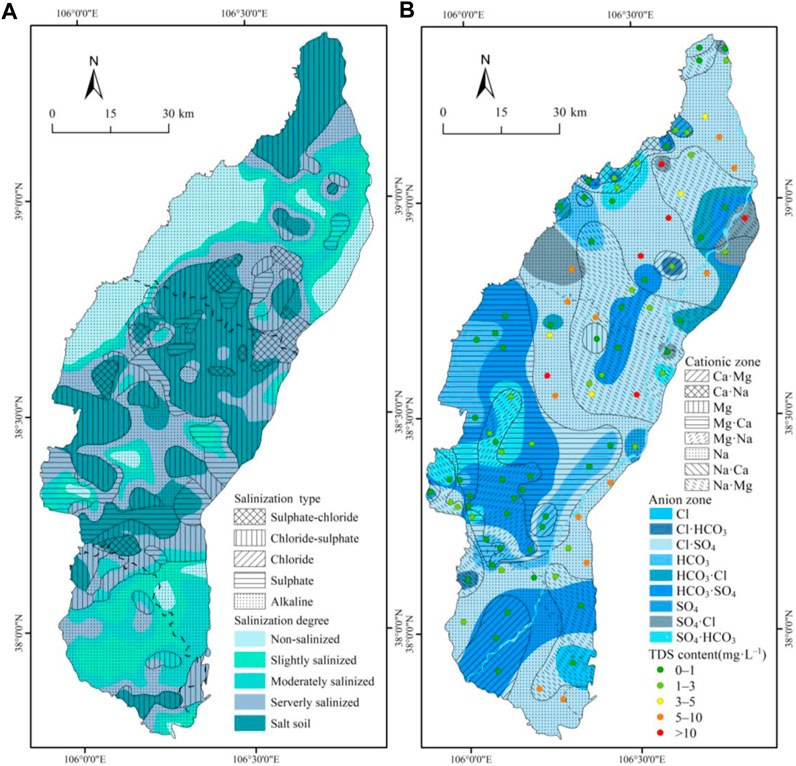
FIGURE 3. (A) Soil salinization degree and type zoning map (B) Shallow groundwater chemical type distribution map.
The accuracy of the interpolation results for soil salinity was assessed using cross-validation. Given that the interpolation results represent raster data with uniform error distribution, their accuracy was evaluated based on mean relative error (MRE) and coefficient of determination (R2) (Ta′ any et al., 2009). The interpolation results were cross-validated, and the results obtained from the interpolation error analysis were MRE = 0.0014, which was close to 0, and R2 = 0.72, which was greater than 0.5 and close to 1. Based on these results, we can conclude that the accuracy of the interpolation results met the requirements. Therefore, the soil salinity grading results obtained through Kriging interpolation can be effectively utilized for data processing and regional studies.
Based on the findings presented in Figure 3A, it is apparent that the surface layer (0–30 cm) contains a variety of soil salinization types, with alkaline saline soils being the most prevalent. These soils are widely distributed, followed by chloride-sulfate type soils, which are found in most of the northern and central regions. The absence of soil salinization in the west and north of Wuzhong City can be attributed to the influence of topography and faults. A comparison of the types and levels of soil salinization reveals that chloride-sulfate type, sulfate type, and chloride type soils dominate in the saline areas and are essentially congruent with one another. Additionally, there are sulfate-chloride type soils, some alkaline type soils, and other heavily salinized areas that also contain chloride-sulfate type and sulfate type soils as well as widespread alkaline type soils.
From the distribution of shallow groundwater chemistry types (Figure 3B), the water chemistry type is mainly Cl·SO4–Na. The anions of shallow groundwater in the Ningxia Plain are dominated by Cl·SO4 and HCO3·SO4, while cations are mainly Na·Mg and Ca·Mg type waters. The southern Ningxia Plain has a more complex water chemistry type, dominated by HCO3·SO4–Ca·Mg and Cl·SO4–Na. In the northern zone, Cl·SO4–Na·Mg is dominant, with the TDS concentrations exceeding 20 g L−1 in the central-eastern zone. High mineralization (TDS >10 g L−1) areas corresponding to groundwater chemistry types include Cl·SO4–Na, Cl·SO4–Na·Mg, and SO4·HCO3–Na·Mg, which are mainly distributed in the northern Ningxia Plain and northern Yinchuan City, which are highly consistent with the areas in the northern zone where soil salinization is severe. In general, the soil salinity aggregation process is mainly affected by chloride ions and sulfate ions, while the chloride type and sulfate-chloride type areas are saline due to the large solubility of chloride ions, which are not easily subject to adsorption or reduction reactions. Because the soil salts in the central plain are diluted by the vertical water flow of the faults, there are also areas without salinization.
3.1.3 Spatial trend effect
The normality tests of skewness and kurtosis were performed to assess the spatial distribution of soil salinity, groundwater mineralization, and water levels (Figure 4). Although the tests were normal (or log-normal), a significant trend effect was observed, which should not be overlooked in the analysis of soil salinity trend effect. The two-dimensional spatial distribution of the sampling points is represented by scattered points on the X–Y projection. Soil salinity was found to be higher in the east and northern zone and lower in the south (Figure 4A), with a trend effect varying in an arc-shaped parabola in both east-west and north-south directions, forming an inverted “U” shape. Groundwater TDS concentrations exhibited a decreasing trend from northeast to southwest (Figure 4B), while water table elevation and depth increased with a positive “U” shape (Figures 4C, D). The trend effect was generally opposited to the increasing and decreasing trend of soil salinity (Figure 4A), showing a second-order trend effect in both east-west and north-south directions. There is a close relationship among soil salinity, groundwater table, and TDS concentrations was analyzed, revealing a close correlation. The shallower the groundwater depth, the greater the groundwater TDS concentrations, and the higher the soil salinity, indicating a more severe soil salinization problem.
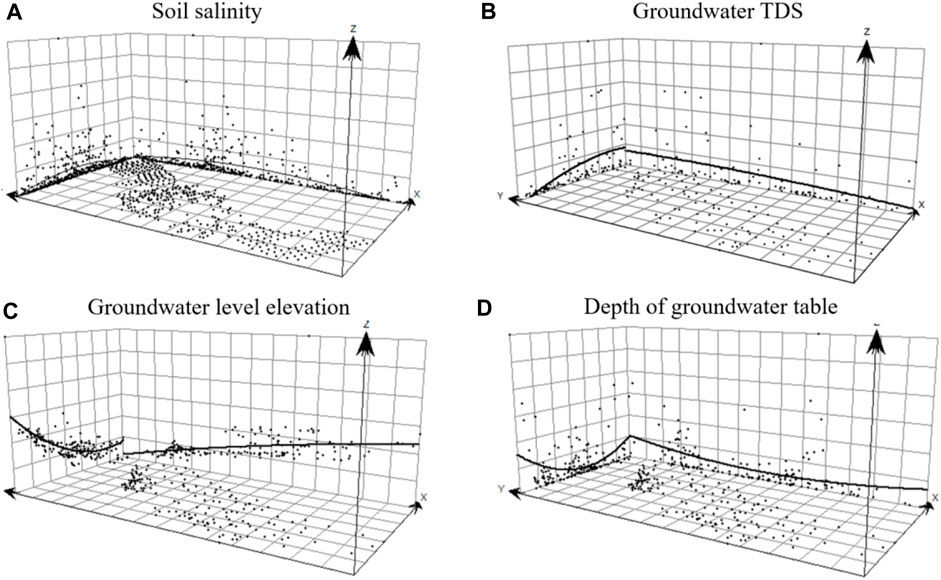
FIGURE 4. Analysis of soil salinity and groundwater soluble salt and spatial trend effect (A) Soil salinity (B) Groundwater TDS concentrations (C) Groundwater level elevation (D) Depth of groundwater table.
3.1.4 Vertical differentiation characteristics
A comparison of the vertical distribution patterns of shallow and deep soils was conducted based on shallow soil samples and deep soil samples. Statistical analysis of water-soluble salt data from both shallow and deep soils was carried out, and the results were presented in Table 4; Figure 5. The mean values of the ionic content of most of the shallow layers were found to be significantly higher than those of the deeper soils. The ratios of Na+ + K+, Ca2+, Mg2+, Cl−, SO42−, CO32−, and salinity to the content of the same components in the deeper layers ranged from 1.78 to 2.46, indicating a gradual increase in the ionic concentration of these elements with decreasing soil depth. This suggests that the surface soil elements were enriched by evaporation. In contrast, the ratios of mean HCO3− and pH concentrations in the surface and deep soils were 1.05 and 1.00, respectively, indicating that there was no significant surface enrichment of HCO3− in the vertical direction.
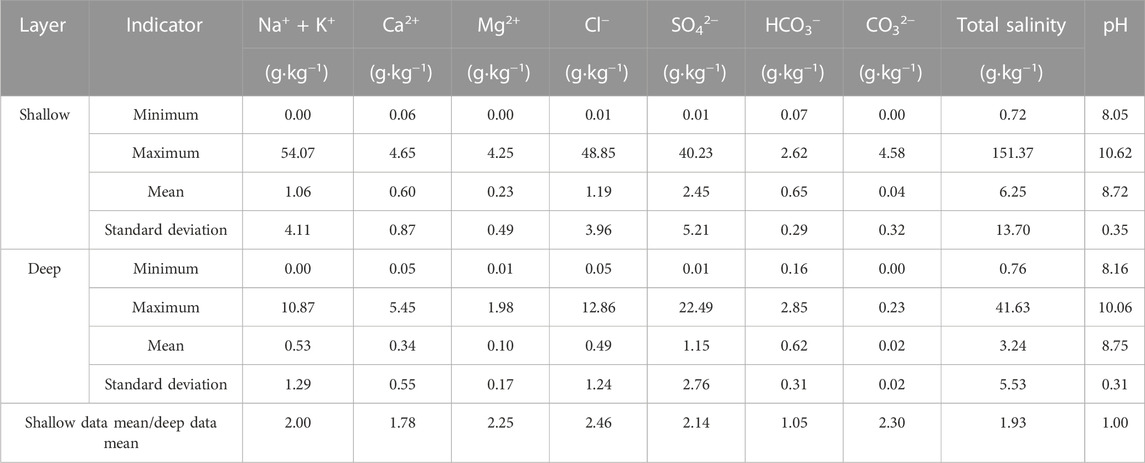
TABLE 4. Statistics of soil salt ions at different depths.
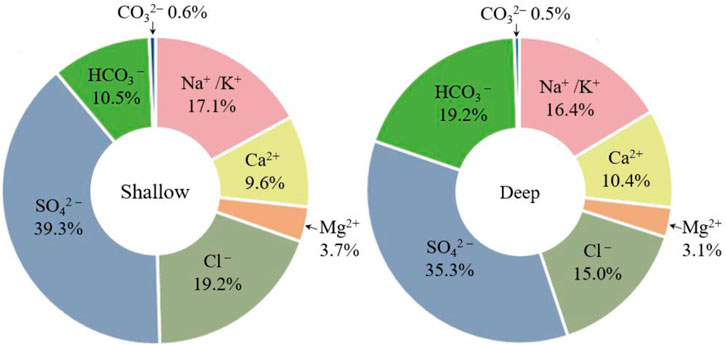
FIGURE 5. Soil salt ion pie chart at different depths.
The present study investigated the ion composition of soil, with a focus on the vertical distribution of ions. SO42− was found to be the most abundant anion, representing 35.3%–39.3% of the ion concentration in each soil layer, whereas CO32− was present in the lowest concentration, accounting for only 0.6%–0.9% of the ion concentration (Figure 6). Despite the significantly higher ion content in the shallow soil, the ratio of individual ions did not change significantly. Interestingly, the proportion of HCO3− in the deep soil increased by 8.7%, whereas the proportions of SO42− and Cl− decreased by 4% and 4.2%, respectively. The proportions of Ca2+, Na+ + K+, CO32− and Mg2+ remained largely unchanged. A comparison of shallow and deep soil data from sampling sites near A–A′ indicated that the ion content was generally higher in shallow soils, with the exception of pH, which did not differ significantly between the two layers. This suggests that salt ions are primarily concentrated near the soil surface.
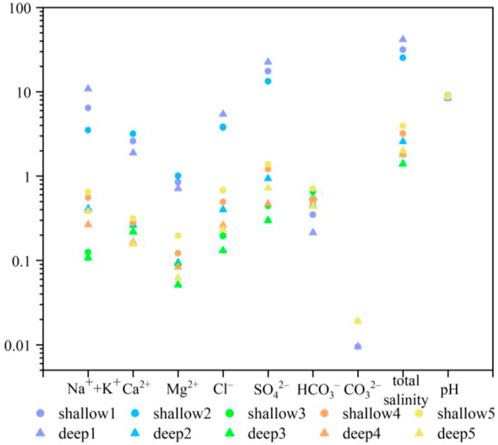
FIGURE 6. Soil vertical differentiation characteristics from sampling sites (g·kg−1).
3.2 Analysis of soil characteristics
3.2.1 CA method
The results in Table 5 indicate that Na+ + K+ in soil had a highly significant positive correlation with Cl− and SO42− at the 0.01 level, while Ca2+, Mg2+, and Cl− showed a highly significant positive correlation with SO42− at the 0.01 level. Salinity was highly significantly and positively correlated with Na+ + K+, Cl−, and SO42− at the 0.01 level, highly significantly and positively correlated with Mg2+ at the 0.01 level, and moderately significantly and positively correlated with Ca2+ at the 0.01 level. The total alkalinity of the soil was significantly and linearly correlated with HCO3−, however, the low CO32− content had minimal impact on total alkalinity. Furthermore, the high salinity, which affects the exchange of salt groups, plays a role in inhibiting soil alkalinization, resulting in soil acidity and alkalinity appearing weakly basic. The salinity of the soils is mainly influenced by Na+ + K+, Cl−, SO42−, and Mg2+ ions, and to some extent by Ca2+. These results support the fact that the heavily salinized areas are mainly chloride type and sulfate type soils.
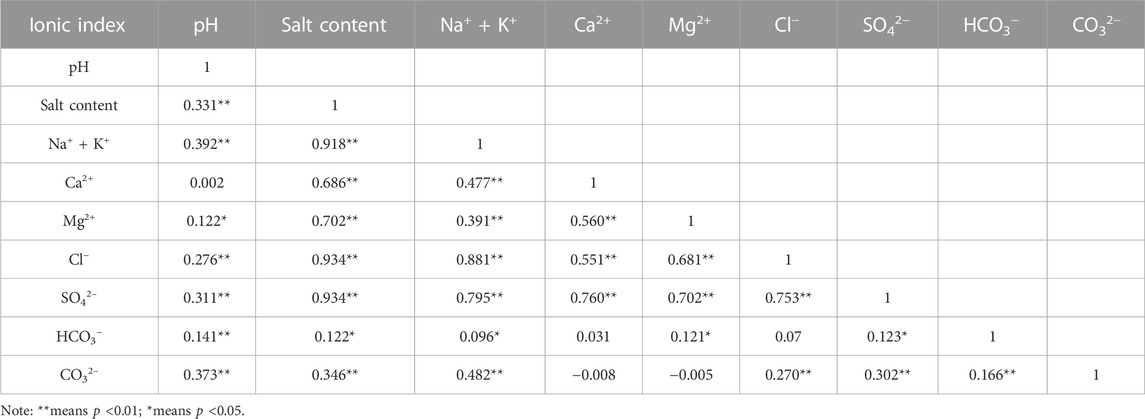
TABLE 5. Person correlation coefficient matrix of shallow soil salt ions.
Supplement: HCO3− was generally detected, while CO32− was only partially detected or rarely detected.
3.2.2 FA method
Table 6 gives the eigenvalues of the composition coefficient matrix of the groundwater water chemistry test data and their contribution to the variance. When the eigenvalues are greater than 1, two main factors can be selected with a cumulative contribution of 70.37%, and the analysis of the factors is satisfactory and can reflect the vast majority of the basic water chemistry information of the overall samples.
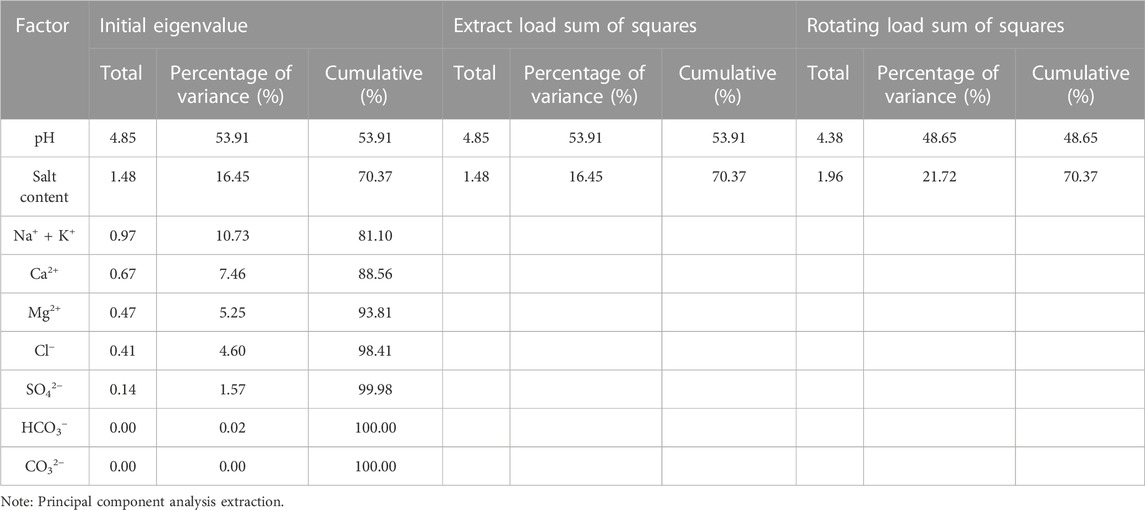
TABLE 6. Table of eigenvalues and cumulative contribution rate.
Following three iterations using the maximum variance rotation method, this study classified a total of two factors for the soil salinity components, which are presented in Table 7. The primary factor, denoted as A, comprised of salinity, SO42−, Cl−, Ca2+, Mg2+, and Na+ + K+, accounting for 53.91% of the variance. This suggests that these components are the dominant factors governing shallow soil salinity, as reported by Cloutier et al. (2008). Moreover, salinity and SO42– scored over 0.9, indicating that soil salinity types mainly involve sulfates and chlorides, with Cl−, Ca2+, and Mg2+ also scoring above 0.8. In the context of geosystem analysis, principal factor A emerges as the primary component of soil salinity, serving as a comprehensive indicator of the soil’s salinity status. The ion content that corresponds to the components in principal factor A is also high in shallow groundwater, emphasizing its role in reflecting the influence of shallow groundwater on soil salinization. Conversely, the secondary factor B encompasses CO32−, pH, and HCO3−, accounting for 16.45% of the variance. Here, pH scores 0.735, CO32− scores over 0.8, while Ca2+ and Mg2+ scores are −0.167 and −0.084, respectively, and negative. These findings suggest that an increase in pH inhibits the dissolution of alkaline earth metals in the soil, indicating that the F2 factor represents the effect of soil pH and atmospheric environment on the dissolution of different minerals. Based on the actual situation and the significant degree of correlation between the factors, salinity, SO42−, Cl−, Ca2+, Mg2+, and Na+ + K+ can be considered characteristic factors for analyzing the soil salinization status.
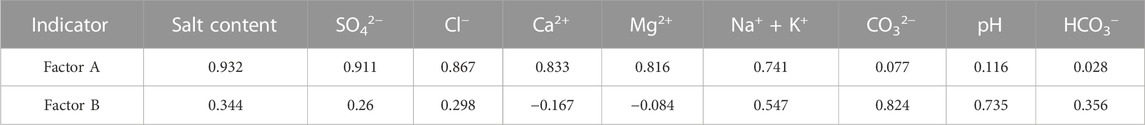
TABLE 7. Factor loading matrix after three times of maximum variance rotation.
3.2.3 GRA method
Our analysis revealed that Cl−, SO42−, Na+ + K+, Ca2+, Mg2+, CO32−, pH, HCO3−, and TDS concentrations were significantly correlated with soil salinity (Figure 7). Specifically, the correlation between Cl−, SO42−, and Na+ + K+ was higher than 0.9, whereas the correlation between Ca2+ and Mg2+ was approximately 0.7, indicating a significant correlation between Cl−, SO42–, and Na+ + K+, and soil salinization. Overall, Cl−, SO42−, Na+ + K+, Ca2+, and Mg2+ were found to have a significant impact on soil salinity, while CO32−, pH, HCO3−, and TDS concentrations exhibited a relatively smaller effect.
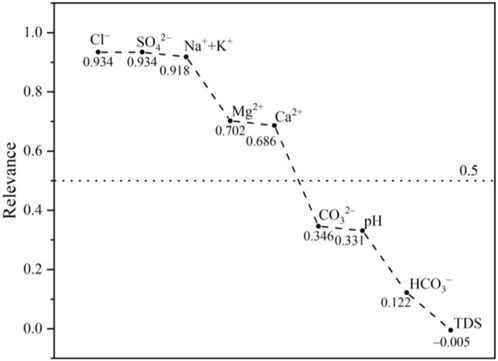
FIGURE 7. Correlation between soil salt content and ion characteristics.
3.3 Hydrochemical characteristics of groundwater
The current investigation involved the statistical analysis of collected groundwater samples, which are detailed in Table 8. The pH values of the shallow groundwater ranged from 6.87 to 8.78 with a neutral-alkaline water mean value of 7.67. The mean value of TDS concentrations was 4,615.90 mg L−1, with a wide range of 214.00–28,164.00 mg L−1. The cationic content of the samples was dominated by Na+ + K+ with a mean concentration of 1,015.90 mg L−1, while the anionic content was dominated by Cl− and SO42−, with mean concentrations of 1849.70 mg L−1 and 654.27 mg L−1, respectively. The C.V. values for TDS concentrations, Na+ + K+, Mg2+, Cl− and SO42− generally exceeded 100%, suggesting that the soil and groundwater are influenced by multiple sources and complex hydrogeochemistry. The high coefficient of variation for CO32− was due to its detection in only 3.16% of the groundwater samples, with most samples below the detection limit of 0.82 mg L–1. Furthermore, the wide range of variation in Cl−and SO42– values in shallow groundwater, with maximum values of 12,195.51 mg L–1 and 6,797.57 mg L–1, respectively, may be attributed to irrigation. The high solubility of Cl−makes it more easily transported to groundwater, while the variability in Na+ + K+ may be related to groundwater evaporation intensity or cation exchange with soil ions. The significant spatial variability of the aforementioned components highlights the complexity of hydrogeochemical processes.
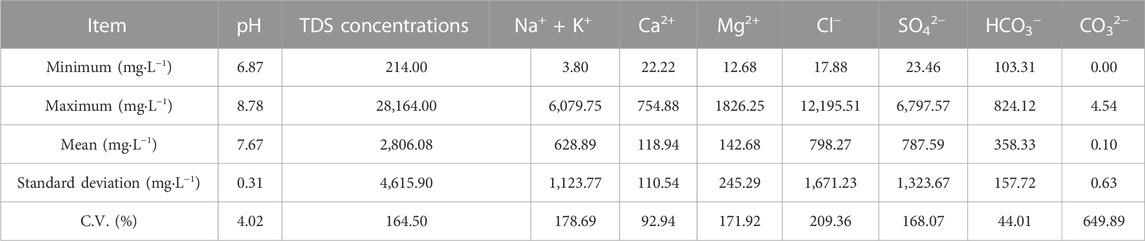
TABLE 8. Statistics of water-soluble ion content in shallow groundwater.
In conjunction with the Piper diagram (Figure 8), it was found that salt, saline, and some brackish water exhibit a dominance of non-carbonate alkali metals, with groundwater types being predominantly Cl·SO4–Na·Mg. Conversely, in most saline water and salt water, Ca2+, Mg2+, and other alkaline earth metal cations account for more than 50% of the total cations, resulting in groundwater types of SO4·HCO3–Ca·Mg or SO4·Cl–Ca·Mg. The sample points of saline water and salt water exhibit a higher concentration, with a water chemistry type of Cl–Na·Mg. It was further observed that the shallow groundwater transitioned from weak acids to stronger acids with increasing TDS concentrations, such as from HCO3− to SO42– and Cl−. These results suggest that the groundwater is influenced by complex hydrogeochemical processes and multiple sources.
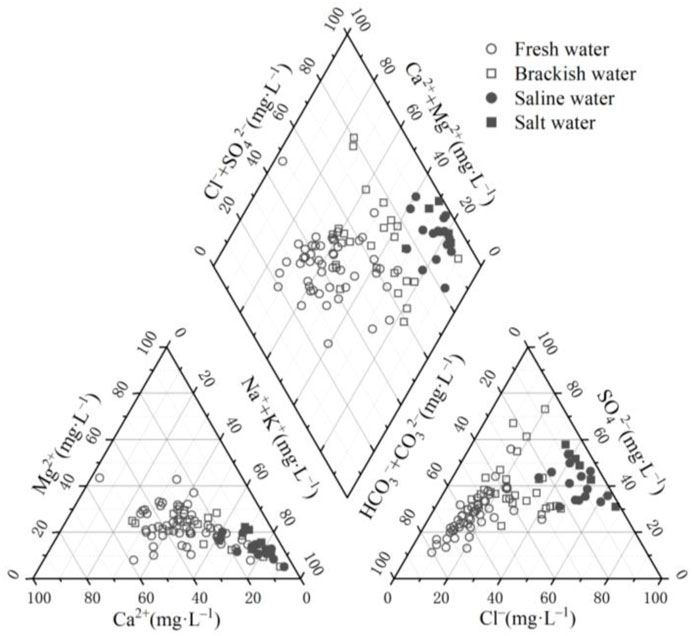
FIGURE 8. Piper three-line diagram of shallow groundwater.
4 Discussions
4.1 Analysis of ion sources
This study focuses exclusively on shallow groundwater, which is known to be influenced by several factors beyond water-rock interaction. Overall, the majority of shallow groundwater samples analyzed exhibit a higher placement on the Gibbs diagram (Figure 9), indicating the influence of evaporation, concentration, and water-rock interaction. However, a few samples are situated outside the diagram and are heavily influenced by human activities and evaporation. In particular, most of the samples in TDS–Na+/(Na+ + Ca2+) appear on the right-hand side, and nearly half of the groundwater samples exhibit a Na+/(Na+ + Ca2+) ratio exceeding 0.7, suggesting the impact of cation exchange on the chemical composition of shallow groundwater. The TDS–Cl−/(Cl− + HCO3−) data points exhibit a more scattered distribution and gradually transition from the water-rock interaction zone to the evaporative concentration crystallization zone.
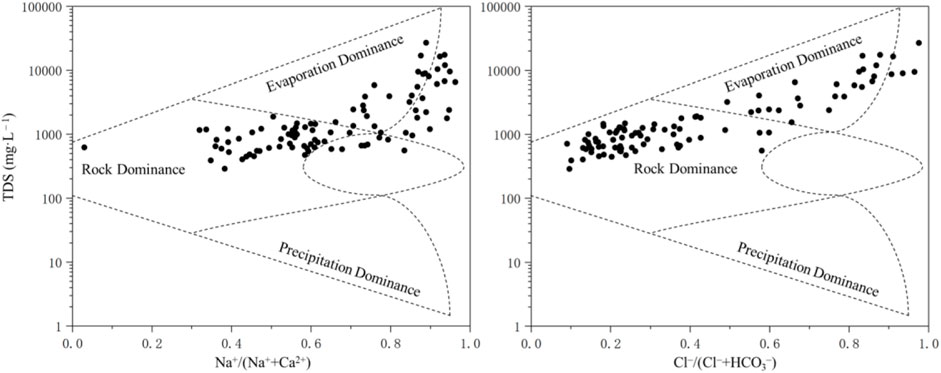
FIGURE 9. Gibbs diagram of shallow groundwater.
The dissolution/precipitation process in the evolution of groundwater chemistry was further analyzed by examining the relationship between the saturation index and TDS concentrations, as presented in Figure 10. The results indicate that the calcite and dolomite have reached over-saturation with the SI >0. Gypsum of 9 samples has reached over-saturation with the SI >0, accounting for 9.47% of the samples, with the TDS concentrations of 5,858.87–26853.33 mg L–1. The dissolution behavior of halite and most of the gypsum occurred at lower TDS concentrations. Notably, the SI of most minerals increased with the increasing TDS concentrations, except for gypsum, which remained almost unchanged when TDS concentrations exceeded 5,000 mg L–1. These findings suggest that halite and gypsum in groundwater are the primary sources of the groundwater’s chemical components.
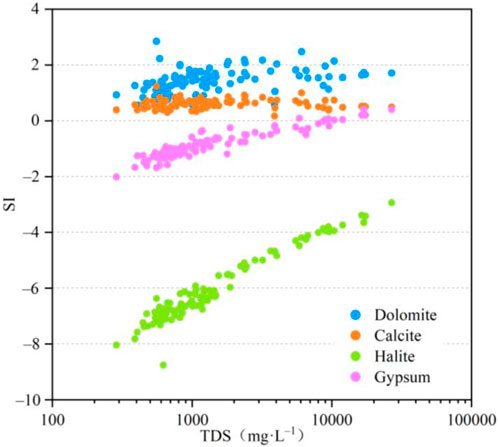
FIGURE 10. The relationship between mineral SI and TDS concentrations in shallow groundwater.
4.2 Relationship between soil salinization and hydrogeochemical process
The cross-section of A–A′, passing through the region with the most severe soil salinization, is situated in the northern part of Yinchuan City. Figure 11 illustrates the profile passing through the piedmont proluvial inclined plain, alluvial-lacustrine plain, and Yellow River, progressing from west to east. The predominant soil salinization type observed is chloride-sulphate, with increasing complexity from simpler to more intricate soil structures. The degree of soil salinization increases from the pre-mountain floodplain to the Yellow River alluvial plain and subsequently decreases. Moreover, the type of groundwater dynamics changes from runoff to evaporation, with the most severe areas concentrated between Hongguang and Yaofu. The composition of groundwater is multifaceted, exhibiting a pattern of initial TDS concentrations increase followed by subsequent decrease.
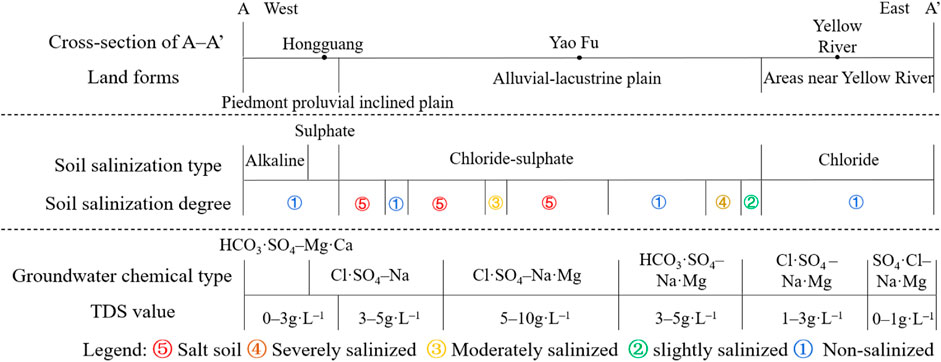
FIGURE 11. Relationship between soil salinization and hydrogeochemical evolution.
In the piedmont proluvial inclined plain, the majority of soils are non-salinized or slightly to moderately salinized, with sulfate being the predominant soil salt. Salinity types in the area include sulfate type, chloride-sulfate type, and alkaline type soils. Groundwater in this region is deep and has weak evaporation, with TDS concentrations of less than 6 g L–1, and its chemistry is primarily of the Cl·SO4–Na type. In the next subzone, the groundwater chemistry shifts to the Cl·SO4–Na·Mg type, suggesting that Na+ exchanges cations with Mg2+ in dolomite, while Ca2+ reacts with carbonate ions to form the mineral. The alkaline type soil located in the westernmost region corresponds to the main groundwater anions HCO3− and SO42–, indicating that stronger leaching or infiltration in this area dissolved the carbonate rocks, which increased the HCO3− content of groundwater. This is also related to the pre-mountain lithology containing a large number of sand and gravel layers (Qian et al., 2012).
The alluvial–lacustrine plain is a typical area for soil salinization, and the severity of the salinization typically ranges from moderate to severe. The salinization type of soil is primarily chloride-sulfate. Groundwater in this region is relatively shallow, ranging from 1 to 3 m deep, with a TDS concentration of approximately 6–10 g L–1, and the groundwater chemistry type is predominantly Cl·SO4–Na·Mg. Poor hydraulic connectivity is one factor contributing to the accumulation of soil salinity (Rengasamy, 2006), while the flat and low-lying topography also hinders drainage, leading to groundwater and severe soil salinization (Giambastiani et al., 2020).
The soil salinization degree gradually decreases towards areas near the Yellow River, where the soil salinization type changes to chloride type soils with fine sand at a shallow depth of 5 m. The groundwater types show a shift from simple to complex chemistry as one move from west to east, ranging from HCO3·SO4–Na·Mg to Cl·SO4–Na·Mg and SO4·Cl–Na·Mg. It is noteworthy that the influence of the Yellow River leads to a TDS concentrations of less than 1 g L–1 near the Yellow River, which results in less salt accumulation in the soil due to the evaporation of groundwater, and these observations are in line with previous findings reported by Fan et al. (2012).
4.3 Evolution model of soil salinization
The overall direction of groundwater flow is from the pre-mountain area on the western side towards the lowlands of the eastern plain, making it an excellent representation of the relationship between soil salinization and hydrogeochemical characteristics (Figure 12). In different sections, the main control factors of soil salinization are different.
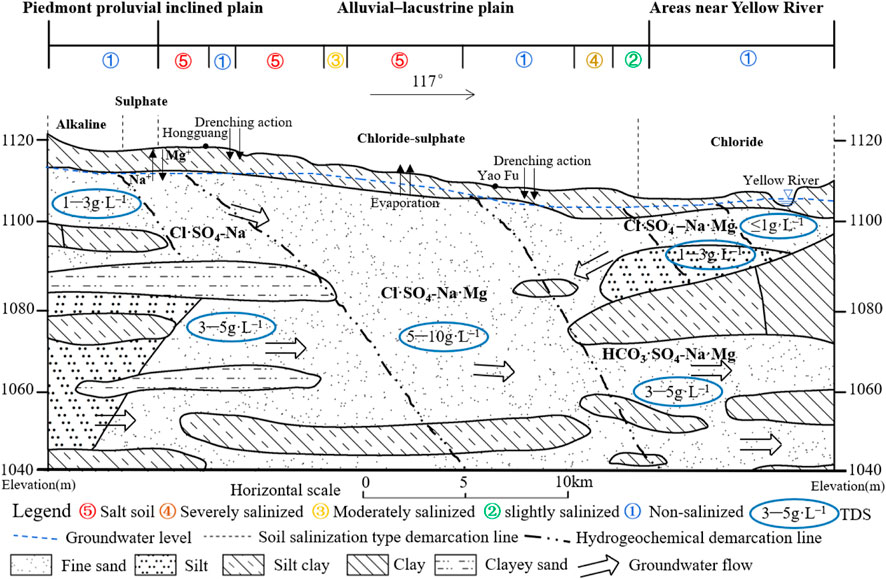
FIGURE 12. Hydrogeological cross-section map of A–A′.
In the piedmont proluvial inclined plain, the terrain is high and the groundwater depth is deep, so the degree of soil salinization is low. The aggregation of soil salinity is primarily influenced by the soil-forming parent material, as well as the dilution of surface salts by the lateral inflow of seasonal rivers and groundwater from the Helan Mountains to the west. In the alluvial–lacustrine plain, the accumulation of soil salinity is mainly due to the strong evaporation of shallow groundwater, which is further aggravated by continental salinization and salt accumulation in the soil. The shallow groundwater table depth first increases and then decreases in this area, leading to an increased leaching effect and a corresponding increase in the HCO3− ion content in the groundwater, while the TDS concentrations of groundwater decreases. In the area near the Yellow River, groundwater and soil are affected by the lateral leakage of the Yellow River, and the degree of soil salinization and groundwater TDS concentrations are low. The soil and groundwater characteristics and their relationships conclude that the development of soil salinization is primarily influenced by the relatively low-lying plain landform and evaporation of shallow groundwater, leading to the accumulation of soil salt.
5 Summary and conclusion
After a comprehensive investigation of soil ion content and distribution characteristics and groundwater water-salt characteristics, the study drew the following conclusions through the application of geostatistical methods, multivariate statistical, and water chemical analysis methods.
(1) The majority of surface soils exhibit characteristics of alkaline type soils, followed by the chloride-sulfate type soils. Fresh and brackish groundwater types are dominated by SO4·HCO3–Ca·Mg or SO4·Cl–Ca·Mg, while saline water and saltwater hydrochemical types are Cl–Na·Mg or Cl·SO4–Na·Mg. The contents of major ions and salt in deep soil increased with the decrease of depth. Surface soil elements, on the other hand, are enriched by evaporation. The opposite spatial trends of increasing groundwater depth and TDS concentrations, and decreasing soil salinity indicate a second-order trend effect and a close interconnection between them. The shallower groundwater depth, the higher groundwater TDS concentrations and soil salinity, which suggests that soil salt accumulates seriously to the surface.
(2) We have obtained a conclusion on soil salinization. The salinity of the soil is primarily influenced by Na+ + K+, Cl−, SO42–, and Mg2+ ions in descending order of importance, while Ca2+ ions also have a certain level of impact. The significant correlation between salinity, SO42–, Cl−, Ca2+, Mg2+, and Na+ + K+ factors suggests that these are characteristic elements that can be used to analyze soil salinization. Among these factors, Cl−, SO42–, Na+ + K+, Ca2+, and Mg2+ were found to have a significant impact on soil salinity, while CO32–, pH, HCO3− and TDS concentrations exhibited a comparatively minor effect.
(3) The degree and types of soil salinization vary across the examined region, from the piedmont proluvial inclined plain to the alluvial lake plain to the vicinity of the Yellow River. The pattern of salinization first increases and then decreases, with the complexity of the soil salinization types also varying. Groundwater dynamics shift from runoff to evaporation, with a similar trend of TDS concentrations. The main control factors of soil salinization differ across the various sections. In the piedmont proluvial inclined plain, the accumulation of soil salt is mainly influenced by the soil’s parent material formation and the dilution of surface salt through the horizontal inflow of seasonal rivers and groundwater from the Helan Mountains to the west. Conversely, in the alluvial lake plain, the accumulation of soil salt is primarily due to the intense evaporation of shallow groundwater, which is further compounded by continental salinization and soil salt accumulation. Finally, in the region close to the Yellow River, the lateral leakage of the river affects both groundwater and soil, leading to relatively low levels of soil salinization and groundwater TDS concentrations.
Data availability statement
The datasets presented in this article are not readily available because author does not have permission to share data. Requests to access the datasets should be directed to Z2FvbXNoNjZAc29odS5jb20=.
Author contributions
ZL performed “writing—original draft”; MG contributed to “writing—review and editing”; QS contributed to “writing—review and editing”; GH contributed to “investigation and software”; YZ contributed to “visualization and methodology.” All authors contributed to the article and approved the submitted version.
Funding
This study was financially supported by the National Natural Science Foundation of China (U2106203 and 41977173), the Ningxia Hui Autonomous Region Geological Survey Institute Yinchuan Metropolitan Area Urban Geological Survey [Ning Cai (Zihuan) provide (2021) No. 21] and the National Geological Survey Project of China Geology Survey (Nos DD20221775 and DD20211401). The China-ASEAN maritime cooperation fund (Cooperative researches on the marine geo-environments and geo-hazards in the Yangtze River and the Red River deltas).
Conflict of interest
The authors declare that the research was conducted in the absence of any commercial or financial relationships that could be construed as a potential conflict of interest.
Publisher’s note
All claims expressed in this article are solely those of the authors and do not necessarily represent those of their affiliated organizations, or those of the publisher, the editors and the reviewers. Any product that may be evaluated in this article, or claim that may be made by its manufacturer, is not guaranteed or endorsed by the publisher.
References
Abd El-Hamid, H. T., and Hong, G. (2020). Hyperspectral remote sensing for extraction of soil salinization in the northern region of Ningxia. Model. Earth Syst. Environ. 6, 2487–2493. doi:10.1007/s40808-020-00829-3
Acosta, J. A., Faz, A., Jansen, B., Kalbitz, K., and Martínez-Martínez, S. (2011). Assessment of salinity status in intensively cultivated soils under semiarid climate, Murcia, SE Spain. J. Arid Environ. 75 (11), 1056–1066. doi:10.1016/j.jaridenv.2011.05.006
Akramkhanov, A., Martius, C., Park, S. J., and Hendrickx, J. M. H. (2011). Environmental factors of spatial distribution of soil salinity on flat irrigated terrain. Geoderma 163 (1-2), 55–62. doi:10.1016/j.geoderma.2011.04.001
Aragüés, R., Medina, E. T., Zribi, W., Clavería, I., Álvaro-Fuentes, J., and Faci, J. (2015). Soil salinization as a threat to the sustainability of deficit irrigation under present and expected climate change scenarios. Irrigation Sci. 33, 67–79. doi:10.1007/s00271-014-0449-x
Cay, T., and Uyan, M. (2009). Spatial and temporal groundwater level variation geostatistical modeling in the city of Konya, Turkey. Water Environ. Res. 81 (12), 2460–2470. doi:10.2175/106143009X442961
Chandio, A. S., Lee, T. S., and Mirjat, M. S. (2013). Simulation of horizontal and vertical drainage systems to combat waterlogging problems along the Rohri Canal in Khairpur District, Pakistan. J. irrigation drainage Eng. 139 (9), 710–717. doi:10.1061/(ASCE)IR.1943-4774.0000590
Chen, H., Huo, Z., Zhang, L., and White, I. (2020). New perspective about application of extended Budyko formula in arid irrigation district with shallow groundwater. J. Hydrology 582, 124496. doi:10.1016/j.jhydrol.2019.124496
Cloutier, V., Lefebvre, R., Therrien, R., and Savard, M. M. (2008). Multivariate statistical analysis of geochemical data as indicative of the hydrogeochemical evolution of groundwater in a sedimentary rock aquifer system. J. Hydrology 353 (3-4), 294–313. doi:10.1016/j.jhydrol.2008.02.015
Corwin, D. L. (2021). Climate change impacts on soil salinity in agricultural areas. Eur. J. Soil Sci. 72 (2), 842–862. doi:10.1111/ejss.13010
Cui, G., Lu, Y., Zheng, C., Liu, Z., and Sai, J. (2019). Relationship between soil salinization and groundwater hydration in Yaoba Oasis, Northwest China. Water 11 (1), 175. doi:10.3390/w11010175
Davoodi, K., Darzi-Naftchali, A., and Aghajani-Mazandarani, G. (2019). Evaluating drainmod-s to predict drainage water salinity and groundwater table depth during winter cropping in heavy-textured paddy soils. Irrigation Drainage 68 (3), 559–572. doi:10.1002/ird.2339
Fan, X., Pedroli, B., Liu, G., Liu, Q., Liu, H., and Shu, L. (2012). Soil salinity development in the yellow river delta in relation to groundwater dynamics. Land Degrad. Dev. 23 (2), 175–189. doi:10.1002/ldr.1071
Giambastiani, B. M. S., Macciocca, V. R., Molducci, M., and Antonellini, M. (2020). Factors affecting water drainage long-time series in the salinized low-lying coastal area of ravenna (Italy). Water 12 (1), 256. doi:10.3390/w12010256
Gibbs, R. J. (1970). Mechanisms controlling world water chemistry. Science 170 (3962), 1088–1090. doi:10.1126/science.170.3962.1088
He, J., Den, Q., Ma, X., Su, X., and Ma, X. (2021). Soil salinization affected by hydrogeochemical processes of shallow groundwater in Cangzhou City, a coastal region in North China. Hydrology Res. 52 (5), 1116–1131. doi:10.2166/nh.2021.183
Hosseini, E., Gallichand, J., and Marcotte, D. (1994). Theoretical and experimental performance of spatial interpolation methods for soil salinity analysis. Trans. ASAE 37 (6), 1799–1807. doi:10.13031/2013.28269
Hu, X. W. (2008). Study of relationship between the soil-salinization and the change of groundwater environment in Yutian oasis. Xinjiang, China: Xinjiang University.
Ibrahimi, M. K., Miyazaki, T., Nishimura, T., and Imoto, H. (2014). Contribution of shallow groundwater rapid fluctuation to soil salinization under arid and semiarid climate. Arabian J. Geosciences 7, 3901–3911. doi:10.1007/s12517-013-1084-1
Ibrakhimov, M., Khamzina, A., Forkutsa, I., Paluasheva, G., Lamers, J. P. A., Tischbein, B., et al. (2007). Groundwater table and salinity: spatial and temporal distribution and influence on soil salinization in Khorezm region (Uzbekistan, Aral Sea Basin). Irrigation Drainage Syst. 21, 219–236. doi:10.1007/s10795-007-9033-3
Jordán, M. M., Navarro-Pedreno, J., García-Sánchez, E., Mateu, J., and Juan, P. (2004). Spatial dynamics of soil salinity under arid and semi-arid conditions: geological and environmental implications. Environ. Geol. 45, 448–456. doi:10.1007/s00254-003-0894-y
Juan, P., Mateu, J., Jordan, M. M., Mataix-Solera, J., Meléndez-Pastor, I., and Navarro-Pedreño, J. (2011). Geostatistical methods to identify and map spatial variations of soil salinity. J. Geochem. Explor. 108 (1), 62–72. doi:10.1016/j.gexplo.2010.10.003
Li, P., Qian, H., and Wu, J. (2018). Conjunctive use of groundwater and surface water to reduce soil salinization in the Yinchuan Plain, North-West China. Int. J. Water Resour. Dev. 34 (3), 337–353. doi:10.1080/07900627.2018.1443059
Litalien, A., and Zeeb, B. (2020). Curing the earth: a review of anthropogenic soil salinization and plant-based strategies for sustainable mitigation. Sci. Total Environ. 698, 134235. doi:10.1016/j.scitotenv.2019.134235
Machado, R. M. A., and Serralheiro, R. P. (2017). Soil salinity: effect on vegetable crop growth. Management practices to prevent and mitigate soil salinization. Horticulturae 3 (2), 30. doi:10.3390/horticulturae3020030
Marandi, A., and Shand, P. (2018). Groundwater chemistry and the Gibbs diagram. Appl. Geochem. 97, 209–212. doi:10.1016/j.apgeochem.2018.07.009
Mas-Pla, J., Menció, A., and Folch, A. (2013). Analyzing groundwater resources availability using multivariate analysis in the Selva Basin (NE Spain). Procedia Earth Planet. Sci. 7, 582–585. doi:10.1016/j.proeps.2013.03.111
McCallum, A. M., Andersen, M. S., Giambastiani, B. M., Kelly, B. F., and Ian Acworth, R. (2013). River–aquifer interactions in a semi-arid environment stressed by groundwater abstraction. Hydrol. Process. 27 (7), 1072–1085. doi:10.1002/hyp.9229
O'Shea, B., and Jankowski, J. (2006). Detecting subtle hydrochemical anomalies with multivariate statistics: an example from ‘homogeneous’ groundwaters in the great artesian basin, Australia. Hydrological Process. Int. J. 20 (20), 4317–4333. doi:10.1002/hyp.6177
Parkhurst, D. L., and Appelo, C. A. J. (2013). Description of input and examples for PHREEQC version 3—A computer program for speciation, batch-reaction, one-dimensional transport, and inverse geochemical calculations. U. S. Geol. Surv. Tech. methods 6 (A43), 497. doi:10.3133/tm6A43
Qian, H., Li, P., Howard, K. W., Yang, C., and Zhang, X. (2012). Assessment of groundwater vulnerability in the Yinchuan Plain, northwest China using OREADIC. Environ. Monit. Assess. 184, 3613–3628. doi:10.1007/s10661-011-2211-7
Rengasamy, P. (2006). World salinization with emphasis on Australia. J. Exp. Bot. 57 (5), 1017–1023. doi:10.1093/jxb/erj108
Song, Y., Qian, F., Gao, Y., Huang, X., Wu, J., and Yu, H. (2015). PHREEQC program-based simulation of magnesium phosphates crystallization for phosphorus recovery. Environ. Earth Sci. 73, 5075–5084. doi:10.1007/s12665-015-4340-8
Ta′ any, R. A., Tahboub, A. B., and Saffarini, G. A. (2009). Geostatistical analysis of spatiotemporal variability of groundwater level fluctuations in amman–zarqa basin, Jordan: A case study. Environ. Geol. 57, 525–535. doi:10.1007/s00254-008-1322-0
Tong, S., Zhang, J., Bao, Y., Wurina, , Terigele, , Weilisi, , et al. (2017). Spatial and temporal variations of vegetation cover and the relationships with climate factors in Inner Mongolia based on GIMMS NDVI3g data. J. Arid Land 9, 394–407. doi:10.1007/s40333-017-0016-4
Wang, J., Ding, J., Yu, D., Ma, X., Zhang, Z., Ge, X., et al. (2019). Capability of Sentinel-2 MSI data for monitoring and mapping of soil salinity in dry and wet seasons in the Ebinur Lake region, Xinjiang, China. Geoderma 353, 172–187. doi:10.1016/j.geoderma.2019.06.040
Wu, J., Li, P., Qian, H., and Fang, Y. (2014). Assessment of soil salinization based on a low-cost method and its influencing factors in a semi-arid agricultural area, northwest China. Environ. Earth Sci. 71, 3465–3475. doi:10.1007/s12665-013-2736-x
Yao, R., Yang, J., Jiang, L., and Chen, D. (2008). Profile characteristics and satellite distribution of soil salinity basing on heterocyclic analyses. Acta Pedologica Sinica 1, 56–65.
Yu, X., Xin, P., and Hong, L. (2021). Effect of evaporation on soil salinization caused by ocean surge inundation. J. Hydrology 597, 126200. doi:10.1016/j.jhydrol.2021.126200
Keywords: Ningxia Plain, soil salinization, groundwater hydrochemistry, evolution model, TDS
Citation: Liu Z, Gao M, Sun Q, Hou G and Zhao Y (2023) Formation and evolution of soil salinization based on multivariate statistical methods in Ningxia Plain, China. Front. Earth Sci. 11:1186779. doi: 10.3389/feart.2023.1186779
Received: 15 March 2023; Accepted: 24 July 2023;
Published: 15 August 2023.
Edited by:
Yunhui Zhang, Southwest Jiaotong University, ChinaReviewed by:
Noura Bakr, National Research Centre, EgyptRafat Ramadan Ali, National Research Centre, Egypt
Copyright © 2023 Liu, Gao, Sun, Hou and Zhao. This is an open-access article distributed under the terms of the Creative Commons Attribution License (CC BY). The use, distribution or reproduction in other forums is permitted, provided the original author(s) and the copyright owner(s) are credited and that the original publication in this journal is cited, in accordance with accepted academic practice. No use, distribution or reproduction is permitted which does not comply with these terms.
*Correspondence: Maosheng Gao, Z2FvbXNoNjZAc29odS5jb20=