 Ziwei Wang1
 Jun Liu
94% of researchers rate our articles as excellent or good
Learn more about the work of our research integrity team to safeguard the quality of each article we publish.
Find out more
ORIGINAL RESEARCH article
Front. Earth Sci., 07 July 2023
Sec. Environmental Informatics and Remote Sensing
Volume 11 - 2023 | https://doi.org/10.3389/feart.2023.1185936
This article is part of the Research TopicAdvances in Fluid-Solid Coupling Processes between Fractures and Porous Rocks: Experimental and Numerical InvestigationView all 11 articles
Enhanced geothermal systems (EGSs) are expected to be one of the most promising methods of supplying energy to meet the world’s increasing energy demand. However, little attention has been paid to the influence of the number of production wells on the heat extraction performance of an EGS. A series of numerical simulations is organized in this work with three cases: Case 1 (one production well), Case 2 (two production wells), and Case 3 (three production wells). The results indicate that a slight temperature difference exists among the three simulation cases at the planes X-Y (Z = 0) and Y-Z (X = 0), while Case 1 ensures a greater cooling area, and the more production wells, the smaller the cooling area during the heat extraction in plane X-Z (Y = 0). In addition, the continuous injection of cooling water from the injection well and its arrival at different reference points enable the temperature at each point to declining with a variable amplitude of variation. This work also sets an efficiency (ef) to investigate the temperature variation in the EGS, where Case 1 exhibits a similar variation as Case 2, which is also similar to Case 3. It is hoped that this work will play a guiding role in EGS-related exploration and exploitation.
Global energy consumption has experienced a sharp increase under the rapid development of the global economy, accompanied by the desire for green and low-carbon processes (Olasolo et al., 2016; Zheng et al., 2018; Zheng et al., 2019; Cheng et al., 2021; Zhao et al., 2022). In this context, unconventional oil/gas resources, such as shale oil/gas and tight sandstone gas, and clean energy, such as solar energy, wind energy, and enhanced geothermal systems (EGS), have emerged (Liu et al., 2017; Kumari and Ranjith, 2019; Hao et al., 2021; Lin et al., 2021; Steffen et al., 2021). Among them, the EGS is assumed to have the potential to meet the increasing global energy demand as it is theoretically considered to be an infinite resource that is cheaper than conventional fuels and globally available (Lu, 2018; Zhao et al., 2023). This renewable energy resource needs to be supported by highly effective development. As an emerging technique, EGS has the advantage of promoting clean and low-carbon energy; therefore, much attention has been given to this technique, including attempts to guide EGS toward a commercially viable platform, including technology validation, cost reduction, and improved performance (Lu, 2018). Accordingly, many studies have revealed some sound and recognized achievements (Fairley et al., 2010; Olasolo et al., 2016).
EGS is no longer a new concept. It is also known as an engineered geothermal system. The terms hot dry rock (HDR) and hot sedimentary aquifers have been applied in previous research (Kuriyagawa and Tenma, 1999; Christ et al., 2017; Lu, 2018). Regarding the EGS-related work, preliminary investigations on the construction of an artificial geothermal reservoir and heat exchange and transport have been organized (Zhu et al., 2010; Feng et al., 2012). The heat extraction process in an EGS in the Songliao Basin of northeast China over 30 years was addressed, and the main influencing parameters were discussed (Huang et al., 2014; Huang et al., 2015). The variable EGS outcomes in long-term operation processes under different geological conditions were predicted (Chen et al., 2013a; Chen et al., 2013b). In addition, Gan et al. (2021) and Spycher and Pruess (2010)studied the EGS using CO2 instead of water as a working fluid. The fracture network simulation methodologies were used to analyze the hydraulic fracturing process for an EGS reservoir (Wang and Zhang, 2011). Although these studies focused on different points, they have one thing in common: they all used numerical modeling. Having reviewed previous achievements in EGSs, it is noted that little attention has been paid to the influence of the number of production wells on the heat extraction performance, which may limit the deployment of the relative locations of injection wells for working fluid and production wells for heat extraction.
In recent years, numerical approaches have been widely adopted in geological resources research, especially for those working on an engineering scale, which is rarely conducted in an ordinary experimental setup (Fairley et al., 2010; Cheng et al., 2021; Liu et al., 2021; Zhao et al., 2021). In this work, numerical modeling is introduced to simulate the heat extraction process from an EGS system in which the number of production wells is set as a variable to evaluate their influence on the heat extraction performance. Here, the efficiency of heat extraction is also compared under different operating conditions for a quantitative investigation into how the number of production wells affects the heat extraction from an EGS. This numerical investigation is conducted on an engineering scale, offers a fresh perspective, and will provide guidance to a certain degree to the field of EGS-related exploration and exploitation.
On an engineering scale, this numerical work uses an HDR model with a size of X: 400 m × Y: 400 m × Z: 400 m, and the EGS is placed in the center of it with a size of X: 250 m × Y: 250 m × Z: 150 m (Figure 1). The roof and bottom of this simulated reservoir have a buried depth of 300 m and 600 m, respectively. To discuss how the number of production wells influences the heat extraction performance, an injection well and a production well are deployed in the EGS. Three cases are organized here, in which each model has one injection well with a 50 m length, and the coordinate of its midpoint is X: −100 × Y: 0 × Z: 0 (Figure 2). The origin point is located at the center of this EGS, as shown in Figure 1. Case 1 has one production well, and the coordinate of its midpoint is X: 100 × Y: 0 × Z: 0; Case 2 has two production wells, and the coordinates of its midpoints are X: 100 × Y: 50 × Z: 0 and X: 100 × Y: −50 × Z: 0, respectively (Figure 2). For Case 3, three production wells are set, and the coordinates of the midpoints are X: 100 × Y: 50 × Z: 0, X: 100 × Y: 0 × Z: 0, and X: 100 × Y: −50 × Z: 0, respectively (Figure 2).
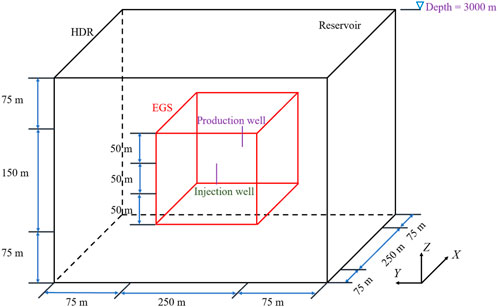
Figure 1. Numerical model used in this work.
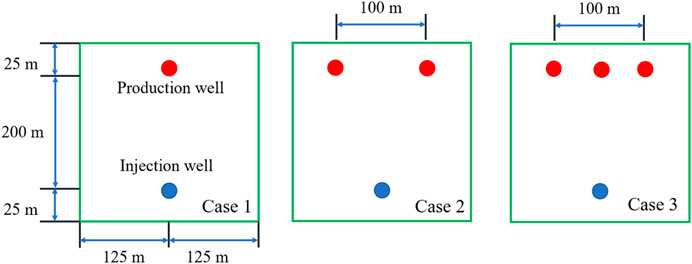
Figure 2. Description of the modeling cases for the EGS injection well platform.
To simulate the process of heat extraction from HDR, a 3D thermo-hydro-mechanical (THM) coupling model is developed in this study using several assumptions regarding fluid flow and heat transfer (Aliyu and Chen, 2017; Ye et al., 2021; Zhou et al., 2022; Huang et al., 2023).
(1) In the heat extraction process, water is utilized as the working fluid and exists in liquid form in the pores.
(2) The original EGS is treated as saturated with water. Fluid flow in the matrix is laminar flow and yields Darcy’s law.
(3) Fourier’s law describes the heat transfer process in the matrix. Local thermal equilibrium is assumed between the working fluid and rock mass.
These assumptions are widely set forth in the numerical studies of EGSs (Lu, 2018; Zhao et al., 2023) and are treated as reasonable conditions.
The primary governing equations of this model for the simulated process of heat extraction are as follows (Sun et al., 2019; Han et al., 2020; Aliyu and Archer, 2021; Tan et al., 2021; Yu et al., 2021; Zinsalo et al., 2021; Zhou et al., 2022; Zhao et al., 2023):
In the seepage field, the working fluid flow in the porous medium is described by the mass conservation law. In Eq. 1.,
where S is the storage coefficient of the rock matrix, Pa−1; p is the pore pressure, Pa; t is the time, s; q is the Darcy velocity, m/s; qf is the Darcy velocity in the fracture, m/s; and Qf is the source, 1/s.
In addition, the expressions of q are determined by Darcy’s law.
where k is the permeability of the rock matrix, m2; μf is the dynamic fluid viscosity, Pa·s; ρw is the fluid density, kg/m3; g is the gravitational acceleration, m/s2; and z is the unit vector in the vertical direction.
In the temperature field, the heat exchange between the rock surface and the cryogenic fluid is described by the local thermal equilibrium. The temperatures of the solid and the liquid are the same at each position. Then, based on the energy conservation law, the governing equations of the temperature field are written as [27]:
where T is the temperature, K; cp,w is the heat capacity of the fluid, J/(kg·K); Qf,E is the heat source, W/m3; (ρcp)m is the effective volumetric heat capacity of the matrix, J/(m3·K); and λm is the effective thermal conductivity of the matrix, W/(m·K).
where φ is the porosity of the matrix; ρs is the solid density, (kg/m3); cp,s is the solid heat capacity, J/(kg·K); and λs and λw are the thermal conductivities of the solid and the fluid, respectively, W/(m·K).
Some physical properties of water are determined by the temperature, such as the dynamic fluid viscosity (μf), the heat capacity (cp,w), the thermal conductivities (λw), and the density (ρw). The relationships between the temperature and the physical properties are expressed as follows (Sun et al., 2019; Han et al., 2020; Aliyu and Archer, 2021; Yu et al., 2021; Zinsalo et al., 2021; Zhou et al., 2022; Zhao et al., 2023):
The initial and boundary conditions of the numerical model mentioned in this work are listed in Table 1, and all modeling cases were run for 30 years during this simulated process. The primary reservoir physical parameters are exhibited in Table 2. Here, the initial/boundary conditions and properties are referred to from previous achievements (Sun et al., 2019; Han et al., 2020; Aliyu and Archer, 2021; Yu et al., 2021; Zinsalo et al., 2021; Zhou et al., 2022; Zhao et al., 2023).
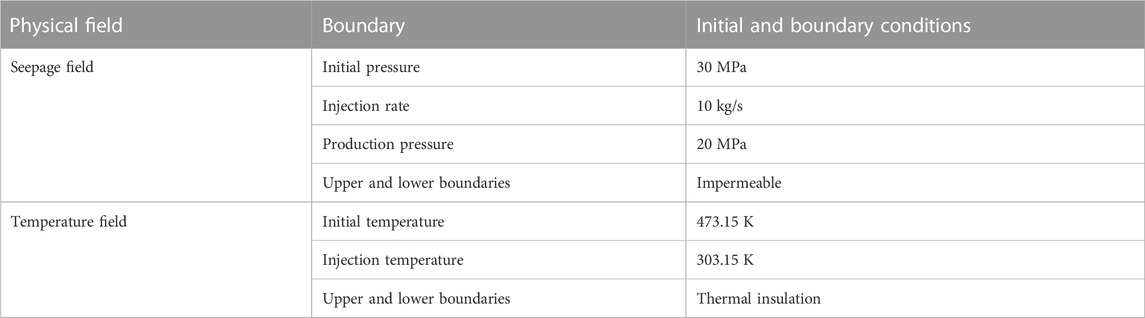
Table 1. Initial and boundary conditions employed for the simulations.
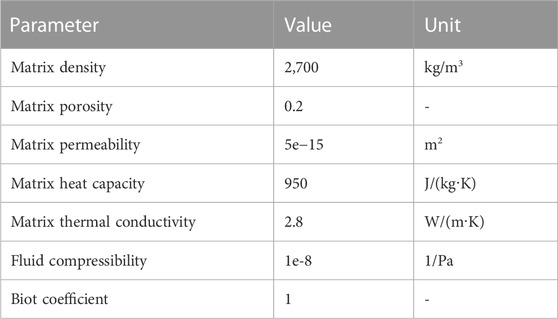
Table 2. Physical properties of the reservoir.
The temperature is an important parameter to evaluate the heat extraction performance of an EGS (Majorowicz and Grasby, 2010; Rodriguez et al., 2013; Fallah et al., 2016; Guo et al., 2018; Yang et al., 2021). Therefore, in this work, the temperature of the EGS system is introduced to compare the heat extraction performance during the EGS utilization, where water is adopted as the working fluid. Here, the overall situation of the temperature in the whole EGS is investigated, and then three reference points in the EGS are set to determine the detailed variation for specific operation cases. Then, the temperature changes in the whole system for three simulated cases are compared.
In this 3D numerical model, three planes were selected to demonstrate the variation tendency of temperature in the EGS: plane X-Y (Z = 0), plane Y-Z (X = 0), and plane X-Z (Y = 0); the coordinate system is shown in Figure 1. Here, these three planes are selected to show the temperature variation tendency in different directions for different simulated cases in this work.
1) X-Y plane
The X-Y plane is a slide that is perpendicular to the wellbore of the injection/production well. This work is set to investigate the temperature variation in the horizontal direction of the EGS. For all operation cases, the cooling area increases with time after water is injected into the injection well, and there is a tendency for the area to be extended from the injection well to the production well (Figure 3). However, by comparison, no matter the number of production wells (1, 2, or 3), the temperature variation in the X-Y plane seems to have a similar extension tendency, in which the difference is not obvious among all simulated cases. This could be due to two reasons: 1) for each case, the amount of injected water is the same in this numerical process, where the injection rate stabilizes at 10 kg/s, and 2) the low permeability of the EGS means that the injected, relatively low-temperature water does not travel far to hardly transport large-scale and makes the water seepage affected by the water extracted from the production well. From an intuitive perspective, the number of production wells barely affects the horizontal temperature variation for an EGS that is not fractured.
2) X-Z plane
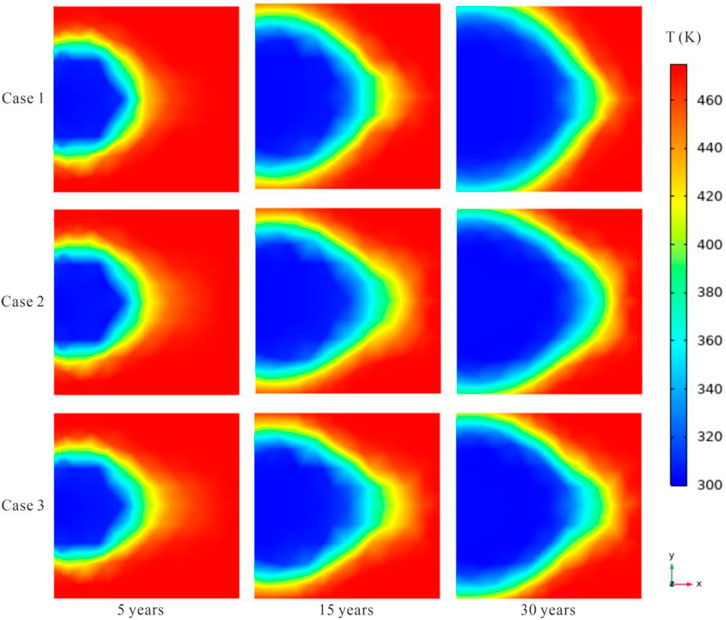
Figure 3. Temperature variation in the X-Y plane (Z = 0) during the heat extraction (coordinate system is shown in Figure 1).
The X-Z plane is a slide that penetrates the injection well and the EGS center, where Y = 0 in Figure 2. Here, this perspective is introduced to investigate the temperature variation along the direction from the injection well to the production well as shown in Figure 4. Generally, the cooling area increases after the injection, and this area tends to spread in the direction of the production well. Similar to the situation in the X-Y plane (Figure 3), the difference between the three simulations is not obvious in the X-Z plane. The reason for this phenomenon is similar to the analysis for the X-Y plane investigation.
3) Y-Z plane
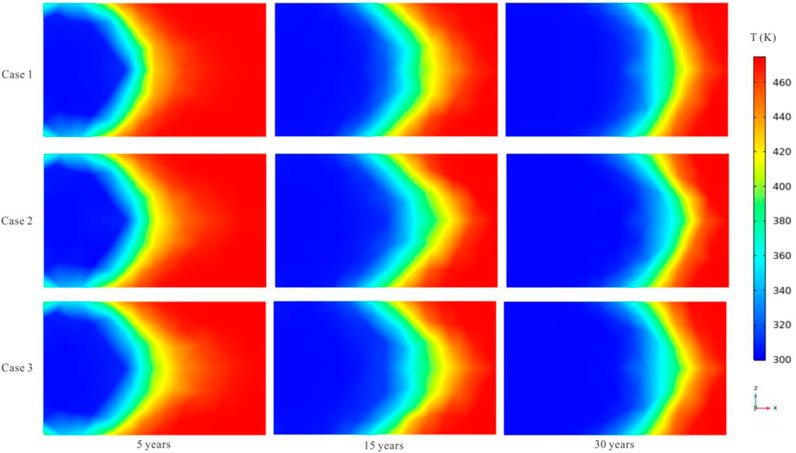
Figure 4. Temperature variation in the X-Z plane (Y = 0) during the heat extraction (coordinate system is shown in Figure 1).
The Y-Z plane is a slide with the X value set to 0 in the coordinate system in Figure 1, which is across the center of the EGS. From the exhibit in Figure 5, the continuous injection of water from the injection well enables the cooling area to increase with time. In addition, the area involved among the three cases differs under the condition of injecting the same amount of water from the injection well but with different production well settings. Compared with the aforementioned X-Y plane and the X-Z plane, there is a clear difference in temperature variation among the three cases, where one production well ensures a larger cooling area, and the more production wells, the smaller the cooling area during the heat extraction. Furthermore, because the difference between the X-Y plane and the X-Z plane is not obvious, it could be speculated that the temperature variation difference induced by the production well mainly occurs in the Y-Z plane, and this variation could cause the volume difference in the cooled rock during the heat extraction.
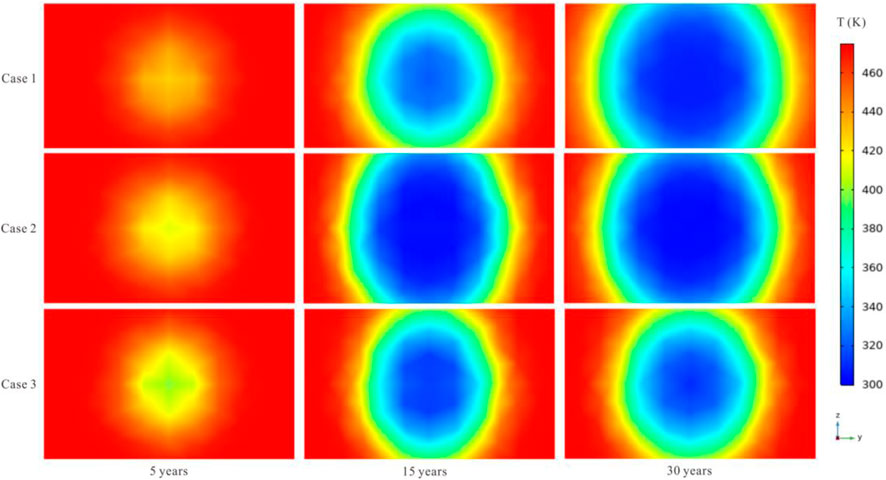
Figure 5. Temperature variation in the Y-Z plane (X = 0) during the heat extraction (coordinate system is shown in Figure 1).
To further exhibit the temperature variation in different simulation cases, three reference points are chosen to quantitatively investigate the dynamic change in temperature during heat extraction. Here, the reference points are (X = 100: Y = 50: Z = 25), (X = 100: Y = 0: Z = 25), and (X = 100: Y = −50: Z = 25), using the coordinate system shown in Figure 1. The temperature variations at three representative points are shown in Figures 6–8, respectively.
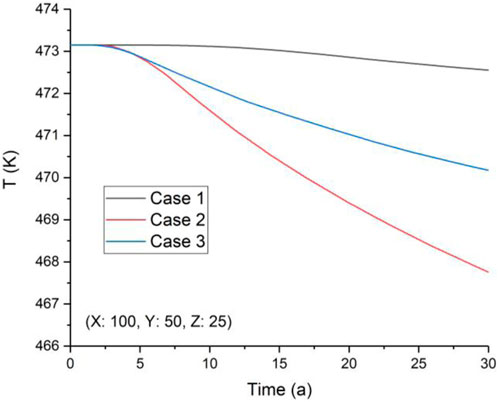
Figure 6. Variation of reference point temperature at (X = 100: Y = 50: Z = 25) (coordinate system is shown in Figure 1).
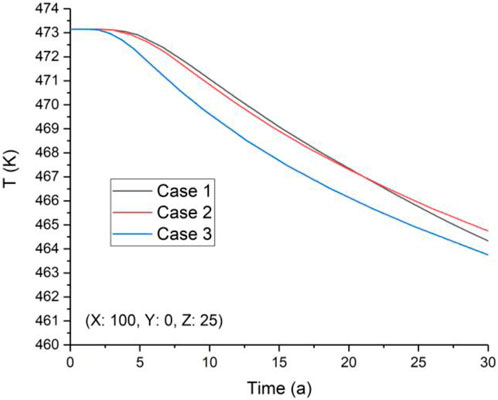
Figure 7. Variation of reference point temperature at (X = 100: Y = 0: Z = 25) (coordinate system is shown in Figure 1).
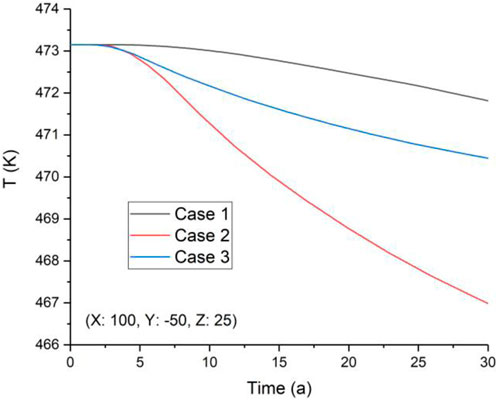
Figure 8. Variation of reference point temperature at (X = 100: Y = −50: Z = 25) (coordinate system is shown in Figure 1).
The temperature varies sparingly in the first ∼3 years at each reference point for every simulation case (Figures 6–8) because the injected cooling water has not yet arrived at that point and the hot water extracted from the production well slightly affects the EGS temperature. Afterward, with the continuous injection of cooling water and its arrival at the reference points, the temperature there begins to decline with a variable amplitude of variation. At the point where (X = 100: Y = 50: Z = 25), for Case 1, the temperature experiences a small variation during the total heat extraction period because the water pressure difference between the injection well and the production well drives the cooling water to flow toward the production well. Therefore, in Case 1, point (X = 100: Y = 50: Z = 25) receives little of the injected cooling water, and the temperature there remains almost constant (Figure 6). However, for Case 2 and Case 3, the injected cooling water arrives at point (X = 100: Y = 50: Z = 25) because the hot water extracted from the production well induces the cooling water seepage toward this point. In Case 2, more cooling water flows to the point (X = 100: Y = 50: Z = 25) than in Case 3. This phenomenon occurs because the injected cooling water tends to flow toward the production well due to the fluid pressure difference, and more cooling water flows toward the point (X = 100: Y = 50: Z = 25) in Case 2 because the middle production well in Case 3 has a tendency to shunt the injected cooling water (Figure 6).
As for the point where (X = 100: Y = 0: Z = 25) in the three cases, the temperature variation follows a similar rule and undergoes a similar tendency (Figure 7). This is because, at the point where (X = 100: Y = 0: Z = 25), the cooling water has a similar seepage space and flow condition to reach this point, indicating that the fluid pressure difference between the injection well and the point (X = 100: Y = 0: Z = 25) is similar in both simulation cases in this work. Moreover, for point (X = 100: Y = −50: Z = 25), the temperature variation there (Figure 8) is similar to the phenomenon at the point where (X = 100: Y = 50: Z = 25) (Figure 6), and the mechanism is also similar to the previous one.
In this work, following the previous work (Zhao et al., 2023), a heat extraction efficiency (denoted as ef) is introduced to investigate the attenuation process during the temperature variation in the EGS, which represents the heat recovery divided by the total heat stored in the EGS and yields:
where VS means the heat extraction zone in the EGS, T0 is the initial temperature, and Tinj is the injection temperature of the fluid (namely, the cooling water).
According to Eq. 10, the ef performance for each numerical case is exhibited in Figure 9. Per the calculation results (Figure 9), little difference is demonstrated among the variable simulations. For all cases, the ef tends to increase faster during the first 15 years and experiences a relatively slower increase during the last 15 years. During the heat extraction process, Case 1 and Case 2 show a similar variation regarding the ef, while Case 3 has a slightly lower ef than Case 1 and Case 2. This phenomenon is unexpected because the temperature difference in representative slides or points exhibited a difference among the three cases (Figures 5–8). Therefore, this work speculates that there is a complicated coupling process in the EGS regarding the temperature variation during the heat extraction process that will require more attention.
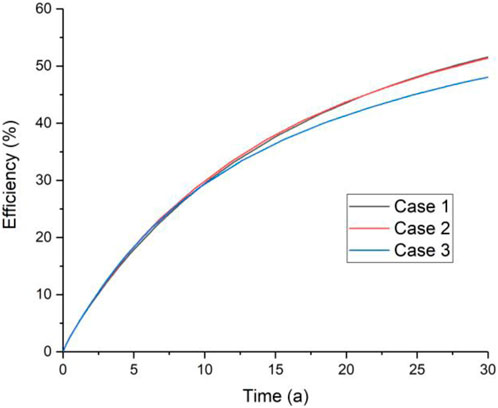
Figure 9. Heat extraction efficiency (ef) over 30 years of numerical simulations for each case.
This work reports on three cases to investigate the influence of the number of production wells on the heat extraction performance of an EGS system. The temperature variation with respect to the representative slides and reference points is systematically investigated for Case 1, Case 2, and Case 3. Furthermore, the ef is introduced and defined to represent the temperature variation of the EGS. Accordingly, the following points are made:
For the plane X-Y (Z = 0), plane Y-Z (X = 0), and plane X-Z (Y = 0), the temperature variation during the heat extraction process from the EGS is hardly different among the three simulation cases at the plane X-Y (Z = 0) and plane Y-Z (X = 0). Moreover, the results show that one production well (Case 1) ensures a larger cooling area, and the more production wells in a field (Case 2 and Case 3), the smaller the cooling area during the heat extraction in the X-Z plane (Y = 0).
Based on the investigation of the points of (X = 100: Y = 50: Z = 25), (X = 100: Y = 0: Z = 25), and (X = 100: Y = −50: Z = 25), the continuous injection of cooling water and its arrival at the reference points allow the temperature at each point to begin to decrease with a variable amplitude of variation. Relatively, the difference of temperature variation at points (X = 100: Y = 50: Z = 25) and (X = 100: Y = −50: Z = 25) is greater among three numerical cases, while that at point (X = 100: Y = 0: Z = 25) is smaller.
Regarding the ef, Case 1 exhibits the same variation as Case 2, which is also similar to that of Case 3. This indicates that the number of production wells during the heat extraction has little influence on the ef for an EGS, even though temperature differences exist on the representative slides or reference points. This issue may be due to a complicated coupling process, and this possibility requires additional investigation.
The original contributions presented in the study are included in the article/supplementary material; further inquiries can be directed to the corresponding author.
ZW, BZ, and JL organized the project. PZ, BZ, LkY, and LmY conducted the numerical simulations. HY, PZ, and JL performed the data analysis. PZ, ZW, and JL wrote the manuscript. JL revised the manuscript. All authors contributed to the discussions.
This study was financially supported by the China Three Gorges Corporation (Grant No. WWKY-2021-0393), the Science and Technology Department of Sichuan Province (Grant No. 2021YFH0118), the Natural Science Foundation of Chongqing, China (No. CSTB2022NSCQ-BHX0721), and the project funded by the China Postdoctoral Science Foundation (Grant No. 2022T150774).
Authors ZW, BZ, LkY, LmY, YF, and HY are employed by China Three Gorges Corporation.
The remaining authors declare that the research was conducted in the absence of any commercial or financial relationships that could be construed as a potential conflict of interest.
All claims expressed in this article are solely those of the authors and do not necessarily represent those of their affiliated organizations, or those of the publisher, the editors and the reviewers. Any product that may be evaluated in this article, or claim that may be made by its manufacturer, is not guaranteed or endorsed by the publisher.
Aliyu, M., and Archer, R. A. (2021). A thermo-hydro-mechanical model of a hot dry rock geothermal reservoir. Renew. Energy 176, 475–493. doi:10.1016/j.renene.2021.05.070
Aliyu, M., and Chen, H. (2017). Optimum control parameters and long-term productivity of geothermal reservoirs using coupled thermo-hydraulic process modelling. Renew. Energy 112, 151–165. doi:10.1016/j.renene.2017.05.032
Chen, J., Jiang, F., Luo, L., Zacharek, A., Cui, X., Cui, Y., et al. (2013). Neuroprotective effect of human placenta-derived cell treatment of stroke in rats. Chin. J. Comput. Phys. 30, 871–879. doi:10.3727/096368911X637380
Chen, J., Lou, L., and Jiang, F. (2013). Thermal compensation of rocks encircling heat reservoir in heat extraction of enhanced geothermal system. Chin. J. Comput. Phys. 30, 862–870.
Cheng, L., Li, D., Wang, W., and Liu, J. (2021). Heterogeneous transport of free CH4 and free CO2 in dual-porosity media controlled by anisotropic in situ stress during shale gas production by CO2 flooding: Implications for CO2 geological storage and utilization. ACS Omega 6, 26756–26765. doi:10.1021/acsomega.1c04220
Christ, A., Rahimi, B., Regenauer-Lieb, K., and Chua, H. T. (2017). Techno-economic analysis of geothermal desalination using hot sedimentary aquifers: A pre-feasibility study for western Australia. Desalination 404, 167–181. doi:10.1016/j.desal.2016.11.009
Fairley, J. P., Ingebritsen, S. E., and Podgorney, R. K. (2010). Challenges for numerical modeling of enhanced geothermal systems. Ground Water 48, 482–483. doi:10.1111/j.1745-6584.2010.00716.x
Fallah, M., Mohammad, S., Mahmoudi, S., and Akbarpour Ghiasi, R. (2016). Advanced exergy analysis of the Kalina cycle applied for low temperature enhanced geothermal system. Energy Convers. Manag. 108, 190–201. doi:10.1016/j.enconman.2015.11.017
Feng, Z., Zhao, Y., Zhou, A., and Zhang, N. (2012). Development program of hot dry rock geothermal resource in the Yangbajing Basin of China. Renew. Energy 39, 490–495. doi:10.1016/j.renene.2011.09.005
Gan, Q., Candela, T., Wassing, B., Wasch, L., Liu, J., and Elsworth, D. (2021). The use of supercritical CO2 in deep geothermal reservoirs as a working fluid: Insights from coupled THMC modeling. Int. J. Rock Mech. Min. Sci. 147, 104872. doi:10.1016/j.ijrmms.2021.104872
Guo, L. L., Zhang, Y. B., Zhang, Y. J., Yu, Z. W., and Zhang, J. N. (2018). Experimental investigation of granite properties under different temperatures and pressures and numerical analysis of damage effect in enhanced geothermal system. Renew. Energy 126, 107–125. doi:10.1016/j.renene.2018.02.117
Han, S., Cheng, Y., Gao, Q., Yan, C., and Zhang, J. (2020). Numerical study on heat extraction performance of multistage fracturing Enhanced Geothermal System. Renew. Energy 149, 1214–1226. doi:10.1016/j.renene.2019.10.114
Hao, L., Zhou, M., Song, Y., Ma, X., Wu, J., Zhu, Q., et al. (2021). Tin-based perovskite solar cells: Further improve the performance of the electron transport layer-free structure by device simulation. Sol. Energy 230, 345–354. doi:10.1016/j.solener.2021.09.091
Huang, L. K., He, R., Yang, Z. Z., Tan, P., Chen, W., Li, X., et al. (2023). Exploring hydraulic fracture behavior in glutenite formation with strong heterogeneity and variable lithology based on DEM simulation. Eng. Fract. Mech. 278, 109020. doi:10.1016/j.engfracmech.2022.109020
Huang, X., Zhu, J., and Li, J. (2015). “Analysis of wellbore heat transfer in enhanced geothermal system using CFD modeling,” in Proceedings of the world geothermal congress 2015, April 2015, Melbourne, Australia.
Huang, X., Zhu, J., Niu, C., Li, J., and Jin, X. (2014). Heat extraction and power production forecast of a prospective enhanced geothermal system site in Songliao Basin, China. Energy 75, 360–370. doi:10.1016/j.energy.2014.07.085
Kumari, W., and Ranjith, P. G. (2019). Sustainable development of enhanced geothermal systems based on geotechnical research – a review. Earth-Science Rev. 199, 102955. doi:10.1016/j.earscirev.2019.102955
Kuriyagawa, M., and Tenma, N. (1999). Development of hot dry rock technology at the Hijiori test site. Geothermics 28, 627–636. doi:10.1016/s0375-6505(99)00033-4
Lin, T., Liu, X., Zhang, J., Bai, Y., Liu, J., Zhang, Y., et al. (2021). Characterization of multi-component and multi-phase fluids in the Upper Cretaceous oil shale from the Songliao basin (NE China) using T1–T2 NMR correlation maps. Petroleum Sci. Technol. 39, 1060–1070. doi:10.1080/10916466.2021.1990318
Liu, J., Xie, L. Z., He, B., Gan, Q., and Zhao, P. (2021). Influence of anisotropic and heterogeneous permeability coupled with in-situ stress on CO2 sequestration with simultaneous enhanced gas recovery in shale: Quantitative modeling and case study. Int. J. Greenh. Gas Control 104, 103208. doi:10.1016/j.ijggc.2020.103208
Liu, J., Yao, Y., Liu, D., and Elsworth, D. (2017). Experimental evaluation of CO2 enhanced recovery of adsorbed-gas from shale. Int. J. Coal Geol. 179, 211–218. doi:10.1016/j.coal.2017.06.006
Lu, S. M. (2018). A global review of enhanced geothermal system (EGS). Renew. Sustain. Energy Rev. 81, 2902–2921. doi:10.1016/j.rser.2017.06.097
Majorowicz, J., and Grasby, S. E. (2010). Heat flow, depth-temperature variations and stored thermal energy for enhanced geothermal systems in Canada. J. Geophys. Eng. 7, 232–241. doi:10.1088/1742-2132/7/3/002
Olasolo, P., Juárez, M., Olasolo, J., Morales, M., and Valdani, D. (2016). Economic analysis of Enhanced Geothermal Systems (EGS). A review of software packages for estimating and simulating costs. Appl. Therm. Eng. 104, 647–658. doi:10.1016/j.applthermaleng.2016.05.073
Rodriguez, C. E. C., Palacio, J. C. E., Venturini, O. J., Silva Lora, E. E., Cobas, V. M., Marques dos Santos, D., et al. (2013). Exergetic and economic comparison of ORC and Kalina cycle for low temperature enhanced geothermal system in Brazil. Appl. Therm. Eng. 52, 109–119. doi:10.1016/j.applthermaleng.2012.11.012
Spycher, N., and Pruess, K. (2010). A phase-partitioning model for CO2-brine mixtures at elevated temperatures and pressures: Application to CO2-enhanced geothermal systems. Transp. Porous Media 82, 173–196. doi:10.1007/s11242-009-9425-y
Steffen, J., Lengsfeld, S., Jung, M., Ponick, B., Herranz Gracia, M., Spagnolo, A., et al. (2021). Design of a medium voltage generator with DC-cascade for high power wind energy conversion systems. Energies 14, 3106. doi:10.3390/en14113106
Sun, X., Liao, Y., Wang, Z., and Sun, B. (2019). Geothermal exploitation by circulating supercritical CO2 in a closed horizontal wellbore. Fuel 254, 115566. doi:10.1016/j.fuel.2019.05.149
Tan, P., Jin, Y., and Pang, H. W. (2021). Hydraulic fracture vertical propagation behavior in transversely isotropic layered shale formation with transition zone using XFEM-based CZM method. Eng. Fract. Mech. 248, 107707. doi:10.1016/j.engfracmech.2021.107707
Wang, Y., and Zhang, K. (2011). Modeling approaches for fractures in enhanced geothermal system (EGS). Shanghai Land Resour. 32, 77–80.
Yang, R. Y., Hong, C. Y., Liu, W., Wu, X., Wang, T., and Huang, Z. (2021). Non-contaminating cryogenic fluid access to high-temperature resources: Liquid nitrogen fracturing in a lab-scale Enhanced Geothermal System. Renew. Energy 165, 125–138. doi:10.1016/j.renene.2020.11.006
Ye, Z., Wang, J., and Hu, B. (2021). Comparative study on heat extraction performance of geothermal reservoirs with presupposed shapes and permeability heterogeneity in the stimulated reservoir volume. J. Petroleum Ence Eng. 206, 109023. doi:10.1016/j.petrol.2021.109023
Yu, P., Dempsey, D., and Archer, R. (2021). A three-dimensional coupled thermo-hydro-mechanical numerical model with partially bridging multi-stage contact fractures in horizontal-well enhanced geothermal system. Int. J. Rock Mech. Min. 143, 104787. doi:10.1016/j.ijrmms.2021.104787
Zhao, P., He, B., Zhang, B., and Liu, J. (2022). Porosity of gas shale: Is the NMR-based measurement reliable? Petroleum Sci. 19, 509–517. doi:10.1016/j.petsci.2021.12.013
Zhao, P., Liu, J., and Elsworth, D. (2023). Numerical study on a multifracture enhanced geothermal system considering matrix permeability enhancement induced by thermal unloading. Renew. Energy 203, 33–44. doi:10.1016/j.renene.2022.12.056
Zhao, P., Xie, L. Z., He, B., and Liu, J. (2021). Anisotropic permeability influencing the performance of free CH4 and free CO2 during the process of CO2 sequestration and enhanced gas recovery (CS-EGR) from shale. ACS Sustain. Chem. Eng. 9, 914–926. doi:10.1021/acssuschemeng.0c08058
Zheng, S. J., Yao, Y. B., Liu, D. M., and Cai, Y. (2018). Characterizations of full-scale pore size distribution, porosity and permeability of coals: A novel methodology by nuclear magnetic resonance and fractal analysis theory. Int. J. Coal Geol. 196, 148–158. doi:10.1016/j.coal.2018.07.008
Zheng, S. J., Yao, Y. B., Liu, D. M., Cai, Y., and Li, X. (2019). Nuclear magnetic resonance T2 cutoffs of coals: A novel method by multifractal analysis theory. Fuel 241, 715–724. doi:10.1016/j.fuel.2018.12.044
Zhou, L., Zhu, Z., Xie, X., and Hu, Y. (2022). Coupled thermal-hydraulic-mechanical model for an enhanced geothermal system and numerical analysis of its heat mining performance. Renew. Energy 181, 1440–1458. doi:10.1016/j.renene.2021.10.014
Zhu, L., Chen, W., Li, W., et al. (2010). Experiment of stainless corrosion and scaling in geothermal water supply pipeline. J. Jiangsu Univ. Nat. Sci. Ed. 31, 292–295.
Keywords: enhanced geothermal system, heat extraction performance, temperature variation, production well, numerical modeling
Citation: Wang Z, Zhang B, Yin L, Yang L, Fan Y, Yin H, Zhao P and Liu J (2023) The number of production wells affects the heat extraction performance of an enhanced geothermal system: insights from engineering-scale 3D THM coupling numerical simulations. Front. Earth Sci. 11:1185936. doi: 10.3389/feart.2023.1185936
Received: 14 March 2023; Accepted: 14 April 2023;
Published: 07 July 2023.
Edited by:
Peng Tan, CNPC Engineering Technology R&D Company Limited, ChinaCopyright © 2023 Wang, Zhang, Yin, Yang, Fan, Yin, Zhao and Liu. This is an open-access article distributed under the terms of the Creative Commons Attribution License (CC BY). The use, distribution or reproduction in other forums is permitted, provided the original author(s) and the copyright owner(s) are credited and that the original publication in this journal is cited, in accordance with accepted academic practice. No use, distribution or reproduction is permitted which does not comply with these terms.
*Correspondence: Bo Zhang, emhhbmdfYm8xN0BjdGcuY29tLmNu
Disclaimer: All claims expressed in this article are solely those of the authors and do not necessarily represent those of their affiliated organizations, or those of the publisher, the editors and the reviewers. Any product that may be evaluated in this article or claim that may be made by its manufacturer is not guaranteed or endorsed by the publisher.
Research integrity at Frontiers
Learn more about the work of our research integrity team to safeguard the quality of each article we publish.