 Paulo Sulle Michael1*
 Hilda G. Sanga1Mawazo J. Shitindi1Max Herzog2Joel L. Meliyo3Boniface H. J. Massawe1
- 1Department of Soil and Geological Sciences, College of Agriculture, Sokoine University of Agriculture, Morogoro, Tanzania
- 2Department of Biology, University of Copenhagen, Copenhagen, Denmark
- 3Tanzania Agricultural Research Institute (TARI), Dodoma, Tanzania
In Tanzania, 71% of rice is grown in a rainfed lowland rice production ecosystem, primarily in river basins where extreme weather events like floods are frequent. For a six-year period (2017–2022), flood mapping was conducted using Sentinel-1 data in the Google Earth Engine (GEE) platform, utilizing change detection and thresholding methodology. In addition to flood mapping, land use and land cover (LULC) were also analyzed using Sentinel-2 data in GEE, employing the Random Forest (RF) algorithm for classification. The aim was to understand the spatiotemporal extent of floods in two study locations. The resulting flood maps achieved an overall accuracy (OA) greater than 90% for all sites and study years. The findings revealed that agricultural land was the predominant land use/cover in both sub-basins, and floods were widespread in both regions. The study highlighted the interannual variability in flood extent, both spatially and temporally. Specifically, at the Ikwiriri site, floods were more extensive in 2020, covering 54.95% of the cultivated area, while in 2017, the minimum flood extent occurred, affecting 14% of the cultivated area. Similarly, at the Mngeta site, extensive floods were observed in 2020, with floods impacting 5.53% of the cultivated areas, while lower flood extents were observed in 2017, affecting 1.49% of the cultivated areas. Furthermore, the study demonstrated distinct spatiotemporal patterns of floods in both locations, with areas in proximity to rivers and wetlands experiencing more frequent floods. The research showcased the capabilities of the GEE cloud computation platform for flood inundation mapping, emphasizing its potential for enhancing our understanding of rice-producing environments. The generated flood maps can be utilized to guide the selection of areas for trials of flood-tolerant rice varieties and the dissemination of technologies such as flood-tolerant rice varieties, contributing to the resilience of rice farmers in these two floodplains.
1 Introduction
In many areas of Tanzania and Sub-Saharan Africa, rice (Oryza sativa L.) is one of the most widely grown cereal crops (Nasrin et al., 2015). Being the second most cultivated cereal crop in Tanzania (Kalala et al., 2017) and a significant source of dietary energy (United Republic of Tanzania, 2019), rainfed agriculture continues to be a key production system (Chang’a et al., 2017). Tanzania is facing a comparable situation to the rest of Sub-Saharan Africa where the production of rice is inadequate to meet the needs of the growing population (van-Oort et al., 2015). In Tanzania, 71 percent of rice is produced under a lowland rainfed ecosystem mostly in floodplains where flooding is a common condition (Gabiri et al., 2018). The typical rice yield in Tanzania is roughly 2.3 t ha-1 on average, less than the country’s potential yield of 4–10 t ha-1 (Meliyo et al., 2017). The low production can be attributed to a variety of reasons, including biotic and abiotic stressors such as salt, drought, and floods.
Flooding is among the major stress constraint to rice production, especially in rainfed lowland rice production carried out in floodplains (Mackill et al., 2012). Because of anoxic conditions in flooded soils, direct-seeded rice succumbs to poor germination during floods (Ismail et al., 2012). Additionally, rice crops become submerged at the vegetative growth stage as a result of flash floods and standing water, which limit plant cell-to-atmosphere gas exchange, hence affecting rice plant respiration and photosynthesis (Zhou et al., 2020). Breeding efforts have resulted in the development of rice cultivars with improved submergence tolerance, especially vegetative submergence conferred by the SUB1 locus (Mackill et al., 2012). In line with breeding, identification of vulnerable hotspots has been one of the key mechanisms in enhancing resilience mostly by targeting research areas and distributing tolerant varieties to farmers in the most vulnerable locations (van-Oort et al., 2015). For example, Remote Sensing (RS) maps were used to direct the distribution of the submergence-tolerant variety Swarna SUB1 to locations most likely to experience submergence stress (Mackill et al., 2012; Koppa and Amarnath, 2021).
Traditional methods of mapping floods face several limitations; these include the lack of adequate data, high costs, high time consumption, and the difficulty in mapping floods at the bigger catchment level (Dao and Liou, 2015; Ullah and Zhang, 2020). RS provides benefits compared to traditional mapping such as lower time consumption, lower costs, and application in data-scarce locations, which makes it potentially useful for guiding decisions in response to floods (Das, 2019). Thus, due to the development of RS products, spatial-temporal monitoring of rice-growing regions is becoming more widespread globally (Mosleh et al., 2015; Segarra et al., 2020) and the understanding of rice-growing areas has become faster and less expensive using optical and microwave remote sensing (Dao and Liou, 2015). RS techniques can thus be used to investigate the dynamics in rice-growing regions such as vegetation submergence (Kuenzer and Knauer, 2013) even in cloud-prone regions (Torbick et al., 2017). A number of high-resolution satellite products are accessible to the general public and for research at no cost. Sentinel-1 and Sentinel-2 missions, among others, offer free surface reflectance images that are essential for tracking environmental processes such as flooding in rice-growing regions. An alternative is to employ Sentinel-1 Synthetic Aperture Radar (SAR), as image acquisition is not constrained by atmospheric conditions such as clouds which can constrain Sentinel 2 usage (Uddin et al., 2019; Singha et al., 2020). The constellation of Sentinel-1A/B satellites and its open data archive significantly changed the availability of data and made C-band SAR time series with high geographical and temporal resolution freely and publicly accessible (Clauss et al., 2018). Data analysis of RS data has been transformed by the current explosion of big data analysis platforms.
The Google Earth Engine (GEE) platform, developed by Google in 2010, has emerged as a valuable tool for monitoring various surface activities, including agriculture and hydrodynamics (Amani et al., 2020). Leveraging the capabilities of GEE and high-resolution Sentinel-1 synthetic aperture radar (SAR) data, automated and near-real-time monitoring of rice-growing regions and associated stresses such as floods has become feasible. Recent studies have demonstrated the effectiveness of integrating temporal Sentinel-1 data and GEE for mapping and monitoring rice growth extent and cropping patterns (Pandey et al., 2022). For instance, Rudiyanto et al. (2019) successfully employed machine learning functions in GEE to produce 10 m resolution maps over a large area (10 million ha) encompassing rice cultivation in Indonesia and Malaysia. Similarly, Csorba et al. (2019) utilized Sentinel-1 data to assess rice production ecology in Rwanda by employing SAR-based phenological parameters. These studies exemplify the valuable insights that can be gained from GEE and Sentinel-1 data in monitoring and managing rice production. Moreover, the comprehensive evaluation of flood inundation in the Ganga-Brahmaputra River basin has emphasized the significance of geospatially enabled computation (GEC) and the utilization of Sentinel-1 data for effective crop monitoring (Pandey et al., 2022). By identifying flood-prone areas and estimating the potential impact on agricultural land, such studies provide decision-makers with crucial information to implement flood risk reduction measures and undertake efficient mitigation activities.
In the lowlands of Kilombero and Lower-Rufiji River basins, Tanzania, floods are frequent as basins receive heavy rains and water from other catchment areas (Duvail and Hamerlynck, 2007; Kato, 2007). In the Kilombero floodplain, significant grain yield variability under different nutrient management strategies in different hydrological conditions indicated the interacting effects of hydrological conditions and agronomic management on rice yield (Kwesiga et al., 2019). However, in spite of the known high occurrence of floods in this region, no studies have so far mapped the extent and hotspots of floods. Therefore, we applied RS to monitor flood occurrence in these two data-scare rice-growing areas. The aim of this work was to map flood hotspots in the rice-growing Kilombero and Rufiji River basin areas using publicly accessible Sentinel-1 SAR and GEE platforms. The resulting flood hotspot maps will be a useful decision support tool in planning for flood adaptation measures such as the distribution of rice varieties tolerant to flood-related stresses.
2 Study area, data, and methodology
2.1 Study area
This study focused on two regions situated in two sub-basins of Tanzania’s main river basin (Rufiji). The two research locations (Figure 1) Mngeta division (covering Mofu and Mbingu wards), and Ikwiriri ward are situated in the major rice-growing areas of the Kilombero and Lower-Rufiji sub-basins, respectively. The two sub-basins were selected due to their rice production potential and known history of flood episodes. Floods occurrences are frequent in the two basins especially in March and April, when the basins suffer prolonged rain and runoff coming from other areas bordering the two sub-basins.
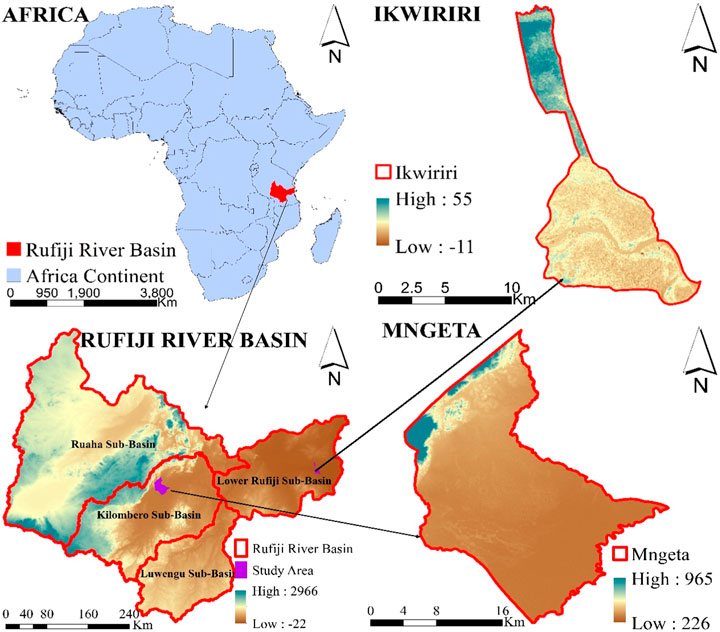
FIGURE 1. The location of the two study sites (Ikwiriri and Mngeta) as depicted from the Rufiji Basin.
With an area of 40,420 km2, or around 23% of the Rufiji basin, the Kilombero Valley is the largest freshwater wetland in East Africa. Out of the mentioned area, the largest portion of the 7,967 km2 floodplain is regarded as a Ramsar site (Höllermann et al., 2021). The Kilombero valley serves as Tanzania’s major rice basket accounting for 9% of the country’s total rice production (Kwesiga et al., 2019). Approximately 80% of the arable cultivated area in the Kilombero Valley is monocropped with rice (Gebrekidan et al., 2020).
Lower-Rufiji serves as a site of collection for water from the other three sub-basins of the Rufiji basins, making it one of Tanzania’s most vulnerable flood zones. Rice farming and fishing are two of the main economic activities in the Lower-Rufiji floodplain, where more than 150,000 people reside. Despite having one of the greatest rivers in Africa, the Rufiji area is among the poorest in the nation (Hamerlynck et al., 2011). In order to adapt to the hydrological dynamics of the basin when the rice crop fails owing to severe flooding, smallholder rice farmers in the Lower-Rufiji floodplain engage in recession agriculture (locally known as Mlao) and fishing (Duvail and Hamerlynck, 2007). Extreme droughts, which are also frequent in light of the present climate change, are another drawback for recession agriculture in the Lower-Rufiji floodplain.
2.2 Data
2.2.1 Sentinel-1 SAR imageries acquisition and pre-processing
Sentinel-1A/B Synthetic Aperture Radar (SAR) C-band (5.4 GHz) was employed in this study for flood mapping (Table 1). Depending on whether both or just one satellite is available, the twin satellites (Sentinel 1A and B) have a temporal resolution of 6 or 12 days. Sentinel-1 imageries are acquired in four modes, Strip Map (SM), Extra Wide Swath (EW), Interferometric Wide Swath (IW), and Wave (WV), with either single or dual polarization and have a spatial resolution of 10 m. Interferometric Wide Swath (IW) was used in this study. IW has dual polarization with (VV and VH) vertical transmit and vertical receive (VV) and vertical transmit and horizontal receive (VH); in this study, VV polarization was used for flood mapping. Sentinel-1 images were acquired during the rice-growing season in March and April; during this time, both sub-basins experience seasonal floods. Automatically, pre-processed level-1 ground range detection (GRD) scenes were used to map floods. Sentinel-1 pre-processing steps involve: (i) orbit filling, (ii) ground range detection border noise removal, (iii) thermal noise removal, (iv) radiometric calibration, (v) terrain correction to account for terrain characteristics, (vi) speckle noise removal, and (vii) conversion of backscatter intensity to decibels (dB) through logarithmic scaling.
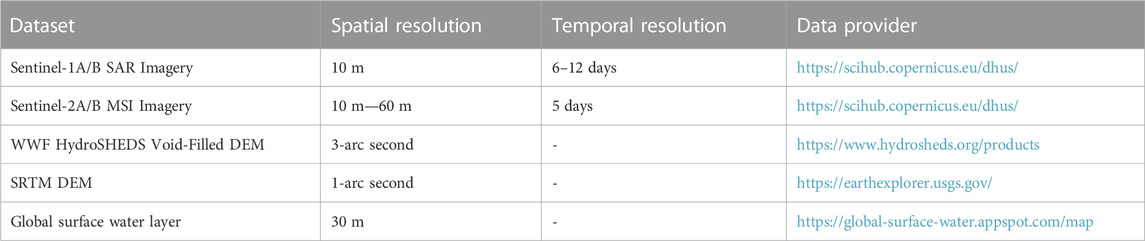
TABLE 1. Datasets used in this study.
2.2.2 Sentinel-2 MSI imageries acquisition and pre-processing
Sentinel-2A/B Multispectral Instrument (MSI) imageries were used in rice mapping (Table 1). Sentinel-2 imageries are freely provided by the European Space Agency (ESA) since 2015 with spatial resolution ranging from 10 m to 60 m and temporal resolution of 5 days (Segarra et al., 2020). Surface reflectance visible bands with 10 m resolution of blue (490 nm), green (560 nm), red (665 nm), near-infrared (842 nm), and 20 m short wave near-infrared band (SWIR) were used in this study. Median value composite images of the study areas were acquired during flood season when crops were at a vegetative stage, that is, in March and April of 2017–2022, which were used in mapping land cover and for accuracy assessment of flood maps.
2.2.3 Ancillary data
Shuttle Radar Topographic Mission (SRTM) Digital Elevation Model (DEM) with 30 m spatial resolution (1 Arc Second) was used during automatic preprocessing in range doppler terrain correction of sentinel-1 image (Zhang et al., 2020). WWF HydroSHEDS Void-Filled DEM was used in GEE to mask areas with a slope greater than 5%. The global Surface Water layer was used to mask out areas with permanent water features during flood map processing.
2.3 Methodology
2.3.1 Flood maps processing
In order to map flooded areas for the years from 2017 to 2022, change detection and thresholding (CDAT) on the GEE platform was utilized (Long et al., 2014). The methodology consists of two steps: change detection between reference images and images taken during the flood period and thresholding to separate flooded and non-flooded pixels from the difference images (Figure 2). In the case of the Kilombero and Lower-Rufiji locations, the reference image was the median value composite of images acquired in the dry months of August and September. Reference images are those taken during the dry season when there is no flooding (Clement et al., 2018). Figure 3 is an example of two types of images using the CDAT methodology.
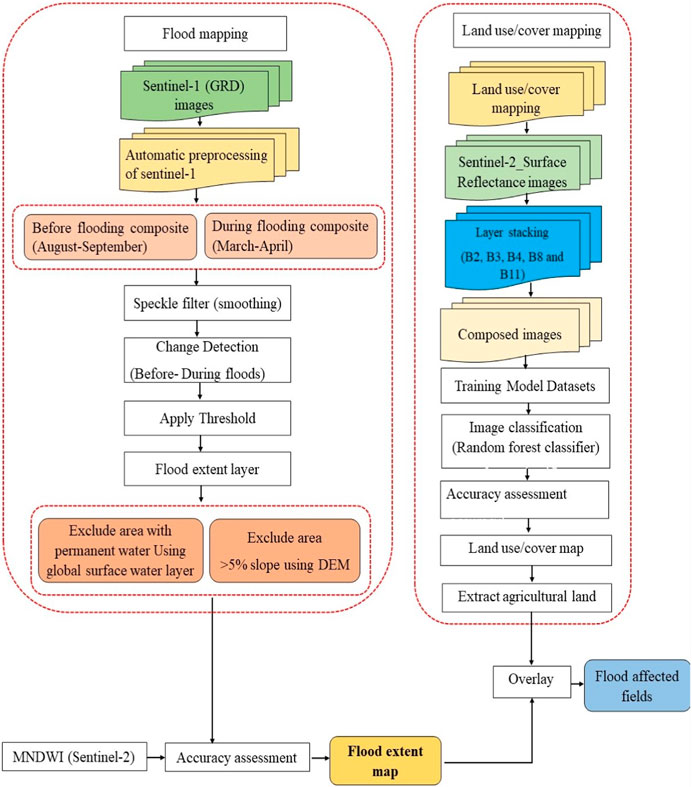
FIGURE 2. Methodology used to map floods, land cover, and flood-affected fields.
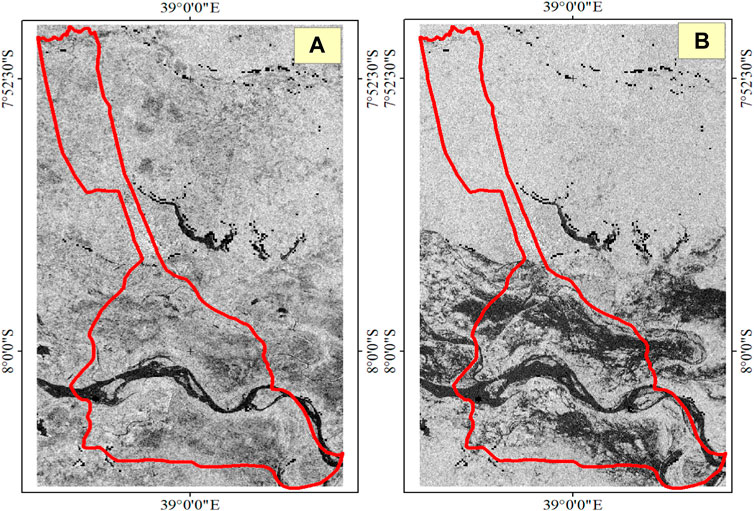
FIGURE 3. Sentinel-1 composites for the year 2020; the image covered the Ikwiriri site (indicated with red boundary). (A) The composite reference image was taken in August and September. (B) The composite image was taken during flood season in March and April.
In change detection, the difference between the reference image and the composite images captured during the flooding season was computed. Changed surface conditions were highlighted in the difference image by variations in radar responses (Clement et al., 2018). Compared to other surfaces that are not covered by water, the water’s low backscatter radar signals make it appear darker in SAR images (Singha et al., 2020). As a result of the flood water’s low radar backscatter signal and changes in surface conditions brought on by the presence of water, there is a significant negative backscatter value in the difference image (Pandey et al., 2022). WWF HydroSHEDS Void-Filled DEM was used to mask areas with greater than 5% slope in order to mask out topographic areas that are not likely to flood. Large negative backscatter values were employed to highlight inundated areas in the thresholding strategy, which classified the image into flooded and non-flooded classes based on backscatter values (Long et al., 2014). Backscatter values of −15 dB or below were employed as a threshold for flooded areas. This threshold has been used for locating flood signals in river floodplains in other river basins of Africa (Kouassi et al., 2020).
Sentinel-2 images were used to determine the accuracy of Sentinel-1 SAR-derived flood maps (McCormack et al., 2022). Water features were extracted from multispectral Sentinel-2 imageries by computing modified normalized difference water index (mNDWI) using green and short wave infra-red (SWIR). The choice of Sentinel-2 as the reference map was dictated by the temporal proximity of Sentinel-1 and 2, and reference images were taken during the flood season (McCormack et al., 2022). The mNDWI was chosen to extract water features due to its ability to distinguish water features from built-up (Xu, 2006). The flood extent map was computed from SAR and was compared against mNDWI (Clement et al., 2018). For validation, 500 validation points were randomly selected from the sentinel-2-derived flood map and compared with the sentinel-1 flood map where producer, user, and total accuracies were computed along with Cohen’s Kappa coefficient of agreement.
2.3.2 Land use and cover map processing
Land use and cover maps for the years 2017–2022 were processed in GEE using Sentinel-2 MSI images. Random Forest (RF) classifier was used to classify a composite of images captured in March and April (Phan et al., 2020). RF is the most popular classifier for classifying land covers and has proven to be able to handle noisy datasets and outliers while still producing higher-accuracy classification results (Tamiminia et al., 2020). The aforementioned justifications describe why the RF classifier was utilized in this study to classify LULC. Seven land use/land cover (LULC) classes (forest, bushland, built-up, farmland, bare land, wetland, and water) were generated using the RF classifier training data based on pixel values. The accuracy assessment was carried out by visually interpreting 500 randomly selected ground truth points on a sentinel-2 image and comparing them to classified LULC. Finally, user, producer, overall accuracies, and Cohen’s Kappa coefficient were obtained from the confusion matrix.
The LULC raster data was transformed to a vector format, and classes with similar values for agricultural land were merged in order to determine the regions under cultivation. Flood-affected fields were created by superimposing extracted agricultural land layer and flood layer since the Sentinel-1 flood map and LULC map both had 10 m spatial resolution.
3 Results
3.1 Flood maps accuracy
Flood map accuracy assessment was conducted for two locations, Ikwiriri and Mngeta, for the years 2017–2022. The assessment aimed to evaluate the accuracy of the flood mapping algorithm by measuring the Producer Accuracy (PA) and User Accuracy (UA) for both flooded and non-flooded areas. Additionally, the Overall Accuracy (OA) and Kappa Coefficient (KC) were calculated to provide an overall assessment of the accuracy of the flood maps (Table 2). For Ikwiriri, the results show that the flood mapping algorithm achieved reasonably high accuracy in identifying flooded areas. The UA values ranged from 90.00% to 97.14%, indicating that the algorithm correctly identified a significant portion of the flooded areas. The PA values were also high, ranging from 90.00% to 100.00%, suggesting that the algorithm effectively avoided misclassifying non-flooded areas as flooded. The Overall Accuracy (OA) ranged from 93.00% to 98.00%, indicating a consistently high level of accuracy. The Kappa Coefficient (KC) values ranged from 82.05% to 95.33%, indicating substantial agreement between the predicted and observed flood maps. For Mngeta, the flood mapping algorithm demonstrated consistent accuracy in identifying flooded areas, as reflected by the PA values ranging from 94.00% to 94.34%. The UA values were also consistently high, ranging from 95.83% to 100.00%, indicating a low rate of misclassification for non-flooded areas. The Overall Accuracy (OA) ranged from 93.20% to 97.06%, suggesting a high overall accuracy level. The Kappa Coefficient (KC) values ranged from 86.40% to 94.12%, indicating substantial agreement with flood maps.
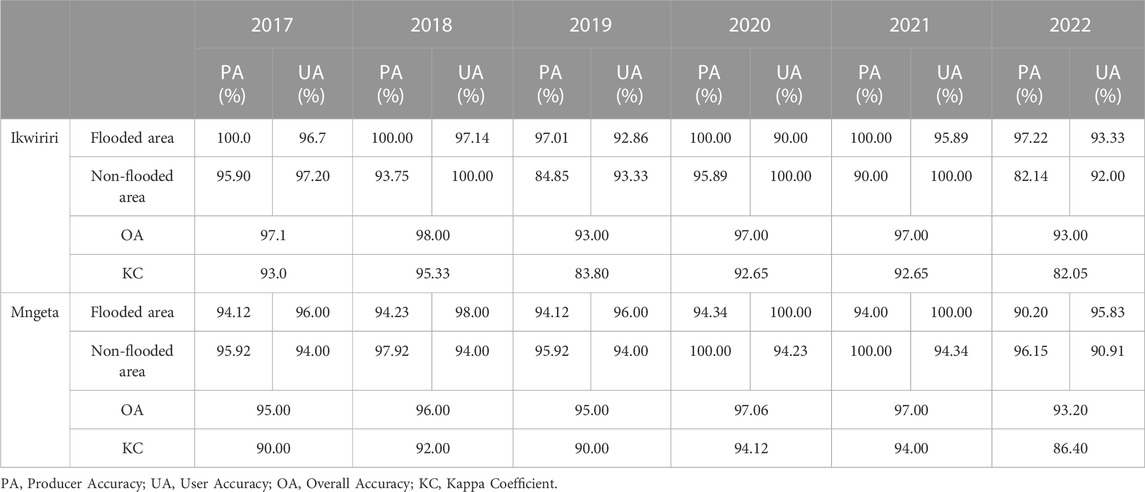
TABLE 2. Confusion matrix table for flood map accuracy assessment in two study areas.
3.2 Flood extent and spatial-temporal pattern
The flood extent in two study sites, Mngeta and Ikwiriri, was analyzed over a period of 6 years (2017–2022) to assess the dynamics of the floods. The results indicate significant variations in the flood extent between the two sites and across different years (Figure 5). In Ikwiriri, the flood extent showed considerable variability over the six-year period (Figure 4A). The highest flood extent was observed in 2020, with an area of 3,114.55 ha being flooded. This was followed by 2018, which had a flood extent of 2,285.64 ha. The flood extents in 2019, 2021, and 2022 were 2,029.25 ha, 1,772.17 ha, and 1,114.26 ha, respectively. The lowest flood extent was recorded in 2017, covering an area of only 627.92 ha. In Mngeta, the flood extent also varied considerably from year to year (Figure 4B). Again, the highest flood extent was observed in 2020, with an area of 9,300.11 ha being flooded. This was followed by 2018, which had a flood extent of 7,585.12 ha. The lowest flood extent was recorded in 2019, covering an area of only 2,046.76 ha. The subsequent years witnessed further fluctuations where flooded areas in 2017, 2021, and 2022 were 4,856.66 ha, 7,972.69 ha, and 2,563.16 ha, respectively. These fluctuations in the flooded area indicate a similar trend in extent and the dynamic nature of flooding and considerable interannual variability in flood extent within the study sites.
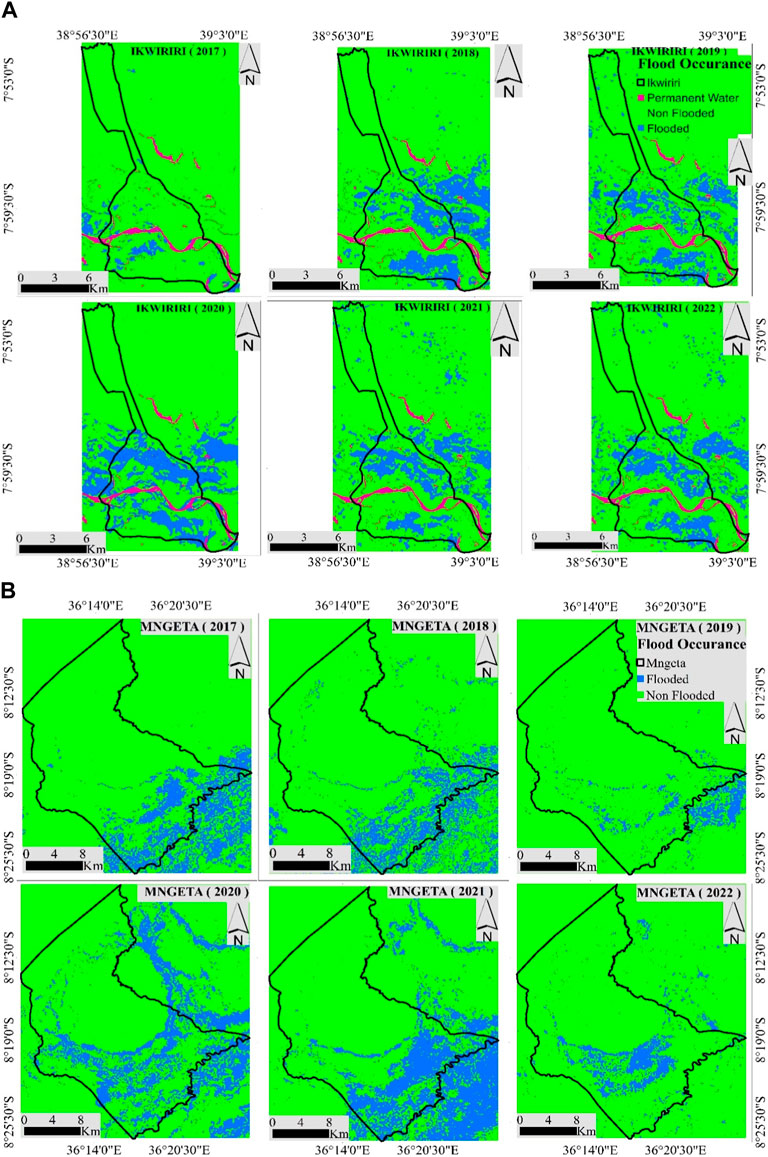
FIGURE 4. (A) The spatiotemporal pattern of flooded areas derived from Sentinel-1 imagery, capturing the dynamic patterns within the Ikwiriri study site from 2017 to 2022. (B) The spatiotemporal pattern of flooded areas derived from Sentinel-1 imagery, capturing the dynamic patterns within the Mngeta study site from 2017 to 2022.
3.3 Land use and cover mapping
Classification results of the land LULC of two study areas for the six mapped years are presented in Figures 6A, B. Computed producer and user accuracies for the two study areas for each LULC class are summarised in Tables 3, 4. In general, user and producer accuracies greater than 89.66% were obtained in agriculture and wetland classes across the two study areas and for the mapped years. The lowest user and producer accuracies were obtained in the Mngeta site in classes, built-up, water, and bare land. Furthermore, the overall accuracy and Kappa coefficients generated from the confusion matrix (Tables 3, 4) indicated that LULC had a higher overall accuracy (greater than 88%) across the two study areas for the six mapped years. The Kappa coefficient ranged from 76.27% to 85.91% across the two study areas and years which indicates good reliability for the produced LULC maps.
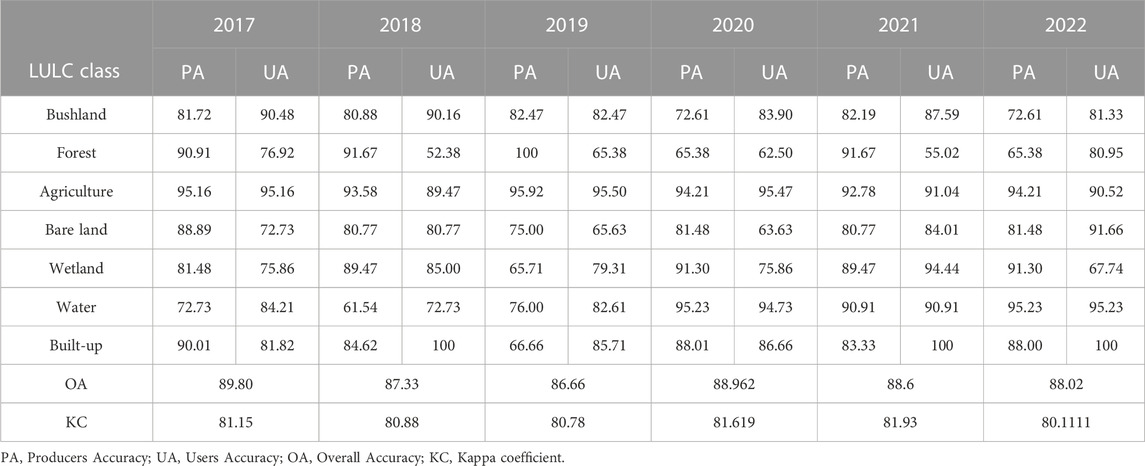
TABLE 3. Confusion matrix summary for Ikwiriri LULC classification accuracy.
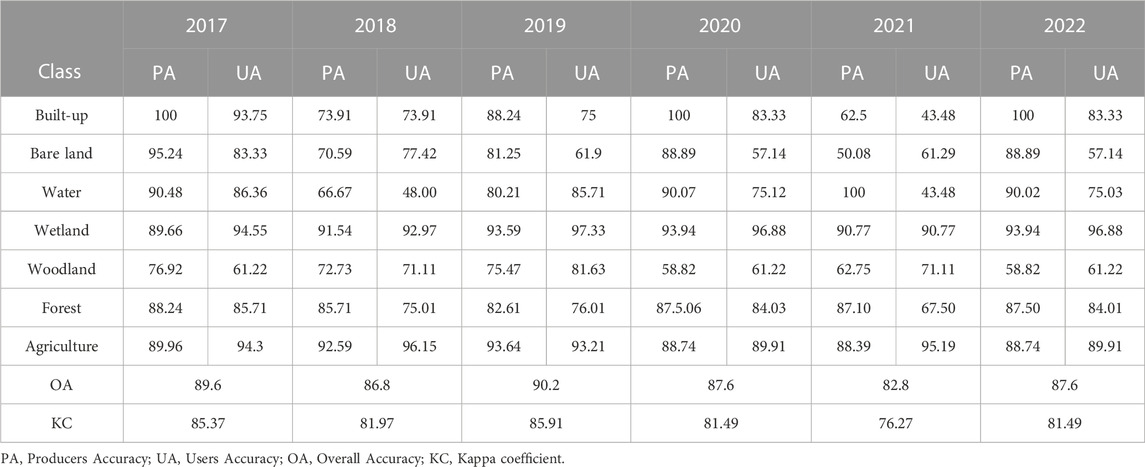
TABLE 4. Confusion matrix summary for Mngeta LULC classification accuracy.
The results section also presents the land use and land cover (LULC) patterns of the two study areas, Ikwiriri and Mngeta, over a period of 6 years. The dominant LULC class in both study areas was agriculture, which exhibited a consistent increase in area over the six mapped years (Table 5). In Ikwiriri, the agriculture class expanded from 2232.68 ha in 2017 to 5838.06 ha in 2022. Similarly, Mngeta experienced a significant expansion of agriculture from 20631.07 ha in 2017 to 26479.83 ha in 2022. This indicates a clear dominance of agricultural land use in both areas. A notable change observed in the study areas was the shrinking of the wetland areas. In Ikwiriri, the wetland area decreased from 998 ha in 2017 to 341.57 ha in 2022. Similarly, Mngeta witnessed a reduction in wetland area from 15518.24 ha in 2017 to 13561.76 ha in 2022. This decline in wetland areas highlights the potential environmental impact of land use changes and raises concerns about the conservation of wetland ecosystems. The analysis also revealed the presence of other LULC classes. Bushland, bare land, water bodies, and built-up areas were identified in both study areas; their extents also varied across the years. The classification results were consistent across the years, indicating the robustness of the random forest classifier in accurately mapping the LULC patterns. Generally, the results suggest that the land use/cover in both study sites changed over the six mapped years, with changes in the area covered by agriculture and bushland being the most prominent.
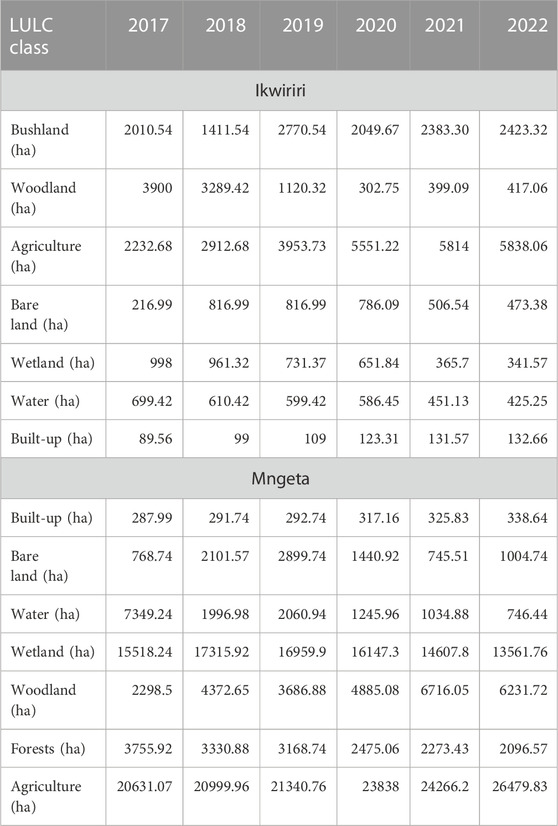
TABLE 5. Land use/cover coverage of the two study sites for the six mapped years classified using a random forest classifier.
3.4 Flood-affected cultivated areas
This section highlights the trend of the cultivated land affected by floods in the two study areas, Mngeta and Ikwiriri, by focusing on the percentage of flooded areas per total cultivated area for the mapped years.
In Mngeta, the percentage of flooded areas varied between 1.49% in 2017 and 5.53% in 2020 (Table 6). This indicates that the extent of flooded areas relative to the total cultivated area fluctuated over the years (Figure 9B). The years with low flooded areas, such as 2017 and 2022, had percentages below 2.5%. Conversely, the year 2020 stands out with a notably high percentage of 5.53%. This suggests that 2020 experienced a significant increase in flooded areas compared to other years in Mngeta. Moving to Ikwiriri, the percentages of flooded areas per total cultivated areas were considerably higher compared to Mngeta (Figure 9A). The year 2018 exhibited an exceptionally high percentage of 54.95%, indicating that over half of the total cultivated area was affected by floods during that year. Similarly, 2019 and 2020 had relatively high percentages of 49.36% and 35.17%, respectively. These years can be considered periods with significant flood impacts on cultivated land in Ikwiriri. In contrast, the years 2017 and 2022 showed relatively lower percentages of flooded areas in Ikwiriri, with values of 14.82% and 14.00%, respectively. Although these percentages are lower compared to the years with highly flooded areas, they still indicate a considerable impact on agricultural land. Trends of the cultivated areas affected by floods align with the trends of the total areas affected by floods in the two study sites shown in Figure 5.
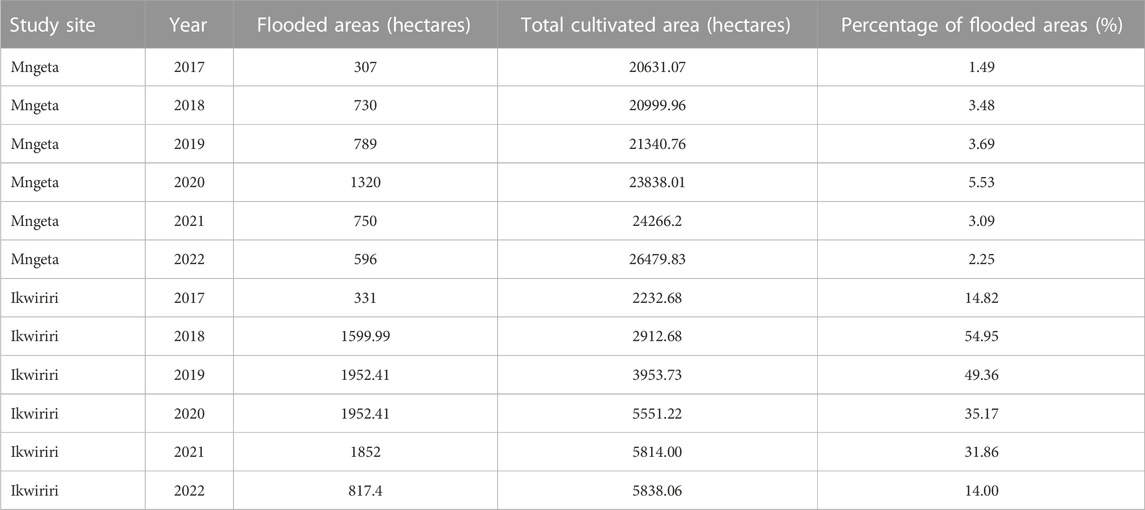
TABLE 6. The table provides the year-wise information on flooded areas, total cultivated areas, and the percentage of flooded areas relative to the total cultivated areas for each study site, Mngeta and Ikwiriri. The actual areas affected by floods are presented in hectares, while the percentages indicate the proportion of flooded areas in relation to the total cultivated areas.
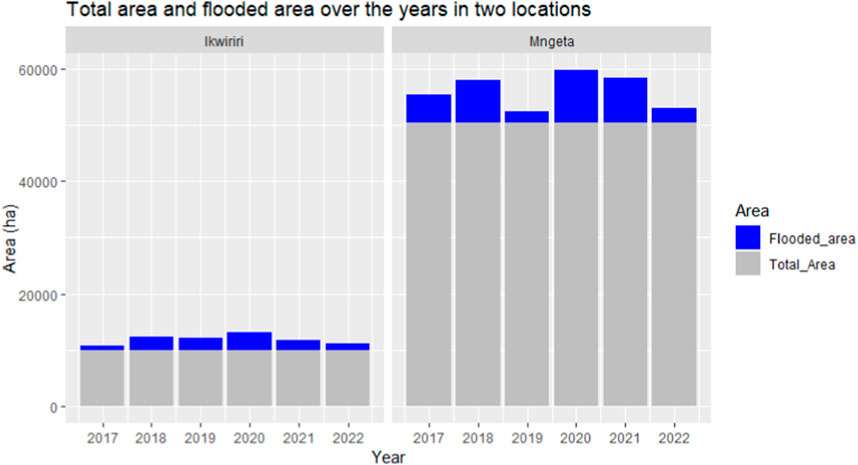
FIGURE 5. Flood extent in the Ikwiriri and Mngeta sites for the six mapped years from 2017 to 2022.
4 Discussion
In the present study, we used data from Sentinel-1 to map the extent of floods in two Sub-basins of the Rufiji Basin, Tanzania using the GEE cloud computation platform. In the following sections, we discuss mapping floods with open-source Sentinel-1 SAR and GEE, the land cover of the mapped areas, and the spatiotemporal pattern of the floods in two areas over the mapped years.
4.1 Successful flood and land cover mapping using open-source data and GEE
Change detection and thresholding (CDAT) was employed in this study to map floodplains at two different sites utilizing sentinel-1 imageries. Higher accuracy of flood maps was obtained and the results can be attributed to Sentinel-1’s ability to differentiate water from other surface features in classification images (Singha et al., 2020) since water has a relatively low backscatter coefficient so that these surfaces are clearly distinguished from other surface features (Singha et al., 2020). Our findings show that across years and sites, the maps’ overall accuracy (OA) was higher than 93%, and their dependability was likewise significant. Similar findings have been reported by Long et al., 2014; Clement et al., 2018; Singha et al., 2020, who used the CDAT method to create flood maps with an accuracy of more than 90% using Sentinel-1 data. Thus, we were able to confirm the effectiveness of CDAT algorithms for flood detection and classification using Sentinel-1 Radar images (Long et al., 2014; Singha et al., 2020), thereby providing an effective way to map floods in flood data-scarce regions such as the rice growing floodplains of Kilombero and Lower-Rufiji, Tanzania.
Using the Random Forest (RF) algorithm, we successfully generated high-accuracy land use and land cover (LULC) maps at a 10-m spatial resolution by utilizing multitemporal aggregated Sentinel-2 data (Figures 6A, B). Our findings align with a study by Kusmec et al. (2021), emphasizing the effectiveness of multitemporal image aggregation for accurate LULC mapping. The RF algorithm’s ability to handle complex datasets and capture nonlinear relationships, coupled with its ensemble learning approach and feature importance analysis, contributes to the robust and reliable classification of results (Zhang et al., 2022). The accurate LULC maps produced through this approach have significant importance for environmental monitoring and facilitating informed decision-making.
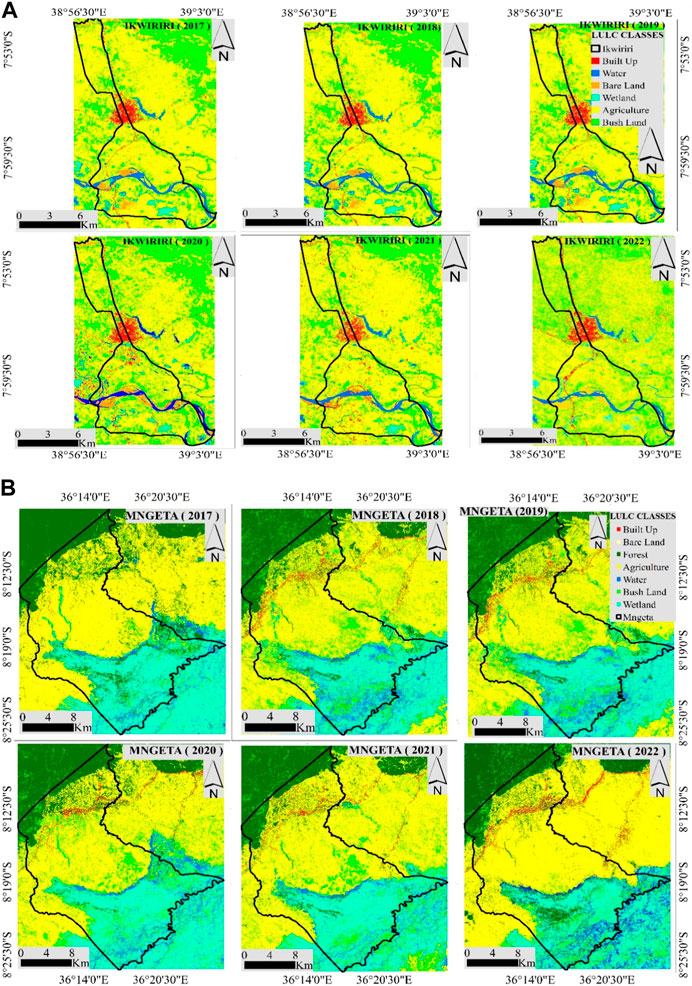
FIGURE 6. (A) The spatial pattern of land use/cover in the Ikwiriri site based on Sentinel-2 composite images showing the distribution of different LULC from 2017 to 2022. (B) The spatial pattern of land use/cover in the Mngeta site based on Sentinel-2 composite images showing the distribution of different LULC from 2017 to 2022.
4.2 Changes in land use and cover in study sites from 2017–2022
Generally, the two study areas are dominated by agricultural fields, which account for more than 49% of the total area of the study sites for the six mapped years. An expansion of the cultivated areas (Table 6) was observed, which could be attributed to rainfall anomalies across the six mapped years and the increased demand for rice. Zaveri et al. (2020) found that rainfall anomaly is one of the significant causes of cropland expansion in developing countries. Wetland was also a key land cover, and they were observed to be shrinking from the year 2017–2022. The shrinking of the total areas covered by wetlands and water bodies can be attributed to the declining amount of water due to the decline in total rainfall at the two sites from the year 2017–2022. According to Leemhuis et al. (2017), rice plantations have gradually replaced wetland habitats in the Kilombero Valley, resulting in a loss of 60.15% in the wetland area of the Kilombero Valley (from 5,436 km2 in 1990 to 2166 km2 in 2016). However, a larger time span than 6 years would be preferable for analyzing further land use changes in our two study areas.
4.3 Spatial-temporal pattern of floods and affected fields
The analysis of interannual variability in flooded areas revealed that flood occurrences in the two sub-basins are dynamic, indicating a fluctuating pattern. It was observed that areas that experience floods in 1 year may face water shortages in other years, highlighting the temporal variability of flood events. These findings are consistent with previous studies conducted by Duvail and Hamerlynck. (2007) and Gabiri et al. (2018), which also reported the hydrodynamic extremes within the two sub-basins. Figures 4A, B further demonstrate the spatial pattern of floods, showing concentration along the river and near wetland areas. In the Kilombero basin, where the Mngeta division is located, floods have been attributed to factors such as overflowing rivers and streams, shallow groundwater leading to quick soil saturation during prolonged rainy seasons, and lateral water flow from mountainous regions (Gabiri et al., 2018). Extensive discussions have taken place regarding the impact of basin morphology on flood events in the Kilombero basin and Lower-Rufiji, as documented by Kato. (2007) and Duvail and Hamerlynck. (2007). The basin morphology of Kilombero and Lower-Rufiji, which are the specific locations of our study, is illustrated in Figures 7, 8. These figures demonstrate that flood-prone areas, as indicated by the identified flood hotspots and corresponding results, are closely connected to the river and water areas such as wetlands. This correlation is evident in the observed flood patterns depicted in Figures 9A, B. Similarly, floods in the Lower Rufiji, where the Ikwiriri ward is situated, are primarily caused by the overflow of the Rufiji River due to rainfall and floods in the upstream sub-basins, including the Kilombero sub-basin.
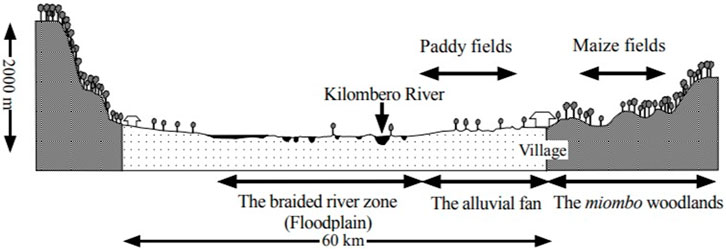
FIGURE 7. Kilombero sub-basin typical profile. Adopted from Kato. (2007).
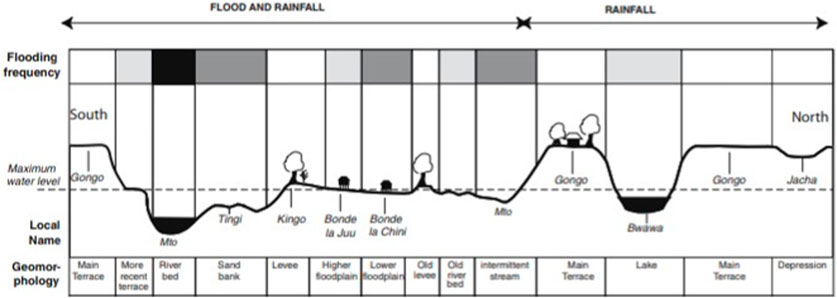
FIGURE 8. Lower-Rufiji sub-basin typical profile showing characteristics of the floodplain topography. Adopted from Duvail and Hamerlynck. (2007).
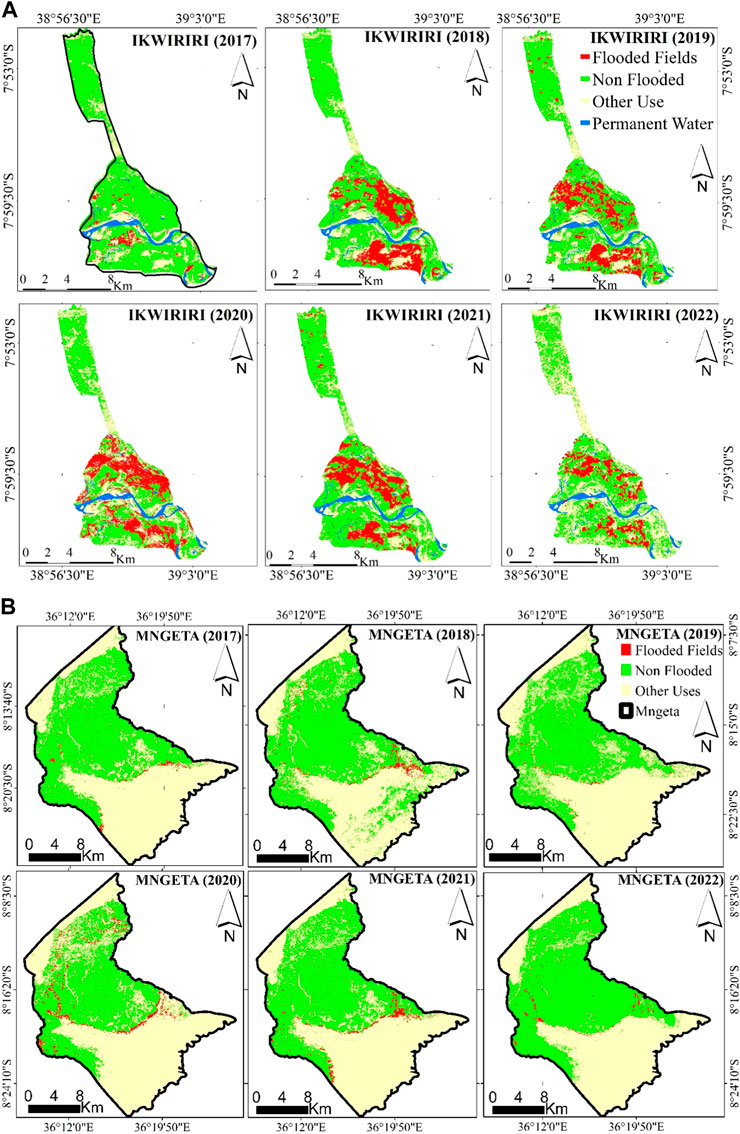
FIGURE 9. (A) The spatiotemporal pattern of floods affecting agricultural fields covering the Ikwiriri site for six mapped years (2017 to 2022). (B) The spatiotemporal pattern of floods affecting agricultural fields covering the Mngeta site for six mapped years (2017 to 2022).
According to our findings, In Mngeta, there is an expansion of cultivated areas and continuous shrinking in the wetland area; this is also evident in other studies (Leemhuis et al., 2017). As rice fields expand close to or into the wetland areas, more of the fields succumb to submergence stress caused by seasonal floods. Kwesiga et al. (2019) also found that rice yield gaps depend on the hydrological position of the farms in the Kilombero basin. Up to 38% of the total yield gap has been linked to adverse hydrology at the Kilombero floodplain’s central position (areas closer to the water bodies such as rivers and wetlands. This yield gap was influenced by the depth and length of the flood water, especially when rice was at its early reproductive growth stage, which is vulnerable to submergence (Kwesiga et al., 2019). In Ikwiriri, affected fields are along the Rufiji River and the pattern is similar across years (Figures 7A, B). During extreme floods, especially when floods are not synchronized with rainfall, rice farmers near the Rufiji River suffer greater crop losses (Duvail and Hamerlynck, 2007).
The significance of our study lies in its contribution toward enhancing the understanding of hydrodynamics in two specific target areas. Through our research, we have demonstrated the valuable role that remote sensing plays in monitoring flooding within a region that lacks sufficient data on rice cultivation. By harnessing the power of remote sensing technology, we have unveiled the potential for using it as a useful tool in flood monitoring within data-scarce rice-growing regions. One of the key implications of our findings is the identification of effective mitigation strategies, which are made possible through the mapping techniques employed. Our study has shed light on the geographical patterns and dynamics associated with the spatial extent of lands affected by floods, both agricultural and non-agricultural. By generating detailed maps, we have provided valuable insights that can guide decision-making processes related to flood mitigation efforts. Furthermore, the maps generated through our study have the potential to inform and guide various applications, including rice breeding initiatives. With access to accurate flood-related data and insights into the areas impacted by floods, our research facilitates informed decision-making regarding the selection of locations for variety testing and distribution as part of rice breeding programs. This enables researchers and stakeholders in the agricultural sector to optimize their efforts in developing resilient rice varieties that are better suited for flood-prone regions.
5 Conclusion
The findings of this study show that remote sensing technologies can provide fast information about the extent of floods in river valleys. Open-source Sentinel-1 SAR data was used to map flooding and land use in two target regions. According to our analysis of Sentinel-1 SAR, both study sites experienced floods, but the extent varied across years and space. Additionally, a distinct geographical pattern of flooding was observed in two locations across a number of years, with submergence-prone areas being spatially positioned along similar rivers and wetlands. Our findings indicate how open-source Sentinel-1 SAR data has the potential for developing flood inundation maps with high accuracy and high spatial resolution even under the prevalence of severe cloud cover during flooding periods. The Change Detection and Thresholding Technique used in this study to map floods with Sentinel-1 and land use/cover with Sentinel-2 was relatively simple and was based on publicly available data. We find the method applicable for other data-scarce region locations where flood gauging stations are rare. Additionally, the cloud computation platform (GEE platform) offered a valuable area for computing large amounts of remote sensing data without heavily relying on the processing speed and storage capacity of the user’s computer. In order to increase rice farmers’ resilience to extreme weather events in the face of climate change, the identified flood-prone areas can be a useful tool and foundation for management decisions, such as setting up multi-environmental trials for flood-tolerant varieties and directing the dissemination of tolerant varieties.
Data availability statement
The raw data supporting the conclusions of this article will be made available by the authors, without undue reservation.
Author contributions
PM conceptualized the study, conducted the analysis and drafted the manuscript. HS, MS, MH, JM, and BM reviewed and edited the study concept and the draft manuscript. All authors contributed to the article and approved the submitted version.
Acknowledgments
The authors gratefully acknowledge DANIDA for financing this research work through the Climate Smart African Rice Project (Grant agreement No. 18-03-KU). The European Space Agency (ESA) is also acknowledged for making Sentinel-1 and Sentinel-2 data available freely to authors. Last but not least, the authors do acknowledge the Google Earth Engine platform developers for providing an open-access platform for processing the data generated and used in this work.
Conflict of interest
The authors declare that the research was conducted in the absence of any commercial or financial relationships that could be construed as a potential conflict of interest.
Publisher’s note
All claims expressed in this article are solely those of the authors and do not necessarily represent those of their affiliated organizations, or those of the publisher, the editors and the reviewers. Any product that may be evaluated in this article, or claim that may be made by its manufacturer, is not guaranteed or endorsed by the publisher.
References
Amani, M., Ghorbanian, A., Ahmadi, S. A., Kakooei, M., Moghimi, A., Mirmazloumi, S. M., et al. (2020). Google earth engine cloud computing platform for remote sensing big data applications: A comprehensive review. J. Sel. Top. Appl. Earth Observations Remote Sens. 13, 5326–5350. doi:10.1109/jstars.2020.3021052
Chang’a, L. B., Kijazi, A. L., Luhunga, P. M., Ng, H. K., and Mtongori, H. I. (2017). Spatial and temporal analysis of rainfall and temperature extreme indices in Tanzania. Atmos. Clim. Sci. 7, 525–539. doi:10.4236/acs.2017.74038
Clauss, K., Ottinger, M., and Kuenzer, C. (2018). Mapping rice areas with Sentinel-1 time series and superpixel segmentation. Int. J. Remote Sens. 39 (5), 1399–1420. doi:10.1080/01431161.2017.1404162
Clement, M. A., Kilsby, C. G., and Moore, P. (2018). Multi-temporal synthetic aperture radar flood mapping using change detection. J. Flood Risk Manag. 11 (2), 152–168. doi:10.1111/jfr3.12303
Csorba, A., Szegi, T., Fodor, H., Bukombe, B., Uwiragiye, Y., Naramabuye, F. X., et al. (2019). Characterization of rice agriculture in the Southern Province of Rwanda by means of microwave remote sensing. Phys. Chem. Earth 112, 58–65. doi:10.1016/j.pce.2019.02.002
Dao, P. D., and Liou, Y. (2015). Object-Based flood mapping and affected rice field estimation with Landsat 8 OLI and MODIS Data. Remote Sens. J. 7, 5077–5097. doi:10.3390/rs70505077
Das, S. (2019). Geospatial mapping of flood susceptibility and hydro-geomorphic response to the floods in Ulhas basin, India. Soc. Environ. 14, 60–74. doi:10.1016/j.rsase.2019.02.006
Duvail, S., and Hamerlynck, O. (2007). The Rufiji River flood: Plague or blessing? Int. J. Biometeorology 52 (1), 33–42. doi:10.1007/s00484-007-0105-8
Gabiri, G., Burghof, S., Diekkrüger, B., Leemhuis, C., Steinbach, S., and Näschen, K. (2018). Modelling spatial soil water dynamics in a tropical floodplain, East Africa. Water 10 (2), 1–27. doi:10.3390/w10020191
Gebrekidan, B. H., Heckelei, T., and Rasch, S. (2020). Characterizing farmers and farming system in Kilombero Valley floodplain, Tanzania. Sustainability 12 (17), 7114–7121. doi:10.3390/su12177114
Hamerlynck, O., Duvail, S., Vandepitte, L., Kindinda, K., Nyingi, D. W., Paul, J. L., et al. (2011). La connexion des lacs est-elle utile? Inondations, pêche et moyens de subsistance dans les lacs dela plaine d’inondation du bas Rufiji en tanzanie. Hydrological Sci. J. 56 (8), 1436–1451. doi:10.1080/02626667.2011.630002
Höllermann, B., Näschen, K., Tibanyendela, N., Kwesiga, J., and Evers, M. (2021). Dynamics of human–water interactions in the Kilombero Valley, Tanzania: Insights from farmers’ aspirations and decisions in an uncertain environment. Eur. J. Dev. Res. 33, 980–999. doi:10.1057/s41287-021-00390-4
Ismail, A. M., Johnson, D. E., Ella, E. S., Vergara, G. V., and Baltazar, A. M. (2012). Adaptation to flooding during emergence and seedling growth in rice and weeds, and implications for crop establishment. Oxf. Journals 2012, pls019–18. doi:10.1093/aobpla/pls019
Kalala, A., Semoka, J., and Amuri, N. (2017). Optimum levels of sulphur and zinc for rice in lowland areas of Kilombero district, Tanzania. J. Exp. Agric. Int. 15 (1), 1–11. doi:10.9734/jeai/2017/29773
Kato, F. (2007). Development of a major rice cultivation area in the Kilombero Valley, Tanzania. Afr. Study Monogr. 36, 3–18. doi:10.14989/68498
Koppa, N., and Amarnath, G. (2021). Geospatial assessment of flood-tolerant rice varieties to guide climate adaptation strategies in India. Climate 9 (151), 151–215. doi:10.3390/cli9100151
Kouassi, K. H., N’go, Y. A., Anoh, K. A., Koua, T. J. J., and Stoleriu, C. C. (2020). Contribution of sentinel 1 radar data to flood mapping in the san-pédro river basin (South-west Côte d’Ivoire). Asian J. Geogr. Res. 3 (2), 1–8. doi:10.9734/ajgr/2020/v3i230101
Kuenzer, C., and Knauer, K. (2013). Remote sensing of rice crop areas. Int. J. Remote Sens. 34 (6), 2101–2139. doi:10.1080/01431161.2012.738946
Kusmec, A., Zheng, Z., Archontoulis, S., Ganapathysubramanian, B., Hu, G., Wang, L., et al. (2021). Interdisciplinary strategies to enable data-driven plant breeding in a changing climate. One Earth 4 (3), 372–383. doi:10.1016/j.oneear.2021.02.005
Kwesiga, J., Grotelüschen, K., Neuho, D., Senthilkumar, K., Döring, T. F., and Becker, M. (2019). Site and management E ff ects on grain yield and yield variability of rainfed lowland rice in the Kilombero floodplain of Tanzania. Agronomy 2019, 1–16. doi:10.3390/agronomy9100632
Leemhuis, C., Thonfeld, F., Näschen, K., Steinbach, S., Muro, J., Strauch, A., et al. (2017). Sustainability in the food-water-ecosystem nexus: The role of land use and land cover change for water resources and ecosystems in the Kilombero Wetland, Tanzania. Sustainability 9 (9), 1513–1518. doi:10.3390/su9091513
Long, S., Fatoyinbo, T. E., and Policelli, F. (2014). Flood extent mapping for Namibia using change detection and thresholding with SAR. Environ. Res. Lett. 9 (3), 035002. doi:10.1088/1748-9326/9/3/035002
Mackill, D. J., Ismail, A. M., Singh, U. S., Labios, R. V., and Paris, T. R. (2012). Development and rapid adoption rice varieties. IAdvances Agron. 1 (115), 299–352. doi:10.1016/B978-0-12-394276-0.00006-8
McCormack, T., Campanyà, J., and Naughton, O. (2022). A methodology for mapping annual flood extent using multi-temporal Sentinel-1 imagery. Remote Sens. Environ. 282, 113273–113319. doi:10.1016/j.rse.2022.113273
Meliyo, J. L., Kashenge-killenga, S., Victor, K. M., Mfupe, B., Hiza, S., Kihupi, L., et al. (2017). Evaluation of salt affected soils for rice (Oryza Sativa) production in Ndungu irrigation scheme same District, Tanzania. Sustain. Agric. Res. 6 (1), 24–38. doi:10.5539/sar.v6n1p24
Mosleh, M. K., Hassan, Q. K., and Chowdhury, E. H. (2015). Application of remote sensors in mapping rice area and forecasting its production: A review. Sensors 15 (1), 769–791. doi:10.3390/s150100769
Nasrin, S., Lodin, J. B., Jirström, M., Holmquist, B., and Djurfeldt, A. A. (2015). Drivers of rice production: Evidence from five sub - saharan african countries. Agric. Food Secur. 2015, 1–19. doi:10.1186/s40066-015-0032-6
Pandey, A. C., Kaushik, K., and Parida, B. R. (2022). Google Earth engine for large-scale flood mapping using SAR data and impact assessment on agriculture and population of Ganga-Brahmaputra Basin. Sustainability 14 (7), 4210–4222. doi:10.3390/su14074210
Phan, T. ., Kuch, V., and Lehnert, L. W. (2020). Land cover classification using Google Earth engine and random forest classifier-the role of image composition. Remote Sens. 12 (15), 2411–2422. doi:10.3390/rs12152411
Rudiyanto, M. B., Minasny, B., Shah, R. M., Soh, N. C., Arif, C., and Setiawan, B. I. (2019). Automated near-real-time mapping and monitoring of rice extent, cropping patterns, and growth stages in Southeast Asia using Sentinel-1 time series on a Google Earth Engine platform. Remote Sens. 11 (14), 1666–1727. doi:10.3390/rs11141666
Segarra, J., Buchaillot, M. L., Araus, J. L., and Kefauver, S. C. (2020). Remote sensing for precision agriculture: Sentinel-2 improved features and applications. Agronomy 10 (5), 641–718. doi:10.3390/agronomy10050641
Singha, M., Dong, J., Sarmah, S., You, N., Zhou, Y., Zhang, G., et al. (2020). Identifying floods and flood-affected paddy rice fields in Bangladesh based on Sentinel-1 imagery and Google Earth Engine. J. Photogrammetry Remote Sens. 166, 278–293. doi:10.1016/j.isprsjprs.2020.06.011
Tamiminia, H., Salehi, B., Mahdianpari, M., Quackenbush, L., Adeli, S., and Brisco, B. (2020). Google earth engine for geo-big data applications: A meta-analysis and systematic review. J. Photogrammetry Remote Sens. 164, 152–170. doi:10.1016/j.isprsjprs.2020.04.001
Torbick, N., Chowdhury, D., Salas, W., and Qi, J. (2017). Monitoring rice agriculture across Myanmar using time series sentinel-1 assisted by landsat-8 and PALSAR-2. Remote Sens. 9 (2), 119. doi:10.3390/rs9020119
Uddin, K., Matin, M. A., and Meyer, F. J. (2019). Operational flood mapping using multi-temporal sentinel-1 SAR images: A case study from Bangladesh. Remote Sens. 11 (13), 1581–1619. doi:10.3390/rs11131581
Ullah, K., and Zhang, J. (2020). GIS-based flood hazard mapping using relative frequency ratio method: A case study of panjkora River Basin, eastern hindu kush. PLoS ONE 2020, 1–18. doi:10.1371/journal.pone.0229153
United Republic of Tanzania (URT) (2019)). Mapping abiotic stresses for rice in Africa: Drought, cold, iron toxicity, salinity and sodicity. Field Crops Res. 219, 55–75. doi:10.1016/j.fcr.2018.01.016
van-Oort, P. A. J. V., Saito, K., Tanaka, A., Amovinassagba, E., Bussel, L. G. J., van Wart, J., et al. (2015). Assessment of rice self-sufficiency in 2025 in eight African countries. Glob. Food Secur. 5, 39–49. doi:10.1016/j.gfs.2015.01.002
Xu, H. (2006). Modification of normalised difference water index (NDWI) to enhance open water features in remotely sensed imagery. Int. J. Remote Sens. 27 (14), 3025–3033. doi:10.1080/01431160600589179
Zaveri, E., Russ, J., and Damania, R. (2020). Rainfall anomalies are a significant driver of cropland expansion. Proc. Natl. Acad. Sci. U. S. A. 117 (19), 10225–10233. doi:10.1073/pnas.1910719117
Zhang, M., Chen, F., Liang, D., Tian, B., and Yang, A. (2020). Use of sentinel-1 GRD SAR images to delineate flood extent in Pakistan. Sustainability 12, 5784–5819. doi:10.3390/su12145784
Zhang, Y., Liu, J., and Shen, W. (2022). A review of ensemble learning algorithms used in remote sensing applications. Appl. Sci. 12, 8654. doi:10.3390/app12178654
Keywords: rice submergence, floodplains, synthetic aperture radar, Google earth engine, flood maps
Citation: Michael PS, Sanga HG, Shitindi MJ, Herzog M, Meliyo JL and Massawe BHJ (2023) Uncovering spatiotemporal pattern of floods with Sentinel-1 synthetic aperture radar in major rice-growing river basins of Tanzania. Front. Earth Sci. 11:1183834. doi: 10.3389/feart.2023.1183834
Received: 10 March 2023; Accepted: 14 July 2023;
Published: 26 July 2023.
Edited by:
Liew Juneng, National University of Malaysia, MalaysiaReviewed by:
Mou Leong Tan, University of Science Malaysia (USM), MalaysiaAdarsh S., TKM College of Engineering, India
Copyright © 2023 Michael, Sanga, Shitindi, Herzog, Meliyo and Massawe. This is an open-access article distributed under the terms of the Creative Commons Attribution License (CC BY). The use, distribution or reproduction in other forums is permitted, provided the original author(s) and the copyright owner(s) are credited and that the original publication in this journal is cited, in accordance with accepted academic practice. No use, distribution or reproduction is permitted which does not comply with these terms.
*Correspondence: Paulo Sulle Michael, cGF1bG9wcm90dXNAZ21haWwuY29t