
94% of researchers rate our articles as excellent or good
Learn more about the work of our research integrity team to safeguard the quality of each article we publish.
Find out more
ORIGINAL RESEARCH article
Front. Earth Sci., 11 May 2023
Sec. Structural Geology and Tectonics
Volume 11 - 2023 | https://doi.org/10.3389/feart.2023.1183734
This article is part of the Research TopicQuantitative Characterization and Engineering Application of Pores and Fractures of Different Scales in Unconventional Reservoirs, volume IIIView all 15 articles
 Linjie Feng1,2
 Yuqiang Jiang1,2Guian Guo3Changcheng Yang3Xun Zhu3Qinggao Zeng4Guangyin Cai1,2
 Zhanlei Wang1,2*
Based on porosity and permeability tests, high-pressure mercury injection (HPMI), nuclear magnetic resonance (NMR) and centrifugal experiments, this study comprehensively analyzed the quality, pore structure and fractal characteristics of tight sandstone reservoir in meandering stream facies. The purpose is to reveal the relationship between physical properties, geometry and topological parameters of pores, fluid mobility and heterogeneity of pore system of tight sandstone reservoirs in meandering stream facies. The results show that the second member of the Middle Jurassic Shaximiao Formation (J2S2) in the central Sichuan Basin has developed tight sandstone reservoir of meandering fluvial facies, the pore radius of type I reservoir (K>0.3 mD) is mainly distributed at 0.01 μm∼2 μm, the tortuosity ranges between 2.571 and 2.869, and the average movable fluid saturation is 70.12%. The pore radius of type II reservoir (0.08mD<K<0.3 mD) is mainly 0.003 μm∼1 μm, the tortuosity ranges between 2.401 and 3.224, the average movable fluid saturation is 57.59%. The pore radius of type III reservoir (K<0.08 mD) is mainly 0.001 μm∼0.4 μm, the tortuosity ranges between 0.905 and 2.195, and the average movable fluid saturation is 13.46%. Capillary-Paraachor point (CP point) and T2 cut-off value (T2cutoff) are used to divide the fractal interval of capillary pressure curve and T2 spectrum. The fractal dimension Dh2 of small pores calculated by HPMI through 3D capillary tube model, the fractal dimension Dn1 of large pores and Dn2 of small pores calculated by NMR through wetting phase model can effectively characterize the heterogeneity of reservoir pores. Among them, Dn1 has a strong negative correlation with porosity, permeability, pore radius and movable fluid saturation, indicating that the reservoir capacity, seepage capacity and pore size are mainly controlled by large pores, therefore, Dn1 can be used as an effective reservoir evaluation parameter.
In the past few decades, conventional oil and gas resources have continued to decrease. In view of the growing global demand for fossil energy, unconventional oil and gas resources such as tight gas have received widespread attention (Nelson, 2009; Zou et al., 2012a; Qu et al., 2020; Awan et al., 2021). China is rich in tight gas resources with reserves of about 21.85×10¹²m3 (Sun et al., 2019). Unlike conventional oil and gas bearing sandstone, the tight sandstone are characterized by low porosity and low permeability, and usually have complex micro-nano-scale pore systems and strong heterogeneity (Xiao et al., 2017; Li et al., 2018b; Zang et al., 2022a). Therefore, there are great challenges in the exploration and development of tight sandstone oil and gas reservoirs. Decades of production practice results show that pore structure is critical to the storage and seepage capacity of tight sandstone reservoir, and controls the distribution of oil and gas reservoir productivity and production effect (Wang et al., 2018b; Huang et al., 2018; Qu et al., 2020). Therefore, the study of pore structure and heterogeneity of tight sandstone is helpful to reveal the migration and enrichment mechanism of tight oil and gas and is of great significance to realize efficient development (Li et al., 2017; Nie et al., 2021).
In recent years, the pore structure characterization technology of tight sandstone has been developed rapidly, and many technical means have been used to study the two-dimensional and three-dimensional pore characteristics of tight reservoirs, mainly including image analysis technology, fluid injection technology and radiation detection technology (Li et al., 2019; Wu et al., 2022a). Through image analysis technology, the geometric characteristics such as pore throat shape and size, as well as the topological characteristics such as connectivity and coordination number of tight sandstone can be directly observed, and the main technologies include X-ray computed tomography (CT), scanning electron microscope (SEM), cast thin sections (CTS), etc (Zou et al., 2012b). Fluid injection technology is mainly used to characterize pore size and pore size distribution (PSD), and the main technical means include low-pressure nitrogen gas adsorption (N2GA), high-pressure mercury intrusion (HPMI) and constant-rate mercury injection (CRMI) (Nooruddin et al., 2014; Li et al., 2019; Wu et al., 2022b). At present, the relatively widely used radiation detection technology in the quantitative study of unconventional reservoir pore structure is mainly small-angle scattering (SAS) and nuclear magnetic resonance (NMR), which also mainly characterizes geometric parameters such as pore size and distribution (Clarkson et al., 2012; Wu et al., 2022a). However, the pore size that can be characterized by any test technology is limited, and the full-size pore distribution cannot be characterized by a single method. Therefore, it is necessary to combine various means to describe the pore structure characteristics of the reservoir more comprehensively (Wang and Wang, 2022). The combination of HPMI and NMR is the most commonly used characterization method of full-size pore distribution in previous studies. Some scholars have proposed different methods to convert T2 spectrum into PSD based on HPMI(Dai et al., 2019; Huang et al., 2020). In addition, the geometric parameters and topological parameters of pore throat can be obtained through the above techniques, but neither can directly and quantitatively characterize the heterogeneity of pores (Cui et al., 2022).
Fractal theory was proposed by Mandelbrot and Wheeler (1983) and was initially used to overcome the defects of Euclidean geometry in describing self-similar geometric structures. Pfeiferper and Avnir (1983) first introduced it into the study of porous media. Previous studies have demonstrated that the pore volume and PSD in sedimentary rocks have self-similarity, and its complexity can be evaluated by fractal dimension D) (Mandelbrot et al., 1984; Pfeifer, 1984). Fractal dimension is considered to be the bridge between micro heterogeneity and macro physical properties of reservoir (Li, 2010; Zhang and Weller, 2014; Li et al., 2017), which can be calculated based on NMR, HPMI, N2GA and other experimental data (Amadu and Pegg, 2018; Schmitt Rahner et al., 2018; Cui et al., 2022). Generally, the fractal dimension of sandstone pore space is between 2.0 and 3.0 (Li and Horne, 2006). The larger the fractal dimension is, the stronger the pore heterogeneity is. It has obvious correlation with physical properties, pore size, PSD and connectivity (Amadu and Pegg, 2018; Zang et al., 2022a).
At present, the research on pore fractal characteristics of tight sandstone mainly focuses on the delta sedimentary environment, especially the underwater distributary channel sand in the delta front of the Triassic Yanchang Formation in the Ordos Basin, China. Many scholars have adopted a variety of fractal dimension calculation models, including geometry model, thermodynamics model, 3D capillary tube model, wetting phase model, etc., (Wang et al., 2018a; Wang et al., 2019; Wang et al., 2021b), to calculated the fractal dimension of pore-throat in different intervals based on the data obtained from HPMI, NMR, CRMI and other experiments, the applicability of different models is discussed, and the relationship between fractal dimension and mineral composition, reservoir physical properties, pore-throat structural parameters (Song et al., 2018; Guo et al., 2020; Qu et al., 2020; Zang et al., 2022a) and oil and gas properties (Cui et al., 2022) is deeply studied, and a reservoir evaluation scheme considering fractal characteristics is proposed. At present, a large number of academic achievements have been published. In addition, there are also some reports on fractal characteristics of pore throat of tight sandstone formed by lacustrine gravity flow (Guo et al., 2020; Wu et al., 2022a), however, the fractal characteristics of tight sandstone in meandering stream facies are still less studied.
Sandstone gas reservoirs of meandering stream facies developed in the second member of Middle Jurassic Shaximiao Formation (J2S2 member) are important tight gas exploration targets in Sichuan Basin, and the main gas producing blocks are located in the central area of Sichuan Basin. Since 2020, 724.16×10⁸ m3 of proved reserves have been discovered, which is at the initial stage of development, and the understanding of pore structure of reservoir has not been deepened. Therefore, this study takes J2S2 tight sandstone as the research object and takes its pore structure and fractal characteristics as the research content. The main research objectives include: 1) Combining HPMI and NMR to quantitatively characterize the pore structure of J2S2 tight sandstone in the study area; 2) Propose a reasonable pore type and fractal interval division scheme based on pore connectivity and fluid mobility; 3) Obtain fractal dimensions of different types of pores based on different experiments, and clarify the relationship between fractal dimensions and reservoir physical properties, geometric and topological parameters of pores, and fluid mobility.
Sichuan Basin is located in southwest China (Figure 1A), with an area of about 19×105km2, is one of the most important petroliferous basins in China. The interior of the basin can be divided into 6 tectonic belts, including the Western Sichuan Depression, the northern tectonic belt, the central low flat zone, the southwestern low steep zone, the southern low steep zone, the eastern high-steep fold belt(Figure 1B) (Wang et al., 2021a). The location of the study area is shown in Figure 1B, which is located at the intersection of the southwest of the northern tectonic belt and the northwest of the central low flat zone. Since the Indosinian period, the tectonic movement in central Sichuan has been dominated by overall rise and fall. The current structural form of the target layer is generally a large gentle slope, with local nose bulge, In J2s2 member of the study area, a row of nose bulges is developed along the line from Well QL17 to Well QL205, and several faults are developed near the QL17 well block at the axis of the nose bulge (Figure 1C).
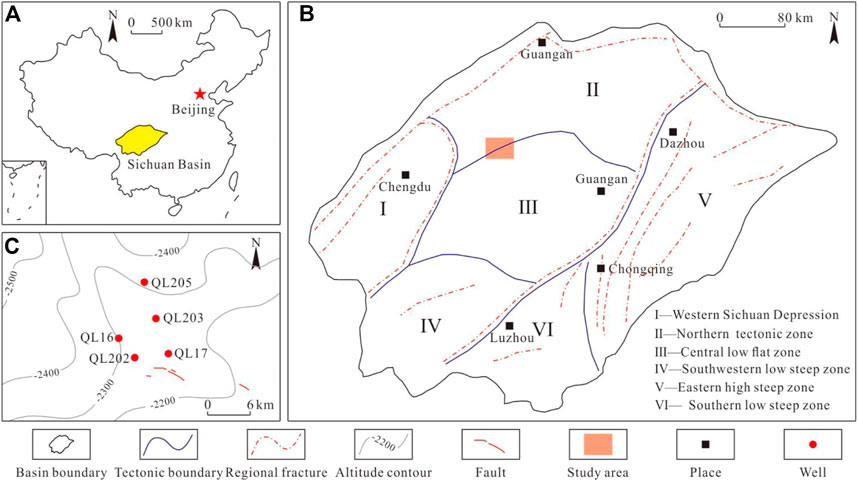
FIGURE 1. Location of the study area: (A). Location of Sichuan Basin in China; (B). Regional overview of the Sichuan Basin and the location of the study area; (C). Location of sampling well and bottom structure of J2s2 member.
In the Late Triassic, under the influence of Indosinian tectonic movement, the collision between the North China Block and the South China Block caused the overall uplift of the Sichuan Basin (Li et al., 2020), ending the marine sedimentary stage of about 300 Ma from the Sinian to the Late Triassic, and opening the continental sedimentary stage of 65 Ma from the Late Triassic to the Late Cretaceous. During the sedimentary period of the Middle Jurassic Shaximiao Formation, meandering river deposits developed in the study area, forming a red stratum with a thickness of about 1500 m, mainly composed of purplish red mudstone, mixed with gray-green mudstone and gray sandstone (Figure 2A). A set of black shale with a thickness of about 2 m and rich in fossils is developed in the Shaximiao Formation in this area, representing a rapid lake transgression-lake regression. Taking the top of this set of shale as the boundary, the Shaximiao Formation can be divided into Sha1 member (J2s1) and Sha2 member (J2s2) from bottom to top. The thick sand body of J2S2 member is generally 15 m∼20 m, with typical sedimentary characteristics of point bar in meandering stream. It is formed by the superposition of multiple sets of single sand bodies with positive grain sequence, and mainly develops parallel bedding. Scour surface is generally developed between single sand bodies, the purplish red and gray-green mudstone gravels can be seen at the bottom (Figure 2B).
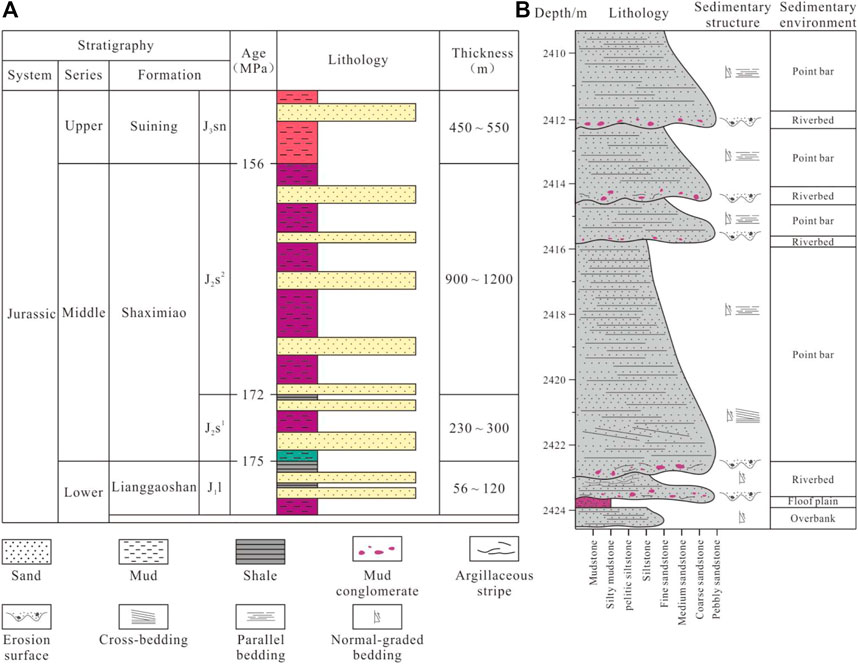
FIGURE 2. Stratigraphy and sedimentary characteristics of J2S2 member in the study area: (A). Stratigraphic division and lithological characteristics; (B). Sedimentary structure and environment based on Well QL16.
A total of 12 tight sandstone samples from 5 wells in the study area are used in this paper and the location of the sample source wells are shown in Figure 1C. All samples are drilled on the core of J2S2 member, with burial depth of 2100 m∼2400 m, and their initial shape are cylinder with a diameter of about 2.5 cm. Among them, Sample QL202-63 belongs to the riverbed sand body, Sample QL16-15 and QL203-13 belong to the overbank sand body, and the other samples are all point bar sand bodies.
Based on the above samples, four tests including permeability and porosity measurement, NMR and HPMI were carried out successively, of which the permeability and porosity tests were carried out according to the National Standard of the PRC GB/T 29172-2012, the NMR was accroding to oil and gas industry standard of the RPC SY/T 6490-2014, and the HPMI was accroding to National Standard of the PRC GB/T 29171-2012. Before the test, the residual oil in all samples was cleaned with dichloromethane and distilled water, and then the samples were dried (110°C, 24 h). Also, the diameter, length and mass of the samples were accurately measured. In addition, all samples shall be dried once (110°C, 24 h) after each test.
The permeability of the sample was measured with the GRT-1 gas permeability tester, and helium was used as the carrier gas during the experiment. The final test results were not corrected for the Klinkenberg effect.
The porosity of the sample was determined by alcohol saturation method. Because the lithology of the sample is dense, it is necessary to vacuumize these samples for 18 h with vacuumizing instrument, then the alcohol was degassed and injected into a vacuum container containing above samples, which is maintained for 24 h under the pressure of 20 MPa to ensure that the samples were completely saturated. Then take out the samples, immerse them in alcohol, weigh them in turn with a hanging scale, and measure the density of alcohol. After weighing, take the samples out of the alcohol, carefully remove the excess liquid on the surface of samples, and weigh them in the air. The porosity of the sample can be calculated according to the following formula:
Where:
Before the NMR experiment, the dry rock samples were vacuumized and saturated in the same way, the difference is that the saturated liquid used in the NMR experiment is deionized water. After the rock samples were completely saturated, take them out of the deionized water, carefully remove the excess water on the surface, and then weigh them in the air. Then the rock samples were wrapped in plastic paper and T2 spectrums were determined by NMRC12-010V low field nuclear magnetic resonance instrument produced by Niumac. The main parameters in the measurement process are set as follows: the test temperature is 32°C, the resonance frequency is 12 MHz, the number of echoes is 9000, the waiting time is 6000 ms, and the echo interval is 0.1 ms.
After the T2 spectrum of the saturated samples are determined, they were placed in the centrifuge for centrifugation to determine the saturation of the movable fluid and the cut-off value of the relaxation time T2(T2cutoff). In the process of centrifugation, low centrifugal force or short centrifugal duration will cause some movable fluid to be unusable, while high centrifugal force will cause some bound fluid to come out, so it is necessary to select appropriate centrifugal force and centrifugal duration. In previous studies, the centrifugal force selected for tight sandstone is mostly 200∼450psi, and the centrifugal duration is mostly 1∼3 h (Liu et al., 2019; Wu et al., 2022b; Zang et al., 2022b; Dong et al., 2023). The centrifugal force selected for the tight sandstone of Yanchang Formation in Ordos Basin, which is close to the physical properties of the samples in this study, is usually 400∼420 psi, and the centrifugal time is mostly 1∼1.5 h. Therefore, in this experiment, the centrifugal force is 417psi and the centrifugal duration is 1.5 h.
After centrifugation, weigh the rock samples in the air and measure the T2 spectrums. The movable fluid saturation can be obtained from the change of rock sample weight before and after centrifugation:
Where:
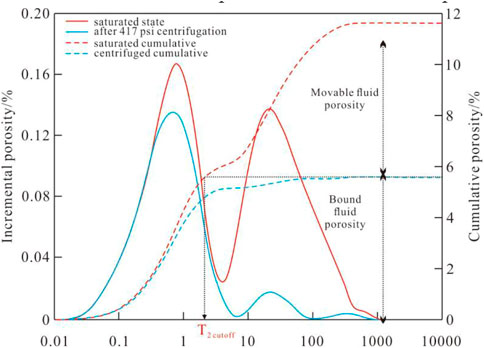
FIGURE 3. Illustration of the method to calculate the T2 cutoff value, based on sample QL16-11.
AutoPore Ⅳ 9500mercury porosimeter is used in HPMI experiment, and the maximum mercury injection pressure is 200 MPa. The capillary pressure curve of samples obtained in the experiment can be converted into pore size by Washburn equation (Washburn, 1921), which is as follows:
Where:
According to NMR theory, the total relaxation time is the superposition of volume relaxation (
Where:
For pores saturated by single-phase fluid in uniform magnetic field, the echo time is short enough, and the volume relaxation and diffusion relaxation are negligible, so Eq. 4 can be simplified as:
For simplified spherical and cylindrical pores, the relationship between specific surface area and pore radius can be expressed as:
Where:
Combining Eq.5–6, the following formula can be obtained:
The relationship between pore radius and relaxation time T2 in the above formula is linear. However, previous research results show that there is a power function between relaxation time T2 and pore radius and could be expressed as below:
Where: n is the power index, dimensionless. Transform Eq. 8 as follows:
It can be obtained by defining
According to Eq. 10, the relaxation time T2 can be converted into pore radius r by determining the values of C and n. According to HPMI theory, mercury is a non-wetting phase for rocks. Driven by external pressure, mercury preferentially enters macropores and gradually enters smaller pores with the increase of pressure. Therefore, the increase of mercury saturation in capillary pressure curve is the accumulation from large pores to small pores. According to Eq. 8, the relaxation time T2 is positively correlated with the pore radius, so the value obtained by accumulating the NMR signal frequency in the order of relaxation time T2 from small to large still represents the accumulation from large pores to small pores. The cumulative curves obtained by the two methods have corresponding relaxation time
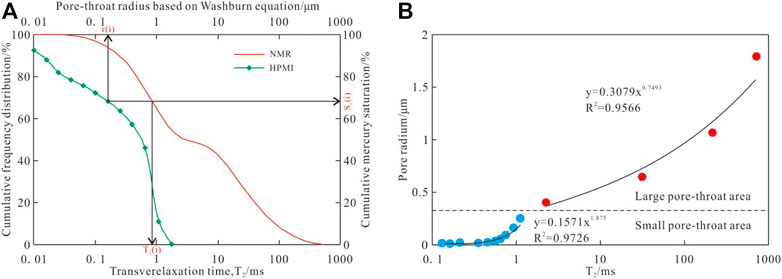
FIGURE 4. Conversion from NMR T2 of Sample QL16-11 to pore–throat radius. (A) The corresponding relationship between T2 and pore radius at a certain cumulative saturation. (B) The conversion relationship between the relaxation time and pore radius of different types of pores.
The pore space of tight sandstone has been proved to have self-similarity, according to fractal theory, this self-similarity can be described as the relationship between the number of pores and the radius of pores:
Where:
According to Eq. 11, through the regression analysis of pore number and pore radius in double logarithmic coordinates, the fractal dimension can be described as:
Where: K is the slope of lg
Many models for calculating pore fractal dimension based on capillary pressure curve have been proposed, including geometry model, thermodynamic model, 2D capillary tube model, 3D sphere model, 3D capillary tube model and wetting phase model, etc., (Wang et al., 2018a; Wang et al., 2018b; Wang et al., 2021b). In previous studies, the 3D capillary tube model and wetting phase model are the most commonly used. The 3D capillary model can be described by the relationship between the number of equivalent pores and the mercury saturated radius, or by the relationship between the mercury saturation and the mercury injection pressure. The comprehensive fractal dimensions obtained by these two expressions are consistent, but due to the differences in the data sets used, the results calculated based on mercury saturation and mercury injection pressure often have obvious multiple fractal intervals corresponding to different types of pores, while the results calculated based on the number of equivalent pores and mercury saturated radius generally do not have multi-segment fractal characteristics. In essence, the wetting phase model is to replace the wetting phase saturation with the non-mercury injection saturation, and calculates the fractal dimension through the relationship between the wetting phase saturation and capillary pressure. Many scholars have calculated the pore fractal dimension of tight sandstone based on the wetting phase model, and analyzed the relationship between fractal dimension and physical properties, pore structure parameters (Qu et al., 2020; Wu et al., 2022a; Wu et al., 2022b; Cui et al., 2022). At the same time, some scholars have also proposed that the model is only applicable to the process of wetting phase fluid injection into porous media, and it is not appropriate to replace the wetting phase saturation with non-mercury injection saturation. The wetting phase model essentially calculates the fractal dimension of the remaining pore throat without mercury injection, and is not applicable to characterizing the pore throat fractal characteristics (Washburn, 1921; Zhang et al., 2017; Liu et al., 2018; Song et al., 2018).
Based on the analysis of the advantages and disadvantages of the 3D capillary model and the wetting phase model, this paper selects the 3D capillary model described by the mercury injection saturation and pressure to calculate the fractal dimension to determine the heterogeneity of the pore structure. The basic assumption of the 3D capillary tube model is that the pores in the rock are composed of capillaries with different radius r and length l, and the pore volume V can be expressed as:
Since mercury preferentially enters large pores in rocks, the pore volume with radius greater than r is replaced by the cumulative mercury volume, and the number of pore throats with radius greater than r can be expressed as:
The number of pores
Where:
Substitute the pore radius expressed by Washburn equation into Eq. 17:
The cumulative volume of mercury can be expressed by the following formula:
Where
Take the logarithm of both sides of Eq. 20:
Where b is the newly obtained constant. Linear regression is performed on
Deionized water is used as detection fluid in NMR experiment, which is usually a wetting phase fluid for rocks and enters into small pores preferentially, so the pore fractal dimension can be calculated using the wetting phase model. The pore in the wetting phase model is assumed to be spherical (Huang et al., 2017), and the accumulated pore volume of the wetting phase fluid can be expressed as:
Where,
Where:
Similarly, the total pore volume can be expressed as:
Where
Where
By substituting Eq. 6 into Eq. 26, the following formula can be obtained:
Where,
Linear fitting of
The porosity and permeability of each sample are shown in Table 1. The result shows that typical tight sandstone is developed in J2S2 member of central Sichuan Basin, the porosity of sample ranges 3.48%∼14.12%, with an average of 9.7%, and the permeability ranges 0.016 mD∼0.778 mD, with an average of 0.189 mD. In semi-logarithmic coordinates, porosity and permeability have relatively high positive correlation (Figure 5), and the coefficient of determination is 0.8021. With permeability as the main basis and porosity as the secondary reference, the reservoirs in J2S2 section of the study area can be divided into three types. The permeability of Class I reservoir is more than 0.3 mD, and the porosity is mainly more than 12%. The permeability of Class II reservoir is 0.08∼0.3 mD, and the porosity is mainly 8%∼12%. The permeability of Class III reservoir is less than 0.08 mD, and the porosity is mainly below 8%.
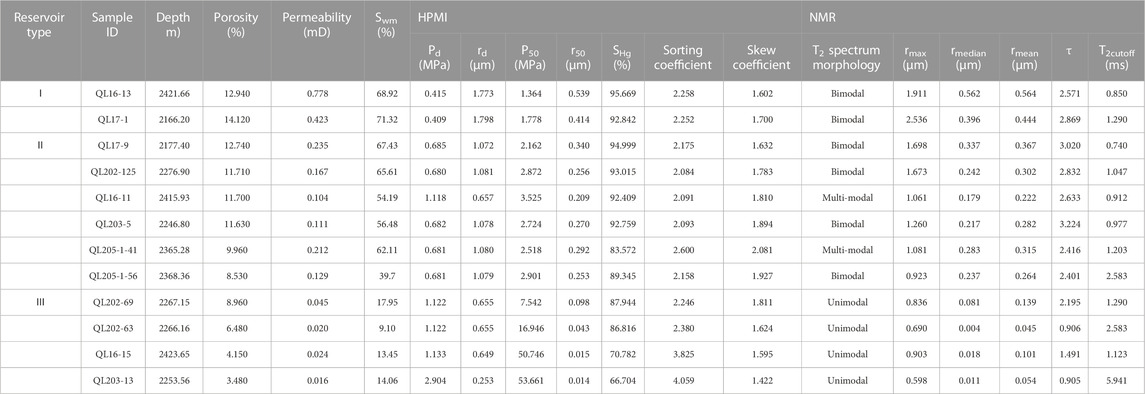
TABLE 1. Characteristic of physical property and pore structure parameters measured by HPMI and NMR.
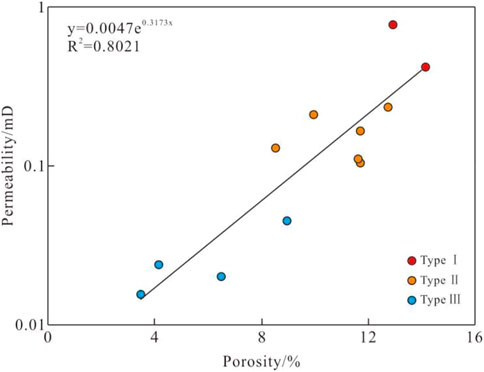
FIGURE 5. Relationship between porosity and permeability.
In addition, the T2cutoff and movable fluid saturation of each sample were obtained through the centrifugal experiment. The result showes that the T2cutoff of the sample had an increasing trend with the deterioration of physical properties, on the contrary, the movable fluid saturation had a decreasing trend with the deterioration of physical properties. T2cutoff of type I reservoir ranges 0.850 ms∼1.290 ms, with an average of 1.070 ms, and the movable fluid saturation ranges 68.92%∼71.32%, with an average of 70.12%. T2cutoff of type Ⅱ reservoir ranges 0.740 ms∼2.583 ms, with an average of 1.244 ms, and the movable fluid saturation ranges 39.70%∼67.43%, with an average of 57.59%. T2cutoff of type Ⅲ reservoir ranges 1.123 ms∼5.941 ms, with an average of 2.734 ms, and the movable fluid saturation ranges 9.10%∼17.95%, with an average of 13.46%.
The pore structure parameters, capillary pressure curve and pore size distribution curve obtained from HPMI experiment are shown in Table 1 and Figure 6. With the deterioration of reservoir physical properties, the platform section of capillary pressure curve gradually disappears (Figure 6A,C,E), the displacement pressure (Pd) and median pressure (P50) gradually increase, and the maximum pore radius (rd) and median pore radius (r50-h) decrease accordingly. At the same time, the maximum mercury saturation (Sh) shows a decreasing trend, indicating that the total volume of pores decreases correspondingly, and the degree of connectivity decreases gradually. The displacement pressure of type Ⅰ reservoir ranges 0.409 MPa∼0.415MPa, with an average of 0.412 MPa, and the median pressure ranges 1.364 MPa∼1.778 MPa, with an average of 1.571 MPa. The corresponding maximum pore radius ranges 1.773 μm∼1.798 μm, with an average of 1.785μm, the median pore radius ranges 0.414 μm∼0.539 μm, with an average of 0.476 μm, the main pore radius is distributed at 0.5 μm∼1.7 μm (Figure 6B), and the maximum mercury saturation is between 92.842% and 95.669%, with an average of 94.256%, indicating that the pore volume is large and the connectivity is good. The displacement pressure of type Ⅱ reservoir ranges 0.680 MPa∼1.118MPa, with an average of 0.755 MPa, and the median pressure ranges 2.162 MPa∼3.525MPa, with an average of 2.784 MPa. The corresponding maximum pore radius ranges 0.657 μm∼1.081 μm, with an average of 1.008 μm, the median pore radius ranges 0.209 μm∼0.340 μm, with an average of 0.270 μm, the main pore radius is distributed at 0.2 μm∼1.8 μm (Figure 6D), and the maximum mercury saturation is between 83.572% and 94.999%, with an average of 91.017%, indicating that the pore volume is reduced and the connectivity is deteriorated compared with Type Ⅰ reservoir. The displacement pressure of type Ⅲ reservoir ranges 1.122 MPa∼2.904 MPa, with an average of 1.570 MPa, and the median pressure ranges 7.542 MPa∼53.661MPa, with an average of 32.224 MPa. The corresponding maximum pore radius ranges 0.253 μm∼0.655 μm, with an average of 0.553 μm, the median pore radius ranges 0.014 μm∼0.098 μm, with an average of 0.042 μm, the main pore radius is distributed at 0.05 μm∼0.4 μm (Figure 6F), and the maximum mercury saturation is between 66.704% and 87.944%, with an average of 78.062%, indicating that the pore volume is small and the connectivity is poor.
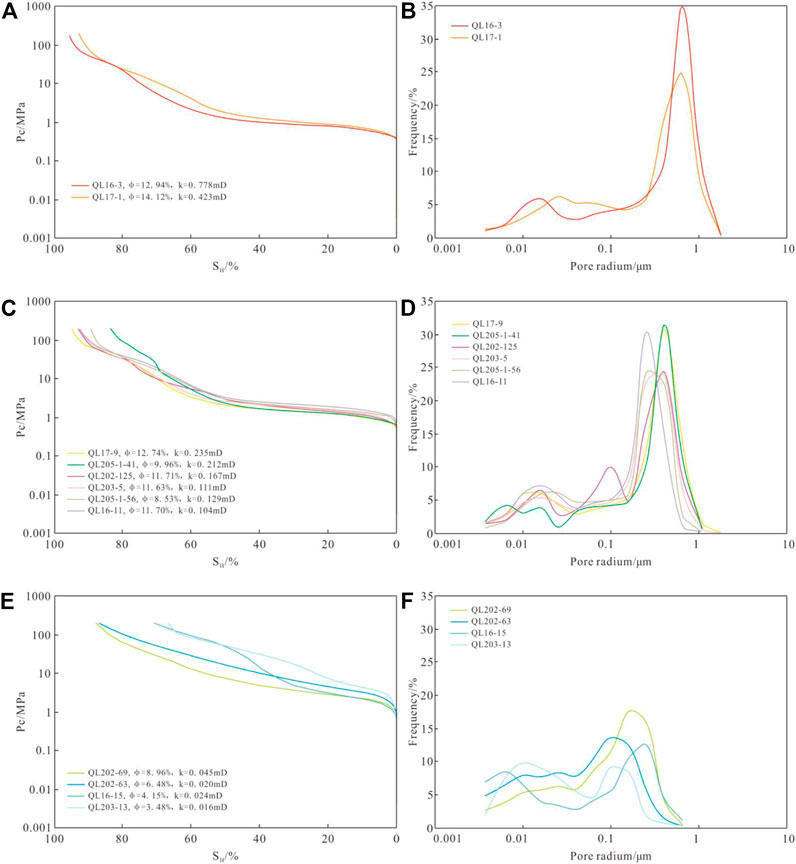
FIGURE 6. Capillary pressure curve and pore size distribution calculated by HPMI: (A) and (B). Type Ⅰ; (C) and (D). Type Ⅱ; (E) and (F). Type Ⅲ.
Sorting coefficient and skewness coefficient are important parameters to describe the characteristics of pore size distribution, and their values have no obvious linear relationship with physical properties. The sorting coefficient reflects the concentration degree of pore distribution. The smaller the sorting coefficient, the higher the concentration degree of pore size within a certain size range. The sorting coefficient ranges 2.252∼2.258 in type I reservoir, with an average of 2.255, and ranges 2.084∼2.600 in type II reservoir, with an average of 2.200, and ranges 2.246∼4.059 in type III reservoir, with an average of 3.128. The range of sorting coefficient of type II reservoir is significantly larger than that of type I reservoir, but the average value of the two types of reservoirs is close, mainly because the sorting coefficient of type II reservoir sample QL205-1-41 is significantly higher than that of other similar samples, and the sorting coefficient of the remaining type II reservoir samples is below 2.2. In general, the pore size distribution of type II reservoir is more concentrated than that of type I reservoir. The range and average value of sorting coefficient of type III reservoir are significantly larger than those of type I and II reservoirs, indicating that the pore size distribution of type III reservoir is more dispersed. The skewness coefficient reflects the asymmetry of the PSD curve. When the skewness coefficient is greater than 0, it’s coarse skewness, indicating that the PSD is more inclined to large pores compared to the average pore size, and when it is less than 0, it’s fine skewness, indicating that the PSD is more inclined to small pores compared to the average pore size. The PSD of all kinds of reservoirs in J2S2 member shows coarse skewness, the skewness coefficient ranges 1.602∼1.700 in type I reservoir, with an average of 1.651, and ranges 1.632∼2.081 in type II reservoir, with an average of 1.854, and ranges 1.422∼1.811 in type III reservoir, with an average of 1.613.
Pore-throat structure parameters obtained by NMR.
The pore structure parameters, T2 spectrum obtained from NMR experiments and the full-size pore distribution curve obtained from fitting the capillary pressure curve are shown in Table 1 and Figure 7. The relaxation time of T2 spectrum of water-saturated samples is between 0.01 and 1000 ms, and the T2 spectrum of Type I and Type II reservoirs are mostly bimodal, with 8 ms as the dividing point of left and right peaks. Although the T2 spectrum of Sample QL205-1-41 and Sample QL16-11 are multi-modal with three obvious peaks. The T2 spectrum of type III reservoir is unimodal distribution, characterized by absolute predominance of left peak(Figure 7A,C,E). In general, with the physical properties of the sample getting worse, the peak value of T2 spectrum has a tendency to decrease, and the right peak with relaxation time larger than 8 ms decreases rapidly, making T2 spectrum transition from bimodal or multi-modal to unimodal.
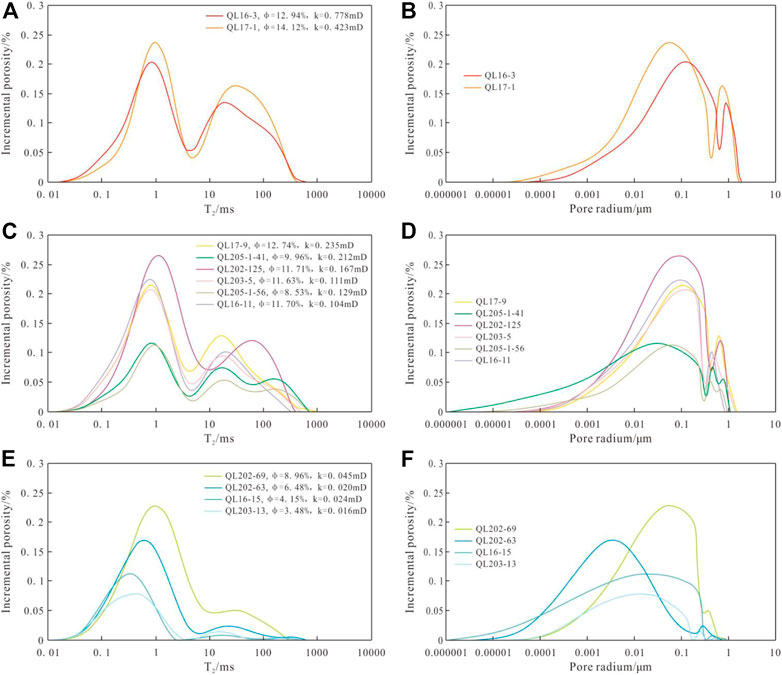
FIGURE 7. T2 spectrum and full-size distribution of pores: (A) and (B). Type Ⅰ; (C) and (D). Type Ⅱ; (E) and (F). Type Ⅲ.
The range of PSD obtained by NMR and HPMI fitting method is significantly wider than that calculated by Washburn equation, and the characterized pore size is more extensive, so the relatively real maximum pore radius (rmax), median pore radius (rmedian) and average pore radius (rmean) can be obtained. Pore radius of type I reservoir mainly ranges 0.01 μm∼2 μm (Figure 7B), The maximum pore radius ranges 1.911 μm∼2.536 μm With an average of 2.224 μm, The median pore radius ranges 0.396 μm∼0.562 μm, with an average of 0.479 μm, the weighted mean pore radius ranges 0.444 μm∼0.564 μm, with an average of 0.504 μm. Pore radius of type Ⅱ reservoir mainly ranges 0.003 μm∼1 μm(Figure 7D), The maximum pore radius ranges 0.923 μm∼1.698 μm, with an average of 1.283μm, The median pore radius ranges 0.179 μm∼0.337μm, with an average of 0.249 μm, the weighted mean pore radius ranges 0.222 μm∼0.367 μm, with an average of 0.292 μm. Pore radius of type Ⅲ reservoir mainly ranges 0.001 μm∼0.4 μm (Figure 7F), only the main pore radius distribution of sample QL202-63 is significantly different from other similar samples with a range from 0.05 nm to 0.08 μm.The maximum pore radius of type III reservoir ranges 0.598 μm∼0.903 μm, with an average of 0.757 μm, the median pore radius ranges 0.081 μm∼0.114 μm, with an average of 0.029 μm, the weighted mean pore radius ranges 0.045 μm∼0.139 μm, with an average of 0.085 μm.
The tortuosity is a description of the connectivity and complexity of the pores, and is one of the important pore topology parameters, which can be calculated by the following formula
Where,
According to previous studies, when calculating the pore fractal dimension of tight sandstone by 3D capillary tube model described by mercury saturation and mercury injection pressure, there are generally two fractal intervals. Liu et al. (2018) proposed that when calculating fractal dimension based on this model, Capillary-Paraachor point (CPpoint) can be used as the segmentation point of different fractal intervals to better describe the fractal characteristics of pores in tight sandstone. According to the definition by Guo et al. (2004), the position of the maximum value of the plot of Sh/Pc2 versus Sh is the CPpoint, which represents the node of transition from a well connected pores to poorly connected pores. According to the above theory, the CPpoints of capillary pressure curves of each sample are calculated respectively, and lg (Pc) and lg (Sh) are linearly fitted, and the fractal dimension corresponding to each fractal interval is calculated through 3D capillary tube model. The CPpoints of Sample QL17-1, Sample QL17-9 and Sample QL17-12 and the corresponding segmentation points in the plot of lg (Pc) versus lg (Sh) are shown in Figure 8. The results show that the position of the segmentation point of the capillary pressure curve of different samples is different. The fractal dimension of the large pores (Dh1) can be calculated according to the slope of the left line segment of CPpoint, and the fractal dimension of the small pores (Dh2) can be calculated according to the slope of the right line segment.
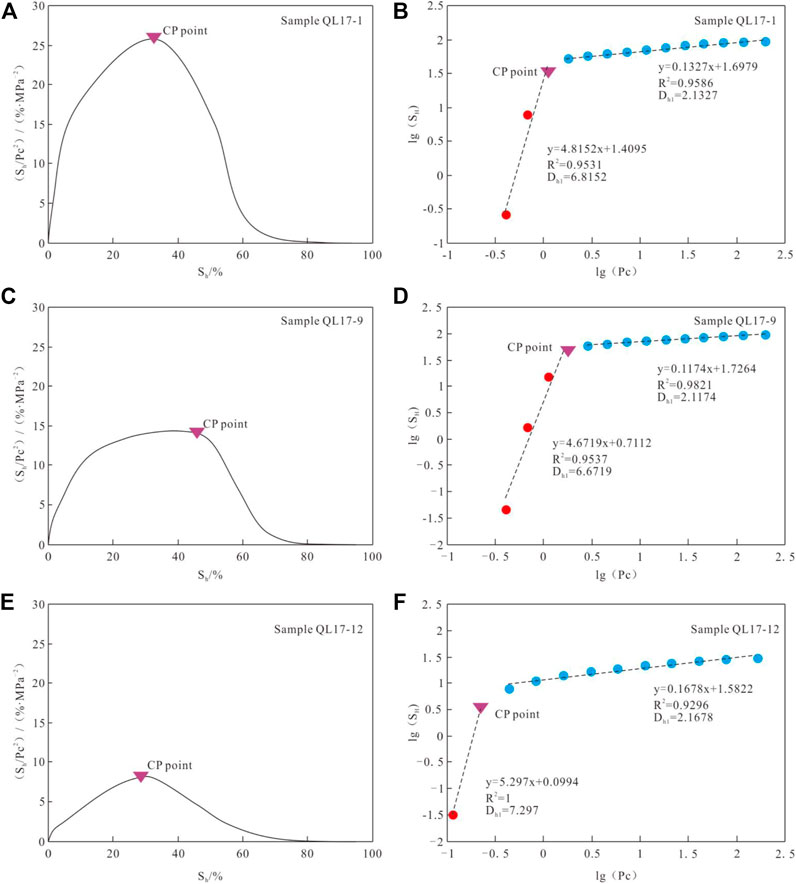
FIGURE 8. (A) The CP point of Sample QL17-1. (B) Cross-plot of Lg(Pc) vs. Lg(SH) based on Sample QL17-1. (C) The CP point of Sample QL17-9. (D) Cross-plot of Lg(Pc) vs. Lg(SH) based on Sample QL17-9. (E) The CP point of Sample QL17-12. (F) Cross-plot of Lg(Pc) vs. Lg(SH) based on Sample QL17-12. The red and blue circles represent the large pores and small pores, respectively.
The fractal dimension calculation results of each sample based on HPMI data and the corresponding pore radius of fractal interval segmentation points (SPh) are shown in Table 2, where Dh1 ranges 4.3505∼7.1684, with an average of 6.055 and the determination coefficient ranges 0.9477∼0.9982. Dh2 ranges from 2.1004 to 2.3841, with an average of 2.1758 and the coefficient of determination ranges 0.9094∼0.9902. According to the fractal theory, the fractal dimension of a three-dimensional object is 2∼3, when the fractal dimension is greater than 3 or less than 2 indicates that the object has no fractal characteristics. In the calculation results of this study, small pores have ideal fractal characteristics, while the fractal dimension of large pores is greater than 3; Lai and Wang (2015); Song et al. (2018) also used 3D capillary model to calculate the fractal dimension of pores in tight sandstone, and the fractal dimension of large pores obtained is also greater than 3. In fact, at present, most scholars believe that this phenomenon is not caused by the pore itself, but the assumption that the pore is regarded as a cylindrical capillary in the model is too simplified. When the mercury injection pressure is high, the pore size is small and close to the throat radius, so the ideal fractal dimension can be obtained through the 3D capillary tube model. When the mercury injection pressure is low, the pore radius is significantly larger than the throat radius, and the shape of the pore throat is similar to bead-string model (Zhu et al., 2019), Therefore, 3D capillary model is not suitable for calculating the fractal dimension of large pores in rocks.
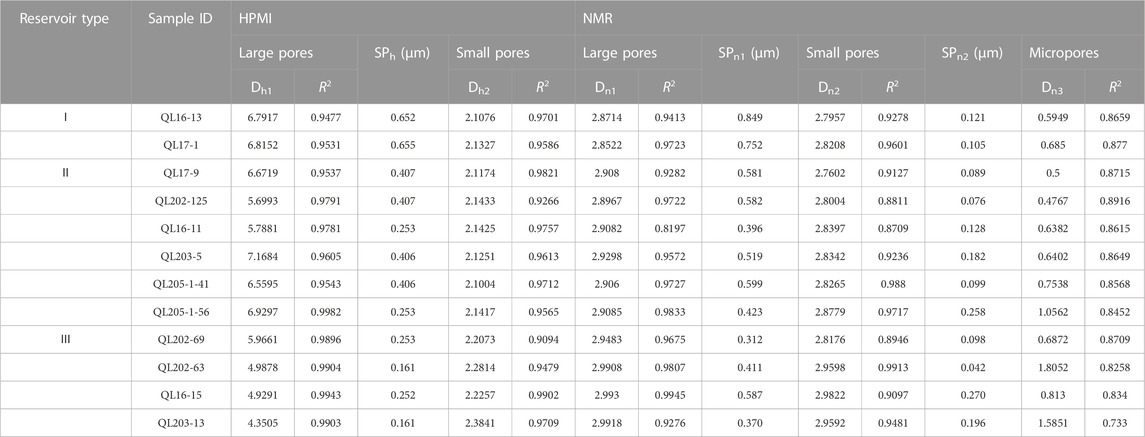
TABLE 2. Fractal dimensions of samples based on HPMI and NMR data.
When calculating fractal dimension based on NMR data, it is also necessary to consider the difference of fractal dimension in different intervals, that is, the difference of fractal characteristics of pores with different sizes. Guo et al. (2019) and Wu et al. (2022a) divide the reservoir pores into two types, namely, large pore and small pore, with T2cutoff as the segmentation point. Wang and Wang. (2022) divided the pores into three types, namely, macropores, mesopores and micropores, with T2cutoff and 9T2cutoff as the segmentation point. By comparing the T2 spectra of samples before and after centrifugation, Wang and Zeng. (2020) divided the pores into three types according to the content of movable fluid: fully movable macropores, partially movable mesopores and completely immovable micropores. Some researchers did not consider the mobility of the fluid when calculating the fractal dimension of pores with different sizes, but based on the full-size pore size distribution, taking the actual pore size as the dividing standard. Wu et al. (2022b) put 5 μm、1 μm, 0.1 μm as the segmentation point, the pores are divided into four types from large to small, namely, macropores, mesopores, micropores and ultra-micro pores. Zang et al. (2022a) takes 1 μm, 0.1 μm as the segmentation point, then the pores are divided into three types from large to small, namely, micron pores, submicron pores and nanopores. In fact, taking the pore size as the segmentation standard has only mathematical significance, and cannot accurately reflect the difference of pore seepage capacity. In addition, due to the existence of experimental error, the left peak of the T2 spectrum of the same sample before and after centrifugation may cross each other, which will affect the pore classification results. Therefore, considering the mobility of fluid and the connectivity of pores, this paper proposes a new method of pore type classification based on the full size pore size distribution.
Firstly, pores with relaxation time less than T2cutoff are divided into micropores. Then, based on the full-size pore distribution, the pore radius is converted into the non-wetting phase fluid injection pressure (Pn) through the Washburn equation, and the cumulative frequency (Sc) is taken as the non-wetting phase fluid saturation according to the order of pore size from large to small, then the position of the maximum value in the plot of Sc/Pn2-Sc is the CP point, representing the segmentation point between the pores with good connectivity and poor connectivity. The relaxation time corresponding to this point is expressed as T2CP, the pores with relaxation time greater than TCP are defined as large pores, and the pores with relaxation time between T2cutoff and T2CP are defined as small pores.
The process of obtaining fractal dimensions of different types of pores based on NMR data of sample QL16-13 is shown in Figure 9. First, determine the T2cutoff and T2CP values of each sample, and divide the pores into large pores, small pores and micropores, corresponding to three fractal intervals respectively. According to the order of relaxation time from small to large, the cumulative frequency value is taken as the wetting phase fluid saturation (Sw), and linear regression analysis is performed on the
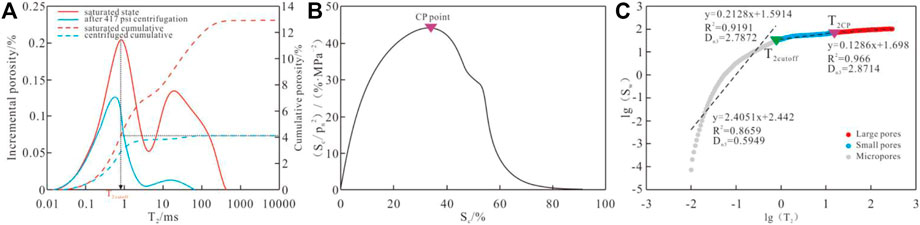
FIGURE 9. (A) The T2cutoff of Sample QL16-13. (B) The CP point of Sample QL16-13. (C) The plot of lg(T2) vs. lg(Sw) based on NMR of Sample QL16-13. The grey, blue and red circles represent the large pores (T2 greater than T2CP), small pores (T2 between T2cutoff and T2CP) and micropores (T2 less than T2cutoff), respectively.
According to the fractal theory, the fractal dimension Dh1 of large pores based on HPMI and Dn3 of micropores based on NMR cannot truly reflect the fractal dimension of pores. Therefore, this study will take the fractal dimension Dh2 of small pores based on HPMI, Dn1 and Dn2 of large pores and small pores based on NMR as the main discussion objects.
The correlation between fractal dimensions Dh2, Dn1 and Dn2 and physical properties is shown in Figure 10. The porosity, permeability, mobile fluid saturationand and fractal dimension of the reservoir are negatively correlated, indicating that with the increase of heterogeneity of same kind of pores, the reservoir quality gradually becomes worse and the fluid mobility gradually weakens. The relationship between reservoir porosity and Dh2 is a power function (Figure 10A), while the relationship with Dn1 and Dn2 is linear (Figure 10B,C). The correlation between Dn1 and Dn2 and porosity is strong, and their determination coefficients are 0.8337 and 0.8166, respectively, indicating that the reservoir capacity is jointly controlled by large pores and small pores. The relationship between permeability and fractal dimension is power function (Figure 10D,E,F) and the correlation between Dn2 and permeability is the strongest, with a determination coefficient of 0.9211. The correlation between Dh1 and Dn2 and permeability is weak, and their determination coefficients are 0.7569 and 0.6834 respectively, indicating that large pores are the most important seepage channels of the reservoir and play a decisive role in the seepage capacity of the reservoir. The saturation of movable fluid has a power function relationship with Dh2, and a linear relationship with Dn1 and Dn2 (Figure 10G,H,I). Among them, the correlation between movable fluid saturation and Dn1 is the highest, with the determination coefficient of 0.8460, and the correlation with Dh1 and Dn2 is weak, with the determination coefficient of 0.7573 and 0.7035 respectively, indicating that the large pore throat is the main occurrence space of movable fluid in the reservoir.
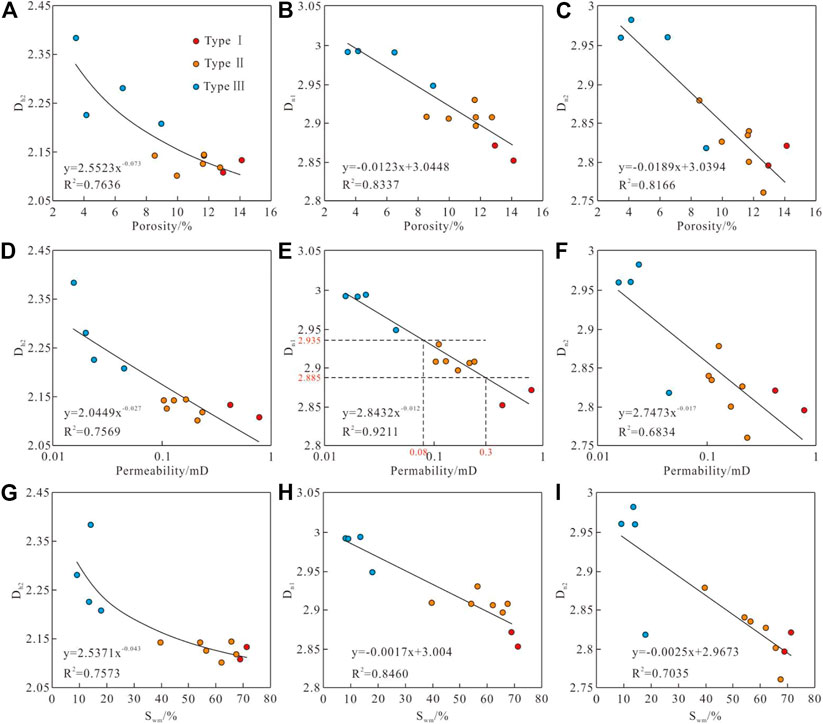
FIGURE 10. The relationship between fractal dimension, porosity, permeability and movable fluid saturation. The relationship between porosity and Dh2, Dn1, Dn2 are shown in (A–C), respectively. The relationship between permeability and Dh2, Dn1, Dn2 are shown in (D–F), respectively. The relationship between movable fluid saturation and Dh2, Dn1, Dn2 are shown in (G–I), respectively.
At the same time, the fractal dimension Dn1 has a good correspondence with different types of reservoirs (Figure 10E). According to the regression equation between reservoir permeability and Dn1, the fractal dimension of large poreof type I reservoir is less than 2.880, the fractal dimension of large pore of type II reservoir is between 2.88 and 2.935, and the fractal dimension of large pore of type III reservoir is more than 2.935. Therefore, Dn1 can be used as one of the parameters for reservoir quality evaluation.
The maximum radius, median radius and weighted mean radius of pores can be obtained from the full-size pore distribution curve. The correlation between the above three parameters and Dh2, Dn1 and Dn2 is shown in Figure 11. The relationship between pore size and fractal dimension is power function and has negative correlation, indicating that the heterogeneity gradually increases with the decrease of pore size of the same kind. The maximum radius, median radius and weighted mean radius have the strongest correlation with Dn1(Figure 11B,E,H), with the determination coefficients of 0.7679, 0.8488 and 0.8705 respectively, followed by the correlation with Dh1(Figure 11A,D,G), with the determination coefficients of 0.5656, 0.8090 and 0.8503 respectively, and the correlation with Dn2 is the worst (Figure 11C,F,I), with the determination coefficients not exceeding 0.8. The above analysis shows that the pore size distribution of the reservoir is mainly controlled by the size of large pores, and the median radius and weighted mean radius have the greatest impact on the reservoir quality. In addition, Dn1 has a good correspondence with the weighted mean pore radius of different types of reservoirs. According to the regression equation between the weighted average pore radius and Dn1, the weighted mean radius of type I reservoirs is greater than 0.42 μm, the weighted mean radius of type II reservoir is between 0.16 μm and 0.42 μm, the weighted mean radius of type III reservoir is less than 0.16 μm (Figure 11H).
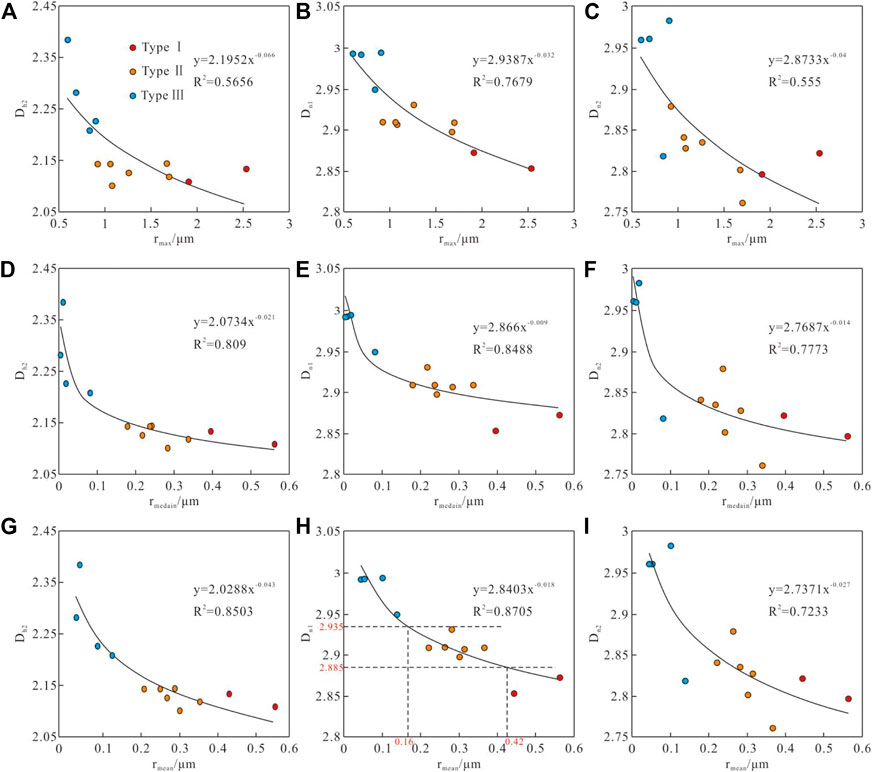
FIGURE 11. The relationship between fractal dimension and pore size. The relationship between maximum pore radius and Dh2, Dn1, Dn2 are shown in (A–C), respectively. The relationship between median pore radius and Dh2, Dn1, Dn2 are shown in (D–F), respectively. The relationship between weighted mean pore radius and Dh2, Dn1, Dn2 are shown in (G–I), respectively.
The correlation of sorting coefficient, skewness coefficient, tortuosity and movable fluid saturation with Dh1, Dn1 and Dn2 is shown in Figure 12. The correlation between sorting coefficient and skewness and fractal dimension is weak, and the determination coefficient between each parameter is only 0.1526∼0.5593 (Figure 12A,F), indicating that PSD is not the main factor affecting pore heterogeneity and reservoir quality. Both tortuosity and movable fluid saturation are negatively correlated with fractal dimension, indicating that reservoir heterogeneity increases with the decrease of pore tortuosity and fluid mobility. The correlation between tortuosity and fractal dimension is relatively high, with a power function relationship with Dh1 and Dn2, and a linear relationship with Dn1 (Figure 12C,F,I). Among them, the porosity tortuosity has the strongest correlation with Dh1, with a determination coefficient of 0.8503, followed by Dn2, with a determination coefficient of 0.7512, and the worst correlation with Dn1, with a determination coefficient of only 0.6712. This phenomenon is due to the positive correlation between tortuosity and pore-throat coordination number, while the throat size is small, This phenomenon is due to the positive correlation between tortuosity and pore throat coordination number, while the throat size is small, so the fractal dimension of large pores can not accurately reflect the configuration of pore and throat, resulting in poor correlation between macropores and tortuosity.
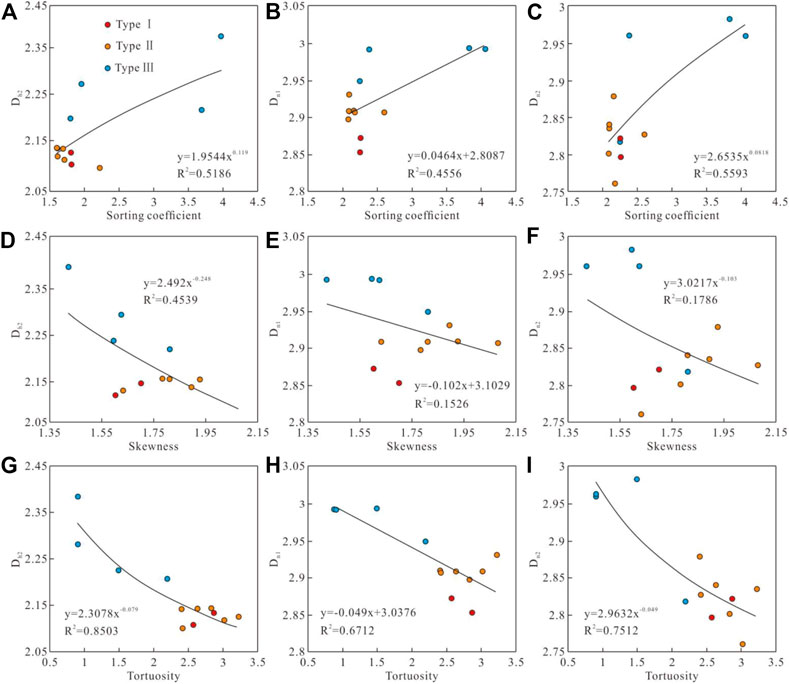
FIGURE 12. The relationship between fractal dimension, sorting coefficient, skewness and tortuosity. The relationship between sorting coefficient and Dh2, Dn1, Dn2 are shown in (A–C), respectively. The relationship between skewness and Dh2, Dn1, Dn2 are shown in (D–F), respectively. The relationship between tortuosity and Dh2, Dn1, Dn2 are shown in (G–I), respectively.
Based on the above analysis, there is a good correlation between the permeability, mean pore radius, and Dn1 of the reservoir, and the differentiation between different types of reservoirs is good. Therefore, comprehensive reservoir evaluation indicators can be established based on the above parameters. Among them, the permeability represents the macroscopic seepage ability of the reservoir, the mean pore radius represents the size of the reservoir space, and Dn1 mainly characterizes the heterogeneity of the pore system.
As shown in Table 3, the permeability of Type I reservoir is less than 0.3 mD, and the mean pore radius is greater than 0.42 μm, the fractal dimension of large pores is less than 2.88; The permeability of type II reservoir ranges from 0.08 mD to 0.3 mD, and the mean pore radius ranges from 0.16 μm to 0.42 μm, the fractal dimension of large pores ranges from 2.88 to 2.935; The permeability of type III reservoir is less than 0.3 mD, and the mean pore radius is less than 0.16 μm, the fractal dimension of large pores is greater than 2.935.
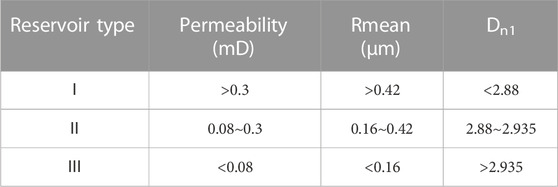
TABLE 3. Comprehensive evaluation indicators for meandering stream facies reservoirs in study area.
This paper studies the pore structure and fractal characteristics of J2S2 tight sandstone in central Sichuan Basin, and the conclusions are as follows.
1)The tight sandstone reservoir of meandering stream facies is developed in J2S2 member of central Sichuan Basin, with an average porosity of 9.7% and an average permeability of 0.189 mD. Based on the difference of physical properties, the J2S2 reservoir in this area can be divided into three types. The permeability of type I reservoir is more than 0.3 mD, and the porosity is mainly more than 12%; The permeability of type II reservoir is 0.08∼0.3 mD, and the porosity is mainly 8%∼12%; The permeability of Class III reservoir is less than 0.08 mD, and the porosity is mainly less than 8%.
2)Based on the HPMI and NMR fitting methods and centrifugal experiments, the full-size pore distribution curve of the sample and the saturation of movable fluid can be obtained, so as to obtain relatively accurate pore geometry, topology parameters and seepage capacity parameters. Pore radius of type I reservoir is mainly distributed at 0.01 μm∼2 μm. The tortuosity is between 2.571 and 2.869, the average movable fluid saturation is 70.12%, and the pore radius of type II reservoir is mainly 0.003 μm∼1 μm. The tortuosity is between 2.401 and 3.224, the average movable fluid saturation is 57.59%, and the pore radius of type III reservoir is mainly 0.001 μm∼0.4 μm. The tortuosity is between 0.905 and 2.195, and the average movable fluid saturation is 13.46%.
3)Taking Capillary-Paraachor point (CP point) as the segmentation point of capillary pressure curve, pores can be divided into two types: large pores and small pores. Taking the relaxation time T2CP corresponding to CP point and T2cutoff as the segmentation points of T2 spectrum, pores can be divided into three types: large pores, small pores and micropores. The fractal dimension Dh2 of small pore based on HPMI and the fractal dimension Dn1 and Dn2 of large pores and small pores based on NMR are between 2 and 3, which can effectively characterize the heterogeneity of reservoir pores. The fractal dimension Dh1 of large opores based on HPMI is greater than 3 due to the inapplicability of 3D capillary tube model, while the fractal dimension Dn3 of small pores based on NMR is less than 2 due to the diffusion relaxation. Therefore, Dh1 and Dn3 cannot characterize the heterogeneity of reservoir pores.
4)Dh2 ranges 2.1004∼2.3841, with an average of 2.1758; Dn1 ranges 2.8522∼2.993, with an average of 2.9254; Dn2 ranges 2.7602∼2.9822, with an average of 2.8562. Among them, Dn1 has a strong negative correlation with porosity, permeability, pore radius, and movable fluid saturation, indicating that the reservoir’s Storage capacity, seepage capacity and pore size are mainly controlled by the large pores, and with the reservoir quality becoming worse, the pore size decreases, and the pore heterogeneity increases.
5)There is a good correspondence between Dn1 and the permeability and average pore radius of different types of reservoirs, so Dn1 can be used as one of the effective reservoir evaluation parameters. Meanwhile, effective comprehensive evaluation indicators for reservoirs can be established based on the above parameters
The datasets presented in this study can be found in online repositories. The names of the repository/repositories and accession number(s) can be found in the article/supplementary material.
LF contributed as the major author of the article. LF and YJ conceived the project. GG, CY, XZ, and QZ collected the samples. GC and ZW analyzed the samples. All authors contributed to the article and approved the submitted version.
The study was funded by the scientific research project of Southwest Oil and Gas Field Company (Grant No. XNS20220-42) and the 973 Prophase Special Program of China (Grant No. 2011CB211701) is acknowledged.
The funder was not involved in the study design, collection, analysis, interpretation of data, the writing of this article or the decision to submit it for publication.
The authors LF, YJ, GC and ZW were employed by PetroChina Key Laboratory of Unconventional Oil and Gas.
The authors GG, CY and XZ were employed by PetroChina Southwest Oil and Gas Field Company. The author QZ was employed by Tight Oil and Gas Exploration and Development Project Department of PetroChina Southwest Oil and Gas Field Company.
All claims expressed in this article are solely those of the authors and do not necessarily represent those of their affiliated organizations, or those of the publisher, the editors and the reviewers. Any product that may be evaluated in this article, or claim that may be made by its manufacturer, is not guaranteed or endorsed by the publisher.
Amadu, M., and Pegg, M. J. (2018). Theoretical and experimental determination of the fractal dimension and pore size distribution index of a porous sample using spontaneous imbibition dynamics theory. J. Petrol. Sci. Eng. 167, 785–795. doi:10.1016/j.petrol.2018.04.037
Awan, R. S., Liu, C., Aadil, N., Yasin, Q., Salaam, A., Hussain, A., et al. (2021). Organic geochemical evaluation of Cretaceous Talhar shale for shale oil and gas potential from lower Indus basin, Pakistan. J. Petrol. Sci. Eng. 200, 108404. doi:10.1016/j.petrol.2021.108404
Clarkson, C. R., Freeman, M., He, L., Agamalian, M., Melnichenko, Y. B., Mastalerz, M., et al. (2012). Characterization of tight gas reservoir pore structure using USANS/SANS and gas adsorption analysis. Fuel 95, 371–385. doi:10.1016/j.fuel.2011.12.010
Cui, H., Zhu, S., Wang, J., Gao, Y., Wan, C., and Tong, H. (2022). Physical properties, pore-throat structure, fractal characteristics and their effects on the gas-bearing capacity of tight sandstone: A case study from the northern tianhuan depression, Ordos Basin, China. Nat. Resour. Res. 31, 1559–1584. doi:10.1007/s11053-022-10059-2
Dai, C., Cheng, R., Sun, X., Liu, Y., Zhou, H., Wu, Y., et al. (2019). Oil migration in nanometer to micrometer sized pores of tight oil sandstone during dynamic surfactant imbibition with online NMR. Fuel 245, 544–553. doi:10.1016/j.fuel.2019.01.021
Dong, X., Meng, X., and Pu, R. (2023). Impacts of mineralogy and pore throat structure on the movable fluid of tight sandstone gas reservoirs in coal measure strata: A case study of the shanxi formation along the southeastern margin of the Ordos Basin. J. Petrol. Sci. Eng. 220, 111257. doi:10.1016/j.petrol.2022.111257
Ge, X., Fan, Y., Zhu, X., Chen, Y., and Li, R. (2015). Determination of nuclear magnetic resonance T-2 cutoff value based on multifractal theory - an application in sandstone with complex pore structure. Gwophysics 80 (1), D11–D21. doi:10.1190/geo2014-0140.1
Guo, B., Ghalambor, A., and Duan, S. (2004). Correlation between sandstone permeability and capillary pressure curves. J. Pet. Sci. Eng. 43, 239–246. doi:10.1016/j.petrol.2004.02.016
Guo, R., Xie, Q., Qu, X., Chu, M., Li, S., Ma, D., et al. (2020). Fractal characteristics of pore-throat structure and permeability estimation of tight sandstone reservoirs: A case study of chang 7 of the upper triassic Yanchang Formation in longdong area, Ordos Basin, China. J. Petrol. Sci. Eng. 184, 106555. doi:10.1016/j.petrol.2019.106555
Guo, X., Huang, Z., Zhao, L., Han, W., Ding, C., Sun, X., et al. (2019). Pore structure and multi-fractal analysis of tight sandstone using mip, NMR and NMRC methods: A case study from the kuqa depression, China. J. Petrol. Sci. Eng. 178, 544–558. doi:10.1016/j.petrol.2019.03.069
Huang, H., Chen, L., Sun, W., Xiong, F., Ji, W., Jia, J., et al. (2018). Pore-throat structure and fractal characteristics of shihezi formation tight gas sandstone in the Ordos Basin, China. Fractals 26 (2), 1840005. doi:10.1142/S0218348X18400054
Huang, H., Li, R., Xiong, F., Hu, H., Sun, W., Jiang, Z., et al. (2020). A method to probe the pore-throat structure of tight reservoirs based on low-field NMR: Insights from a cylindrical pore model. Mar. Petrol. Geol. 117, 104344. doi:10.1016/j.marpetgeo.2020.104344
Huang, W., Lu, S., Hersi, O. S., Wang, M., Deng, S., and Lu, R. (2017). Reservoir spaces in tight sandstones: Classification, fractal characters, and heterogeneity. J. Nat. Gas. Sci. Eng. 46, 80–92. doi:10.1016/j.jngse.2017.07.006
Lai, J., and Wang, G. (2015). Fractal analysis of tight gas sandstones using high-pressure mercury intrusion techniques. J. Nat. Gas. Sci. Eng. 24, 185–196. doi:10.1016/j.jngse.2015.03.027
Li, K. (2010). Analytical derivation of brooks-corey type capillary pressure models using fractal geometry and evaluation of rock heterogeneity. J. Petrol. Sci. Eng. 73, 20–26. doi:10.1016/j.petrol.2010.05.002
Li, K., and Horne, R. N. (2006). Fractal modeling of capillary pressure curves for the Geysers rocks. Geothermics 35, 198–207. doi:10.1016/j.geothermics.2006.02.001
Li, L., Wang, Y., Kürschner, M. W., Ruhl, M., and Vajda, V. (2020). Palaeovegetation and palaeoclimate changes across the triassic-jurassic transition in the Sichuan Basin, China. Palaeogeogr. Palaeocl. 556, 109891. doi:10.1016/j.palaeo.2020.109891
Li, P., Zheng, M., Bi, H., Wu, S., and Wang, X. (2017). Pore throat structure and fractal characteristics of tight oil sandstone: A case study in the Ordos Basin, China. J. Petrol. Sci. Eng. 149, 665–674. doi:10.1016/j.petrol.2016.11.015
Li, Y., Wang, Z., Pan, Z., Niu, X., Yu, Y., and Meng, S. (2019). Pore structure and its fractal dimensions of transitional shale: A cross-section from east margin of the Ordos Basin, China. Fuel 241, 417–431. doi:10.1016/j.fuel.2018.12.066
Li, Z., Shen, X., Qi, Z., and Hu, R. (2018a). Study on the pore structure and fractal characteristics of marine and continental shale based on mercury porosimetry, N2 adsorption and NMR methods. Energy. Fuels. 53, 12–21. doi:10.1016/j.jngse.2018.02.027
Li, Z., Wu, S., Xia, D., He, S., and Zhang, X. (2018b). An investigation into pore structure and petrophysical property in tight sandstones: A case of the Yanchang Formation in the southern Ordos Basin, China. Mar. Petrol. Geol. 97, 390–406. doi:10.1016/j.marpetgeo.2018.07.014
Liu, D., Sun, W., and Ren, D. (2019). Experimental investigation of pore structure and movable fluid traits in tight sandstone. Processes 7 (3), 149. doi:10.3390/pr7030149
Liu, M., Xie, R., Li, C., Li, X., Jin, G., and Guo, J. (2018). Determining the segmentation point for calculating the fractal dimension from mercury injection capillary pressure curves in tight sandstone. J. Geophys. Eng. 15 (4), 1350–1362. doi:10.1088/1742-2140/aab1d8
Mandelbrot, B. B., Passoja, D. E., and Paullay, A. J. (1984). Fractal character of fracture surfaces of metals. Nature 308 (5961), 721–722. doi:10.1038/308721a0
Mandelbrot, B. B., and Wheeler, J. A. (1983). The fractal geometry of nature. Q. Rev. Biol. 147 (3), 286–287. doi:10.1119/1.13295
Nelson, P. H. (2009). Pore-throat sizes in sandstones, tight sandstones and shales. AAPG Bull. 93, 329–340. doi:10.1306/10240808059
Nie, R., Zhou, J., Chen, Z., Liu, J., and Pan, Y. (2021). Pore structure characterization of tight sandstones via a novel integrated method: A case study of the sulige gas field, Ordos Basin (northern China). J. Asian. Earth. Sci. 213, 104739. doi:10.1016/j.jseaes.2021.104739
Nooruddin, H. A., Hossain, M. E., Al-Yousef, H., and Okasha, T. (2014). Comparison of permeability models using mercury injection capillary pressure data on carbonate rock samples. J. Petrol. Sci. Eng. 121, 9–22. doi:10.1016/j.petrol.2014.06.032
Pfeifer, P. (1984). Fractal dimension as working tool for surface-roughness problems. Appl. Surf. Sci. 18 (1-2), 146–164. doi:10.1016/0378-5963(84)90042-4
Pfeiferper, P., and Avnir, D. (1983). Chemistry nonintegral dimensions between two and three. J. Chem. Phys. 79 (7), 3369–3358.
Qiao, J., Zeng, J., Jiang, S., and Wang, Y. (2020). Impacts of sedimentology and diagenesis on pore structure and reservoir quality in tight oil sandstone reservoirs: Implications for macroscopic and microscopic heterogeneities. Mar. Pet. Geol. 111, 279–300. doi:10.1016/j.marpetgeo.2019.08.008
Qu, Y., Sun, W., Tao, R., Luo, B., Chen, Lei., and Ren, D. (2020). Pore-throat structure and fractal characteristics of tight sandstones in Yanchang Formation, Ordos Basin. Mar. Petrol. Geol. 120, 104573. doi:10.1016/j.marpetgeo.2020.104573
Schmitt Rahner, M., Halisch, M., Peres Fernandes, C., Weller, A., and Sampaio Santiago dos Santos, V. (2018). Fractal dimensions of pore spaces in unconventional reservoir rocks using X-ray nano- and micro-computed tomography. J. Nat. Gas. Sci. Eng. 55, 298–311. doi:10.1016/j.jngse.2018.05.011
Shao, X., Pang, X., Li, H., and Zhang, X. (2017). Fractal analysis of pore network in tight gas sandstones using NMR method: A case study from the Ordos Basin, China. China 31 (10), 10358–10368. doi:10.1021/acs.energyfuels.7b01007
Song, Z., Liu, G., Yang, W., Zou, H., Sun, M., and Wang, X. (2018). Multi-fractal distribution analysis for pore structure characterization of tight sandstone—a case study of the upper paleozoic tight formations in the longdong district, Ordos Basin. Mar. Petrol. Geol. 92, 842–854. doi:10.1016/j.marpetgeo.2017.12.018
Sun, L., Zou, C., Jia, A., Wei, Y., Zhu, R., Wu, S., et al. (2019). Development characteristics and orientation of tight oil and gas in China. Petrol. explor. Dev. 46, 1073–1087. doi:10.1016/s1876-3804(19)60264-8
Wang, F., Jiao, L., Liu, Z., Tan, X., Wang, C., and Gao, J. (2018a). Fractal analysis of pore structures in low permeability sandstones using mercury intrusion porosimetry. J. POROUS. MEDIA. 21 (11), 1097–1119. doi:10.1615/JPorMedia.2018021393
Wang, F., and Wang, L. (2022). Pore structure analysis and permeability prediction of shale oil reservoirs with HPMI and NMR: A case study of the permian lucaogou Formation in the jimsar sag, junggar basin, NW China. J. Petrol. Sci. Eng. 214, 110503. doi:10.1016/j.petrol.2022.110503
Wang, F., Yang, k., and Cai, J. (2018b). Fractal characterization of tight oil reservoir pore structure using nnclear mahnetic resonance and mercury intrusion porosimetry. Fractals 26 (2), 1840017. doi:10.1142/S0218348X18400170
Wang, F., Yang, K., You, J., and Lei, X. (2019). Analysis of pore size distribution and fractal dimension in tight sandstone with mercury intrusion porosimetry. Physics 13, 102283. doi:10.1016/j.rinp.2019.102283
Wang, F., and Zeng, F. (2020). Novel insights into the movable fluid distribution in tight sandstones using nuclear magnetic resonance and rate-controlled porosimetry. Nat. Resour. Res. 29, 3351–3361. doi:10.1007/s11053-020-09635-1
Wang, Q., Chen, D., Wang, F., Gao, X., Zou, Yi., Tian, Z., et al. (2021a). Origin and distribution of an under-pressured tight sandstone reservoir: The Shaximiao Formation, central Sichuan Basin. Mar. Petrol. Geol. 132, 105208. doi:10.1016/j.marpetgeo.2021.105208
Wang, Q., Zeng, F., Wang, L., Hou, X., Cheng, H., and Gao, J. (2021b). Fractal analysis of tight sandstone petrophysical properties in unconventional oil reservoirs with NMR and rate-controlled porosimetry. Energy. Fuels. 35, 3753–3765. doi:10.1021/acs.energyfuels.0c03394
Washburn, E. W. (1921). The dynamics of capillary flow. Phys. Rev. 17, 273–283. doi:10.1103/physrev.17.273
Wu, K., Chen, D., Zhang, W., Yang, H., Wu, H., Cheng, X., et al. (2022a). Movable fluid distribution characteristics and microscopic mechanism of tight reservoir in Yanchang Formation, Ordos Basin. Front. Earth. Sc-switz. 10, 840875. doi:10.3389/feart.2022.840875
Wu, K., Liu, C., Ouyang, S., Luo, B., Zhao, D., Sun, W., et al. (2022b). Investigation of pore-throat structure and fractal characteristics of tight sandstones using HPMI, CRMI, and NMR methods: A case study of the lower shihezi Formation in the sulige area, Ordos Basin. J. Petrol. Sci. Eng. 210, 110053. doi:10.1016/j.petrol.2021.110053
Xiao, D., Jiang, S., Thul, D., HuangLu, W. Z., and Lu, S. (2017). Combining rate-controlled porosimetry and NMR to probe full-range pore throat structures and their evolution features in tight sands: A case study in the songliao basin, China. Mar. Petrol. Geol. 83, 111–123. doi:10.1016/j.marpetgeo.2017.03.003
Zang, Q., Liu, C., Awan, R. S., Yang, X., Li, G., Wu, Y., et al. (2022a). Occurrence characteristics of the movable fluid in heterogeneous sandstone reservoir based on fractal analysis of NMR data: A case study of the chang 7 member of ansai block, Ordos Basin, China. J. Petrol. Sci. Eng. 214, 110499. doi:10.1016/j.petrol.2022.110499
Zang, Q., Liu, C., Awan, R. S., Yang, X., Lu, Z., Li, G., et al. (2022b). Comparison of pore size distribution, heterogeneity and occurrence characteristics of movable fluids of tight oil reservoirs formed in different sedimentary environments: A case study of the chang 7 member of Ordos Basin, China. Nat. Resour. 31 (1), 415–442. doi:10.1007/s11053-021-09986-3
Zhang, X., Wu, C., and Li, T. (2017). Comparison analysis of fractal characteristics for tight sandstones using different calculation methods. J. Geophys. Eng. 14 (1), 120–131. doi:10.1088/1742-2140/14/1/120
Zhang, Z., and Weller, A. (2014). Fractal dimension of pore-space geometry of an Eocene sandstone formation. Geophysics 79, 377–387. doi:10.1190/geo2014-0143.1
Zhu, H., Zhang, T., Zhong, D., Li, Y., Zhang, J., and Chen, X. (2019). Binary pore structure characteristics of tight sandstone reservoirs. Petrol. explor. Dev. 46 (6), 1297–1306. doi:10.1016/S1876-3804(19)60283-1
Zou, C., Yang, Z., Tao, S., Li, W., Wu, S., Hou, L., et al. (2012a). Nano-hydrocarbon and the accumulation in coexisting source and reservoir. Petrol. explor. Dev. 39, 15–32. doi:10.1016/s1876-3804(12)60011-1
Keywords: fractal dimension, tight sandstone, pore structure, meandering stream facies, shaximiao formation, sichuan basin
Citation: Feng L, Jiang Y, Guo G, Yang C, Zhu X, Zeng Q, Cai G and Wang Z (2023) Pore structure and fractal characteristics of tight sandstone in meandering stream facies: a case study of the J2s2 member in the central Sichuan Basin, China. Front. Earth Sci. 11:1183734. doi: 10.3389/feart.2023.1183734
Received: 10 March 2023; Accepted: 20 April 2023;
Published: 11 May 2023.
Edited by:
Shuai Yin, Xi’an Shiyou University, ChinaReviewed by:
Dongxu Zhang, Chengdu University of Technology, ChinaCopyright © 2023 Feng, Jiang, Guo, Yang, Zhu, Zeng, Cai and Wang. This is an open-access article distributed under the terms of the Creative Commons Attribution License (CC BY). The use, distribution or reproduction in other forums is permitted, provided the original author(s) and the copyright owner(s) are credited and that the original publication in this journal is cited, in accordance with accepted academic practice. No use, distribution or reproduction is permitted which does not comply with these terms.
*Correspondence: Zhanlei Wang, MjgxNDI1NDdAcXEuY29t
Disclaimer: All claims expressed in this article are solely those of the authors and do not necessarily represent those of their affiliated organizations, or those of the publisher, the editors and the reviewers. Any product that may be evaluated in this article or claim that may be made by its manufacturer is not guaranteed or endorsed by the publisher.
Research integrity at Frontiers
Learn more about the work of our research integrity team to safeguard the quality of each article we publish.