- 1School of Civil Engineering, Chongqing University, Chongqing, China
- 2Chongqing Chengtou Road and Bridge Administration Co., Ltd., Chongqing, China
Rock slopes have the characteristics of complex geological conditions, weak structural surface development, steep slope, and great damage. In this study, the Sujiaba overpass slope in Chongqing was selected as the evaluation object, and the main stability evaluation methods of rock slope were analyzed. Combined with the special geological conditions and geographical location of the rock slope, through a geological survey, the slope was qualitatively analyzed based on the stereographic projection method, and the slope stability safety factor was calculated by using the finite element strength reduction method. FLAC3D was used to simulate the initial stress state of the unstable rock mass, the limit state stability of the unstable rock mass before bolt support, and the stability after bolt support. The simulation results show that the stability coefficients of selected unstable rock masses W1, W2, W6, and W7 under the limit state before bolt support are, respectively, 1.22, 1.80, 5.90, and 2.10. Unstable rock masses separate from the parent rock, causing a large displacement due to their instability and downward sliding. After bolt support, stability coefficients for those four unstable rock masses are 1.60, 2.40, 8.60, and 3.20, respectively. Under the same reduction coefficient, rock masses are stable and the displacement is small. The results show that the calculation results of the initial stress state of the rock slope are consistent with the theoretical understanding and field investigation. After the implementation of bolt support, the anti-sliding stability of unstable rock is obviously improved. The research results have important scientific guiding significance and practical value for revealing the failure mechanism of rock slope and analyzing the stability of unstable rock mass.
1 Introduction
China has a vast territory, complex topography, and undulating terrain. Only three types of topography and geomorphology in plateau, mountain, and hilly areas account for about 65% of the land area. China has become one of the countries with the most serious geological disasters and the most threatened population in the world due to the complicated and changeable geomorphological conditions. There are many kinds of geological disasters that occur in China, including landslides, collapses, debris flows, ground collapses, and ground fissures. Among them, landslides and collapses are the main types, accounting for about 70% and 20% of the total geological disasters, respectively. For the prevention and control of slope disasters such as landslides and collapses, it is first necessary to correctly analyze the slope stability state. Many experts and scholars have carried out a lot of research on slope stability analysis, which can be summarized into three categories: qualitative analysis, quantitative analysis, and uncertainty analysis methods.
The qualitative analysis method mainly analyzes the main factors affecting the slope stability, the deformation failure mode, and the instability mechanical mechanism through geological exploration and analyzes the causes and evolution history of the deformed slope. Qualitative analysis includes the stereographic projection method (Kincal, 2014; Xiao et al., 2015; Zhang et al., 2019; Liu, 2022), engineering geological analogy method (Liu et al., 2007; Gao, 2015; Tu et al., 2015), and expert system method (Hao et al., 1995; AlHomoud and Tahtamoni, 2000; Naghadehi et al., 2011; Liu and Yin, 2012; Azarafza et al., 2021a). The quantitative analysis method analyzes the deformation and stability of rock mass under various force fields by establishing the mechanical model of engineering rock mass and using appropriate analysis methods and provides quantitative basis for rock engineering protection design and construction. Quantitative analysis mainly includes the limit equilibrium method (Zhong, 2016; Faramarzi et al., 2017) and numerical analysis method (Ning et al., 2011; Dadashzadeh et al., 2017; Yang et al., 2021). The limit equilibrium method includes the slice method (Huang, 2013; Su et al., 2022), Bishop method (Sheng et al., 2021), and transfer coefficient method (Bi et al., 2012). Numerical analysis methods include the finite element method (Wang and Lin, 2021), boundary element method (Wijesinghe et al., 2022), discrete element method (Wang et al., 2020a; Azarafza et al., 2020), Lagrange method (Chen et al., 2019), and discontinuous deformation analysis method (He et al., 2018; Azarafza et al., 2020). The uncertainty analysis method (Li et al., 2016; Deng et al., 2017) refers to the analysis and calculation of slope stability by using the uncertainty principle and the method based on the deformation data of slope rock and soil mass obtained by investigation technology. Uncertainty analysis includes reliability analysis (Zai et al., 2021), fuzzy mathematics analysis (Li et al., 2015; Azarafza et al., 2021a), grey system analysis (Zhang and Xu, 2019), neural network analysis (Ray et al., 2020; Meng et al., 2021; Hu et al., 2022), genetic algorithm (Xu et al., 2019), cluster analysis (Alimohammadlou et al., 2014), and machine learning (Wang et al., 2020b; Xu et al., 2022; Zhang et al., 2022).
At present, there are many analysis methods for analyzing rock slope stability, and all kinds of analysis methods have their applicable conditions and limitations (Table 1). However, the actual slope engineering is extremely complex, and any single analysis and evaluation method cannot solve the practical problems well. Therefore, in the actual slope stability analysis, a variety of analysis methods should be used for comprehensive analysis according to its specific characteristics. It can more accurately determine the current situation and trend of rock mass development and obtain a more objective, reliable, and reasonable evaluation result, so as to take reasonable prevention and control measures.
In this study, the coupling strength reduction and numerical simulation methods are used to fully consider the impact of boundary conditions, and appropriate cohesion and internal friction angle are given to the fracture surface at the rear edge of the rock slope. This method can easily and accurately calculate the stability coefficient that is more consistent with the actual shape of the unstable rock and can automatically find the potential failure location of the slope.
2 Locality, materials, and methods
The Sujiaba overpass slope (Figure 1A) is located next to the Sujiaba overpass OP6 ∼ OP9 pier of the Caiyuanba Bridge in Chongqing. There is a residential district with large population between the slope and Nanbin Road. The slope is about 350 m long, and the highest point is about 40 m from the ground. The north side slope is anchored shotcrete slope protection. The slope next to the OP6 ∼ OP9 pier adopts the cantilever anti-slide pile and anchor frame structure. On 1 July 2020, the Sujiaba slope caused landslides in local areas due to rain and building loading. This study selected the Sujiaba overpass slope as the research object for carrying out stability numerical simulation analysis.
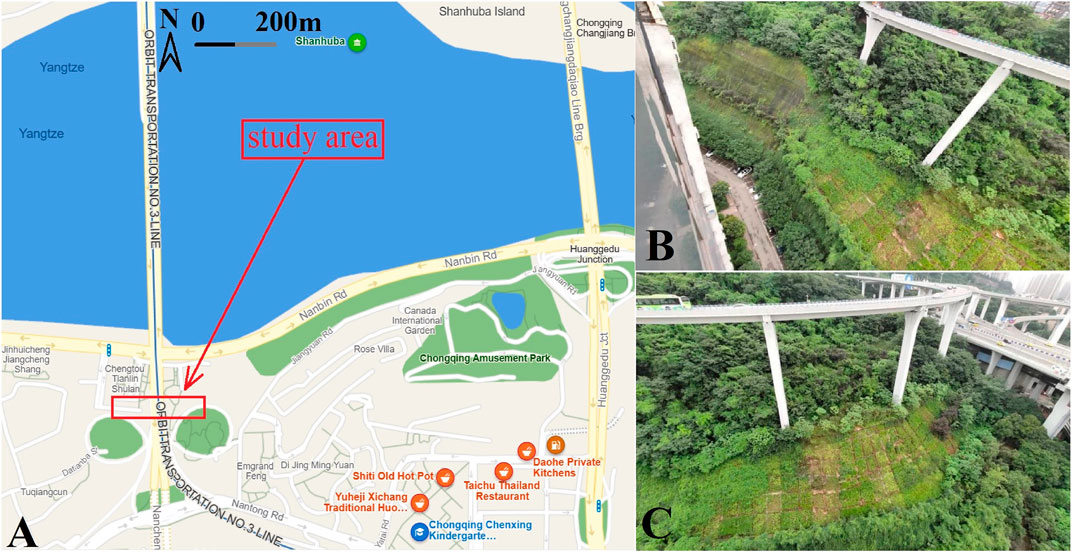
FIGURE 1. Location of the study area. (A) Traffic location of the study area. (B,C) Field situation of the Sujiaba overpass slope.
The regional landform belongs to the tectonic denudation shallow hill landform, and the site micro-landform belongs to the cliff, slope, and treated slope. The slope area includes a municipal park and a residential area. The south side of the community is a built road with an elevation of about 263–267 m. The key survey of the cliff slope is 15–25 m high, the cliff top elevation is about 259–264 m, the cliff bottom elevation is 248–250 m, and the cliff dip angle is 60°–80°. The slope is under the cliff slope, and the slope is mainly covered by artificial fill, with an inclination angle of 5°–35°. The buildings at the bottom of the slope (Figures 1B, C) include another residential area and Tongyuanju Light Rail Station.
In this study, combined with a geological survey, the stereographic projection method was used to qualitatively analyze the rock slope, and the finite element strength reduction method (Bai et al., 2014; Jiang et al., 2015; Nie et al., 2019; Azarafza et al., 2021b) and FLAC3D (Sun et al., 2011; Zhan et al., 2019) were used to numerically simulate the stability of the unstable rock mass in the study area.
The basic principle of the finite element strength reduction method is to divide the shear strength parameter values (cohesion and internal friction angle) of the rock and soil mass by a reduction factor at the same time. Then, a new set of strength parameter values is obtained and used in the finite element as new material parameters for trial calculation until it reaches the limit failure state. When the calculation is just convergent, that is, when the reduction factor is slightly larger, the calculation does not converge, and the corresponding reduction factor is called the minimum safety factor of the rock mass.
The finite element strength reduction safety factor is expressed as
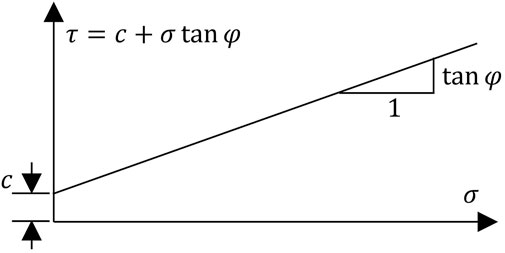
Different strength yield criteria can be used in the finite element strength reduction method. The strength
So,
This strength reduction form is consistent with the definition of the safety factor of the traditional limit equilibrium slice method for slope stability analysis. The limit equilibrium method of traditional slope stability analysis assumes a sliding surface in advance, and it calculates the safety factor according to the balance of force (moment). The stability safety factor is defined as the ratio of anti-sliding force (moment) to sliding force (moment) of the sliding surface, namely,
where
By dividing both sides of Eq. 2 by
where
It can be seen that the traditional limit equilibrium method is to reduce the shear strength indexes
FLAC3D can be used to simulate the three-dimensional structural stress characteristics and plastic flow analysis of soil, rock, and other materials. The actual structure is fitted by adjusting the polyhedral elements in the three-dimensional mesh. The element material can adopt a linear or non-linear constitutive model. Under the action of external force, when the material yields, the mesh can deform and move accordingly. FLAC3D adopts the explicit Lagrangian algorithm and mixed discrete partition technique, which can simulate the plastic failure and flow of materials very accurately. Since there is no need to form a stiffness matrix, it is possible to solve large-scale three-dimensional problems based on a smaller memory space.
3 Results
3.1 Characteristics of unstable rock mass
According to the geological survey report, on the sandstone cliff, due to the influence of fracture cutting, topography, and rock cavity-free conditions, some rock masses are separated from the parent rock and slightly deformed to form unstable rock, which has a poor stability. The unstable rock mass is mainly controlled by two sets of structural fracture surfaces. The stability polar stereographic projection of the relationship between the fracture of the unstable rock mass and the occurrence of the free surface shows that the unstable rock mass is mainly controlled by the cutting of the posterior wall fracture or the two sets of intersecting type fractures and the cutting and decomposition of other structural fractures. The unstable rock mass is in a basically stable state to an unstable state.
In the investigation area, from the investigation of the location of the cliff, it is deduced that the deformation characteristics and the development of the fissures control the stability of the unstable rock, the rock mass is under the action of its own weight, and the wedge splitting of the water pressure of the rear wall fissure is added. The fissure is continuously widened and deepened, and finally, the locking part is destroyed and the unstable rock collapses. According to the survey, the unstable rock area has different sizes of unstable rock rolling in the annual flood season. From the stability and development trend of unstable rock, it is concluded that the overall stability of unstable rock in the survey area is declining.
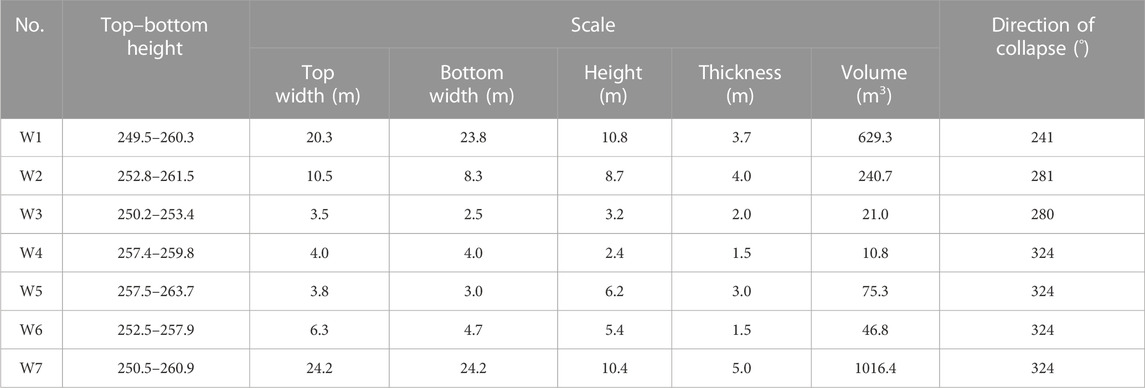
According to the results of the field geological survey data, in the local scarp topography, due to the influence of differential weathering between sand and mudstone, a total of seven obvious unstable rocks (unstable rock zones) were found. The volume of a single unstable rock is 10.8–1016.4 m3, the total volume is 2040.3 m3, the linear density of unstable rock distribution is per/25 m, and the volume linear density is 11.7 m3/m. Among them, the terrain slope under the unstable rock mass W1–W4 is generally slow, and the rolling distance of the rock block after the collapse of the unstable rock mass is not very large, which mainly threatens the sidewalks, steps, park facilities, and so on. The terrain slope below the unstable rock mass W5–W7 is generally steep, and the rolling distance of the rock block after the collapse of the unstable rock is large, which mainly threatens the residential area at the bottom of the slope. The basic statistics of each unstable rock mass are shown in Table 2.
The cliff is controlled by lithology, cut by layers and fissures, and affected by the weathered rock cavity of the base. The shapes and sizes of unstable rock masses are different. The shapes of unstable rock masses are mainly cuboid, square, and columnar, and some are cone-shaped, inverted triangle-shaped, disc-shaped, and irregular.
According to the size of the volume, it is divided as follows: V < 10 m3 is a small unstable rock mass, 10–100 m3 is a medium unstable rock mass, 100–1000 m3 is a large unstable rock mass, and V > 1000 m3 is a super large unstable rock mass. According to Table 1, there are seven main unstable rocks (zones) found in this survey. The largest volume is that of the W7 unstable rock zone, which is 1016.4 m3, and this rock zone belongs to the large unstable rocks; the smallest volume is that of the W4 unstable rock zone, which is only 10.8 m3, and this rock zone belongs to the medium unstable rocks.
The destruction of unstable rock is often sudden, fast, and difficult to monitor and prevent. For the whole slope, the focus of potential safety hazard is the threat of the unstable rock mass developed on the slope to the overpass and the residential area in the front edge of the cliff zone. Therefore, according to the danger of unstable rock mass and the importance of threat objects, this study selects four typical unstable rock masses of W1, W2, W6, and W7 for numerical model simulation, focusing on the simulation and analysis of the current stability of the unstable rock mass and the stability after bolt support. The section drawing and stereographic projection figures for those four unstable rock masses are shown in Figure 3.
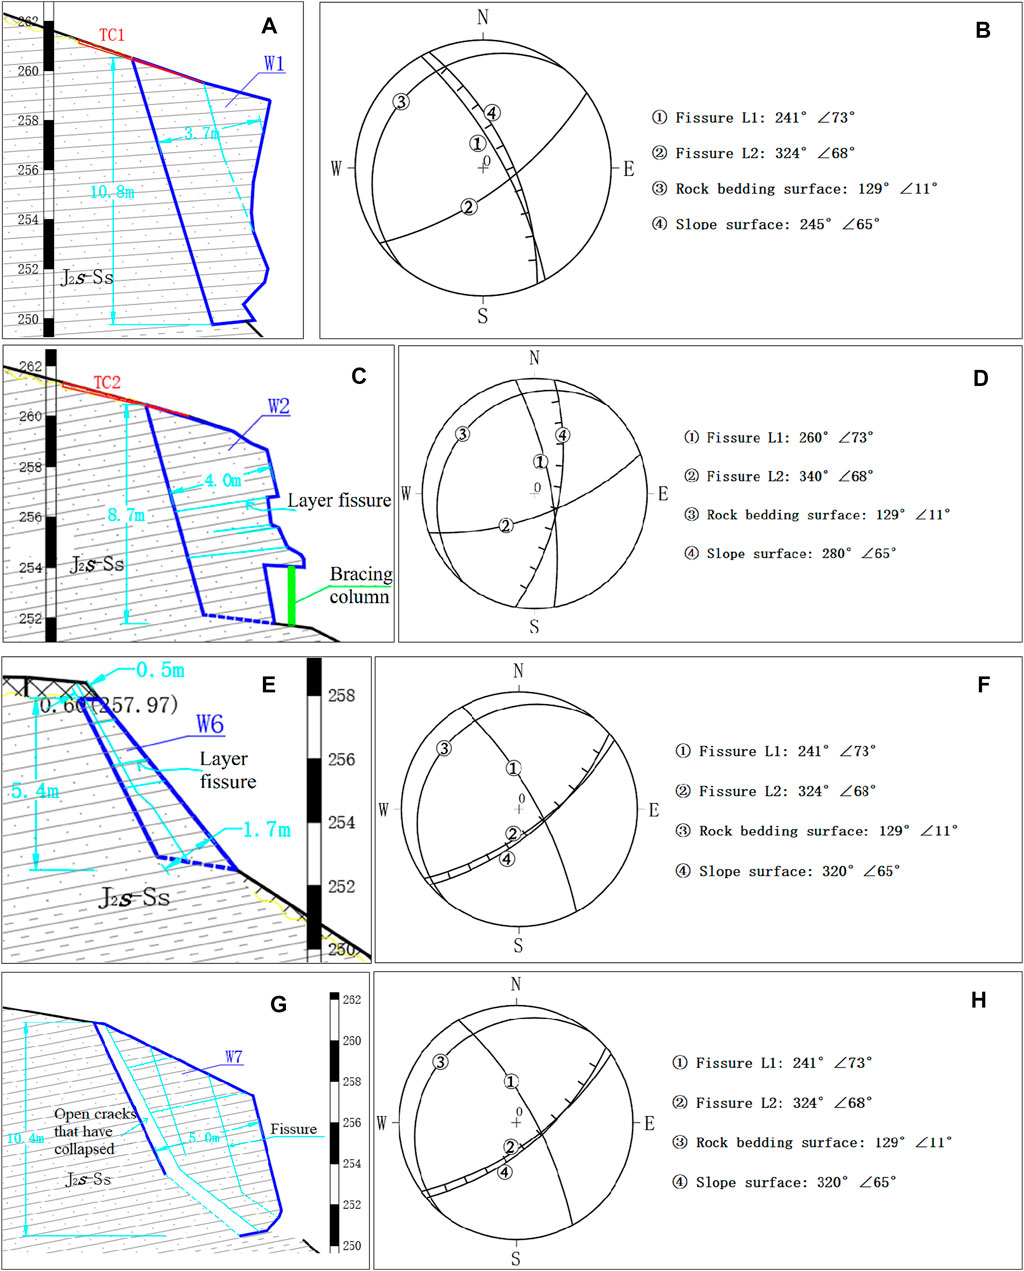
FIGURE 3. Qualitative analysis. (A) Section drawing of W1. (B) Stereographic projection figure of W1. (C) Section drawing of W2. (D) Stereographic projection figure of W2. (E) Section drawing of W6. (F) Stereographic projection figure of W6. (G) Section drawing of W7. (H) Stereographic projection figure of W7.
3.2 Numerical model
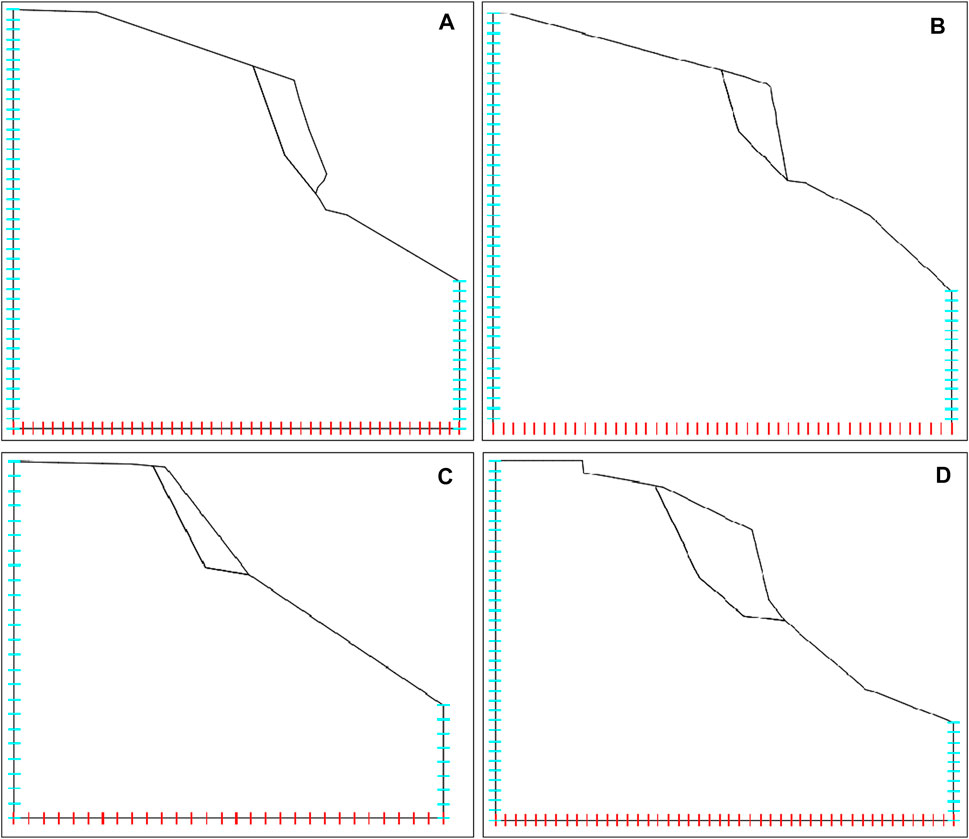
According to the data of field investigation and treatment engineering design, four typical unstable rock monomer characteristic sections of W1, W2, W6, and W7 were selected for numerical simulation analysis, and FLAC3D software was used for calculation. The calculation model is as follows.
3.2.1 Numerical analysis model
W1: 36 m wide, 33 m high, and divided into 1,474 units and 3,092 nodes.
W2: 36 m wide, 32.8 m high, and a total of 1,436 units and 3,018 nodes.
W6: 23 m wide, 19.5 m high, and divided into 538 units and 1,166 nodes.
W7: 36 m wide, 28.8 m high, and a total of 1,166 units and 2,470 nodes.
The rock mass is simulated by the solid element. The bolt is simulated by the cable structural element. The existing cracks at the trailing edge of unstable rock are simulated by the structural plane element interface, and the potential slip surface of the sliding instability failure of unstable rock is simulated by the structural plane element interface. The constitutive model of rock and soil is considered the Mohr–Coulomb constitutive model.
3.2.2 Calculation conditions
According to the relevant unstable rock control design and geological survey data, as well as the research objectives of this project, the calculation is divided into three parts. The specific analysis parts are as follows:
Initial state analysis: The stress state of the unstable rock slope under the initial state is mainly analyzed, which provides the basis for subsequent research and analysis.
The limit state analysis and stability analysis of unstable rock under unimplemented support engineering are carried out.
Unstable rock bolt support, analysis of bolt support to implement the stability of unstable rock, and support effect evaluation are also carried out.
Numerical calculation models are shown in Figure 4.
3.2.3 Boundary conditions
The displacement of X direction is constrained on both sides of the model, the displacement of Y direction is constrained on the bottom, and the surface is a free surface. Boundary conditions are shown in Figure 5.
3.2.4 Parameter value
According to the relevant data, combined with the engineering analogy method, the physical and mechanical parameters of rock and soil are shown in Table 3. The pile foundation does not consider the shear force and normal cohesion, and its physical and mechanical parameters are shown in Table 4. The existing cracks at the trailing edge of the unstable rock do not consider the strength, and the interface parameters of the structural plane element used in the potential slip surface of the sliding instability failure of the unstable rock are shown in Table 5.
3.3 Numerical simulation result analysis
By numerical simulation calculation, the initial stress state of W1, W2, W6, and W7 unstable rock masses is obtained, as shown in Figure 6.
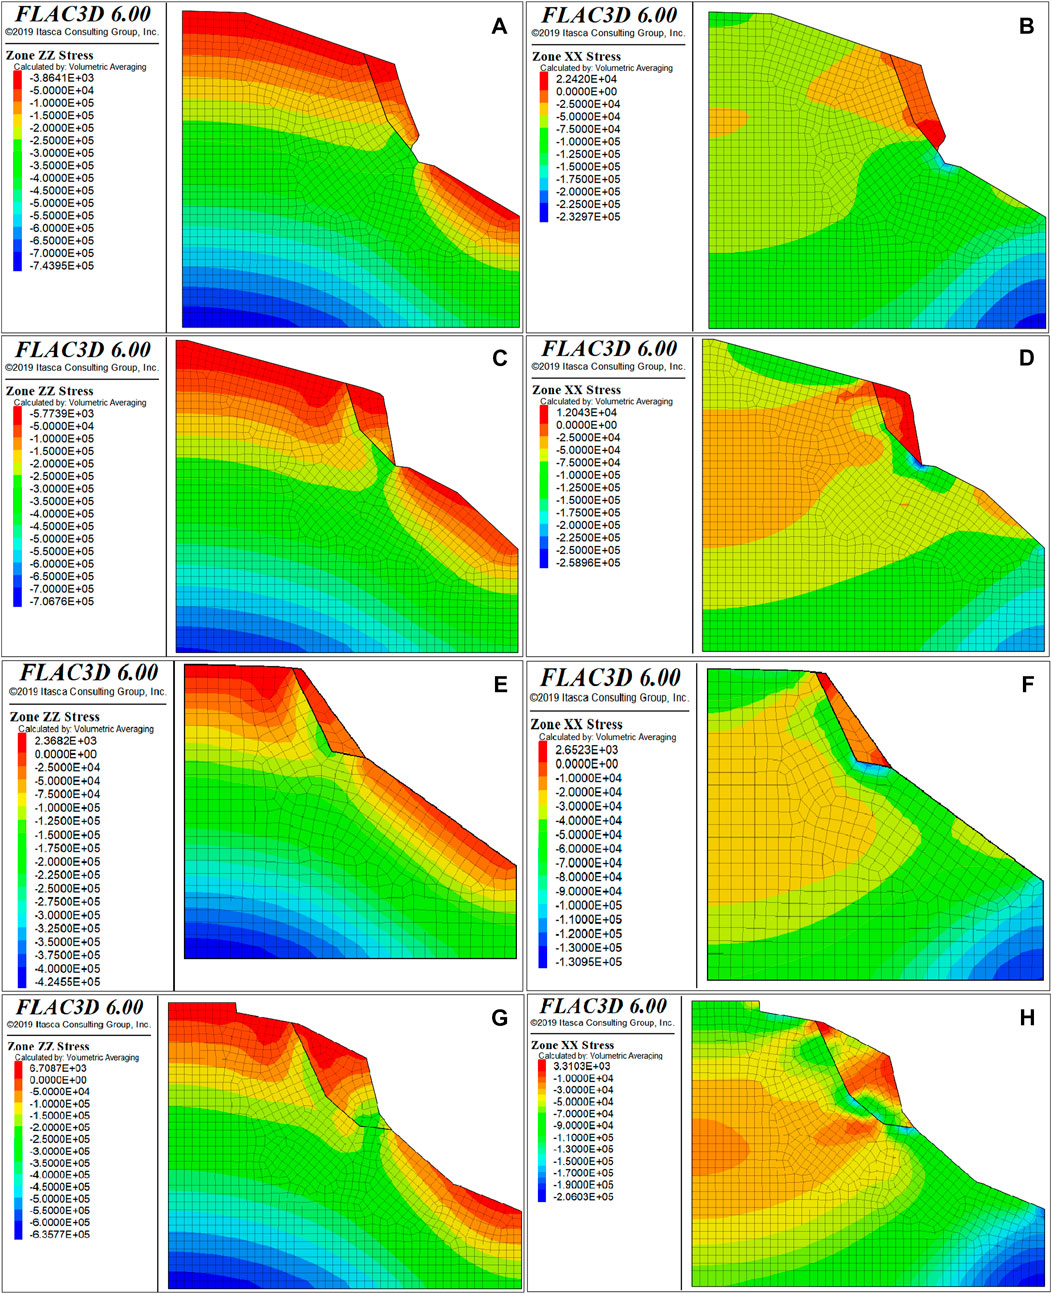
FIGURE 6. Initial stress state. (A) Vertical stress of W1. (B) Horizontal stress of W1. (C) Vertical stress of W2. (D) Horizontal stress of W2. (E) Vertical stress of W6. (F) Horizontal stress of W6. (G) Vertical stress of W7. (H) Horizontal stress of W7.
It can be seen from the figure that the stress field of the unstable rock slope is obviously affected by topography, and the stress trace near the slope surface deflects with the slope shape. With the increase in depth, the influence of the slope shape on the stress field decreases, showing the characteristics of the self-weight stress field. The vertical stress and horizontal stress of the free surface of the slope and the free surface of the unstable rock are small, and the stress concentration occurs at the potential slip failure surface of the unstable rock, and the horizontal stress concentration is obvious. The calculation results of the initial stress state of the rock slope are consistent with the theoretical understanding and field investigation.
4 Discussion
4.1 Limit state and stability analysis
This paper analyzes the effect of unstable rock under bolt support, mainly through the comparison of the displacement of unstable rock before and after bolt support. Under the condition that the unstable rock is not supported, the strength of the potential slip surface under the sliding instability of the unstable rock is reduced, and the strength reduction coefficient is gradually increased until the unstable rock model is no longer convergent, that is, the whole sliding failure of the unstable rock occurs. The reduction coefficient is the safety reserve coefficient of the potential slip surface under the condition that the unstable rock is not supported, that is, the stability coefficient Fs. Then, under the condition of bolt support, the stability coefficient Fs calculated previously is used to calculate the potential slip surface strength under the sliding instability of unstable rock. The displacement influence of unstable rock before and after bolt support is compared to evaluate the support effect.
By analyzing the limit state of the potential slip surface strength reduction of W1, W2, W6, and W7, the stability coefficient of unstable rock is obtained as shown in Table 6.
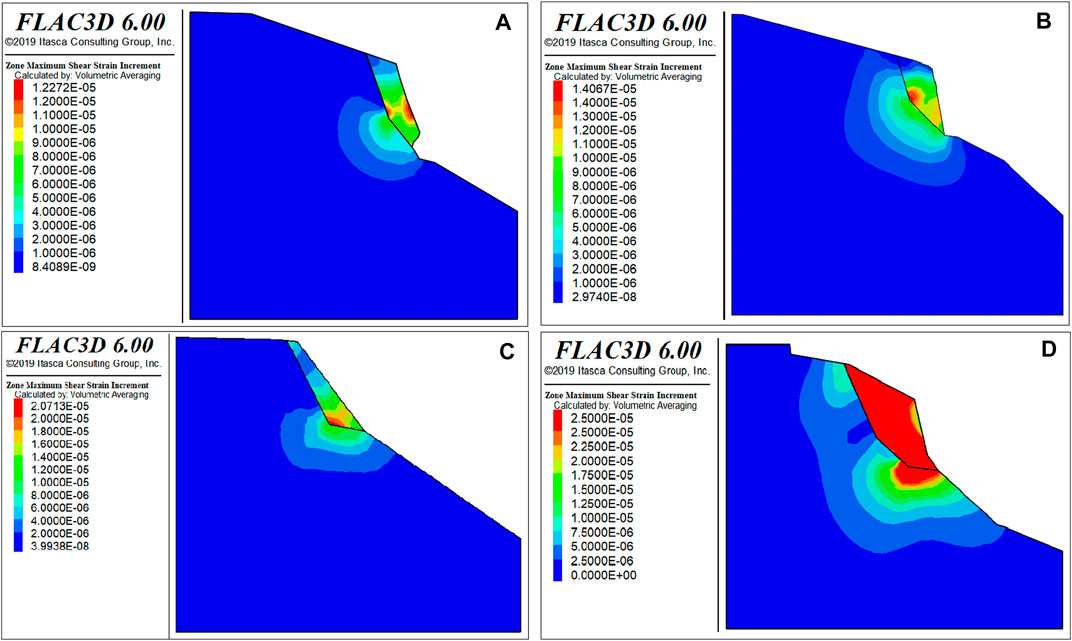
By numerical simulation calculation, the shear strain diagram of the unstable rock model under the limit state of W1, W2, W6, and W7 is obtained as shown in Figure 7.
From Figure 7, it can be seen that when the strength of the potential slip surface of the unstable rock is reduced to the limit state, the failure point first occurs at the uppermost position of the potential slip surface and gradually develops downward, causing shear failure between the unstable rock mass and the parent rock. During this process, a certain shear deformation occurs at the same time, and finally, the shear deformation and failure occur along the potential slip surface.
4.2 Effectiveness evaluation of unstable rock bolt support
Through the strength reduction method of the potential slip surface of unstable rock, the stability of W1, W2, W6, and W7 before and after bolt support is calculated, and the stability coefficient shown in Table 7 is obtained. It can be seen from the table that bolt support improves the anti-slip stability of unstable rock.
By numerical simulation calculation, the comparison diagram of unstable rock displacement under the limit state before and after bolt support of W1, W2, W6, and W7 is obtained as shown in Figure 8.
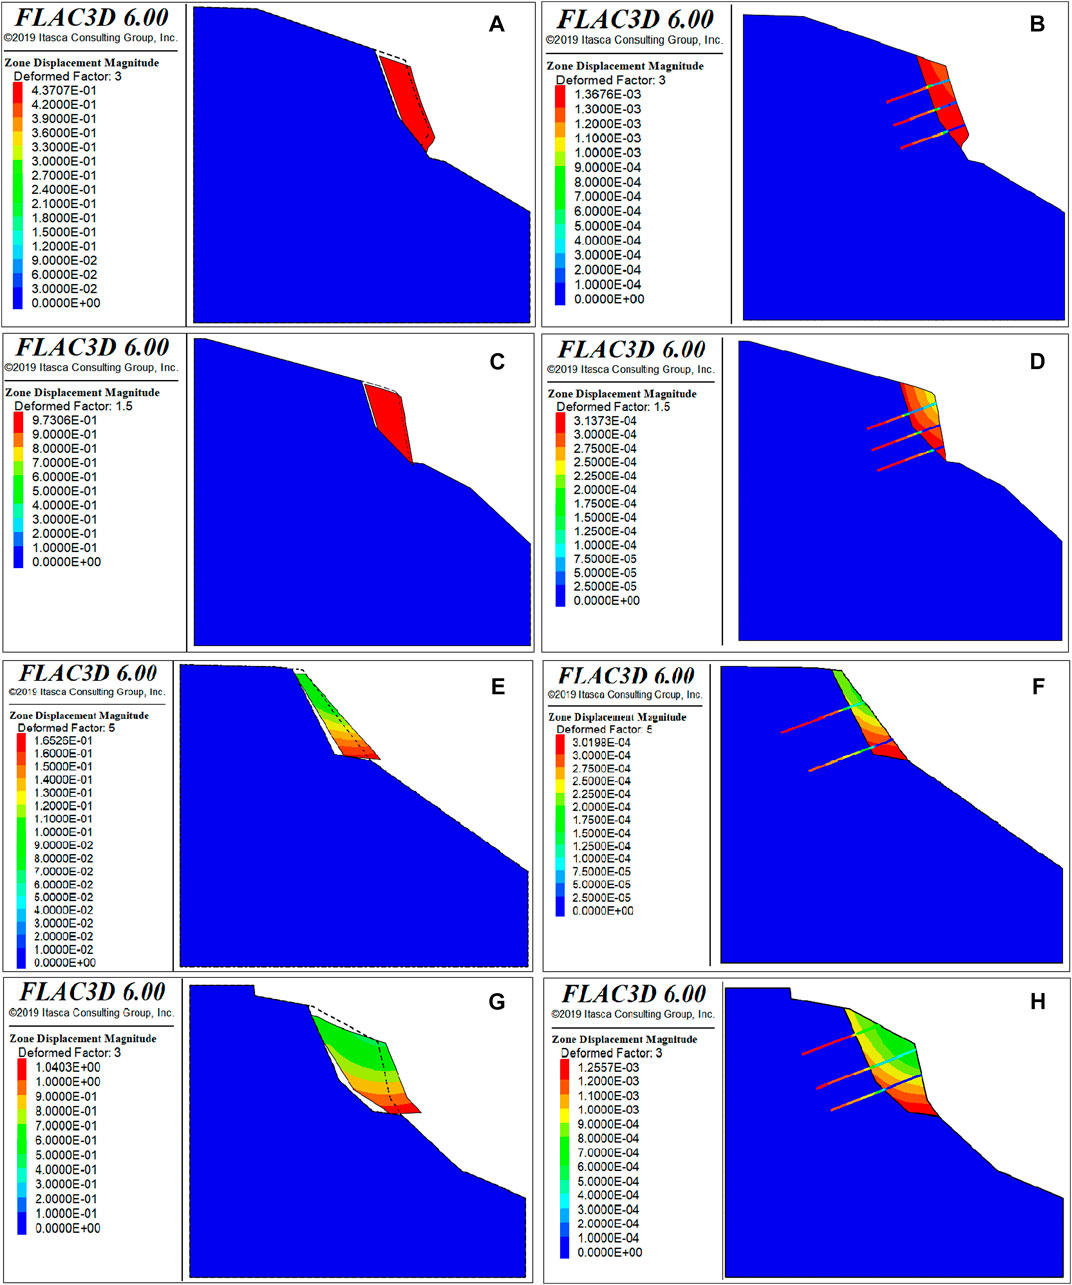
FIGURE 8. Displacement comparison of before and after bolt support. (A) Before bolt support of W1. (B) After bolt support of W1. (C) Before bolt support of W2. (D) After bolt support of W2. (E) Before bolt support of W6. (F) After bolt support of W6. (G) Before bolt support of W7. (H) After bolt support of W7.
Under the condition of no bolt support, the displacement of unstable rock is not the actual displacement. Since the model is not tested, the unstable rock is unstable, and the displacement will continue to increase, and the rock slides down the slope. Figure 8 shows that:
(1) Before the implementation of bolt support, in the limit state, W1, W2, W6, and W7 unstable rock masses are separated from the parent rock, and the instability slips downward to produce a large displacement.
(2) After the implementation of bolt support, under the same reduction factor, W1, W2, W6, and W7 unstable rock masses are not destabilized from the parent rock, and the displacement of the unstable rock is small. The maximum displacement of W1, W2, W6, and W7 is 1.4, 0.3, 0.3, and 1.3 mm, respectively.
4.3 Further research prospects
In general, the development of rock slope stability calculation has experienced a process from field testing to theoretical research to numerical simulation, involving qualitative analysis, quantitative calculation, and uncertainty research. This paper provides a theoretical basis for the prevention and control measures of unstable rock by conducting geological investigation of rock slopes, establishing numerical models, calculating the stability coefficient of unstable rock, and evaluating the effect of bolt support on unstable rock. However, there are still some issues in the current research that need to be further explored and improved.
In the theory of unstable rock prevention and control, stability calculation is the foundation. Reasonable stability calculation can accurately reflect the true stable state of unstable rock. A single and simple calculation model often cannot truly reflect the original calculation system for the stability of unstable rock, and the stability analysis of rock slopes should not be solved by only one method. A comprehensive evaluation of the stability of unstable rock mass should be made based on a higher level of investigation, combining theoretical solutions, numerical solutions, graphical methods, and reliability analysis, to make it more consistent with the actual shape and failure mode of unstable rock.
With the rapid development of science and technology in related fields, intelligent equipment, such as unmanned aerial vehicles, and modern high technologies, such as image processing technology, have led to the growth of spatial data. The field of on-site investigation of unstable rock disasters can be further improved and optimized to improve the accuracy of data acquisition of research object models.
Although this study has conducted numerical analysis of the initial stress state, shear strain, and anchor support of unstable rock masses through numerical simulation software, the instability and failure of unstable rock masses are affected by many factors, and the failure process is highly random and complex. Due to the limitations of numerical simulation software, the use of numerical simulation to truly reflect the actual situation on the site still needs to be further improved. In the future, it can be further combined with the actual situation on the site and optimized numerical simulation methods to explore the instability and failure mechanism of rock slopes under complex conditions with multiple factors and conditions.
5 Conclusion
This study analyzed the commonly used rock slope stability evaluation methods. Through the geological survey of the rock slope in the study area, the complex geological conditions and geographical environment of the slope were analyzed, and the instability characteristics of the unstable rock monomer were studied. Four typical unstable rock monomer characteristic sections of W1, W2, W6, and W7 were selected for analysis. The slope was qualitatively analyzed by the stereographic projection method, and the safety factor of slope stability was calculated by the finite element strength reduction method. The numerical analysis model was constructed using FLAC3D software. The current stability of the unstable rock mass and the stability after the bolt support were simulated and analyzed.
Study results show that the stress field of unstable rock slope is obviously affected by topography, and the stress trace near the slope surface deflects with the slope shape. With the increase in depth, the influence of the slope shape on stress field decreases. The calculation results of the initial stress state of the rock slope are consistent with the theoretical understanding and field investigation. In the limit state before the implementation of bolt support, unstable rock masses are separated from the parent rock and slid downward to produce a large displacement. After the implementation of bolt support, unstable rock masses are not separated from the parent rock, and the displacement is small.
The stability of the rock slope was studied through coupling qualitative analysis and quantitative analysis, with an emphasis on simulation and comparison of rock slope stability before and after bolt support. The research results provide a digital idea for the stability analysis of the rock slope. It can be directly used for the risk assessment of actual slope prevention engineering. With the rapid development of modern high technology, rock slope stability analysis methods are becoming more and more abundant, and numerical simulation methods are becoming more and more perfect. Further research will focus on improving the accuracy of the survey data, optimizing stability evaluation methods and numerical simulation methods, and further exploring the instability and failure mechanism of the rock slope in complex situations.
Data availability statement
The original contributions presented in the study are included in the article/Supplementary Material; further inquiries can be directed to the corresponding author.
Author contributions
Conceptualization: RW, ZL, and WZ; investigation: SZ, DZ, and CM; writing—original draft: RW; writing—review and editing: TH, SX, and YX; supervision: ZL; funding acquisition: RW.
Funding
This research was funded by the Natural Science Foundation of Chongqing (No. cstc2021jcyj-bshX0028 to RW).
Acknowledgments
The authors would like to thank the reviewers and editor for their comments and suggestions.
Conflict of interest
Authors RW, ZL, TH, SX, YX, SZ, DZ, and CM were employed by Chongqing Chengtou Road and Bridge Administration Co., Ltd.
The remaining author declares that the research was conducted in the absence of any commercial or financial relationships that could be construed as a potential conflict of interest.
Publisher’s note
All claims expressed in this article are solely those of the authors and do not necessarily represent those of their affiliated organizations, or those of the publisher, the editors, and the reviewers. Any product that may be evaluated in this article, or claim that may be made by its manufacturer, is not guaranteed or endorsed by the publisher.
References
AlHomoud, A. S., and Tahtamoni, W. W. (2000). Saretl: An expert system for probabilistic displacement-based dynamic 3-D slope stability analysis and remediation of earthquake triggered landslides. Environ. Geol. 39, 849–874. doi:10.1007/s002549900097
Alimohammadlou, Y., Najafi, A., and Gokceoglu, C. (2014). Estimation of rainfall-induced landslides using ann and fuzzy clustering methods: A case study in saeen slope, Azerbaijan province, Iran. Catena 120, 149–162. doi:10.1016/j.catena.2014.04.009
Azarafza, M., Akgun, H., Ghazifard, A., and Asghari-Kaljahi, E. (2020). Key-block based analytical stability method for discontinuous rock slope subjected to toppling failure. Comput. Geotech. 124, 103620. doi:10.1016/j.compgeo.2020.103620
Azarafza, M., Asghari-Kaljahi, E., Ghazifard, A., and Akgun, H. (2021a). Application of fuzzy expert decision-making system for rock slope block-toppling modeling and assessment: A case study. Model. Earth Syst. Environ 7, 159–168. doi:10.1007/s40808-020-00877-9
Azarafza, M., Bonab, M. H., and Akgun, H. (2021b). Numerical analysis and stability assessment of complex secondary toppling failures: A case study for the south pars special zone. Geomech. Eng. 27, 481–495. doi:10.12989/gae.2021.27.5.481
Bai, B., Yuan, W., and Li, X. C. (2014). A new double reduction method for slope stability analysis. J. Cent. South Univ. 21, 1158–1164. doi:10.1007/s11771-014-2049-6
Bi, R. N., Ehret, D., Xiang, W., Rohn, J., Schleier, M., and Jiang, J. W. (2012). Landslide reliability analysis based on transfer coefficient method: A case study from three gorges reservoir. J. Earth Sci. 23, 187–198. doi:10.1007/s12583-012-0244-7
Chen, X. Y., Zhang, L. L., Chen, L. H., Li, X., and Liu, D. S. (2019). Slope stability analysis based on the Coupled Eulerian-Lagrangian finite element method. Bull. Eng. Geol. Environ. 78, 4451–4463. doi:10.1007/s10064-018-1413-4
Dadashzadeh, N., Duzgun, H. S. B., and Yesiloglu-Gultekin, N. (2017). Reliability-Based stability analysis of rock slopes using numerical analysis and response surface method. Rock Mech. Rock Eng. 50, 2119–2133. doi:10.1007/s00603-017-1206-2
Deng, Z. P., Li, D. Q., Qi, X. H., Cao, Z. J., and Phoon, K. K. (2017). Reliability evaluation of slope considering geological uncertainty and inherent variability of soil parameters. Comput. Geotech. 92, 121–131. doi:10.1016/j.compgeo.2017.07.020
Faramarzi, L., Zare, M., Azhari, A., and Tabaei, M. (2017). Assessment of rock slope stability at Cham-Shir Dam Power Plant pit using the limit equilibrium method and numerical modeling. Bull. Eng. Geol. Environ. 76, 783–794. doi:10.1007/s10064-016-0870-x
Gao, W. (2015). Stability analysis of rock slope based on an abstraction ant colony clustering algorithm. Environ. Earth Sci. 73, 7969–7982. doi:10.1007/s12665-014-3956-4
Hao, S. Y., Zhang, Q., Tian, S. F., and Mo, Y. B. (1995). Application research of expert system on stability analysis of rock slope. China J. Highw. Transp. 8, 9–13. doi:10.19721/j.cnki.1001-7372.1995.02.002
He, L., Tian, Q., Zhao, Z. Y., Zhao, X. B., Zhang, Q. B., and Zhao, J. (2018). Rock slope stability and stabilization analysis using the coupled DDA and FEM method: NDDA approach. Int. J. Geomech. 18, 04018044. doi:10.1061/(ASCE)GM.1943-5622.0001098
Hu, H. L., Gor, M., Moayedi, H., Osouli, A., and Foong, L. K. (2022). Slope stability analysis using black widow optimization hybridized with artificial neural network. Smart. Struct. Syst. 29, 523–533. doi:10.12989/sss.2022.29.4.523
Huang, C. C. (2013). Developing a new slice method for slope displacement analyses. Eng. Geol. 157, 39–47. doi:10.1016/j.enggeo.2013.01.018
Jiang, Q. H., Qi, Z. F., Wei, W., and Zhou, C. (2015). Stability assessment of a high rock slope by strength reduction finite element method. Bull. Eng. Geol. Environ. 74, 1153–1162. doi:10.1007/s10064-014-0698-1
Kincal, C. (2014). Application of two new stereographic projection techniques to slope stability problems. Int. J. Rock Mech. Min. Sci. 66, 136–150. doi:10.1016/j.ijrmms.2014.01.006
Li, D. Q., Qi, X. H., Cao, Z. J., Tang, X. S., Phoon, K. K., and Zhou, C. B. (2016). Evaluating slope stability uncertainty using coupled Markov chain. Comput. Geotech. 73, 72–82. doi:10.1016/j.compgeo.2015.11.021
Li, W. X., Qi, D. L., Zheng, S. F., Ren, J. C., Li, J. F., and Yin, X. (2015). Fuzzy mathematics model and its numerical method of stability analysis on rock slope of opencast metal mine. Appl. Math. Model 39, 1784–1793. doi:10.1016/j.apm.2014.10.006
Liu, B., and Yin, K. L. (2012). GIS-based landslide susceptibility mapping using infinite slope model for the new site of Badong County. China. Disaster Adv. 5, 1552–1557.
Liu, H. D., Xue, L., and Qi, M. (2007). The programmed design of engineering geological analogy method. J. North China Univ. Water Resour. Electr. Power (Natural Sci. Ed. 91, 62–64. doi:10.19760/j.ncwu.zk.2007.02.020
Liu, Y. (2022). Stability evaluation and mitigation measures of rockfall hazards in Guilin. Soil Eng. Found. 36, 508–513.
Meng, J. J., Mattsson, H., and Laue, J. (2021). Three-dimensional slope stability predictions using artificial neural networks. Int. J. Numer. Anal. Methods Geomech. 45, 1988–2000. doi:10.1002/nag.3252
Naghadehi, M. Z., Jimenez, R., KhaloKakaie, R., and Jalali, S. M. E. (2011). A probabilistic systems methodology to analyze the importance of factors affecting the stability of rock slopes. Eng. Geol. 118, 82–92. doi:10.1016/j.enggeo.2011.01.003
Nie, Z. B., Zhang, Z. H., and Zheng, H. (2019). Slope stability analysis using convergent strength reduction method. Eng. Anal. Bound. Elem. 108, 402–410. doi:10.1016/j.enganabound.2019.09.003
Ning, Y. J., An, X. M., and Ma, G. W. (2011). Footwall slope stability analysis with the numerical manifold method. J. Rock Mech. Min. Sci. 48, 964–975. doi:10.1016/j.ijrmms.2011.06.011
Ray, A., Kumar, V., Kumar, A., Rai, R., Khandelwal, M., and Singh, T. N. (2020). Stability prediction of Himalayan residual soil slope using artificial neural network. Nat. Hazards 103, 3523–3540. doi:10.1007/s11069-020-04141-2
Sheng, K., Hong, B. N., Liu, X., and Shan, H. (2021). Modified Bishop method for stability analysis of weakly sloped subgrade under centrifuge model test. Front. Struct. Civ. Eng. 15, 727–741. doi:10.1007/s11709-021-0730-z
Su, A. J., Feng, M. Q., Dong, S., Zou, Z. X., and Wang, J. G. (2022). Improved statically solvable slice method for slope stability analysis. J. Earth Sci. 33, 1190–1203. doi:10.1007/s12583-022-1631-3
Sun, S. W., Zhu, B. Z., and Bian, X. L. (2011). Strength reduction analysis for the stability of pile-slope system. Adv. Sci. Lett. 4, 3146–3150. doi:10.1166/asl.2011.1282
Tu, M. Z., Zhang, Z. X., and Ren, C. (2015). Highway slope stability analysis and protection methods overview. West. China Commun. Sci. Tech. 96, 1–6. doi:10.13282/j.cnki.wccst.2015.07.001
Wang, H. B., Zhang, B., Mei, G., and Xu, N. X. (2020a). A statistics-based discrete element modeling method coupled with the strength reduction method for the stability analysis of jointed rock slopes. Eng. Geol. 264, 105247. doi:10.1016/j.enggeo.2019.105247
Wang, L., Wu, C. Z., Tang, L. B., Zhang, W. G., Lacasse, S., Liu, H. L., et al. (2020b). Efficient reliability analysis of Earth dam slope stability using extreme gradient boosting method. Acta Geotech. 15, 3135–3150. doi:10.1007/s11440-020-00962-4
Wang, Z. J., and Lin, M. (2021). Finite element analysis method of slope stability based on fuzzy statistics. Earth Sci. Res. J. 25, 123–130. doi:10.15446/esrj.v25n1.93320
Wijesinghe, D. R., Dyson, A., You, G., Khandelwal, M., Song, C. M., and Ooi, E. T. (2022). Development of the scaled boundary finite element method for image-based slope stability analysis. Comput. Geotech. 143, 104586. doi:10.1016/j.compgeo.2021.104586
Xiao, L. L., Chai, B., and Yin, K. L. (2015). Rock slope stability evaluation in a steep-walled canyon: Application to elevator construction in the Yunlong River Valley, Enshi, China. Rock Mech. Rock Eng. 48, 1969–1980. doi:10.1007/s00603-014-0673-y
Xu, J. C., Liu, Y. T., and Ni, Y. D. (2019). Hierarchically weighted rough-set genetic algorithm of rock slope stability analysis in the freeze-thaw mountains. Environ. Earth Sci. 78, 227. doi:10.1007/s12665-019-8241-0
Xu, W. H., Kang, Y. F., Chen, L. C., Wang, L. Q., Qin, C. B., Zhang, L. T., et al. (2022). Dynamic assessment of slope stability based on multi-source monitoring data and ensemble learning approaches: A case study of jiuxianping landslide. Geol. J. doi:10.1002/gj.4605
Yang, Y. T., Wu, W. A., and Zheng, H. (2021). Stability analysis of slopes using the vector sum numerical manifold method. Bull. Eng. Geol. Environ. 80, 345–352. doi:10.1007/s10064-020-01903-x
Zai, D. Z., Pang, R., Xu, B., Fan, Q. Y., and Jing, M. Y. (2021). Slope system stability reliability analysis with multi-parameters using generalized probability density evolution method. Bull. Eng. Geol. Environ. 80, 8419–8431. doi:10.1007/s10064-021-02399-9
Zhan, Q. B., Sun, X. J., Li, C., Zhao, Y., Zhou, X., He, Y., et al. (2019). Stability analysis and reinforcement of a high-steep rock slope with faults: Numerical analysis and field monitoring. Adv. Civ. Eng. 2019, 1–8. doi:10.1155/2019/3732982
Zhang, G. L., and Xu, Z. (2019). Analysis of dangerous rock stability based on stereographic projection and finite element method. Eng. Constr. 51, 12–18. doi:10.13402/j.gcjs.2019.10.003
Zhang, W. G., Li, H. R., Han, L., Chen, L. L., and Wang, L. (2022). Slope stability prediction using ensemble learning techniques: A case study in yunyang county, chongqing, China. J. Rock Mech. Geotech. Eng. 14, 1089–1099. doi:10.1016/j.jrmge.2021.12.011
Zhang, W., Xiao, R., Shi, B., Zhu, H. H., and Sun, Y. J. (2019). Forecasting slope deformation field using correlated grey model updated with time correction factor and background value optimization. Eng. Geol. 260, 105215. doi:10.1016/j.enggeo.2019.105215
Keywords: stability analysis, rock slope, geological survey, stereographic projection method, FLAC3D, kinematic and numeric method
Citation: Wu R, Li Z, Zhang W, Hu T, Xiao S, Xiao Y, Zhang S, Zhang D and Ming C (2023) Stability analysis of rock slope under Sujiaba overpass in Chongqing City based on kinematic and numeric methods. Front. Earth Sci. 11:1181949. doi: 10.3389/feart.2023.1181949
Received: 08 March 2023; Accepted: 28 March 2023;
Published: 11 April 2023.
Edited by:
Hong-Hu Zhu, Nanjing University, ChinaReviewed by:
Mohammad Azarafza, University of Tabriz, IranHuafu Pei, Dalian University of Technology, China
Copyright © 2023 Wu, Li, Zhang, Hu, Xiao, Xiao, Zhang, Zhang and Ming. This is an open-access article distributed under the terms of the Creative Commons Attribution License (CC BY). The use, distribution or reproduction in other forums is permitted, provided the original author(s) and the copyright owner(s) are credited and that the original publication in this journal is cited, in accordance with accepted academic practice. No use, distribution or reproduction is permitted which does not comply with these terms.
*Correspondence: Renjie Wu, d3JlZ2dpZUBzaW5hLmNvbQ==
 Renjie Wu
 Zheng Li2
 Wengang Zhang
