 Cristian Farías1*
 Jonathan Lazo2Daniel Basualto 3Marcela Saavedra1
 Felipe Muñoz-Quiroz1Lucas Zúñiga-Urrea1
 Rodrigo Martínez-Bravo1Ian Huentenao-Inostroza1Ramón Sáez-Opazo1
- 1Departamento de Obras Civiles y Geología, Universidad Católica de Temuco, Temuco, Chile
- 2Departamento de Ciencias Físicas, Universidad de La Frontera, Temuco, Chile
- 3Dirección de Investigación, CIVUR-39°: Centro Interactivo Vulcanológico de la Araucanía, Universidad de La Frontera, Temuco, Chile
Volcanoes can enter in episodes of unrest, which might end later in an eruption, with little warning. They are normally produced due to the inner dynamics of the volcano, but can also be triggered by external earthquakes. To detect these periods early, it becomes crucial to understand the dynamics of the different structures (such as fault systems) of the volcano, as they can act as magma pathways and can also generate instabilities on it. In this article we study the seismicity of Copahue (central-south Chile), which sits atop a complex system of faults, and was importantly affected by the 2010 Mw 8.8 Maule earthquake. We focused ourselves in the temporal variations of the b-value of the Gutenberg-Richter law during the 2012–2022 period. During this timeframe the volcano had a series of crises, which led to seven eruptive phases. Our results show that the system does exhibit signs of a future unrest phase weeks to months before there is a change on its alert level, and they are mostly linked to the activity of a N-S fault zone, located not beneath the main crater of Copahue, but around 10 km to the East. Most of the crises start after drops in the b-value of this structure, with sudden variations in b-value being also noticeable as a response to the 2015 Mw 8.3 Illapel earthquake. Our results show a correlation between instances of fluid injection and release in the relevant structures of an active volcano with the variations of the b-value. This allow us to use the temporal variations of the b-value as a tool to anticipate the inner dynamics of the system, particularly when there is a strong structural control on it, such as in the case of Copahue. We also found out that the influence of the 2010 Mw 8.8 Maule earthquake was long-lived, affecting mostly the structures that later destabilized the volcano for the most part of a decade, therefore enhancing magma injection into the whole system. This seems to have changed since 2021, which might indicate a waning in the influence of the megathrust earthquake in Copahue volcano.
1 Introduction
Volcanic eruptions are one of the most hazardous natural phenomena in the world, with a wide range of styles and sizes. Given that more than 8% of the 2015 world’s population lives within 100 km of a volcano with at least one significant eruption, and more than 1 billion people (14.3%) lives within 100 km of a Holocene volcano, (Freire et al., 2019), it is important to understand how an episode of volcanic unrest unveils. Such an epidose does not necessarily ends up in an eruption, but it is a requirement for that. Therefore, its early detection is of the most importance, particularly because volcanoes tend to show some characteristics of complex systems, such as that a volcano in two very similar states can finish in two very different scenarios (Sparks, 2003). In addition, volcanoes also can be very sensitive to external perturbations, such as external earthquakes, with a wide range of potential responses, going from small changes in seismicity to periods of calm, and in the most extreme cases, instabilities that end up in eruptions (Manga and Brodsky, 2006; Bonali et al., 2013; Seropian et al., 2021). Recent research has shown that the geometry of local fault systems is very important in modulating the response of the volcanoes to external earthquakes, which is consistent with the notion that faults can serve as fluid pathways (Farías et al., 2017), and are therefore fundamental in establishing the dynamic state of a volcano (Eggert and Walter, 2009; Pritchard et al., 2013). All this makes it extremely important to look up for subtle signals that might indicate changes in the dynamics of volcanic systems, which can help to get an early detection of volcanic unrest.
Because eruptions can begin with little to no warning, and considering that a volcano can be in an unrest phase for months before an eruption, the study of volcano seismicity is crucial, as it can provide a large insight on the dynamics of the fluids and faults that compose a volcanic system (Gudmundsson, 2011; McNutt and Roman, 2015; Roman and Cashman, 2018). Because of the strengthening of seismic networks around active volcanoes, we now have more data than at any moment in history to try to see in detail the dynamic changes in a volcano (Farías and Basualto, 2020). In particular, one of the most common events that are captured in a volcanic setting are Volcano-Tectonic (VT) events, which tend to be characterized by clear onsets of P- and S-waves in a seismogram, with a relatively high (
Thus, looking at the activity of fault systems that are close to volcanoes is important since it can give us an idea of how a volcano gets unstable, to then enter into a period of unrest. Regularly, the study of earthquakes in these faults is carried out by analyzing event locations, focal mechanisms, and event rate in time (Cardona et al., 2021). But VT events do also fulfill Gutenberg-Richter law (Gutenberg and Richter, 1944), although with a narrower magnitude range than what we would expect in a non-volcanic tectonic setting, like a subduction margin, for example, (Schorlemmer et al., 2005). Because of this feature, we can complement any analysis of VT activity by looking at the b-value of the Gutenberg-Richter law. This value has been suggested to provide an insight on the stress state of a region (Scholz, 2015), and it has been widely used in tectonic settings, but not so much in volcanic ones because of the limited magnitude range of the VT events (usually with magnitudes less than 5) (Jacobs and McNutt, 2010; Nishimura et al., 2016). However, there are a number of studies that studied the stress state in volcanic systems in places like Mexico (Rodríguez-Pérez et al., 2021), Japan (Chiba and Shimizu, 2018), and Indonesia (Sukrisna et al., 2013), by looking at this value in the distribution of VT earthquakes. Recently, the temporal evolution of this value has been applied in the study of the rare rhyolitic eruption of Cordón Caulle, Chile, in 2011, showing the potential of using the analysis of this variable to get an insight into the state of a volcano before an eruption (Basualto et al., 2023).
Central-South Chile is one of the very good regions of the world where we can look up to the dynamics of complex volcanic systems, because of the presence of active volcanoes with a large output of VT earthquakes, that have also shown responses to large earthquakes in the past (Bonali, 2013; Farías et al., 2014). This characteristic suggests that a number of these active volcanoes have undergone changes in their stress state over time, and therefore are good candidates for the study of the dynamic evolution of their seismicity. Copahue volcano (37.85oS - 71.04oW) is one of these volcanoes. It is one of the three volcanoes with the most eruptive phases in Chile since the 2010 Mw 8.8 Maule earthquake (the other ones being Planchón-Peteroa and Nevados de Chillán). It usually produces a large number of VT events, and it has shown an interesting reaction to the 2015 Mw 8.3 Illapel earthquake, with an eruption 17 days after the mainshock (Farías and Basualto, 2020). All this comes to show that this volcano is a good candidate for analyzing its VT seismicity, looking for subtle changes before and after moments of crisis.
The central-south chilean (33oS-46oS) margin is dominated by the fast (∼66 mm/yr) oblique subduction between the Nazca and South American plates (Ruiz and Madariaga, 2018), which has enhanced the occurrence of several megathrust earthquakes, such as the 1960 Mw 9.5 Great Southern Chile and the 2010 Mw 8.8 Maule earthquakes (Ruiz and Madariaga, 2018). In this region there is a large number of active volcanoes, which concentrate most of the volcanic activity in Chile in historical times (Stern, 2004). Around 37oS there is a transition in the tectonic regime, particularly in the volcanic arc, which is evidenced by the presence of the Liquiñe-Ofqui Fault System (LOFS, 37o-47oS), which is a 1.200 km long NNE strike-slip intra-arc fault system, active since Miocene (Cembrano et al., 2000). The LOFS consists of subparallel NNE fault strands distributed across the axis of the Andean Main Cordillera with maximum lengths of branches of ∼60 km (Maldonado et al., 2021). The LOFS is characterized by a right lateral strike-slip regime that also controls the Quaternary volcanism (Cembrano et al., 2000; Cembrano Perasso and Lara, 2009). Shallow seismic activity has been documented along the LOFS (Haberland et al., 2006; Lange et al., 2008; Legrand et al., 2011; Sielfeld et al., 2019) and focal mechanism of main earthquakes can be attributable to right lateral NNE-striking fault-slip (e.g., a Mw 5.3 close to Lonquimay in 1989, a Mw 5.5 south of Callaqui volcano in December 2006, and a Mw 4.7 north of Choshuenco volcano in February 2021, http://www.globalctm.org). Astudillo-Sotomayor et al. (2021) estimated a slip rate of 18.8 ± 2.0 mm/year over the past 9.0 ± 0.1 ka for a single strand of the LOFS located 13 km west to Reigolil-Pirehueico fault, confirming that this first order active structure. The trace of the LOFZ is locally interrupted by the Andean Transverse Fault System [ATFS] (Cembrano Perasso and Lara, 2009; Sánchez et al., 2013; Maldonado et al., 2021), a NW-WNW striking arc-oblique long-lived basement fault system linked to pre-Andean crustal weakness zone associated with Permian-Triassic tectonics (Piquer et al., 2021). The nature and kinematics of the ATFS are not well constrained; however, available field and seismic data indicate that some of their branches are active showing mainly left lateral strike–slip kinematics during the interseismic phase of the subduction seismic cycle (Haberland et al., 2006; Lange et al., 2008; Sielfeld et al., 2019) and normal kinematics during the coseismic phase (Aron et al., 2015; Sielfeld et al., 2019).
The Caviahue-Copahue Volcanic Complex [CCVC] is a basaltic-andesitic volcano located in the Central Southern Chile Volcanic Zone (CSVZ, 37–41.5o S) (Stern, 2004). This volcano is located at the northern end of the LOFS (37.5oS and 71oW), in the Chile-Argentina border. In this complex tectonic setting, a transtensional-NE transfer zone has been developed, linking the NNE LOFS with the NS inverse Copahue-Antiñir Fault Zone [CAFZ] (Folguera et al., 2015; Sielfeld et al., 2017). This transtensional-NE structure is conformed by the Callaqui-Copahue-Mandolegüe volcanic lineament. The CCVC is composed of the Caviahue caldera and the Copahue stratovolcano. The Caviahue caldera is a square-shaped depression of ca. 20 km × 15 km, defined as a pull-apart intra-arc basin due to the NE-transition zone between LOFS and the CAFZ (Melnick et al., 2006). The Copahue’s stratovolcano and the syn/post glacial eruptive centers are aligned in a NE direction (Figure 1), parallel of a sub-horizontal maximum compressive stress σ1 (Bonali, 2013), suggesting the existence of a potential extensional structure that might enhance the magmatic intrusions during the Holocene. The volcanic activity began 1 Ma ago; however, in the Upper Pleistocene, volcanic activity has consisted mainly of andesitic to trachydacitic lava flows (Linares et al., 1999), in contrast with the basaltic-andesitic products that have been erupted in more recent times. The Copahue geothermal system has been developed at the northeastern part of the Copahue volcano (Figure 1). It mainly extends over the Copahue Village Fault System, composed of a set of extensional No60 striking faults developed in a structural block between the Trolope and Chancho-có WNW striking faults (Barcelona et al., 2019; Barcelona et al., 2020; Tardani et al., 2021). This fault architecture (NE and WNW-striking faults) and the complex interaction between them seems to control the permeability and pathways of the hydrothermal fluids/meteoric water and the magma storage beneath the Caviahue Caldera (Barcelona et al., 2019). Lundgren et al. (2017) using InSAR process suggest two different magmatic chambers (Figure 2), and later Tardani et al. (2021) proposed the presence of independent hydrothermal systems, using trace elements measured in water hot springs. Both are located along the NE lineament, the shallower (centered at 2.5 km) is located in the north flank of Copahue volcano, and the second, deeper (centered at 7 km), between Chancho-co and Trolope fault.
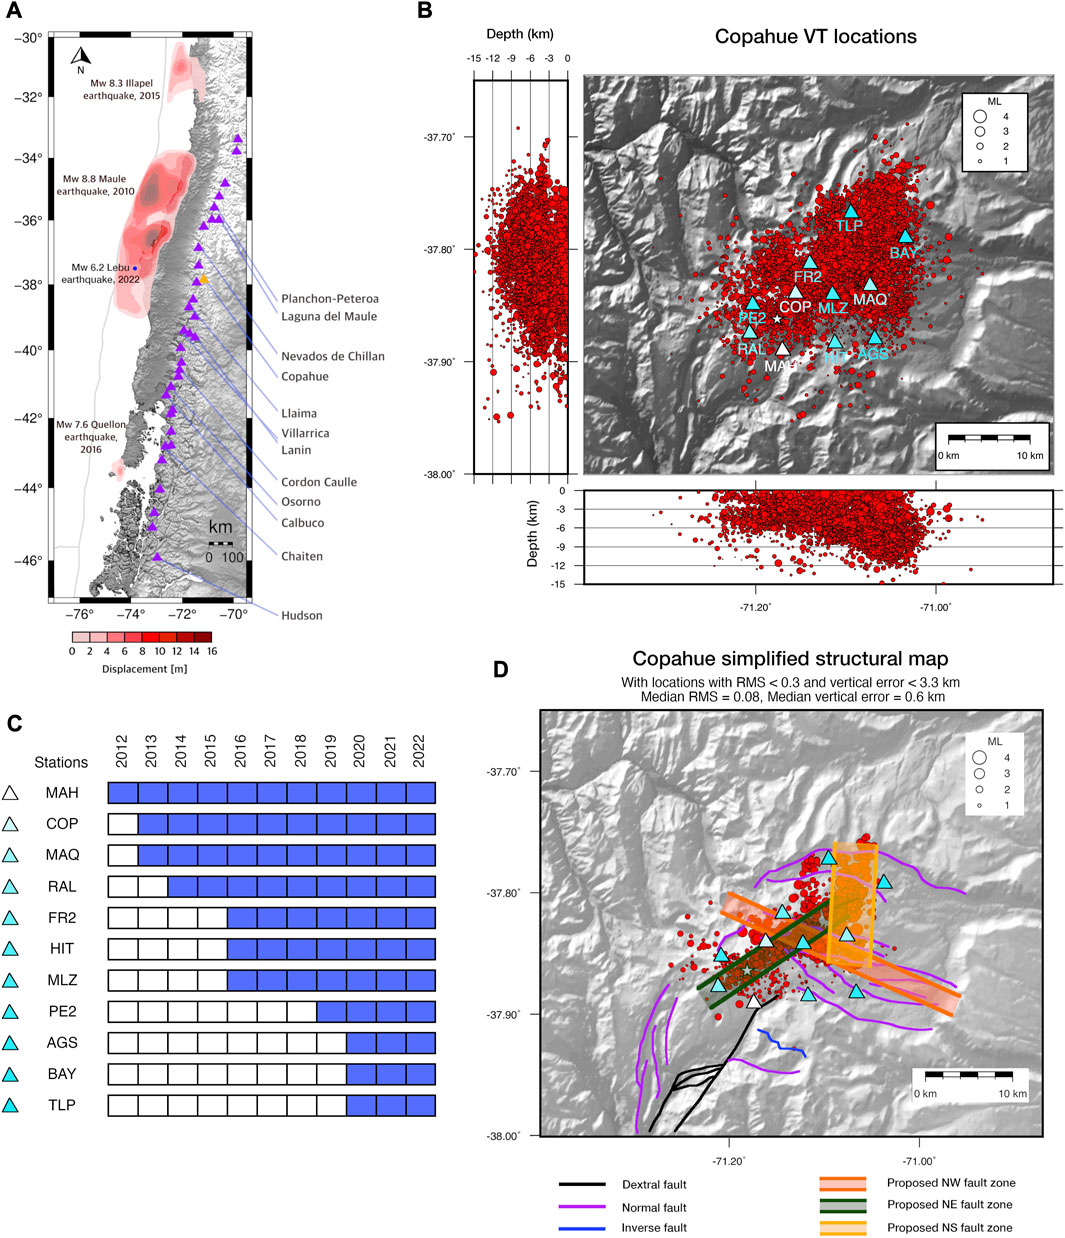
FIGURE 1. Setting of Copahue volcano-Caviahue caldera. (A) shows Central-south Chile, with the location of Copahue volcano in orange, also showing the rupture zones of the more relevant earthquakes in this zone since 2010. (B) shows the location of all locatable Volcano-Tectonic (VT) earthquakes in the Copahue volcano-Caviahue Caldera system from 2012 up to 2022, including this last year. OVDAS stations are shown in large triangles here. (C) shows the operation times of the stations. (D) shows a simplified structural sketch of the system, along with the epicentral distribution of the best located VT events and the seismological stations (as large triangles). Black, purple, and blue lines indicate dextral, normal, and inverse faults respectively, based on the description of (Tardani et al., 2021). Transparent dark orange, dark green, and dark yellow regions show the main fault zones of the system we propose in this study, suggested from the distribution of the seismicity.
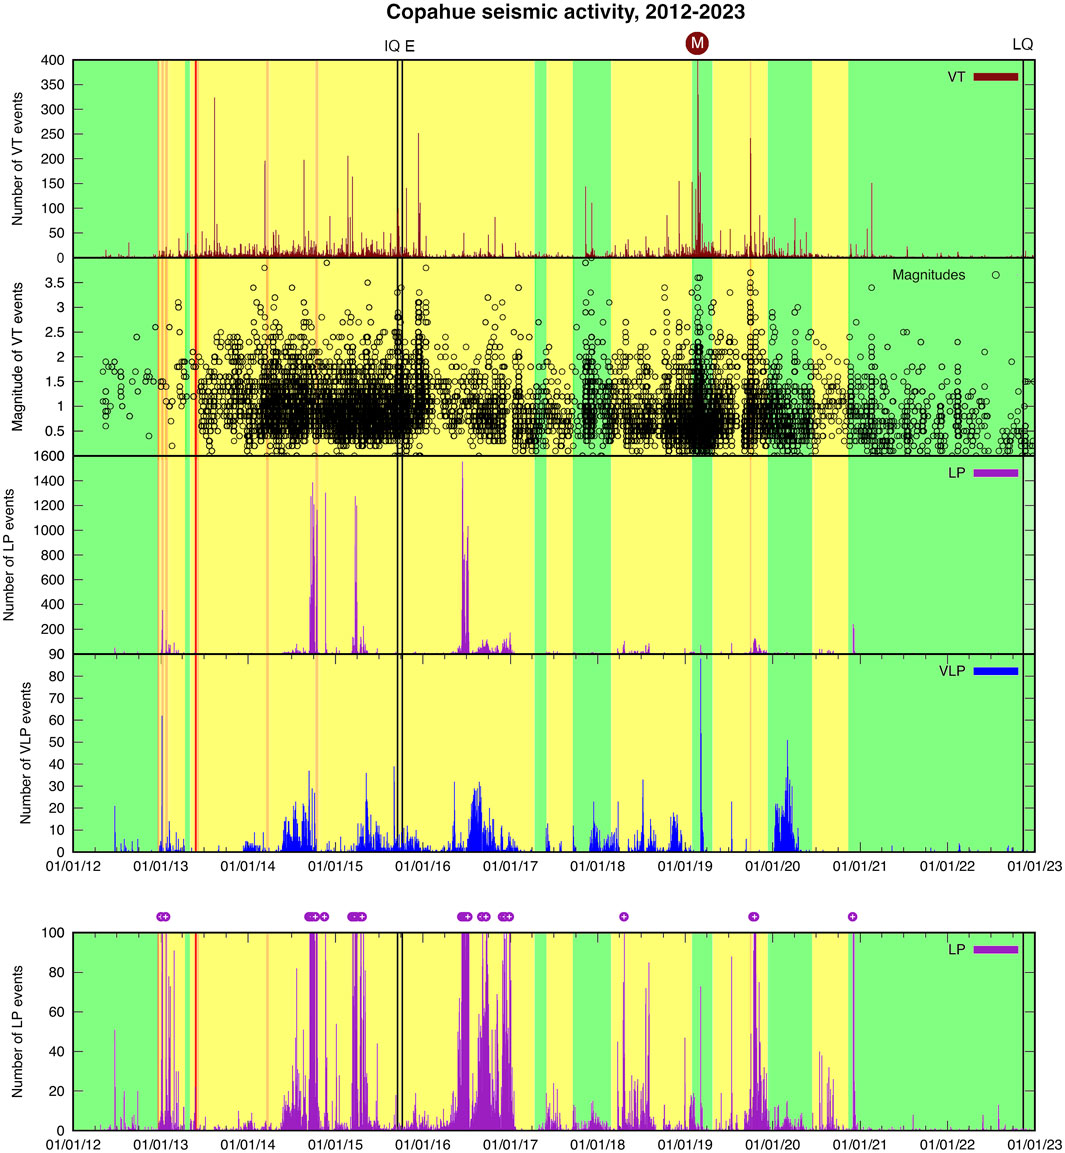
FIGURE 2. Temporal evolution of seismicity at Copahue volcano and Caviahue caldera, with the alert levels by OVDAS as background colors, in the 2012–2022 period, including this year. From top to bottom: number of all VT events per day, magnitudes of the located VT events in time, number of LP events per day, number of daily VLP events, and a closeup in the y-axis of the count of LP events per day, to show more in detail the background LP activity. Black line with the “IQ” tag shows the date of occurrence of the 2015 Mw 8.3 Illapel earthquake. Black line with the “E” tag marks the moment on which there was a new eruption following that earthquake. Black line with the “LQ” tag marks the date of occurrence of the Mw 6.2 2022 Lebu earthquake, which was followed by a small increase in released seismic energy. The circle with the white capital “M” letter indicates that during that day the number of VT events was larger than 400, with 708 VT earthquakes being recorded then. The purple bullet points with a white cross inside (bottom panel) mark the instances on which the daily LP count was larger than 100 events.
The Copahue volcano has also shown an interesting behavior to large megathrust earthquakes from the far field. The 2012 eruption, which started a series of periods of unrest and mild new eruptions which lasted for 9 years (Global Volcanism Program, 2023), has been proposed to be promoted by the static changes in the stress tensor due to the 2010 Mw 8.8 Maule earthquake (Bonali, 2013; Bonali et al., 2013), which led to the occurrence of unclamping in magma pathways. In addition to this case, the Copahue volcano had a new eruption in October 2015, only 17 days after the occurrence of the 2015 Mw 8.3 Illapel earthquake, located more than 650 km away. In this case, Farías and Basualto (2020) proposed that dynamic changes in the stress tensor due to the passage of the seismic waves created openings in the intersection between the N-S fault from the north-east side of the Caviahue caldera and the NE faults that seem to pass beneath the volcano, which later increased the permeability of these structures, which acted as magma pathways, generating a swarm of local earthquakes which ended with the new eruption. All this points out to Copahue as a very sensitive system to external perturbations, such as megathrust earthquakes.
This article is focused on the seismicity of Copahue volcano, in central-south Chile, with a special focus on the variations of the b-value of its seismicity, looking for indicator of variations on the stress state of the system before, during, and after periods of crisis, in the 2012–2022 period. Since the start of its monitoring, in 2012, the volcano has had 12 periods of yellow alert, 9 periods of orange alert, and 2 periods of red alert, according to the four step definition of OVDAS-Sernageomin (with alerts going, from less dangerous to the most, green, yellow, orange, and red). We will analyze these variations in space and time, with the aim of obtaining early indicators of unrest episodes.
2 Materials and methods
To account for the changes in the dynamics of Copahue volcano, we used data from the monitoring network of OVDAS (Figure 1). The network currently involves 11 seismic stations located around the Copahue volcano. Data we present in this article was recorded during a timeframe of 11 years, from January 2012, to December 2022. The OVDAS permanent seismological network around Copahue volcano has changed over time, and since 2020 is composed of 11 broadband seismometers. The last three stations that were added into the network were installed by Argentina’s OAVV in 2020. Table 1 shows the details of each station, including location details and the year since they have been operating.
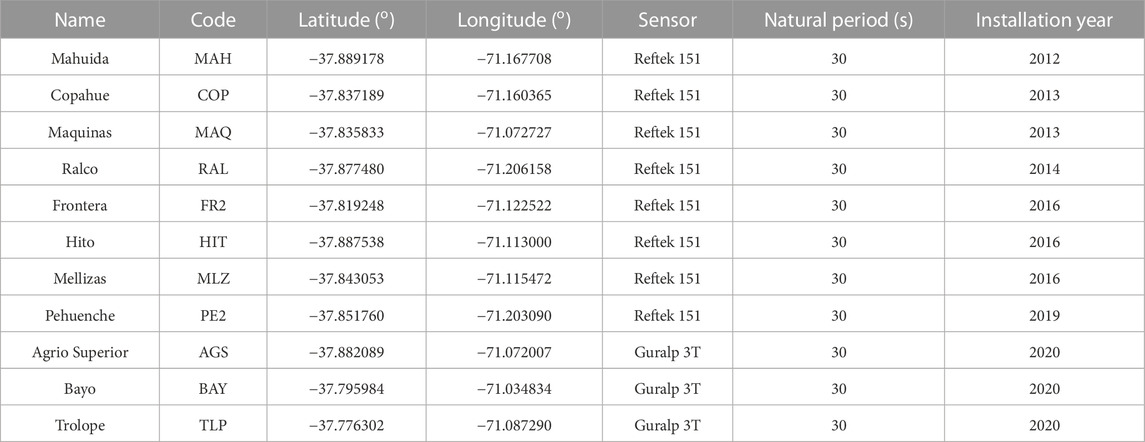
TABLE 1. Details of the OVDAS seismic stations used in this study, including the timing of operation. All stations started their recordings in the indicated year, and have been online since.
Primary analysis was carried out by OVDAS personnel, who identified individual seismic events from the continuous signal and extracted the basic information for each of them. The HYPO71 routine was used to obtain the hypocentral location of the Volcano-tectonic (VT) events (Wassermann, 2012), with the 1-D velocity model shown in Supplementary Table S1. The reference level, which is where zero depth is defined, is at 2,500 m over the sea level. Each location is cataloged by a quality letter, which is assigned following the levels of statistical error on each location, following the method of Lahr (1999). In that regard there are four categories in the OVDAS catalog, from A to D, with A being the highest and most reliable. In the Copahue catalog we have categories A, B, and C. Categories A and B have a well constrained depth, with errors lower than 3.3 km, and with 90% of the events of this subset having vertical location errors lower than 1.1 km. This is not the case for category C, although the magnitude value is still reliable, as most of the earthquakes have depths lower than 10 km from the reference height at 2,500 m over the sea level, and are close to the seismic stations, which allows a reliable estimation of their magnitude.
Long Period (LP) and Very Long Period (VLP) events, linked with the fluid dynamics of the system, were also classified and cataloged (Kumagai and Chouet, 1999; McNutt and Roman, 2015). Instances of anomalous volcanic activity have been reported by OVDAS since May 2012 in different official reports (Reportes de actividad volcánica [RAV] and Reportes Especiales de Actividad Volcánica [REAV]; https://rnvv.sernageomin.cl/volcan-copahue/), on which this observatory has summarized the different states of alert related to the different types of unusual activity that the volcano has evidenced over the last decade. There are four alert levels of activity on each volcano in the OVDAS classification: green alert, when the volcano is on its base state; yellow alert, when there is a sign of unrest, which may include minor explosions in the main crater of a volcano; orange alert, when the volcano is in a more altered state than it was during a yellow alert; and red alert, when a major eruption is about to occur in the volcano imminently, or when this eruption is in course (OVDAS, https://www.sernageomin.cl/abc/doc/Alerta_Volcanica.pdf).
To follow the temporal dynamic behavior of the Copahue volcano-Caviahue caldera system we focused ourselves in retrieving the temporal evolution of the distribution of events in a timewindow, by the means of the Gutenber Richter law, which states
where N is the number of earthquakes greater or equal to magnitude M, and a, b are the constants (Gutenberg and Richter, 1944). More specifically, we focus on the value of the b parameter, or b-value, which has been proposed to function as an indicator of the stress state in several systems (Schorlemmer et al., 2005). The calculation of the b-value has been extensively used in the study of earthquake sequences in mostly tectonic settings, and not so much on volcanic systems, mainly because of the relatively low range of magnitudes of the seismicity we can record in a volcano, compared with what can be captured in tectonic settings. This problem is reflected in the completeness magnitude of the catalog, which is often difficult to find in volcanic settings, and therefore creates unreliable b-values. Nevertheless, recently van der Elst (2021) developed a new method for the estimation of the b-value, which is insensitive to transient changes in catalog completeness, which allow us to obtain reliable values of b, regardless of the completeness magnitude of the catalog. This method is called “b-positive,” and is based on the positive-only subset of the differences in magnitude between successive earthquakes. Using this method, we calculated the temporal b-value of the VT seismicity that was located within the Copahue volcano and its surroundings, including the Caviahue caldera. With a total of 11,912 located events, we have a dataset that is large enough to calculate the temporal variations of the b-value in a reliable way. For this, we used a moving window of 160 events, with an overlapping of 92.5%. The size of this moving window is not far from what other studies have used with the b-positive method to study temporal variations on the b-value (e.g., Neves et al., 2022), and allowed us to have a reliable estimation of both the b-value and its short-term temporal variations.
Since the Copahue volcano-Caviahue caldera system includes a complex system of faults, we need to analyze individually the different important zones of the volcano in terms of its dynamics, with the aim of understanding what is the role that the structures play in destabilizing the volcano, so we can divide our domain accordingly afterwards. To do this, we look at the spatial density of VT events, the spatial distribution of their depths, and the spatial distribution of the cumulative seismic energy released. We calculated the seismic energy released by a particular event following the method of Tobyáš and Mittag (1991), which states log10(E) = 1.2 + 2.0Ml, with Ml the local magnitude of the catalog. We then calculated the total released energy in a window of 0.01o × 0.01o in latitude times longitude, in order to obtain a map of the total energy released in the Copahue-Caviahue caldera system. Since the numbers involved here have a large variation, we calculated log10 of the total energy released on each window, for better visualization. In this line, we also calculated the average depth of all the VT events on the windows described before, using the events with RMS values lower than 0.3 and depth errors lower than 3.3 km. The median of the RMS and vertical location error of this subset of events were 0.08 and 0.6 km, respectively. We then compared these results with the reported structural geology context at the region to obtain a separation of the whole system in smaller regions of interest.
After dividing the whole dataset in regions, we followed the temporal variations of the b-value and the average depth on each region, with the same moving window described above. Given that we have enough data in this window to carry out reliable statistical analysis, we use the data from the whole catalog here. Finally, for the interpretation of the resulting time-series, we will consider that low/high b-values are characteristic of tectonic settings dominated by reverse/normal or strike-slip faulting (Schorlemmer et al., 2005; Scholz, 2015) and how these faults promote the transit of thermal fluids or the rise of magmas (Roberts et al., 2015; Konstantinou, 2022).
Finally, in order to assess the influence of the 2010 Mw 8.8 Maule earthquake in the system, we calculated the static stress transfer produced by it. We did this by using the equations by Okada (1992), which calculates the deformations produced by dislocations in a halfspace. For this, we used the slip distribution of the Maule earthquake reported by the USGS (https://earthquake.usgs.gov/earthquakes/eventpage/official20100227063411530_30/executive) as our source.
3 Results
3.1 Global overview the activity at Copahue in the 2012–2022 period
The seismic activity of Copahue volcano is composed mainly of Volcano-Tectonic (VT), Long-Period (LP), and Very Long Period (VLP) events. Both LP and VLP events are related to fluid dynamics, with the latter being associated with processes that can lead to eruptions in andesitic magmas, or with unsteady hydrothermal fluid flow in cracks (Waite, 2021), while VT seismicity is produced by brittle fractures in the area beneath and surrounding the volcanic system, triggered by stress changes that can be produced by a large number of mechanisms, including the dynamics of faults hosted in the crust below and around the volcano. Figure 2 shows the daily count of each one of them in time, with the different alert levels from OVDAS, for the 2012–2022 period. We can see how the different types of events tend to be clustered in time. This is particularly true for the occurrence of LP events, reaching more than 1,000 events per day on some occasions.
During this timeframe of 11 years, Copahue volcano underwent a series of crises, which are reflected in the changes on the alert levels (see Figure 2). Following the reports of OVDAS, we can see that most of the increases in the alert level occurs after the occurrence of a large number of either VT and/or LP and VLP events in a relatively short period of time, or after periods of increase in the tremor signal, and/or instances of explosions at the level of the crater. Table 2 shows the details of each increase in alert level during the 11-year period of this study, adding the details of responses from Copahue to external earthquakes.
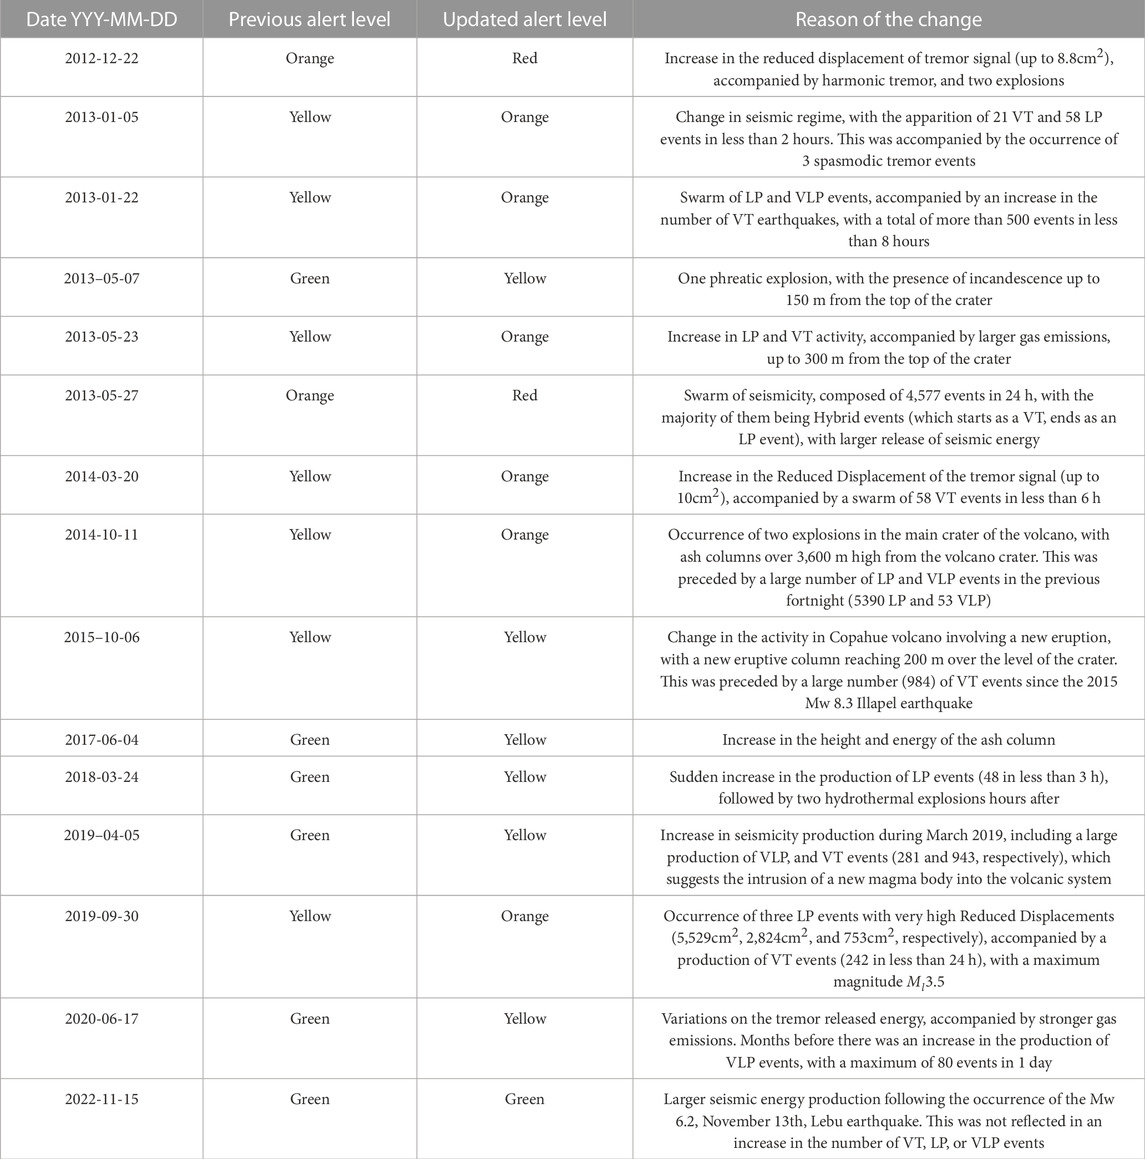
TABLE 2. Summary of the increases in alert levels, based on the reports by OVDAS. We also mark the occurrence of relevant tectonic earthquakes (2015 Mw 8.3 Illapel and 2022 Mw 6.2 Lebu events).
Given that there is a complex structural control in Copahue volcano, we can see a rather heterogeneous spatial distribution of VT earthquakes. Figure 1B) shows the epicentral distribution of all VT events that were located by OVDAS in the 2012–2022 period. The total number of detected events was 22,004 in this timeframe, with 11,912 being localized. From here on we will study this last subset, as there is a magnitude calculated for their members. These events are located not only beneath the volcanic edifice, but also in the Caviahue caldera, and to the north of the volcano. We can see the presence of several clusters of seismicity, and a global trend that seems to follow the geometry of the main faults of the system, in particular with the horsetail splay faults of the Liquiñe-Ofqui Fault System (LOFS).
Due to the large number of events, and in particular after taking into account that most of the seismic activity is located outside the volcanic edifice, we focus ourselves in the distribution of this seismicity in space and time, as VT earthquakes can provide us with crucial information about the stress state of the system, and about which are the most likely magma pathways.
Figure 3 shows the temporal variation of both the b-value and the average depth of the seismicity within each window. We also calculated the b-value of the complete catalog, obtaining b = 1.0 ± 0.1, with a R2 value of 0.95, which indicates a very high level of confidence in this estimation. Although this number is what is considered to be representative of the dynamics in a tectonic setting, and not in a volcanic one, we can see that the temporal variations are important, and occur in both short and long periods of time. In particular, it is interesting to notice that there are several instances where the b-values drop before the beginning of a new volcanic crisis, marked by a yellow and/or an orange alert. We can also see a series of changes in regimes, from b-values lower than 1, which would indicate a high level of differential stress, enhancing the opening of cracks and/or structures, which later can promote fluid motion through these structures; to b-values larger than 1, that can indicate periods fluid injection, where the occurrence of low-magnitude earthquakes dominate the catalog. Following the green alert level that started in November 2020 we can see that both the b-values and the average depths did stabilize in time, with values close to the global averages (b = 1.0 ± 0.1, d = 4.8 ± 0.9 km).
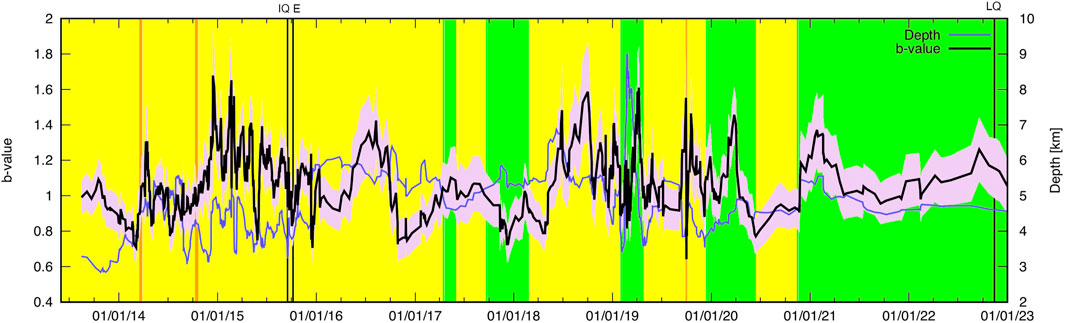
FIGURE 3. Variation of b-value (black line) and average depth (blue line) of the VT seismicity at the Copahue volcano-Caviahue caldera system, from August 2013, until December 2022, including this last month. Alert levels are marked following the color code by OVDAS, and black lines indicate the occurrence of the 2015 Mw 8.3 Illapel earthquake (IQ), the eruption in Copahue volcano that followed (E), and the occurrence of the 2022 Mw 6.2 Lebu earthquake. Statistical errors in the b-value calculation are shown as a pink strip.
3.2 Regions of interest
Since the variations of b-value and average depth presented in Figure 3 are very noticeable, and considering that the seismicity in this volcanic system involves not only the volcano area, but also its surroundings (Figure 1), we analyzed the spatial distribution of the number density of events, the depth of the better located earthquakes (RMS
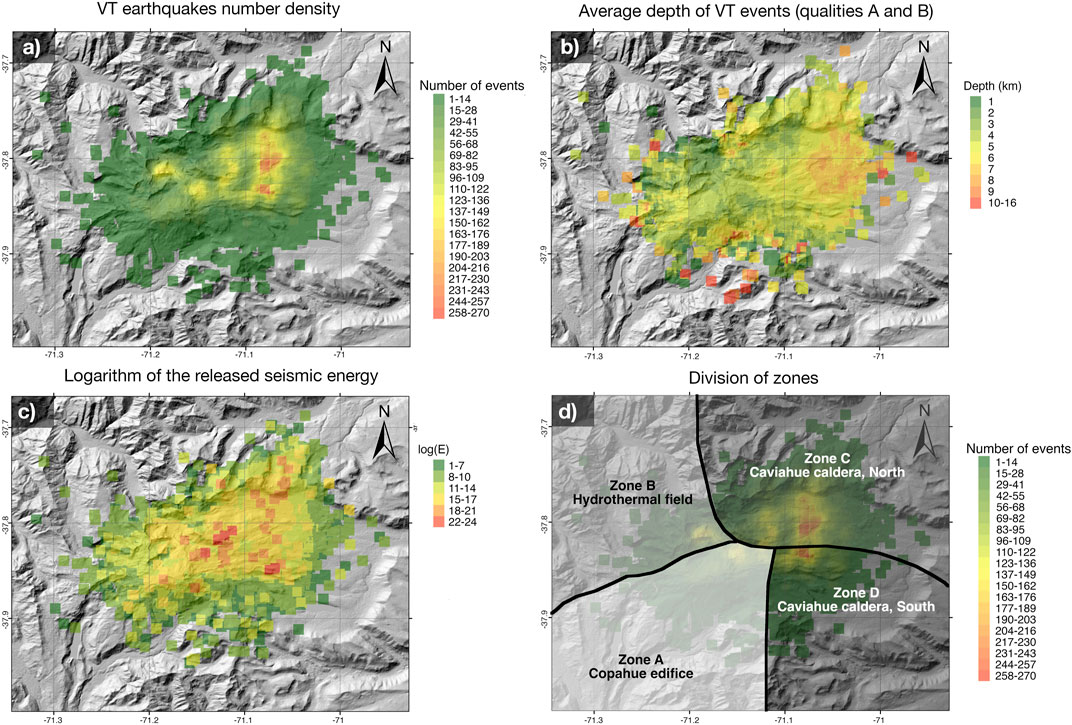
FIGURE 4. Spatial distribution of the number density of VT earthquakes (A), average depth of VT events (B), and log(E), with E the released cumulative energy (C). (D) shows the distribution of the four zones on which we divided our domain in this study. All plots were obtained using the data from 2012 to 2022, including that year. Calculations for number density and released energy were carried out with the whole dataset, whilst the calculations for average depth were performed using only the events with A and B location quality.
The first zone also contains the spot where Lundgren et al. (2017) found a strong deformation prior to the 2012 eruption onset. The third zone identified here contains more than one cluster of seismicity, and therefore could be divided into two parts. However, the structures that have been identified in this region point out that there are two main fault systems here: a series of NE faults, and a NS fault zone which then connects with the Copahue–Antiñir fault system [CAFS]. Therefore, we can consider this to be a microsystem on itself, with the NS fault zone intersecting the NE ones. This is partially supported by the average depth distribution, which shows a different behavior of the northern part of the Caviahue caldera respective to the southern one. The former has significantly deeper seismicity than the latter, and it seems to be delimited by the presence of the horsetail splay faults proper of the northern limit of the LOFS. Seismicity gets shallower as we move into the west in this zone, connecting with another portion of the space with relatively deep seismicity, which seems to mark some form of natural limit on the western side of the Caviahue caldera. This idea of dividing the domain in four regions seems to be in agreement with where the higher values of released energy are, and we will therefore divide our domain in the zones described in Figure 4D).
3.3 Temporal analysis of b-values
We divided our domain in four main zones, as shown in Figure 4, and we followed both the b-value and the average depth of the VT seismicity on each zone. Figure 5 shows the whole evolution of these quantities, along with the count of daily LP and VLP events as a reference, accompanied by the alert levels of the volcano decreed by OVDAS-Sernageomin. Due to this window size, which was selected to guarantee stable results on the b-value calculation, we cannot get a value for the parameter b on each zone before the year 2014. From then on we can see strong variations of the b-values over time on each zone, both in the long and the short term, as well as changes in the average depth of the seismicity of each zone during the window on which we calculated the b-value.
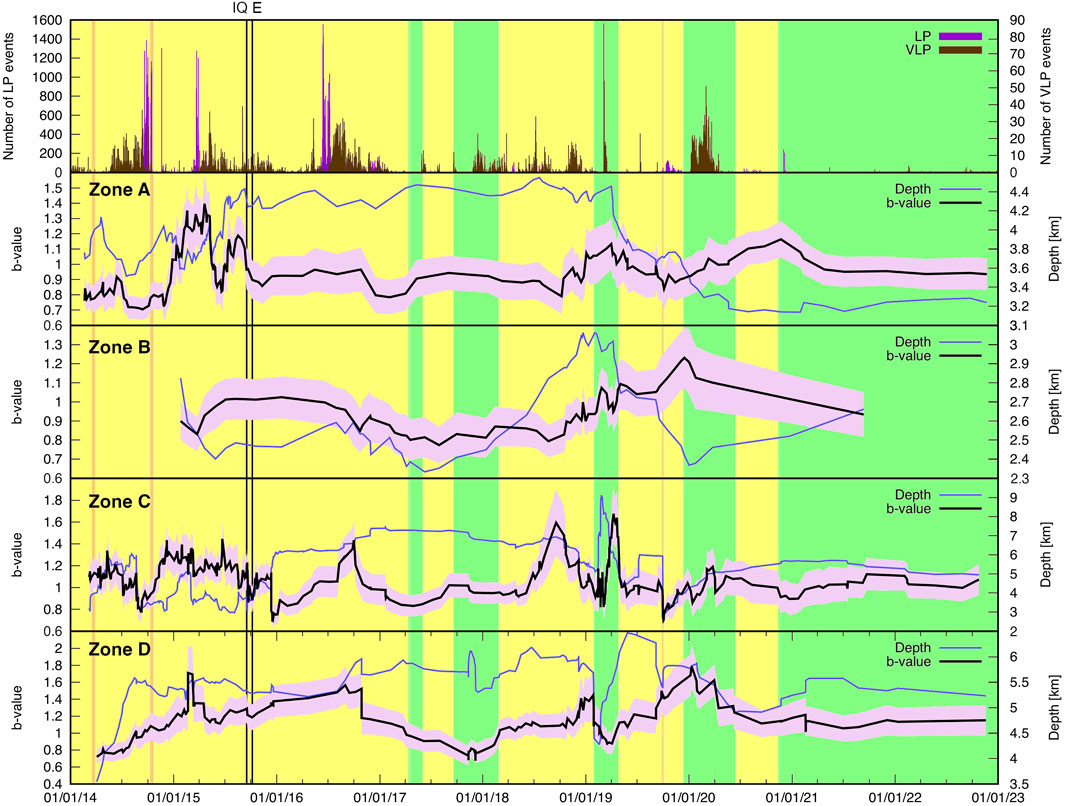
FIGURE 5. Temporal evolution of the b-value and average depth of VT seismicity at Copahue volcano-Caviahue caldera system on each one of the zones defined in Figure 4D), from 1 January 2014, to 1 January 2023. We also show the daily count of LP and VLP events in the top panel as a reference. Black lines show the b-values whilst blue lines show the average depth on the moving windows used for the calculations. Statistical errors in the b-value calculation are shown as a pink strip. Alert levels are marked following the color code by OVDAS, and vertical black lines indicate the occurrence of the 2015 Mw 8.3 Illapel earthquake (IQ), and the eruption in Copahue volcano which started afterwards (E) (Farías and Basualto, 2020). All calculations were made with the complete catalog of located VT earthquakes. We do not show the occurrence of the Mw 6.2 Lebu earthquake as there is not a clear variation on the studied quantities around that date.
Zone A exhibits its larger variations on b-value during the years 2014 and 2015, going from low values (0.7–0.8) up to larger ones (1.3–1.4). The fluctuations occurred in a variable time-window, with the largest increase in b-value (from 0.7 up to 1.4) taking place in a timeframe of less than 6 months, and with the largest drop (from 1.7 to 0.8) occurring in about 2 months. In contrast, we can also see the presence of other significant drops in b-value (in 2015 and 2019), which occurred suddenly. During the years 2014 and 2015, apart from the fluctuations in b-value, we can see that the average depth of the seismicity also varied, sometimes in a synchronized manner with the variations of the b-value. In particular, this occurred before the largest increase in b-value, due to the occurrence of a large number of small earthquakes. Following this increase in b-value, which started from low values, the depth of the seismicity also increased, suggesting a deeper source, around 4.5 km. After the 2015 Mw 8.3 Illapel earthquake, both the b-value and the average depth of the VT seismicity did stabilize, suggesting a steady state of the volcano, which was sustained over more than 3 years. During this last period the volcano was in the middle of a series of eruptions, which started 17 days after the 2015 Mw 8.3 Illapel earthquake. Following this “steady state” phase the b-value started to gradually increase, at the same time that the average depth of the seismicity decreased, going from a deeper source to a shallower one, at around 3.2–3.4 km beneath 2,500 m over the sea level.
Fluctuations at zone B were not as prominent, and tended to take a long time. The b-value varied from a minimum of 0.79 up to a maximum of 1.23 in a timeframe of more than 2 years, with the average depth of the seismicity getting deeper in the same timeframe, although the variations were rather small (from an average of 2.33–3.02 km). All of this suggests a relatively stable behavior of this zone, both in depth and b-value, over time.
We can see strong variations in both average depth and b-value in zone C over short and long timescales. The minimum values for these quantities were 2.81 and 0.69 km, and the larger ones were 9.12 and 1.67 km, respectively, thus making this zone the one that exhibited the greater variations on these quantities of all the four zones of our study area. Between 2014 and 2016 fluctuations of b-value occurred in relatively short time-windows of weeks, although there were relevant changes in the stress regime during these years, evidenced for a transition in the b-values from 1.33 to 0.77, and then back again to 1.39 at the beginning of 2015. From then until the occurrence of the 2015 Mw 8.3 Illapel earthquake the b-values were kept above 1, although with a slight global decrease, with relatively shallow sources of seismicity (around 3 km). In the months following the Illapel earthquake there is an important change of regime, going from generally lower b-values and deeper sources. Large, short-lived, variations of b-value appeared after 2019, with sudden changes on the stress regime, and a shallowness of the VT activity. This was particularly noticeable before a series of yellow and orange alerts. From 2021 onwards the seismicity of this zone entered a steady state, with b-values around 1 and an average depth close to 5 km deep.
Zone D also has important variations on both b-values and average depth in time. In contrast to zones A and C, short-time variations of b-value and depth were present after 2016 and not before, where we can see a long-term change in the stress regime, going from low b-values (around 0.7) to high values (around 1.6) about a year after. Average depth also got larger during this period (2014–2016), going from 3.5 km to roughly 6 km, suggesting the presence of a deeper source. Although there was a slight decrease in b-value when the 2015 Mw 8.3 Illapel earthquake occurred, the long-term mechanism that controls the seismicity in this region seemed to remain relatively stable. We can see a change in the dynamics of this zone starting in the second half of 2016, when there was a sudden drop in the b-value, which then started a decreasing trend for almost a year, reaching values as low as 0.67. After this the tendency of the b-value started to change again, reaching relatively high values (with a maximum of 1.44) during January 2019. After that we can see an abrupt drop in b-value, accompanied by an important shallowing of the VT seismicity. From then on the b-values started to increase again, and at the same time the source of the seismicity got deeper. Finally, from 2021 onwards both b-value and average depth stabilized in values closer to 1 for the former, and 5–5.5 km for the latter.
3.4 Changes in b-value during crises
Since our focus is in the periods of crisis of the volcano, here we show the results around them in time. Because we use windows of 160 events to calculate the b-value, we can only see results to analyze VT seismicity in the four zones defined above from 2014 onwards, missing the two instances of red alert of 2012 and 2013. In this window we have a total of 8 and 3 periods of yellow and orange alert, respectively. Orange alerts tend to be short-lived, with the largest of them being 13 days long. In addition, we also put a focus on the influence of the 2015 Mw 8.3 Illapel earthquake on the system, since the volcano started a series of eruptions 17 days after this megathrust but, since the magnitude of these earthquakes were small, the alert level was kept at yellow. Figures 6, 7 show close-ups of Figure 5 during the 2014–2015 and 2018–2020 periods, respectively. Given that Zone B does not appear to show significant changes before any moment of crisis in the volcano, these figures do not include the results of this zone.
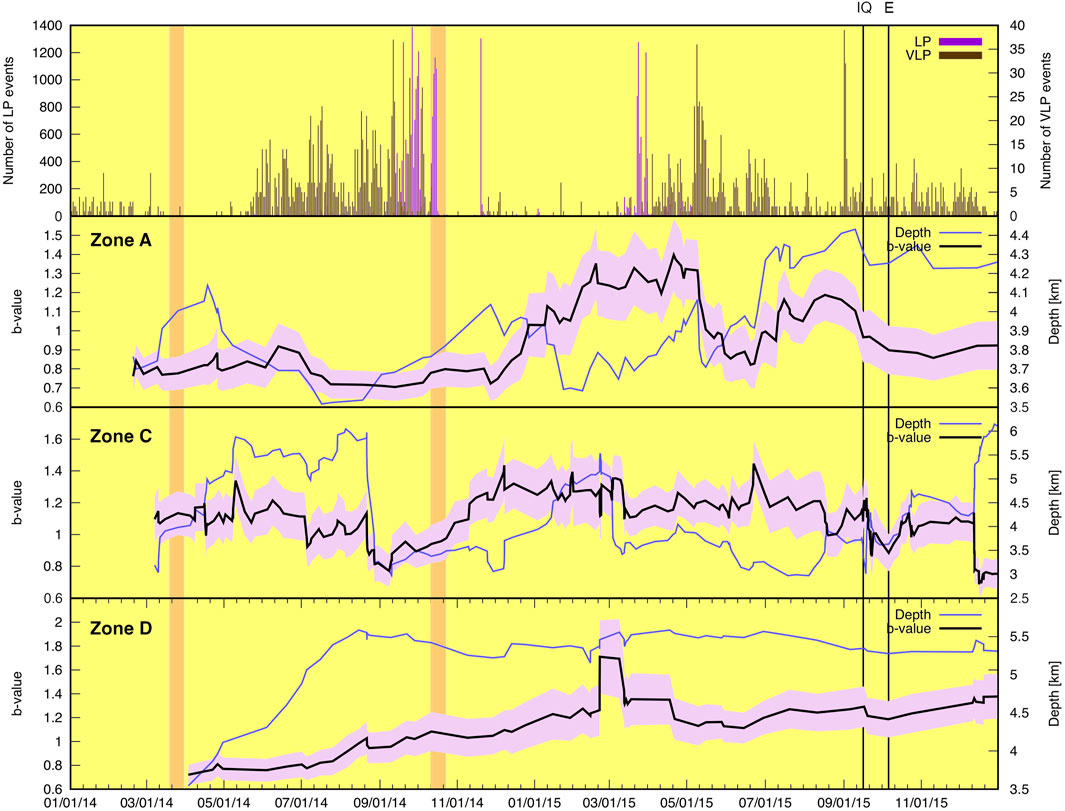
FIGURE 6. Temporal evolution of the b-value and average depth of VT seismicity at Copahue volcano-Caviahue caldera system on Zones A, C, and D, from 1 January 2014, to 31 December 2015. We also show the daily count of LP and VLP events in the top panel as a reference. Black lines show the b-values whilst blue lines show the average depth on the moving windows used for the calculations. Statistical errors in the b-value calculation are shown as a pink strip. Alert levels are marked following the color code by OVDAS, and vertical black lines indicate the occurrence of the 2015 Mw 8.3 Illapel earthquake (IQ), and the eruption in Copahue volcano which started afterwards (E). All calculations were made with the complete catalog of located VT earthquakes.
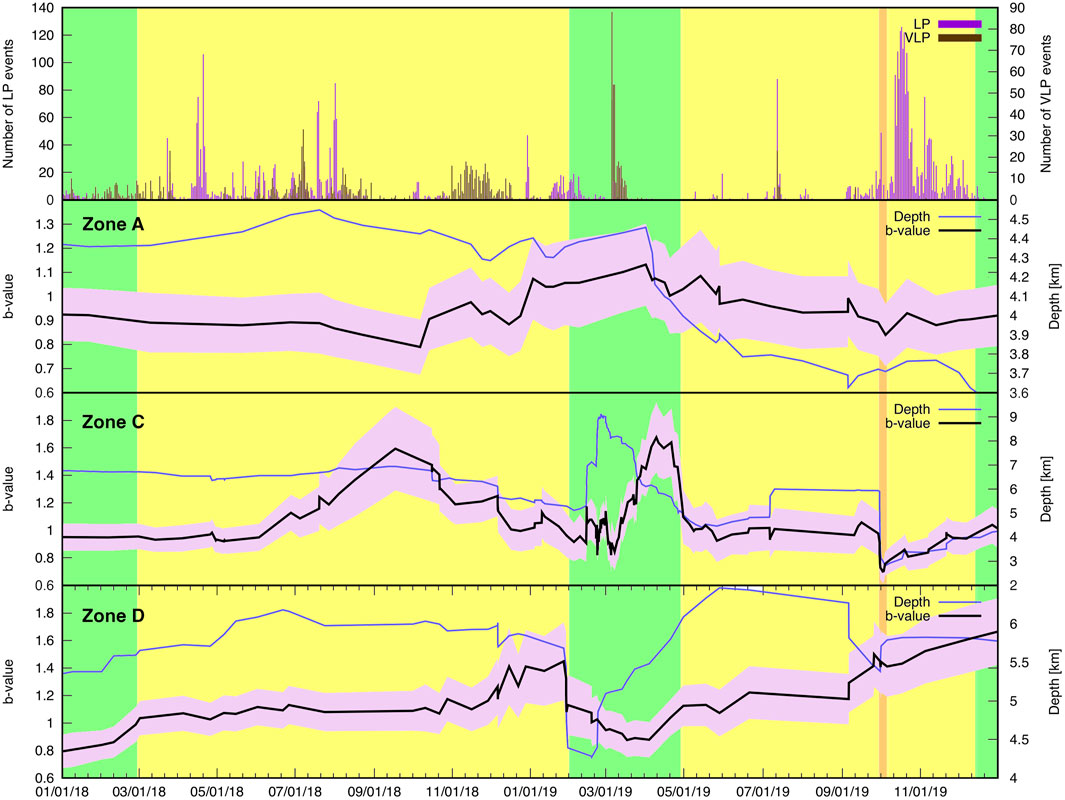
FIGURE 7. Temporal evolution of the b-value and average depth of VT seismicity at Copahue volcano-Caviahue caldera system on Zones A, C, and D, from 1 January 2018, to 31 December 2019. We also show the daily count of LP and VLP events in the top panel as a reference. Black lines show the b-values whilst blue lines show the average depth on the moving windows used for the calculations. Statistical errors in the b-value calculation are shown as a pink strip. Alert levels are marked following the color code by OVDAS. All calculations were made with the complete catalog of located VT earthquakes.
We can see that the source of the seismicity of Zone A got slightly shallower before the onset of the orange alert of October 2014, without a significant change in b-value. In the case of Zone C there was a clear change in the regime of the b-values about 3 months before the orange alert of October 2014, going from values of 1.2 to 0.7. This occurred during little over a week and a half, and was accompanied by the shallowness of the seismic source. It is very interesting to notice that, after zone C entered into a new stress regime (characterized by low b-values and shallow seismicity), there was a constant increase in VLP and LP activity at the volcano, with a particularly high number of LP events following a swarm-like occurrence of VLP earthquakes. We do not have reliable locations of these events, which is why we do not present them in this article, but we need to stress that their most likely location lies inside zone A, and not C. Therefore, we see a change of stress in zone C which is later followed by activity most likely in zone A. The orange alert of October 2014, was decreed little over 2 months after the change in regime on zone C. Zone D, on the other hand, does not show significant changes on its activity that are clearly followed in time by LP and VLP events.
Following the period of orange alert of October 2014, the three zones experienced changes in their stress state, evidenced by fluctuations in b-values and depths. B-values on zones A, C, and D increased after this alert, with a significant increase in average depth in zone C, and a decrease in depth in zone A. Average depths in zone D were stable in time. More than 6 months before the occurrence of the 2015 Mw 8.3 Illapel earthquake there was a sudden, but rather small, change in b-value in zone C. This was followed by a deeperization of the source of seismicity in zone A and the appearance of a large number of LP and VLP events, at the time on which both b-values and average depth on zone C were relatively stable. In May 2015 we can see a sudden drop in b-values in zone A, which was accompanied first by shallower VT earthquakes, and then followed by the onset of an important number of VLP events. When the Illapel megathrust occurs, we can see an important drop in b-values at zone A, which was then followed by another drop in b-value, this time in zone C. Average depths right after the megathrust were about 3.5–4 km for zone C, and 4.2 km for zone A, respectively. A new eruption started after this, preceded by 17 days of short-lived changes in b-values that we can mostly appreciate in zone C.
There was not a clear change in b-values or average depths at the onset of the yellow alert period which began at the end of February 2018. During this period of unrest the volcano had a strong production of LP and VLP events, alternating their dominance over the catalog in time. Although average depths were relatively stable in zone C during this period, we can see a change in the stress regime in September 2018, evidenced in a slow drop on its b-value, which began about 6 months before the alert level went back to green. After this drop started we can see a new increase in b-values of zones A and D, with a steep reduction in b-value and average depth at zone D when the yellow alert ends.
The next crisis started in April 2019, with a new instance of yellow alert. It is very interesting to notice that in the months prior to this moment the source of seismicity at zone C was the deepest of the whole catalog, and it was followed by a noticeable increase in b-value, from 0.8 up to 1.6, which took almost 2 months to complete. During this increase in b-value the average depth of the seismicity dropped roughly 3 km, and also there was a strong, swarm-like, occurrence of VLP events. After reaching a local maximum of 1.67 in the b-value of zone C, the b-values of both this zone and zone A started to drop, with the most noticeable changes being present in zone C. This fall in the b-value started 3 weeks before the beginning of the yellow alert, which lasted almost 5 months. During the yellow alert we can see a regime of low b-values and relatively shallow average depths in Zone C, accompanied by a progressive decrease in b-values and average depths in Zone A, as well as a very slight increase in b-value and relatively stable values of average depth. In the 2 weeks before the start of the orange alert of September 2019, we can see a significant and sudden drop in the b-values of zone C, which occurred at the same time that the source of seismicity became shallower there. We can also see slight but sudden changes in zones A and D, but they were not as relevant as the ones of zone C. From the end of the orange alert until the end of the subsequent yellow one the activity was characterized by the appearance of a large number of LP events, at the same time that the b-values of zone C increased until values close to 1, in synchronization with the increase in average depth. There was also a boost in the b-values of zone D during this time, going from relatively high values (1.44) up to higher ones (1.78). All the zones of the Copahue-Caviahue caldera system did stabilize following the start of the green alert of December 2019.
3.5 Revisiting the static stress changes due to the 2010 Mw 8.8, Maule earthquake, in the different zones of the Copahue-Caviahue caldera system
Since we have four main areas on which we analyzed the variations of b-values and average depth of VT seismicity, we need to further understand which structures dominate them, looking for potential signals of destabilization of the volcanic system. According to our results and prior structural geology studies, the main faults in each one of the zones are: a series of NE faults for zone A, following the elongation of the volcanic edifice, a NW structure for zone B, a N-S fault in zone C, which is where most of the seismicity seems to be concentrated, and NW faults in zone D. With this mind, and considering that Copahue is one of the three most active volcanoes in Chile after the 2010 Mw 8.8 Maule earthquake, we calculated the static stress variations induced by this megathrust event, looking at differences between representative points of each region, at different depths.
Figure 8 shows the variations in normal and shear stress at each one of the points considered on its first panel, which are part of the structures described above. Our aim is to understand the changes in the stress regimes at each one of these faults produced by the 2010 Mw 8.8 Maule earthquake. We can see that zone 2 got the larger changes in both normal and shear stress, the first one promoting unclamping. The fault that is the least affected is the NW-trending structure of Zone D which, although unclamping was promoted on it, the change in normal stress was smaller than the other ones; also, the change in shear stress was smaller as well, when compared to the other structures of the Copahue volcano - Caviahue caldera system. Both Zones A and C had similar values of normal stress change, in the order of 2.7–2.8 bar, and they are also heavily sheared, with changes in shear stress being larger than 1 bar.
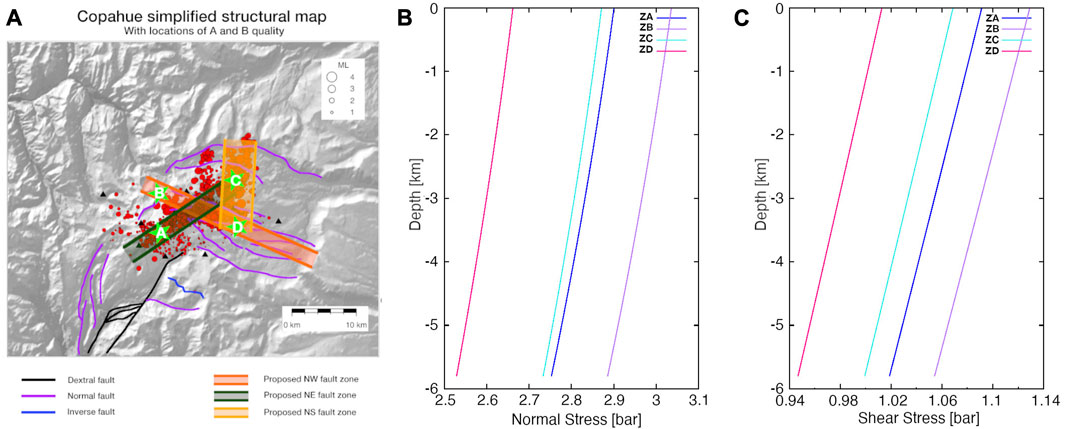
FIGURE 8. Static stress changes induced by the 2010 Mw 8.8 Maule earthquake in Copahue volcano-Caviahue caldera system, which is sketched in panel (A). Panel (B,C) show the changes in Normal stress (B) and Shear stress (C). Each calculation was carried out in one of the green stars from panel (A), which indicate representative points of each one of the zones on which we divided our domain. Stars A, B, C, and D correspond to zones ZA, ZB, ZC, and ZD, respectively.
If we take Zone B out of the analysis for a moment, we can see that both zones A and C were similarly affected on their dynamics by the Mw 8.8 Maule earthquake, with zone D being the one that underwent the lower changes of stress on its main structures.
4 Discussion
We analyzed the VT seismicity of Copahue volcano, southern Andes, which is located in a region that is composed of a series of complex fault systems, proper of a transition zone in Chile’s tectonic setting, at the northern edge of the LOFS (Melnick et al., 2006; Tardani et al., 2021). This volcano had a series of crises during the 2012–2022 period, starting with the precursory activity to its 2012 eruption (Lundgren et al., 2017), entering in a steady state in 2021, being in green alert since. The VT seismicity of the volcano shows an heterogeneous distribution of events, which are mostly generated outside the volcanic edifice, rather than beneath it. Based on the spatial distribution of seismic energy, number of events, and average depth of seismicity, we identified four main zones, which seem to be dominated by specific structures: Zone A, which corresponds to the volcano edifice, contains a clear NE structure. Zone B contains a locally known hydrothermal system, which seems to be dominated by a NW fault. Zone C is the most complex, it contains the northern portion of the Caviahue caldera, and contains a series of NE-trending faults that seem to intersect with a larger, and possibly older, N-S fault which latter connects with the Copahue-Antiñir fault system towards the north. These NE faults might serve as a stress transfer zone. Lastly, zone D contains a series of NW trending faults, which seem to be part of the horsetail splay faults of the LOFS (Barcelona et al., 2019; Tardani et al., 2021).
We focused ourselves on the evolution of the b-value of the whole catalog and on each one of the zones described above. The global b-value of the whole system is b = 1.0 ± 0.1, which is typical of a purely tectonic regime, and is low compared with other volcanic systems, such as Makushin volcano, in Alaska (Bridges and Gao, 2006). This result is consistent with the known strong structural control over the whole system, as this is a complex region that marks the transition from South Chile, which is dominated by the LOFS in the arc to Central-South Chile, which seems to be dominated by NS reverse faults (Cembrano Perasso and Lara, 2009). Under this idea, fluid motion tends to occur over a preferred series of faults, which has been suggested before for this volcano (Farías and Basualto, 2020). Our results add to this notion, suggesting that the NS fault zone that seems to be present in the eastern side of the Caviahue caldera does play an important role in the generation of seismicity, which can be triggered by fluid motion and/or its own tectonics.
We carried out the analysis of the seismicity by also looking at the temporal evolution of the b-value and average depth of each zone. We can see that, while most zones do present important changes in their stress state (which can be evidenced by the variations on the b-value around b=1 and the fluctuations in depth), zone B does not present a behavior that can be considered similar to the other three, which suggests that the mechanisms that generate the seismicity in that zone are mostly related to the dynamics of the hydrothermal field, that does not seem to interact with the other parts of the whole system. Our results also show a combination of different b-values and average depths in time: for b-values that are lower or greater than 1, we can see the occurrence of shallow or deep seismicity. Each combination suggests a different scenario. When the b-value is larger than 1 we have more presence of relatively low magnitude seismicity, which can be attributed to episodes of injection of fluid into the structures. When the average depth is relatively low
Consequently, variations on b-values and average depth do have a tendency to be more noticeable before and after moments of volcanic crises. Globally we can see a trend where the b-value of the whole VT seismicity of Copahue volcano drops weeks to months before a moment of crisis (reflected by an increase in the alert level), which evidences instances changes in the stress state of the whole system, which lead to instabilities in the volcano. More specifically, and looking into each one of the zones of the Copahue volcano-Caviahue caldera system, we can propose several mechanisms that help to explain the variations of the b-value and average depth before and after moments of crisis. In that line, we propose that in the months before the October 2014, orange alert a release of shallow fluids is evident in zone C, thus creating a reduction in the effective stress there. Since this is followed by a stark increase mainly in LP event production, we propose that this release of fluids created a stress reduction that was later transferred into the main NE structure of the Copahue volcano edifice, which was already at a low stress level. The orange alert of the volcano started at the end of this process, and consisted of a strong volcanic tremor signal and a large output of LP events, which evidences an important instance of fluid motion beneath the volcano, which is consistent with the mechanism we propose here. Following the October 2014, orange alert we can see a moment of charge of fluid in zones A and C that last for about 6 months, on similar depths (3.5–4 km), which suggests that they are dominated by hydrothermal fluids, as it has been seen in other volcanic systems in the world (Konstantinou, 2022). Then both zones show evidence of fluid release, but in different timescales, right before the occurrence of the 2015 Mw 8.3 Illapel earthquake, which is where we can interpret our results as a sudden release of fluids, as evidenced by a sharp reduction of b-value in both zones A and C. In both zones the average depth of the seismicity also reduces quickly and for a few days, which supports the idea of fluid motion in the shallow portions of the system. Merely 17 days after the occurrence of the Illapel earthquake, a new series of eruptions began at Copahue (Farías and Basualto, 2020), triggering a new change in the stress regime, where we can see a reduction in effective stress in both regions, and the presence of a deeper source of seismicity, which we propose to be associated to magma input. While we do not see an important change in the tendency of the b-values and average depths before and during the June 2017, yellow alert, it is very interesting to notice that, during the period of the 2018 yellow alert, we have a moment of apparent fluid injection in zone C, reflected by the increase in the b-values. Since the subsequent drop in b-values and shallowness of the seismicity in zone C was followed by larger values of b in zone A, we propose that, during the last quarter of 2018, fluid was released from zone C and was later injected into the rock beneath the volcano in zone A. A new instance of magma motion started in the second quarter of 2019, once again in zone C, as suggested by the sudden appearance of deep VT events, which was then followed by a change in b-value from 0.8 up to 1.6, in less than 3 months. When the b-value suddenly fell, the yellow alert of 2019 started. During this period the seismicity of zone A is proper of what we should expect when there is a release of fluids in the structures of the region. The whole system became even more unstable when there was a new moment of sudden opening in the main structures of zone C, likely related to the dominance of hydrothermal fluid dynamics. This was followed by what seems to be a regime of hydrothermal fluid-dominated VT seismicity occurrence. Although we also see a shallowing and fall in the b-values of the seismicity in zone D before the series of crisis of 2018 and 2019, these changes were not so pronounced as the ones we saw in zone C, and therefore we suggest that this might be a change either produced in the northern section of zone D, in what could be the southern edge of the N-S fault that we see in zone C, or a change that is related to the dynamics of the local faults there, without a clear connection with the instabilities of the volcano.
Our results also show that the b-value is a good indicator of the stress state of Copahue volcano, which is affected by episodes of fluid injection and release. Consequently, we can correlate temporal changes of b-value (and average depth) of the VT events with episodes of fluid migration through the main pathways of the system. This allows us to an early identification of instabilities at the volcano, with weeks and even months of anticipation respect to the onset of an eruption, or an instance of alert level change. Not only we can identify the onset of episodes of instability, we can also detect where. The temporal variations on b-value allow us to identify which structures are the most likely to induce an instability in a volcanic system. One example of this is what we see in zone C, which seems to include the intersection between a N-S fault with a series of NE faults that are linked to the activity of the volcano: most of the periods of instability at the volcano start with an anomaly of the b-value in this region. Thus, if we have important seismicity in that zone, we can expect the transfer of fluid into the volcano afterwards, in a timeframe of weeks to months. We need to stress that we only can do this in a volcano with a large production of VT seismicity, so this method is not likely to provide us an important insight in volcanoes dominated by fluid dynamics-related seismicity, such as Villarrica (Richardson et al., 2014) or Llaima (Franco et al., 2019).
In addition to this long-term forecast of possible crises, we can also see that external perturbations, such as the 2015 Mw 8.3 earthquake, can create instabilities in the volcanic system in a very short period of time. This can occur either due to the alteration of the fluid dynamics or by the creation of instabilities at the local fault systems, that later can serve as pathways for fluid to migrate. This latter case is the one that is detectable by the short-term variations of the b-value, and therefore, in volcanoes with a strong structural control, such as Copahue, we can detect where instabilities are created. If this happen to occur in structures that are linked to fluid migration, then it is possible that we can detect a future volcanic crisis after an earthquake, in a short term. This comes to show us that the analysis of the b-value variations allow us to a better understanding of the critical state of the volcano, considering the whole system, and not only the main edifice.
Our analysis suggests that Copahue volcano has been strongly affected by earthquakes in the past. In particular, during the period of time on which we studied the VT seismicity of Copahue volcano, this system was under the influence of two large earthquakes, although in different situations: the volcano has been in the post-seismic phase of the 2010 Mw 8.8 Maule earthquake, which created strong changes on its local stress tensor, which should last for several years (Bonali et al., 2013; Seropian et al., 2021), and also underwent dynamic stress changes due to the passage of the seismic waves from the 2015 Mw 8.3 Illapel earthquake (Farías and Basualto, 2020). We manage to capture the whole response of Copahue volcano to the latter, finding out that the effect on the stress regime was not short-lived, as the instability produced by the passage of the seismic waves of the megathrust (located more than 650 away from the volcano) triggered a period of instability on zone C, which is the one that seems to facilitate the movement of magma from depth into the Copahue crater. This instability was later followed by an extended period of apparent magma motion into the Copahue crater, as suggested by the low b-values and deep sources of VT seismicity, as well as for the almost continuous emissions at Copahue-Caviahue crater. This might be related to openings in the intersection between a N-S trending fault in the northern side of the Caviahue caldera and a NE-trending system of faults that come from the volcano, as it was previously suggested by Farías and Basualto (2020). The effect of the 2010 Mw 8.8 Maule earthquake is more difficult to see, as we do not have data of the behavior of the volcano before this megathrust event. Nevertheless, the static stress transfer shows that both the N-S fault that dominates Zone C and the NE-trending fault of zone A are the two structures that get the largest changes in normal and shear stress changes of all the ones that seem to be linked to the superficial activity of the volcano. Even more noticeable is that the stress changes in these structures are very similar, with a marked contrast with what we obtained in the NW trending faults of zone D. Thus, we propose that the effect of the 2010 Mw 8.8 Maule earthquake was particularly strong in the NE and in the N-S structures, strongly promoting unclamping in them. Since these faults seem to be the most important for the critical state of the volcano, then we can speculate that most of the activity from the Copahue volcano in the period of this study has a strong influence of this earthquake, particularly before 2020 (with composite effect of it and the 2015 Illapel earthquake during 2015–2016). From then onwards the volcano has reached what seem to be baseline levels, with both b-values and average depth being very close to the normal activity we should expect from a series of structures in a tectonic setting (b-value around 1). Perhaps the effect of the 2010 Maule earthquake has been waning since 2020, and/or maybe the volcano just entered in a steady state. If it is the former, observations like the ones we have, when applied to other volcanoes, could provide an insight on for how long is the static stress change relevant for the volcanic activity after a large earthquake.
Data availability statement
The data analyzed in this study is subject to the following licenses/restrictions: The dataset from this article came from OVDAS, and belongs to the state of Chile. It is open to all, but contacting the officer in charge of data access (Carlos Cardona, email: Y2FybG9zLmNhcmRvbmFAc2VybmFnZW9taW4uY2w=) is a requirement, in accordance to Chile’s law 20285 on the access to public information, promulgated on 11 August 2008. Requests to access these datasets should be directed to Carlos Cardona, Y2FybG9zLmNhcmRvbmFAc2VybmFnZW9taW4uY2w=.
Author contributions
CF, JL, and DB contributed to conception and design of the study. JL organized the database. MS, FM-Q, LZ-U, RM-B, IH-I, and RS carried out the initial analysis of the data. CF performed the analysis of the b-value. CF, JL, and DB performed the final analysis of the data. CF wrote the first draft of the manuscript. CF, JL, and DB wrote sections of the manuscript. All authors contributed to the article and approved the submitted version.
Funding
This work was supported by the following grants: Fondecyt de Iniciación Grant 11230715, from the Chilean National Agency for Research and Development (ANID), U.S. Army Research Office Grant W911NF2010258, from the Government of the United States, FONDEF Grant 19I10397 from ANID, and CIVUR-39 Project FR02193, from Desarrollo de Actividades de Interés Nacional (ADAIN), Ministerio de Educación, Gobierno de Chile.
Acknowledgments
We thank the Observatorio Volcanológico de Los Andes del Sur (OVDAS) and SERNAGEOMIN for facilitating the data collection required to carry out this research. We thank Francisco Prado for his help on the development of some figures in this article. We also thank Argentina’s OAVV-SEGEMAR, for the information about their stations at Copahue and helpful comments. We think it is worth noticing that the collaboration between OVDAS-SERNAGEOMIN and OAVV-SEGEMAR is the very first binational collaboration for volcano monitoring, which enhances our capacities to forecast future episodes of crisis. We would also like to thank to “GeoAraucanía Group,” a university community made up of professionals linked to geosciences, forming part of the faculties of Engineering of the Universidad Católica de of Temuco (UCT), Engineering of Universidad de La Frontera (UFRO), and Science Engineering and Technology of Universidad Mayor, whose objective is to develop and promote sustainable lines of research linked to the territory and its communities.
Conflict of interest
The authors declare that the research was conducted in the absence of any commercial or financial relationships that could be construed as a potential conflict of interest.
Publisher’s note
All claims expressed in this article are solely those of the authors and do not necessarily represent those of their affiliated organizations, or those of the publisher, the editors and the reviewers. Any product that may be evaluated in this article, or claim that may be made by its manufacturer, is not guaranteed or endorsed by the publisher.
Supplementary material
The Supplementary Material for this article can be found online at: https://www.frontiersin.org/articles/10.3389/feart.2023.1181177/full#supplementary-material
References
Aron, F., Cembrano, J., Astudillo, F., Allmendinger, R. W., and Arancibia, G. (2015). Constructing forearc architecture over megathrust seismic cycles: geological snapshots from the Maule earthquake region, Chile. Geol. Soc. Am. Bull. 127, 464–479. doi:10.1130/B31125.1
Astudillo-Sotomayor, L., Jara-Muñoz, J., Melnick, D., Cortés-Aranda, J., Tassara, A., and Strecker, M. R. (2021). Fast Holocene slip and localized strain along the Liquiñe-Ofqui strike-slip fault system, Chile. Sci. Rep. 11, 5970. doi:10.1038/s41598-021-85036-5
Barcelona, H., Maffucci, R., Yagupsky, D., Senger, M., and Bigi, S. (2020). Discrete fracture network model of the vapor zone leakages at the Copahue geothermal field. J. Struct. Geol. 140, 104155. doi:10.1016/j.jsg.2020.104155
Barcelona, H., Yagupsky, D., Vigide, N., and Senger, M. (2019). Structural model and slip-dilation tendency analysis at the Copahue geothermal system: inferences on the reservoir geometry. J. Volcanol. Geotherm. Res. 375, 18–31. doi:10.1016/j.jvolgeores.2019.03.007
Basualto, D., Tassara, A., Lazo-Gil, J., Franco-Marin, L., Cardona, C., San Martín, J., et al. (2023). Anatomy of a high-silica eruption as observed by a local seismic network: the June 2011 puyehue–cordón Caulle event (southern Andes, Chile). Solid earth. 14, 69–87. doi:10.5194/se-14-69-2023
Bell, A. F., Kilburn, C. R. J., and Main, I. G. (2014). “Volcanic eruptions, real-time forecasting of,” in Encyclopedia of earthquake engineering (Germany: Springer). 1–16. doi:10.1007/978-3-642-36197-5_43-1
Bonali, F. (2013). Earthquake-induced static stress change on magma pathway in promoting the 2012 Copahue eruption. Tectonophysics 608, 127–137. doi:10.1016/j.tecto.2013.10.006
Bonali, F. L., Tibaldi, A., Corazzato, C., Tormey, D. R., and Lara, L. E. (2013). Quantifying the effect of large earthquakes in promoting eruptions due to stress changes on magma pathway: the Chile case. Tectonophysics 583, 54–67. doi:10.1016/j.tecto.2012.10.025
Bridges, D., and Gao, S. (2006). Spatial variation of seismic b-values beneath Makushin volcano, unalaska island, Alaska. Earth Planet. Sci. Lett. 245, 408–415. doi:10.1016/j.epsl.2006.03.010
Cardona, C., Gil-Cruz, F., Franco-Marín, L., San Martín, J., Valderrama, O., Lazo, J., et al. (2021). Volcanic activity accompanying the emplacement of dacitic lava domes and effusion of lava flows at Nevados de Chillán Volcanic Complex – Chilean Andes (2012 to 2020). J. Volcanol. Geotherm. Res. 420, 107409. doi:10.1016/j.jvolgeores.2021.107409
Cembrano, J., Schermer, E., Lavenu, A., and Sanhueza, A. (2000). Contrasting nature of deformation along an intra-arc shear zone, the Liquiñe–Ofqui fault zone, southern Chilean Andes. Tectonophysics 319, 129–149. doi:10.1016/S0040-1951(99)00321-2
Cembrano Perasso, J., and Lara, L. (2009). The link between volcanism and tectonics in the southern volcanic zone of the Chilean Andes: A review. Tectonophysics 471, 96–113. doi:10.1016/j.tecto.2009.02.038
Chiba, K., and Shimizu, H. (2018). Spatial and temporal distributions of b-value in and around Shinmoe-dake, Kirishima volcano, Japan. Earth, Planets Space 70, 122. doi:10.1186/s40623-018-0892-7
Eggert, S., and Walter, T. R. (2009). Volcanic activity before and after large tectonic earthquakes: observations and statistical significance. Tectonophysics 471, 14–26. doi:10.1016/j.tecto.2008.10.003
Farías, C., and Basualto, D. (2020). Reactivating and calming volcanoes: the 2015MW8.3 Illapel megathrust strike. Geophys. Res. Lett. 47. doi:10.1029/2020GL087738
Farías, C., Galván, B., and Miller, S. A. (2017). Numerical simulations (2D) on the influence of pre-existing local structures and seismic source characteristics in earthquake-volcano interactions. J. Volcanol. Geotherm. Res. 343, 192–210. doi:10.1016/j.jvolgeores.2017.07.001
Farías, C., Lupi, M., Fuchs, F., and Miller, S. A. (2014). Seismic activity of the Nevados de Chillán volcanic complex after the 2010 Mw8.8 Maule, Chile, earthquake. J. Volcanol. Geotherm. Res. 283, 116–126. doi:10.1016/j.jvolgeores.2014.06.013
Folguera, A., Rojas Vera, E., Vélez, L., Tobal, J., Orts, D., Agusto, M., et al. (2015). “A review of the geology, structural controls, and tectonic setting of Copahue volcano, southern volcanic zone, Andes, Argentina,” in Copahue volcano. Active volcanoes of the World. doi:10.1007/978-3-662-48005-2_1
Franco, L., Palma, J. L., Lara, L. E., Gil-Cruz, F., Cardona, C., Basualto, D., et al. (2019). Eruptive sequence and seismic activity of Llaima volcano (Chile) during the 2007–2009 eruptive period: inferences of the magmatic feeding system. J. Volcanol. Geotherm. Res. 379, 90–105. doi:10.1016/j.jvolgeores.2019.04.014
Freire, S., Florczyk, A., Pesaresi, M., and Sliuzas, R. (2019). An improved global analysis of population distribution in proximity to active volcanoes, 1975–2015. ISPRS Int. J. Geo-Information 8, 341. doi:10.3390/ijgi8080341
Global Volcanism Program (2023). Distributed by smithsonian institution, compiled by venzke. Volcanoes World 5, 3. doi:10.5479/si.GVP.VOTW5-2022.5.0
Gudmundsson, A. (2011). Rock fractures in geological processes. 1 edn. Cambridge: Cambridge University Press. doi:10.1017/CBO9780511975684
Gutenberg, B., and Richter, C. F. (1944). Frequency of earthquakes in California. Bull. Seismol. Soc. Am. 34, 185–188. doi:10.1785/BSSA0340040185
Haberland, C., Rietbrock, A., Lange, D., Bataille, K., and Hofmann, S. (2006). Interaction between forearc and oceanic plate at the south-central Chilean margin as seen in local seismic data. Geophys. Res. Lett. 33, L23302. doi:10.1029/2006GL028189
Jacobs, K., and McNutt, S. (2010). “Using seismic b-values to interpret seismicity rates and physical processes during the preeruptive earthquake swarm at augustine volcano 2005–2006,” in The 2006 eruption of augustine volcano, Alaska (USA: U.S. Geological Survey Professional) Paper 1769) 59–83.
Konstantinou, K. (2022). Multiyear temporal variation of b-values at Alaskan volcanoes: the synergetic influence of stress and material heterogeneity. J. Volcanol. Geotherm. Res. 427, 107572. doi:10.1016/j.jvolgeores.2022.107572
Kumagai, H., and Chouet, B. A. (1999). The complex frequencies of long-period seismic events as probes of fluid composition beneath volcanoes. Geophys. J. Int. 138, F7–F12. doi:10.1046/j.1365-246X.1999.00911.x
Lahr, J. (1999). Hypoellipse: A computer program for determining local earthquake hypocentral parameters, magnitude, and first-motion pattern. U. S. Geol. Surv. Open-File Rep. 99, 23.
Lange, D., Cembrano, J., Rietbrock, A., Haberland, C., Dahm, T., and Bataille, K. (2008). First seismic record for intra-arc strike-slip tectonics along the Liquiñe-Ofqui fault zone at the obliquely convergent plate margin of the southern Andes. Tectonophysics 455, 14–24. doi:10.1016/j.tecto.2008.04.014
Legrand, D., Barrientos, S., Bataille, K., Cembrano, J., and Pavez, A. (2011). The fluid-driven tectonic swarm of aysen fjord, Chile (2007) associated with two earthquakes (Mw=6.1 and Mw=6.2) within the liquiñe-ofqui Fault Zone. Cont. Shelf Res. 31, 154–161. doi:10.1016/j.csr.2010.05.008
Linares, E., Ostera, H., and Mas, L. (1999). Cronología potasio-argón del Complejo Efusivo Copahue-Caviahue, Provincia del Neuquén. Asoc. Geol. Argent. Rev. 54, 240–257.
Lundgren, P., Nikkhoo, M., Samsonov, S. V., Milillo, P., Gil-Cruz, F., and Lazo, J. (2017). Source model for the Copahue volcano magma plumbing system constrained by InSAR surface deformation observations. J. Geophys. Res. Solid Earth 122, 5729–5747. doi:10.1002/2017jb014368
Maldonado, V., Contreras, M., and Melnick, D. (2021). A comprehensive database of active and potentially-active continental faults in Chile at 1:25,000 scale. Sci. Data 8, 20. doi:10.1038/s41597-021-00802-4
Manga, M., and Brodsky, E. (2006). Seismic triggering of eruptions in the far field: volcanoes and geysers. Annu. Rev. Earth Planet. Sci. 34, 263–291. doi:10.1146/annurev.earth.34.031405.125125
McGarr, A. (2014). Maximum magnitude earthquakes induced by fluid injection. J. Geophys. Res. Solid Earth 119, 1008–1019. doi:10.1002/2013jb010597
McNutt, S. R., and Roman, D. C. (2015). “Volcanic seismicity,” in The encyclopedia of volcanoes (China: Elsevier), 1011–1034. doi:10.1016/B978-0-12-385938-9.00059-6
Melnick, D., Charlet, F., Echtler, H. P., and De Batist, M. (2006). Incipient axial collapse of the main Cordillera and strain partitioning gradient between the central and patagonian Andes, lago laja, Chile: collapse and strain partitioning in laja. Tectonics 25, n. doi:10.1029/2005tc001918
Montenegro, V. M., Spagnotto, S., Legrand, D., and Caselli, A. T. (2021). Seismic evidence of the active regional tectonic faults and the Copahue volcano, at Caviahue Caldera, Argentina. Bull. Volcanol. 83, 20. doi:10.1007/s00445-021-01442-7
Neves, M., Peng, Z., and Lin, G. (2022). A high-resolution earthquake catalog for the 2004 mw 6 parkfield earthquake sequence using a matched filter technique. Seismol. Res. Lett. 94, 507–521. doi:10.1785/0220220206
Nishimura, T., Iguchi, M., Hendrasto, M., Aoyama, H., Yamada, T., Ripepe, M., et al. (2016). Magnitude–frequency distribution of volcanic explosion earthquakes. Earth, Planets Space 68, 125. doi:10.1186/s40623-016-0505-2
Okada, Y. (1992). Internal deformation due to shear and tensile faults in a half-space. Bull. Seismol. Soc. Am. 82, 1018–1040. doi:10.1785/bssa0820021018
Piquer, J., Rivera, O., Yáñez, G., and Oyarzún, N. (2021). The piuquencillo fault system: A long-lived, andean-transverse fault system and its relationship with magmatic and hydrothermal activity. Solid earth. 12, 253–273. doi:10.5194/se-12-253-2021
Pritchard, M. E., Jay, J. A., Aron, F., Henderson, S. T., and Lara, L. E. (2013). Subsidence at southern Andes volcanoes induced by the 2010 Maule, Chile earthquake. Nat. Geosci. 6, 632–636. doi:10.1038/ngeo1855
Pritchard, M. E., Mather, T. A., McNutt, S. R., Delgado, F. J., and Reath, K. (2019). Thoughts on the criteria to determine the origin of volcanic unrest as magmatic or non-magmatic. Philosophical Trans. R. Soc. A Math. Phys. Eng. Sci. 377, 20180008. doi:10.1098/rsta.2018.0008
Richardson, J., Waite, G., and Palma, J. (2014). Varying seismic-acoustic properties of the fluctuating lava lake at villarrica volcano, Chile. J. Geophys. Res. Solid Earth 119, 5560–5573. doi:10.1002/2014JB011002
Roberts, N. S., Bell, A. F., and Main, I. G. (2015). Are volcanic seismic b -values high, and if so when? J. Volcanol. Geotherm. Res. 308, 127–141. doi:10.1016/j.jvolgeores.2015.10.021
Rodríguez-Pérez, Q., Monterrubio-Velasco, M., Zúñiga, F. R., Valdés-González, C. M., and Arámbula-Mendoza, R. (2021). Spatial and temporal b-value characterization at Popocatépetl volcano, Central Mexico. J. Volcanol. Geotherm. Res. 417, 107320. doi:10.1016/j.jvolgeores.2021.107320
Roman, D. C., and Cashman, K. V. (2018). Top–down precursory volcanic seismicity: implications for ‘stealth’ magma ascent and long-term eruption forecasting. Front. Earth Sci. 6, 124. doi:10.3389/feart.2018.00124
Roman, D. C., De Angelis, S., Latchman, J. L., and White, R. (2008). Patterns of volcanotectonic seismicity and stress during the ongoing eruption of the Soufrière Hills Volcano, Montserrat (1995–2007). J. Volcanol. Geotherm. Res. 173, 230–244. doi:10.1016/j.jvolgeores.2008.01.014
Roman, D. C., Neuberg, J., and Luckett, R. R. (2006). Assessing the likelihood of volcanic eruption through analysis of volcanotectonic earthquake fault–plane solutions. Earth Planet. Sci. Lett. 248, 244–252. doi:10.1016/j.epsl.2006.05.029
Ruiz, S., and Madariaga, R. (2018). Historical and recent large megathrust earthquakes in Chile. Tectonophysics 733, 37–56. doi:10.1016/j.tecto.2018.01.015
Sánchez, P., Perez-Flores, P., Arancibia, G., Cembrano Perasso, J., and Reich, M. (2013). Crustal deformation effects on the chemical evolution of geothermal systems: the intra-arc Liquiñe-Ofqui fault system, Southern Andes. Int. Geol. Rev. 55, 1384–1400. doi:10.1080/00206814.2013.775731
Scholz, C. H. (2015). On the stress dependence of the earthquake b value. Geophys. Res. Lett. 42, 1399–1402. doi:10.1002/2014GL062863
Schorlemmer, D., Wiemer, S., and Wyss, M. (2005). Variations in earthquake-size distribution across different stress regimes. Nature 437, 539–542. doi:10.1038/nature04094
Seropian, G., Kennedy, B. M., Walter, T. R., Ichihara, M., and Jolly, A. D. (2021). A review framework of how earthquakes trigger volcanic eruptions. Nat. Commun. 12, 1004. doi:10.1038/s41467-021-21166-8
Sielfeld, G., Lange, D., and Cembrano, J. (2019). Intra-Arc crustal seismicity: seismotectonic implications for the southern Andes volcanic zone, Chile. Tectonics 38, 552–578. doi:10.1029/2018TC004985
Sielfeld, G., Cembrano, J., and Lara, L. (2017). Transtension driving volcano-edifice anatomy: insights from Andean transverse-to-the-orogen tectonic domains. Quat. Int. 438, 33–49. doi:10.1016/j.quaint.2016.01.002
Sparks, R. S. J. (2003). Forecasting volcanic eruptions. Earth Planet. Sci. Lett. 210, 1–15. doi:10.1016/S0012-821X(03)00124-9
Stern, C. R. (2004). Active andean volcanism: its geologic and tectonic setting. Rev. Geol. Chile 31. doi:10.4067/S0716-02082004000200001
Sukrisna, B., Brotopuspito, K., Wahyudi, W., Suryanto, W., and Sunardi, B. (2013). Analysis of seismic activity 1973-2012 in the volcanic arc system of west nusa tenggara (NTB) to examine the rinjani volcano activity (malang).
Tardani, D., Roulleau, E., Pinti, D. L., Pérez-Flores, P., Daniele, L., Reich, M., et al. (2021). Structural control on shallow hydrogeochemical processes at Caviahue-Copahue Volcanic Complex (CCVC), Argentina. J. Volcanol. Geotherm. Res. 414, 107228. doi:10.1016/j.jvolgeores.2021.107228
Tobyáš, V., and Mittag, R. (1991). Local magnitude, surface wave magnitude and seismic energy. Studia Geophys. Geod. 35, 354–357. doi:10.1007/BF01613981
van der Elst, N. J. (2021). B-positive: A robust estimator of aftershock magnitude distribution in transiently incomplete catalogs. J. Geophys. Res. Solid Earth 126. doi:10.1029/2020JB021027
Waite, G. P. (2021). “Very-long-period seismicity at active volcanoes: source mechanisms,” in Encyclopedia of earthquake engineering. Editors M. Beer, I. A. Kougioumtzoglou, E. Patelli, and I. S.-K. Au (Berlin, Heidelberg: Springer Berlin Heidelberg), 1–12. doi:10.1007/978-3-642-36197-5_46-1
Wassermann, J. (2012). Volcano seismology. New Manual of seismological observatory practice 2 (NMSOP2), 7 mb, 77 pages10.2312/GFZ.NMSOP-2_CH13. Artwork size: 7 mb. Berlin: Medium: application/pdf Publisher: Deutsches GeoForschungsZentrum GFZ, 77.
Keywords: volcano-tectonic events, b-value, earthquake-volcano interaction, Copahue volcano, unrest phases
Citation: Farías C, Lazo J, Basualto D, Saavedra M, Muñoz-Quiroz F, Zúñiga-Urrea L, Martínez-Bravo R, Huentenao-Inostroza I and Sáez-Opazo R (2023) One decade of b-value variations from volcano-tectonic seismicity as an early indicator of episodes of crisis in a volcano: the case of Copahue, Southern Andes. Front. Earth Sci. 11:1181177. doi: 10.3389/feart.2023.1181177
Received: 07 March 2023; Accepted: 15 August 2023;
Published: 30 August 2023.
Edited by:
Claudia Pavez-orrego, SINTEF, NorwayCopyright © 2023 Farías, Lazo, Basualto , Saavedra, Muñoz-Quiroz, Zúñiga-Urrea, Martínez-Bravo, Huentenao-Inostroza and Sáez-Opazo. This is an open-access article distributed under the terms of the Creative Commons Attribution License (CC BY). The use, distribution or reproduction in other forums is permitted, provided the original author(s) and the copyright owner(s) are credited and that the original publication in this journal is cited, in accordance with accepted academic practice. No use, distribution or reproduction is permitted which does not comply with these terms.
*Correspondence: Cristian Farías, Y3Jpc3RpYW4uZmFyaWFzQHVjdC5jbA==