- 1School of Civil Engineering and Architecture, Shaanxi University of Technology, Hanzhong, Shaanxi, China
- 2Research Center of Geotechnical, Environment and Geological Hazards Control in Qinling-Daba Mountains, Shaanxi University of Technology, Hanzhong, China
- 3China Electronic Research Institute of Engineering Investigations and Design, Xi’an, China
- 4Shaanxi Provincial Soil Engineering Technology Research Center, Xi’an, China
- 5Department of Civil and Environmental Engineering, Worcester Polytechnic Institute, Worcester, MA, United States
In this paper, an experimental approach is employed to investigate the reinforcing impact of geogrids on the dry-shrinkage cracking of loess. At various evaporation temperatures and for varying specimen thicknesses, the evolution of the surface fissures induced in the loess samples with and without geogrids was monitored and analyzed. According to the findings, the evaporation rate of the samples increased when the evaporation temperature was increased, and the thickness of the samples was reduced under the same conditions. At higher temperatures, geogrids had a substantial impact on reducing the evaporation rate and suppressing the dry-shrinkage cracks. The occurrence and development of the dry-shrinkage cracks of loess are divided into three stages: the formation stage, the acceleration stage, and the stabilization stage. The maximum crack width was reduced by 20%–34% for different sample thicknesses. The ratio of the number of cracks to the number of fracture nodes in the reinforced soil was lower than that of the unreinforced soil. This reduction ratio changed further from 5.6% to 24.4% with the increased thickness. The geogrids can effectively reduce the evaporation rate of water and the development rate of the dry-shrinkage cracks in loess. Consequently, the crack distribution in the loess samples is uniform and prevents the formation of large and long cracks. Using a 3D discrete element model, it is feasible to simulate the loess before and after the geogrid reinforcement.
1 Introduction
One of the major factors influencing the physical and engineering properties of unsaturated loess is water (Mohammad and Al-Lamy, 2015; Guo et al., 2018; Hu et al., 2021a; Hu et al., 2021b; Hu et al., 2022). In engineering applications, soil cracking induced by evaporation is quite common. This can be detrimental to many geotechnical structures (Sima et al., 2014; Vo et al., 2018; Al-Jeznawi et al., 2021), which can severely undermine the performance and safety of several civil engineering infrastructures. Under the combined impact of evaporation-induced cracking and relatively high permeability due to its high porosity, shrinkage cracks can penetrate deep into loess strata after repeated cycles of drying and wetting. Although the cracking of clayey mud is intriguing due to its ordered pattern, formation, and dynamics, it has significant implications for various geotechnical engineering problems. For instance, cracking in compacted clayey soils provides preferred pathways for water, which significantly increases its hydraulic permeability. Furthermore, cracking can drastically reduce the shear strength and stiffness of compacted clayey soil as well as the adhesion between the soil and foundation structures. Horgan et al. (Horgan and Young, 2000) developed a model to simulate the formation and development of dry-shrinkage fissures and considered geometric parameters that affect the development of fissures. Ringrose-Voase et al. (Ringrose-Voase and Sanidad, 1996) proposed a novel method for the quantitative assessment of surface cracks. Voge et al. (Vogel et al., 2005) employed a dynamic model to study the dynamic characteristics of the development process of cohesive soil shrinkage cracks. Based on Biot’s consolidation theory, Shuichiro Yoshida et al. (Yoshida and Adachi, 2004) predicted the position of dry soil shrinkage cracks between crop rows. Moreover, there were several researchers (Tang et al., 2007; Shi et al., 2009; Fattah et al., 2014) who investigated the water shrinkage of cohesive soil. For example, Shi et al. (Shi et al., 2009) used image-processing techniques to investigate the effect of temperature on the propagation of desiccation cracks in clayey soil. Tang et al. (Tang et al., 2007) studied the effects of wetting-drying cycles and soil composition on soil shrinkage.
Loess is a special kind of clay with a high concentration of soluble salt, large pores, and easy collapsibility. It is widely distributed in Northwestern China. The dry shrinkage and cracks of loess are more severe and complex due to their special characteristics. The soluble salt precipitates out as a solid after the water evaporates and then dissolves again when it comes into contact with water (Fattah et al., 2014). Besides, its large pore structure makes it easier to develop shrinkage cracks.
The challenge with dry shrinkage cracks in loess is determining how to eliminate or weaken such cracks from an engineering perspective. Geogrids (Yang et al., 2008; Yang et al., 2009), fiber (Abdulrahman et al., 2021), are extensively used in clay reinforcement research and applications, which include shallow foundation reinforcement, pavement reinforcement, and highway embankment reinforcement (Zhu et al., 2013; Mi et al., 2014). Theoretically, the geogrids, which have a special mesh structure, can restrain the lateral displacement of the loess, effectively controlling the shrinkage cracks.
However, no information has been reported in the literature regarding the development and evolution of the loess shrinkage cracks or the role of geogrids in inhibiting them. For loess with strong water sensitivity, there is a knowledge gap in the development process and generation mechanism of its shrinkage cracks, as well as the suppression mechanism of geogrids.
In this paper, we have the following research objectives: first of all, the impact of sample thickness (the depth of embedded geogrid), environmental temperature, and geogrid on the evaporation of water in the soil is examined; Additionally, the development and evolution of shrinkage cracks are considered, which is the basic issue with researching the geogrid to restrain the dry shrinkage of loess; last but not least, based on the parallel bonding model, a discrete element model of loess shrinkage cracks was established, with the aim of providing effective exploration for analyzing the problem of shrinkage cracks from the particle and numerical levels.
2 Methodology
2.1 Materials in the experiment
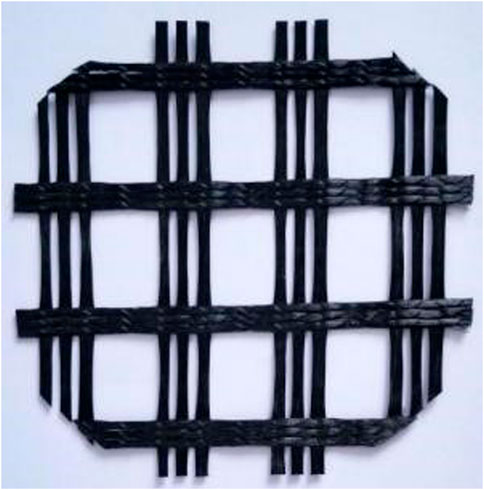
In this study, Q3 loess (formed during the Late Pleistocene) is used, which is extracted from a depth of 5 m in a foundation pit in Xi’an City. Table 1 presents the physical properties of the soil samples. The soil samples were pulverized after air drying and passed through a 2 mm sieve. Moreover, in this paper, a two-way polyester warp-knitted polyester geogrid produced by Shandong Hangtie Engineering Materials Co., Ltd. in China was employed. Figure 1 illustrates the geogrid, and Table 2 lists the mechanical properties of the geogrid used in this study.
2.2 Sample preparation
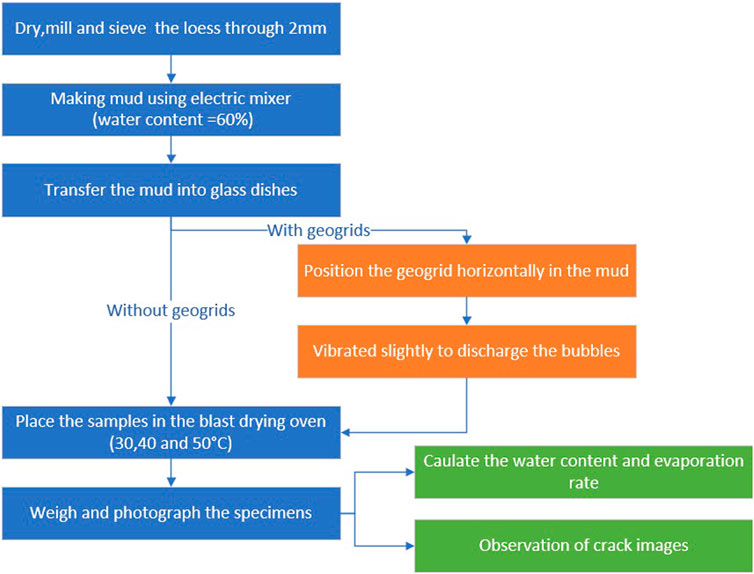
As with references (Sima et al., 2014; Cheng et al., 2020), the procedure for the sample preparation is as follows: (a) Dry the loess, mill it, and sieve it through 2 mm; (b) using an electric mixer, form loess samples (with a water content of 60%) that resemble mud; (c) Use a spoon to transfer the loess samples into glass dishes, ensure that the sample thickness is controlled by the slurry volume, and weigh the samples; (d) once the temperature reaches the targeted values, place the samples in the blast drying oven; (e) weigh and photograph the specimens at intervals (1–5 h, which depends on the changing water content). The change in moisture content and the rate of evaporation are determined using the weight of the sample, which is measured in real-time. Specifically, assuming the initial moisture content is
It must be noted that the temperature levels were maintained for the tests conducted during the whole process of evaporation, and the temperature range was limited (from 30°C to 50°C). However, dry shrinkage in actual loess structures was considerably impacted by factors such as wind speed and climate. Therefore, it is not feasible in real-world applications to maintain a constant sample temperature for an extended period. Nevertheless, the sample temperature was kept constant during the whole process of evaporation to study the effect of temperature on the dry-shrinkage cracking of loess.
2.3 Discrete element model (DEM) simulations
In DEM simulations, the particle flow code (PFC) is utilized to provide insight into the formation of cracks and the development of patterns at the particle level within loess. Furthermore, it reveals the role played by geogrid during the process of crack formation and development in loess. The DEM model was established using a bond contact model. However, in this study, only a phenomenological model is established, and there is no detailed calibration of the microscopic parameters. To gain insight into the effect of geogrids in restraining cracks, the microscopic parameters are the same with or without geogrids. Other researchers used the gradation amplification technique to effectively run the 3D model for particle grading.
3 Results
3.1 Water content and water evaporation rate
The water content and the evaporation rate of all samples at different temperatures of 30, 40, and 50°C were determined at various periods based on the collected data, as shown in Figure 3.
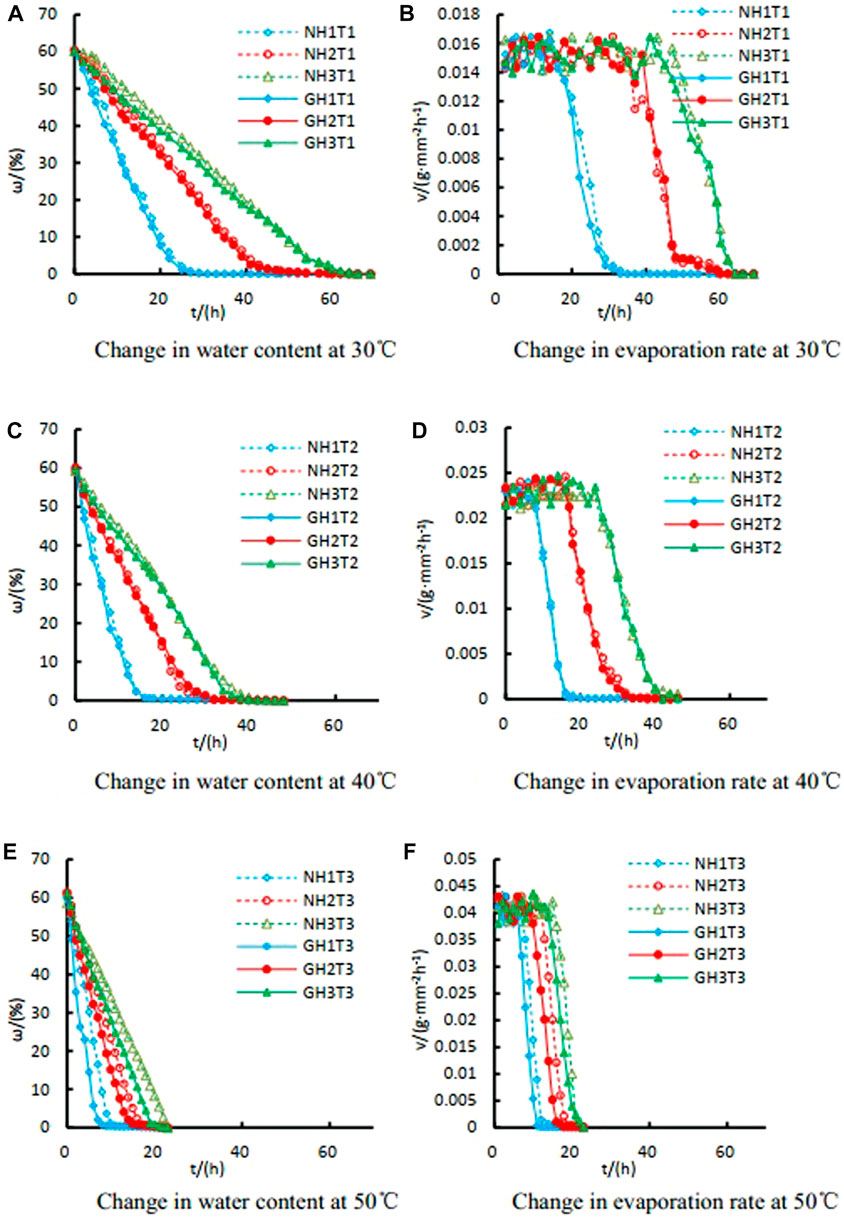
FIGURE 3. The water content and evaporation rate versus time period at various temperatures. (A) Change in water content at 30°C; (B) Change in evaporation content at 30°C; (C) Change in water content at 40°C; (D) Change in evaporation content at 40°C; (E) Change in water content at 50°C; (F) Change in evaporation content at 50°C.
Figures 3A, C, E show that the water content curves of all samples followed the same patterns, in which the water content varied linearly with time when it reached 2% or more. Meanwhile, the water content curve remained nearly horizontal for water content below 2%. Therefore, the water content curves had an inflection point. This is similar to the general trend in Reference (Sima et al., 2014), except that it takes longer for loess to attain zero water content due to its special pore structure. The images captured from the samples during the evaporation stage indicated no change in the cracks after this inflection point, implying that the cracks remained stable.
To determine the turning point of the water content curve, the water content curves of all the samples were analyzed. Additionally, the time required to reach the turning point was determined. At the temperature levels of 30°C and 40°C, the presence or absence of the grid had a slight influence on the time required for reaching the stable crack stage. Meanwhile, for the samples tested at a temperature of 50°C, the time required to reach the turning point was dependent on the presence or absence of grids. In comparison to the non-grid samples, the samples reinforced with grids required a shorter time to attain the stable crack stage.
According to a comparison between the evaporation rate curves of the samples, the evaporation rates of the samples experienced small fluctuations at the initial time stage, followed by a rapid drop later. For instance, the initial evaporation rates of all samples tested at 30°C were within the range of 0.012–0.018 g/mm2h-1. Meanwhile, the initial evaporation rates of the sample tested at 40°C and 50°C were in the ranges of 0.02–0.025 and 0.035–0.045 g/mm2h-1, respectively. As indicated in Figures 2B, D, F, the initial evaporation rates of the samples tested at a certain temperature were independent of the sample thickness and the presence of grids. However, the evaporation rate was strongly dependent on the sample thickness and the presence or absence of grids from the point when the evaporation rate curves began to decline steeply. Furthermore, the thicker samples required a longer time to start rapid decay, particularly at 50°C. In general, due to the restriction of the soil by the geogrid, the evaporation rate slows down. This decrease is evident, especially at higher temperatures.
3.2 Dry-shrinkage crack image analysis
The main factor that changes the structural properties of soil is the formation and development of fissures. Although there are certain regularities in this process, it is extremely complicated. Understanding the laws governing fissures is beneficial in studying the formation mechanism of fissures and the migration of water in soil (Sima et al., 2014). Therefore, for a better understanding of the formation and development of fissures, the images of the samples that were collected were examined.
3.2.1 Geogrid suppression effect on dry-shrinkage cracks
Figures 4, 5 display the final morphologies of the H2 and H3 sample cracks tested under 40°C and 50°C, respectively.
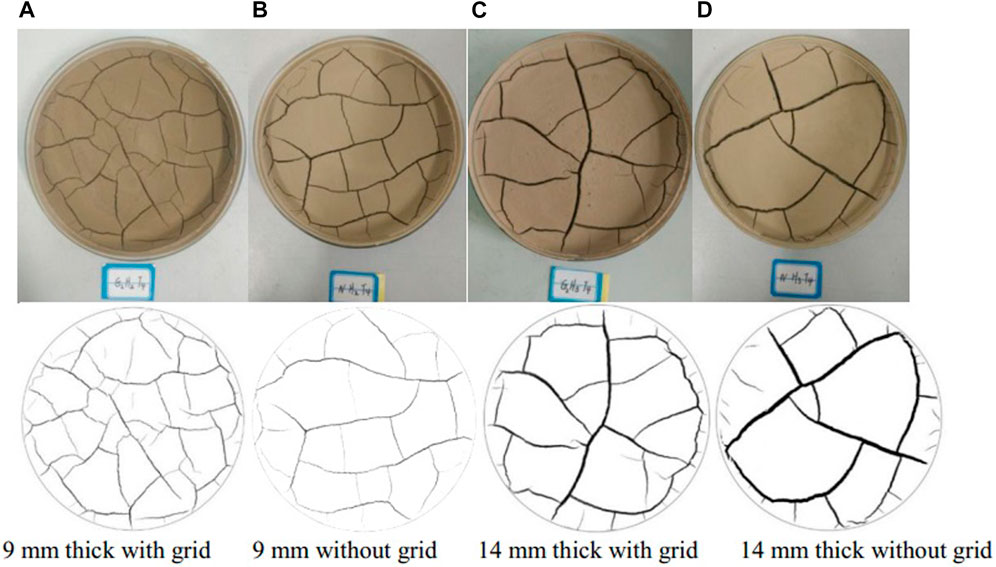
FIGURE 4. Comparison of the cracks in the samples with different thicknesses and at the same moisture content tested under 40°C (test and black & white diagrams). (A) 9 mm thickness with grid; (B) 9 mm thickness without grid; (C) 14 mm thickness with grid; (D) 14 mm thickness without grid.
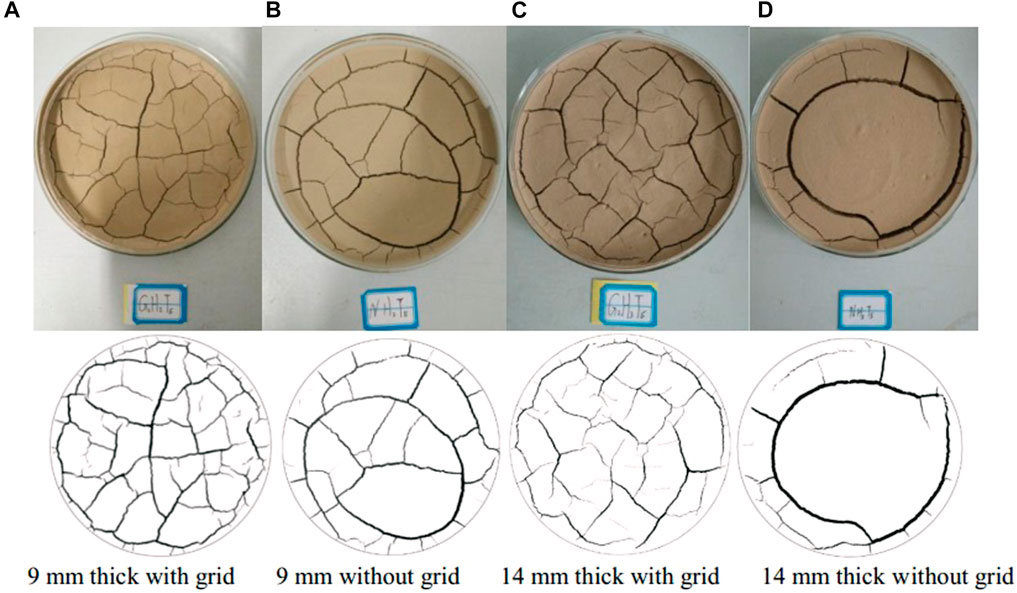
FIGURE 5. Comparison of the cracks in the samples with different thicknesses and at the same moisture content tested under 50°C (test and black & white diagrams). (A) 9 mm thickness with grid; (B) 9 mm thickness without grid; (C) 14 mm thickness with grid; (D) 14 mm thickness without grid.
As shown in Figures 4, 5, the samples with grids exhibited more cracks with uniform patterns than those without a grid under the same temperature and thickness conditions. Furthermore, the reinforced samples (with grids) had considerably narrower cracks than the samples without grids. Moreover, increasing the thickness of the sample reduced the number of cracks while increasing the width of the cracks. In practice, long and wide cracks can provide loci for water penetration into the soil, and rain can swiftly flow into the long and wide cracks. Consequently, natural disasters like landslides, collapses, and mudslides occur, which are fatal to construction safety and engineering quality.
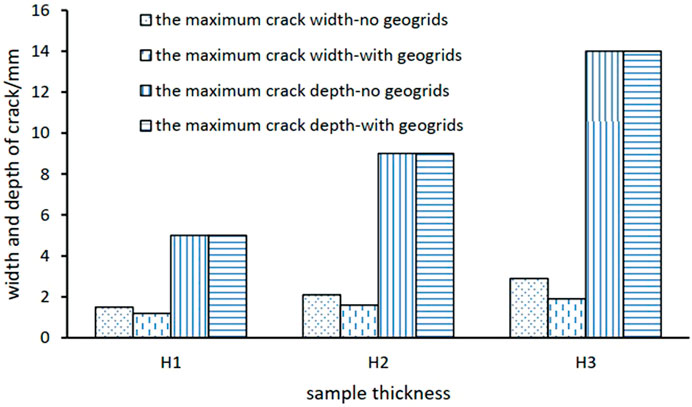
The maximum width and depth of dry-shrinkage cracks in the specimens reflect the reinforcing effect of geogrids. For instance, Figure 6 presents the measurement of the maximum width and depth of the cracks in samples of various thicknesses that were tested at a temperature of 40°C. The samples ranged in thickness from 9 to 14 mm, and the cracks penetrated the bottom of the samples once the shrinkage stabilized. Therefore, the specimens with and without grids had the same crack depth. However, the maximum crack width was significantly influenced by the geogrids. The maximum crack width was observed to be reduced by 20%, 24%, and 34% for the samples with grids and with thicknesses of 5, 9, and 14 mm, respectively, than for the samples without grids. This demonstrates that geogrid significantly suppressed the dry-shrinkage cracks of the loess. This impact was amplified with an increased sample thickness.
3.2.2 Analysis of crack development in loess samples
To obtain completely dry samples, the fully saturated loess samples were dehydrated in this study. The fissures progressed during this dehydration process. To study the cracks during dehydration, the H3 sample without grids that was tested at a temperature of 30°C was assessed. Figure 7 displays the results. It should be noted that before the first 32 h, the dry shrinkage cracks of the soil sample were not visible to the naked eye. This may be because only the moisture in the macropores of the loess reduces in this relatively long process. Due to the larger matrix suction, the shrinkage cracks begin to appear as the moisture in the smaller pores begins to diminish.
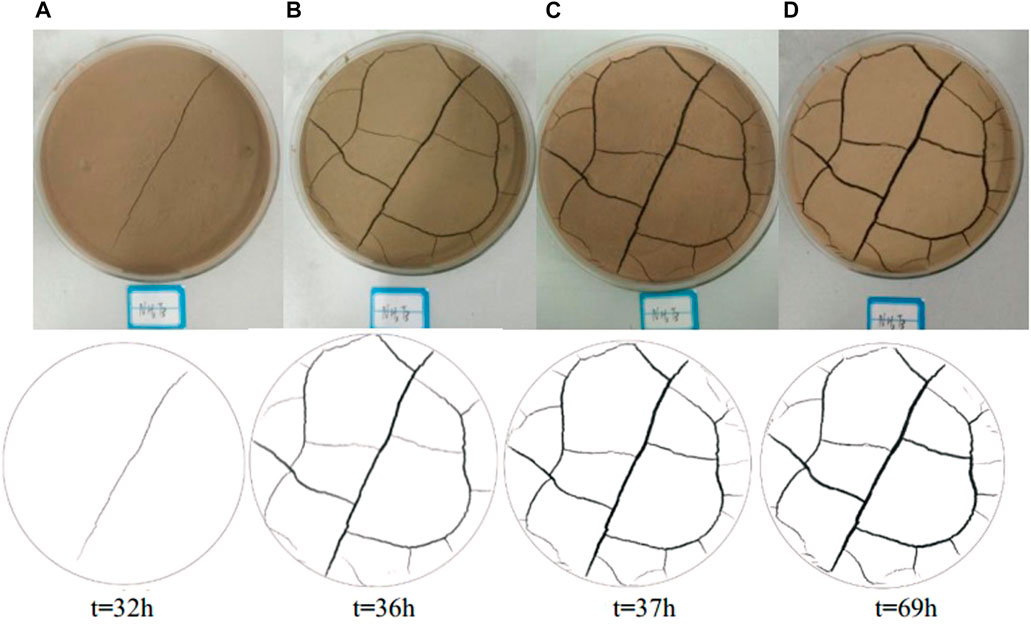
FIGURE 7. Fracture patterns of the NH3T3 sample at different time periods (test and black & white diagrams). (A) t=32 h; (B) t=36 h; (C) t=37 h; (D) t=69 h.
As per the analysis of the images obtained for the sample NH3T3, the fracture pattern of the sample at 37 h was approximately the same as that at 69 h. This indicates that no new cracks were produced after 37 h. However, the crack width and depth gradually increased after 37 h. All the samples adhered to the same rule as per the observation of the images collected from the samples. Therefore, the fracture development in the loess samples is divided into three stages. The first stage, which is attributed to crack formation, is characterized by the formation of cracks and a rapid increase in the number of cracks. However, the majority of the cracks are still relatively narrow. The second stage is related to crack acceleration. In this stage, the cracks that have already formed in the previous stage are widened and deepened. However, a limited number of cracks are formed. The cracks are stable in the third stage. Although the moisture content of the samples is still reduced at this stage, the number, width, and depth of the cracks are no longer increasing. To investigate the suppressing impact of the dry-shrinkage cracks by geogrids, the initiation times of each stage and the corresponding moisture contents of the samples that were tested at the temperature of 40 °C were analyzed. The results are presented in Table 4.

TABLE 4. The initiation times of each stage and the corresponding moisture contents of the samples tested under the temperature of 40°C.
Table 4 shows that geogrids contribute significantly to the development of cracks in the loess samples. While the geogrid accelerated the formation of cracks in thin samples, it decelerated the formation of cracks in thick samples. This may be because the geogrid “segmented” the soil sample while it was relatively thin, making the initial stress more concentrated and intensifying the formation of shrinkage cracks. The impact of restraining shrinkage cracks is noticeable in the thicker specimens, where the grid plays a dominant role in restraining the specimens. It is found that there will be several retract when the loess produces dry shrinkage cracks. With the evaporation of water (reduction of water content), the attraction between soil particles (matrix suction) will become larger, so soil cracks will be generated. The function of the geogrid is to divide the original retract into more retract (see it in Figure 8), so the number of shrinkage cracks will become more and narrower.
Engineers may find it crucial to understand the significance of the thickness of the “protective layer” while constructing the geogrid-reinforced loess. Therefore, the thickness of the protective layer must attain a certain thickness to effectively benefit from the suppressing effect of geogrids on dry shrinkage cracks. It must be noted that the required “protective layer” thickness, which must be addressed by field testing or modeling, could not be determined in this study due to the limitations involved in the laboratory tests.
3.2.3 Analysis of the number of nodes and cracks in the fracture
The number of cracks and the number of nodes followed a regular pattern in the dry-shrinkage cracks of the soil. Analysis was done on the number of cracks and the number of nodes when the dry-shrinkage cracks of the loess were stable (third stage). The ratio
where
The value of
Table 4 demonstrates that the number of cracks and the number of nodes in the samples decreased as the thickness of the samples increased, irrespective of whether the soil sample was reinforced or not. Although the number of cracks and the number of crack nodes were reduced, the captured images reveal that the crack widths increased with increasing sample thickness. Furthermore, the analysis of the
4 DEM simulations
4.1 DEM model formulation
In the DEM, drying shrinkage is always simulated at the particle level by imposing an explicit relationship between the particle sizes and time (Peron et al., 2008). It must be noted that the real particle size in the drying process is not decreasing. The variation of the particle radius R with respect to time is considered in the form (El Youssoufi et al., 2005).
where R0 (unit is m) denotes the radius at t = 0,
The radius decrease rate for the particle radius in the DEM should be
4.2 Contact model
In this paper, the loess grains are simulated using the linear contact bond model. As depicted in Figure 9. Kn and Ks denote the normal and tangential stiffness, respectively. TF and SF denote the tensile and shear strengths, respectively.
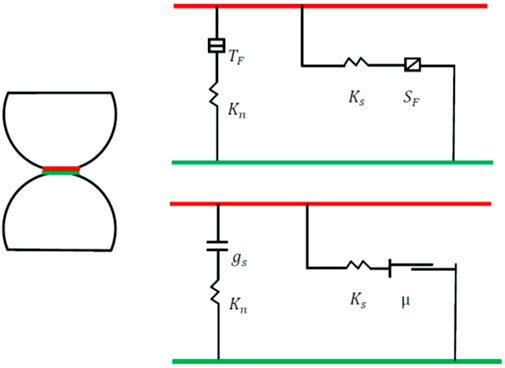
FIGURE 9. Linear contact bond model (Itasca Particle, 2018).
4.3 Simulation of drying shrinkage without and with geogrids
Figure 10 displays the DEM results at the end of the dry state. Figures 10A, C depict the cracks without geogrids, and Figures 10B, D depict the situation with geogrids. It is observed that the overall pattern of the DEM results agrees with the experimental results. The displacement of the particle is represented by different colors. The dark blue color represents zero displacements. The hotter the color, the greater the displacement. The crack divides the soil into different parts, and the displacement of the center of each piece is extremely small. This implies that the particles shrink from the sides to the center with the evaporation of the water in the soil particles.
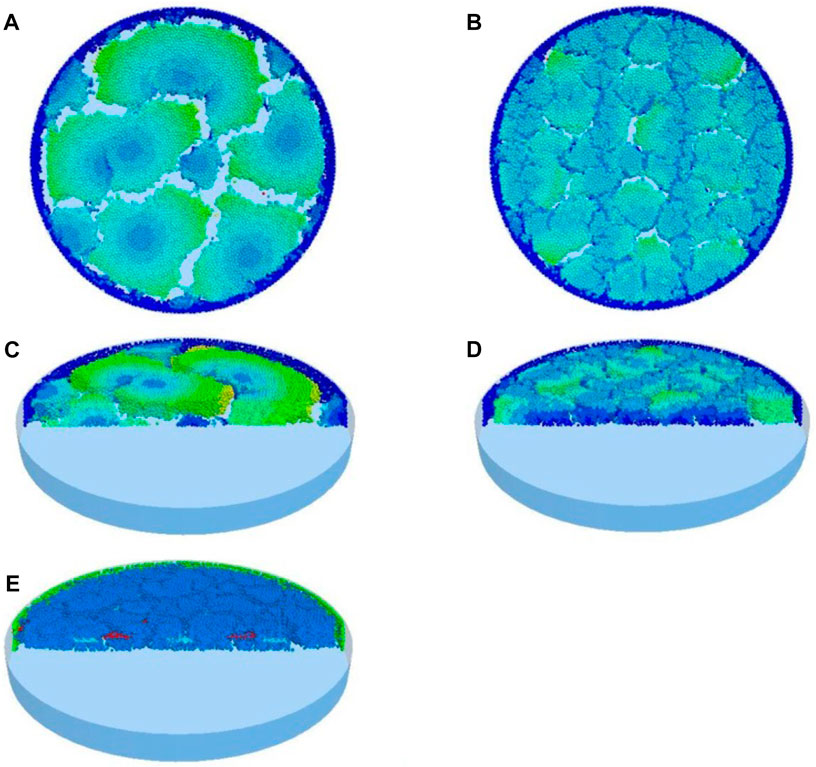
FIGURE 10. DEM results without and with geogrid. (A) Plan view without geogrid; (B) Plan view with geogrid; (C) Oblique cutting view without geogrid; (D) Oblique cutting view with geogrid (In A, B, C and D, The color represents the displacement of soil particles, and the warmer the color, the greater the displacement); (E) Oblique cutting view with geogrid (blue represents soil particles, red represents geogrid).
However, the geogrid substantially hinders the shrinkage of the soil when the loess is reinforced by the geogrid. This is apparent in the narrowing of the cracks and the stronger soil uniformity. Figure 10E illustrates a cross-sectional view of geogrid-reinforced loess for clarity. The red and light blue particles in the middle are the geogrid ribs in the vertical and horizontal directions, respectively.
5 Conclusion
In this paper, the dry-shrinkage cracks of loess were analyzed experimentally for reinforced and unreinforced loess at different dehydration temperatures and sample thicknesses. The following are the main conclusions.
(1) The reinforcement of samples with geogrids did not have a considerable effect on the initial dehydration rate of loess. However, the dehydration rate decay time was accelerated, particularly at 50°C, implying that geogrids promoted internal water migration at higher temperatures. This may be because at higher temperatures, the number of cracks increases, leading to an increase in the surface area of water evaporation.
(2) Under the same conditions of temperature and sample thickness, the number of cracks in the reinforced soil was more uniform, and the width of the cracks was smaller. This shows that the geogrid rendered the interior of the loess more uniform during dehydration.
(3) The development of fissures was divided into three stages. The first stage is the formation stage during which the cracks in the sample developed. In the second stage, the cracks widened and deepened by lowering the water content of the samples. In the third stage, the evaporation rate was extremely low, and the dry-shrinkage cracks remained almost unaltered.
(4) The ratio of the number of cracks to the number of fracture nodes (
(5) The benefit of discrete element numerical simulation is that it provides an understanding of the soil shrinkage process at the micro level, particularly the specific characteristics of the displacement movement and mechanical contact of the particles during the shrinkage process. This will be further examined in future studies.
The biggest highlight of this paper is the exploration of the theoretical feasibility of geogrids in alleviating loess shrinkage cracks, as well as the feasibility of using discrete element methods to analyze this problem. However, it is necessary to conduct experiments on a larger scale, such as using geogrids for reinforcement when filling loess embankments. In addition, this article did not analyze the shear strength and compression characteristics of geogrid reinforced loess. The future work will focus on the above-mentioned shortcomings.
Data availability statement
The original contribution presented in the study are included in the article/supplementary material, further inquiries can be directed to the corresponding authors.
Author contributions
For research articles with several authors, a short paragraph specifying their individual contributions must be provided. The following statements should be used: ‘conceptualization, HG and MT; methodology, HG; software, KY; validation, CG; formal analysis, SW; resources, YN; data curation, KY; writing—original draft preparation, HG; writing—review and editing, HG, SW, CG, and KY. All authors contributed to the article and approved the submitted version.
Funding
This research was funded by Shaanxi Province Key R&D Program, grant number 2023-YBSF-324; Research Project of China Electronic Research Institute of Engineering Investigations and Design, grant number 2020-DKY-W02.
Conflict of interest
The authors declare that the research was conducted in the absence of any commercial or financial relationships that could be construed as a potential conflict of interest.
Publisher’s note
All claims expressed in this article are solely those of the authors and do not necessarily represent those of their affiliated organizations, or those of the publisher, the editors and the reviewers. Any product that may be evaluated in this article, or claim that may be made by its manufacturer, is not guaranteed or endorsed by the publisher.
References
Abdulrahman, S. M., Fattah, M. Y., and Ihsan, E. A. (2021). Influence of plastic fiber on the geotechnical properties of gypseous soil, 367–374.
Al-Jeznawi, D., Sanchez, M., and Jal-Taie, A. (2021). Using image analysis technique to study the effect of boundary and environment conditions on soil cracking mechanism. Geotechnical Geol. Eng. 39 (1), 25–36. doi:10.1007/s10706-020-01376-5
Cheng, Q., Tang, C. S., and Zhu, C. (2020). Drying-induced soil shrinkage and desiccation cracking monitoring with distributed optical fiber sensing technique[J]. Bulletin of Engineering Geology and the Environment.
El Youssoufi, M. S., Delenne, J.-Y., and Radjai, F. (2005). Self-stresses and crack formation by particle swelling in cohesive granular media. Phys. Rev. E 71 (5), 051307. doi:10.1103/physreve.71.051307
Fattah, M. Y., Al-Ani, M. M., and Al-Lamy, M. (2014). Studying collapse potential of gypseous soil treated by grouting. Soils Found. 54 (3), 396–404. doi:10.1016/j.sandf.2014.04.008
Guo, H., Li, J., Wang, P. C., and Guo, R. (2018). Estimation of soil-water characteristic curve for undisturbed loess soil. China Sci. 13, 37–40. (in Chinese). doi:10.3969/j.issn.2095-2783.2018.01.008
Horgan, G. W., and Young, I. M. (2000). An empirical stochastic model for the geometry of two-dimensional crack growth in soil (with Discussion). Geoderma 96, 263–276. doi:10.1016/s0016-7061(00)00015-x
Hu, W., Cheng, W. C., Wen, S., and Yuan, K. (2021a). Revealing the enhancement and degradation mechanisms affecting the performance of carbonate precipitation in EICP process. Front. Bioeng. Biotechnol. 9, 750258. doi:10.3389/fbioe.2021.750258
Hu, W., Cheng, W. C., Wang, L., and Mizanur Rahman, M. (2021b). Effects of chemical contamination on microscale structural characteristics of intact loess and resultant macroscale mechanical properties. Catena 203, 105361. doi:10.1016/j.catena.2021.105361
Hu, W., Cheng, W. C., Wang, L., and Xue, Z. F. (2022). Micro-structural characteristics deterioration of intact loess under acid and saline solutions and resultant macro-mechanical properties. Soil Tillage Res. 220, 105382. doi:10.1016/j.still.2022.105382
Mi, H. J., Wang, Y. P., and Luo, L. R. (2014). Analysis of stability and influencing factors of geogrid reinforced high steep slope embankment. J. China & Foreign Highw. 34, 44–48. (in Chinese).
Mohammad, Y. F., and Al-Lamy, M. T. A. (2015). Wetting and drying collapse behaviour of collapsible gypseous soils treated by grouting. Arabian J. Geosciences 8, 2035–2049. doi:10.1007/s12517-014-1329-7
Peron, H., Delenne, J. Y., Laloui, L., and El Youssoufi, M. (2008). Discrete element modelling of drying shrinkage and cracking of soils. Comput. Geotechnics 36 (1), 61–69. doi:10.1016/j.compgeo.2008.04.002
Ringrose-Voase, A. J., and Sanidad, W. B. (1996). A method for measuring the development of surface cracks in soils: Application to crack development after lowland rice. Geoderma 71, 245–261. doi:10.1016/0016-7061(96)00008-0
Shi, B., Tang, C. S., Wang, B. J., and Jiang, H. T. (2009). Development and mechanism of desiccation cracking of clayey coilunder cifferent temperatures. Geol. J. China Univ. 15, 192–198. (in Chinese).
Sima, J., Jiang, M., and Zhou, C. (2014). Numerical simulation of desiccation cracking in a thin clay layer using 3D discrete element modeling. Comput. Geotechnics 56 (3), 168–180. doi:10.1016/j.compgeo.2013.12.003
Tang, C. S., Shi, B., Liu, C., and Bao, B. J. (2007). Factors affecting the surface cracking in clay due to drying shrinkage. J. Hydraulic Eng. 38, 1186–1193. (in Chinese).
Vo, T. D., Pouya, A., and Hemmati, S. (2018). Numerical modelling of desiccation cracking of clayey soil by using cohesive fracture model[C]. Second Pan-American Conference on Unsaturated Soils.
Vogel, H. J., Hoffmann, H., Leopold, A., and Roth, K. (2005). Studies of crack dynamics in clay soil: II. A physically based model for crack formation. Geoderma 125, 213–223. doi:10.1016/j.geoderma.2004.07.008
Yang, C. Z., Yang, P., Zhang, K. S., and Xu, B. (2008). Mechanism and application of Geogrid to enhance stability of rockfill embankment. J. Northeast For. Univ. 36, 65–67. (in Chinese).
Yang, G. Q., Zhou, Y. T., Zhou, Q. Y., and Xue, X. H. (2009). Experimental research on geogrid reinforced Earth retaining wall. Rock Soil Mech. 30, 206–210. (in Chinese).
Yoshida, S., and Adachi, K. (2004). Numerical analysis of crack generation in saturated deformable soil under row-planted vegetation. Geoderma 120, 63–74. doi:10.1016/j.geoderma.2003.08.009
Keywords: loess, dry-shrinkage cracks, geogrid, strengthening, discrete element method (DEM)
Citation: Guo H, Yang K, Wang S, Guo C, Nan Y and Tao M (2023) Effect of geogrid on dry-shrinkage cracking of loess. Front. Earth Sci. 11:1180045. doi: 10.3389/feart.2023.1180045
Received: 05 March 2023; Accepted: 02 May 2023;
Published: 15 May 2023.
Edited by:
Lei Wang, University of Cincinnati, United StatesReviewed by:
Mohammed Y. Fattah, University of Technology, Iraq, IraqWenle Hu, Xi’an University of Architecture and Technology, China
Copyright © 2023 Guo, Yang, Wang, Guo, Nan and Tao. This is an open-access article distributed under the terms of the Creative Commons Attribution License (CC BY). The use, distribution or reproduction in other forums is permitted, provided the original author(s) and the copyright owner(s) are credited and that the original publication in this journal is cited, in accordance with accepted academic practice. No use, distribution or reproduction is permitted which does not comply with these terms.
*Correspondence: Yalin Nan, bmFuLnlhbGluQGRreTUzLmNvbQ==; Mingjiang Tao, dGFvbWpAd3BpLmVkdQ==
 Hong Guo
 Kuibin Yang
 Shaofei Wang
 Chen Guo1,2
 Mingjiang Tao
