
94% of researchers rate our articles as excellent or good
Learn more about the work of our research integrity team to safeguard the quality of each article we publish.
Find out more
ORIGINAL RESEARCH article
Front. Earth Sci., 28 June 2023
Sec. Atmospheric Science
Volume 11 - 2023 | https://doi.org/10.3389/feart.2023.1178461
This article is part of the Research TopicModelling, Simulating and Forecasting Regional Climate and Weather, volume IIView all 8 articles
 Tugba Ozturk1*
 Emine Canbaz2,3Başak Bilgin3,4
 Dominic Matte5
 M. Levent Kurnaz3,6
 Jens Hesselbjerg Christensen7,8
This work investigates the scalability of extreme temperatures over the European domain with global warming levels. We have used the EURO-CORDEX ensemble of regional model simulations at 0.11° resolution for daily minimum and maximum temperatures to analyze future changes in extreme weather daily events. Scaling with the annual mean global warming modeled by the driving GCM was applied to future extreme temperature indices changes. Regional changes in each index were scaled by corresponding global warming levels obtained from GCMs. This approach asserts that regional patterns of climate change and average global temperature change are linearly related. It can provide information regarding climate change for periods or emission scenarios when no simulations exist. According to the results, the annual minimum of the lowest temperature of the day (TNn) increases more than the annual maximum of the highest temperature of the day (TXx) for Europe. The multi-model mean of the changes in scaled patterns of extreme temperatures emerges early, around 2020, even before it becomes robust. Individual scaled patterns of TNn and TXx emerge from around 2040.
Differences in climate models and their systematic model errors make obtaining useful information about climate change more difficult. Typically, projected climate change is portrayed for a particular time. The baseline scenario [e.g., RCP (van Vuuren et al., 2011) for CMIP5 and/or SSP (Riahi et al., 2017) for CMIP6] that was employed, the structural uncertainty related to model climate sensitivity and their internal variability are three noteworthy sources of uncertainty in estimates for such defined future periods. However, estimates about global mean temperature changes are more crucial for climate change and mitigation policies (i.e., global warming levels, GWLs). For instance, IPCC’s SR1.5 report assessed regional warming and precipitation variation patterns for 1.5°C and 2°C warming in globally averaged surface temperatures compared to preindustrial levels of 1850–1900 (Hoegh-Guldberg et al., 2018). Thus, analyzing a given global temperature increase, the geographical patterns of change in a particular climate variable reveal policy-relevant information differently than addressing change shapes at any given time. Comparing the patterns of change for different GWLs gives an insight into the severity of the GWL. Interestingly, the patterns of change appear remarkably similar between different GWLs (Hoegh-Guldberg et al., 2018). This has prompted the practice of pattern scaling to better compare the role of regional and/or local feedback mechanisms to the level of warming.
Pattern scaling refers to the methods used to describe spatial climatic variations at a certain GWL (IPCC, 2021). The pattern scaling was made explicit to get impact-related regional projections for scenarios that have yet to be simulated by models (Moss et al., 2010). It implies a linear correlation between regional and global mean temperature change patterns. It can provide information about climate change for periods of time or emission scenarios when the model result is unavailable (Lustenberger et al., 2014). When creating various climate scenarios that account for different emissions, concentrations, forcing scenarios, and uncertainties related to multiple climate model responses, pattern scaling methods offer a low-cost alternative to expensive RCM operations (Herger et al., 2015). It is conditioned on solid geographical patterns of change, regulated by the analogous global mean temperature change, which emerges when the reaction to external forcings arises from the noise and persists throughout the simulation’s duration across various scenarios and models.
From the time when Santer et al. (1990) pattern scaling method has been extensively used (Huntingford & Cox, 2000; Mitchell, 2003; Sanderson et al., 2011; Lustenberger et al., 2014; Tebaldi & Arblaster, 2014; Christensen et al., 2015; 2019; Matte et al., 2019; Ozturk et al., 2022). Researching how much Europe will warm against a global average temperature rise of 6°C to understand better the extreme scenarios that predict high warming, Christensen et al. (2015) compared the ENSEMBLES and PRUDENCE projects with regional climate model projections. It showed that the response to 6°C of warming is mainly linear. In other words, the temperature increase in Europe for each GWL varies linearly. Christensen et al. (2019) used and compared the pattern scaling method on temperature and precipitation variation using data from many projects (PRUDENCE, ENSEMBLES, and CORDEX). The data indicated that this method is reliable among project outputs. Their results strongly support the pattern scaling method’s linearity as seen in observations, and this relationship may be elongated at least until the end of the twenty-first century. In their studies using data from the EURO-CORDEX regional climate model projections, Matte et al. (2019) reveal that the scaled pattern appears before the precipitation data in the temperature data. Ozturk et al., 2022 show that the pattern scaling method also applies to the mean state of the circulation-related variables, and the ensemble mean of regional climate model projections from EURO-CORDEX appeared well correlated with the pattern at the end of the century.
Changes in extreme weather events can also be examined using the pattern scaling method (Lustenberger, Knutti, and Fischer, 2014). The co-occurrence of several unprecedented extremes can have significant and uncommon impacts. Also, with higher warming levels, unprecedented events will become stronger and more frequent (Herring et al., 2018). Vautard et al. (2014) point out that even if global warming is kept below 2°C, Europe is expected to have a warming of more than 2°C. For each degree of global warming, larger average warming is predicted for land regions (IPCC, 2013; IPCC, 2021).
This study addresses the reaction of change in extreme temperatures to global temperature increases. To this end, regional climate projections for daily minimum and daily maximum temperatures were used to analyze future changes in extreme temperatures, addressing climate warming levels. A scaling was applied with the annual mean global warming modeled by the GCM. In addition, the occurrence of scaled patterns of minimum and maximum temperatures on specific extreme weather indices, a yearly maximum value of daily maximum temperature (TXx), and yearly minimum value of daily minimum temperature (TNn), and a yearly minimum of daily maximum temperature (TXn), and a yearly maximum of daily minimum temperature (TNx) were determined. The appearance of robust scaled patterns of extreme temperature was studied. A central objective was to investigate if the scalability of the change in extreme temperatures holds similarly to the mean climate state variables.
For the RCP8.5 scenario, maximum and minimum temperatures of the day from the EURO-CORDEX at 0.11° grid mesh were used (Jacob et al., 2014). It is a high radiative forcing and concentration route characterizing that radiative forcing will arrive at 8.5 W/m2 by 2100, based on a continuous increase in greenhouse gas emissions (Riahi et al., 2007; Meinshausen et al., 2011; van Vuuren et al., 2011). The multi-model mean of future changes in extreme temperature indices projected for 2080-2099 was compared to 1985-2004, and 64 regional climate simulations were analyzed (Figure 1; Christensen et al., 1998; Rockel et al., 2008; Skamarock et al., 2008; Colin et al., 2010; Baldauf et al., 2011; Herrmann et al., 2011; Kupiainen et al., 2011; Samuelsson et al., 2011; Giorgi et al., 2012; Jacob et al., 2012; Meijgaard van et al., 2012; Tinker et al., 2015). Also, the ERA5 dataset covering 1981-2020 was analyzed to examine the changes in four indices between the last 20 years and the first 20 years of the dataset (Muñoz Sabater, 2019).
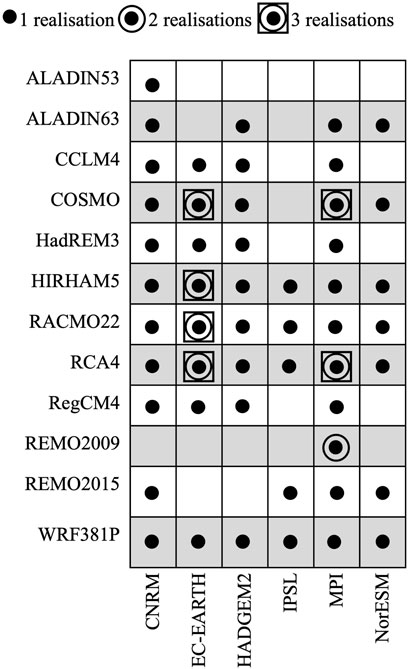
FIGURE 1. GCM/RCM Matrix containing 64 simulations. Rows represent RCMs, and columns represent GCMs.
Analysis of the response of the change in extreme temperatures to the global temperature increase as deduced from each of the respectively driving global climate models, using the scaling method, was investigated. The scaling was computed as the division of the 20-year mean change in each index (with respect to 1985-2004) by the global warming of the related GCM in the GCM-RCM matrix (Matte et al., 2019). The scaling approach is linear scaling suggesting a linear relationship between regional change and global warming. First, the 20-year running means regional change compared to the reference period for each index was calculated using regional climate model simulations throughout the century. Then, the regional change signal for each 20-year running mean was divided by the respective 20-year mean global mean temperature change compared to the reference period calculated from the relevant GCM. For example, for the WRF381P regional model output driven by CNRM-CM5 global climate model, the scaling parameter was calculated from CNRM-CM5 global climate model output. This method investigated the correlation of the change in extreme temperatures with each global temperature increase.
The 20-year averages of the respective GCM in each GCM-RCM pair were subtracted from the year of global warming of 1°C, 2°C, and 3°C relative to 1985–2004, respectively. No multiple shifts were identified as the 20-year averages of global temperature change were calculated. The 20-year average of regional model projections was computed from each individual member around the obtained years and divided by the analogous global mean warming levels.
We introduced a S/N, computed for each variable with the following formula:
where < SP > is the multi-model mean of all members for scaled patterns, and σSP is the inter-member standard deviation of the change in scaled patterns (Christensen et al., 2019). S/N is employed as a measure to display the robustness of the changing pattern. Gray shading represented areas where the S/N ratio is less than one in the figures.
We investigated the scaled patterns of TXx, TXn, TNx, and TNn for 2080-2099 compared to 1985–2004. Figure 2 presents the multi-model mean of scaled changes in these four indices. The end-century scaled patterns of the four indices exhibit positive changes. There is no gray shading shown in the end-century scaled patterns since the S/N ratio is larger than one everywhere, indicating robust changes. The change in scaled patterns of TXx and TNx show similar spatial patterns with a higher increase in the Mediterranean Basin and Central Europe and less in Northern Europe since the TXx and TNx occur very likely in the summer (Figures 2A, C).
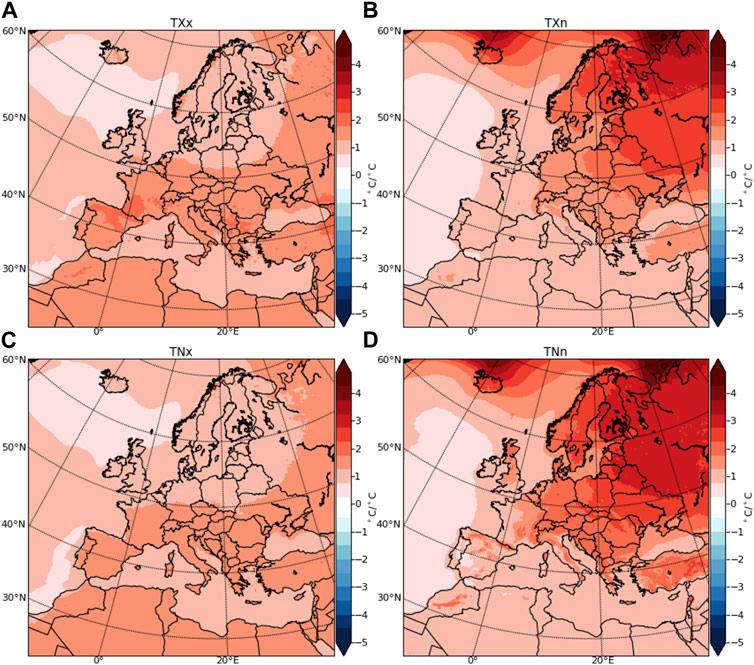
FIGURE 2. Change in scaled patterns of (A) TXx, (B) TXn, (C) TNx, and (D) TNn for the period of 2080–2099 compared to 1985-2004.
Likewise, TXn and TNn occur in winter, showing a similar spatial pattern with a higher increase in the northern part (Figures 2B, D). These results also align with the mean temperature change in Europe for summer and winter (Christensen et al., 2019). End-century scaled patterns for TXx show that the changes projected for TXx are 1.5-2 times higher than GWL for the Mediterranean, which includes Turkey and western Africa. However, a lower increase is expected for the coastal region of Morocco near the Atlantic Ocean and some parts of Libya and Egypt.
End-century scaled patterns appear to be at the same level as the global average temperature increases for Central, Western, and Eastern Europe. For Northern Europe, the increase in TXx will be less compared to the southern part of the domain (Figure 2A). End-century scaled patterns for TNx indicating maximum nighttime temperatures show that increases will be higher for the Mediterranean than for other regions but less warming compared to TXx warming (Figure 2C). This increase appears less for Central, Western, and Eastern Europe and lower for Northern Europe. End-century scaled patterns for TXn show less increase in the Mediterranean than in the northern part of the domain but still higher than global warming (Figure 2B). It is at least twice higher than the global mean temperature increases for Eastern and Northern Europe. This is likely due to fewer future snow projections in the region (Räisänen, 2021; Ivanov et al., 2022). A similar higher increase is occurring for Iceland and its surroundings. For Western and Central Europe, end-century scaled patterns appear to be 1.5 times higher than GWL. End-century scaled patterns for TNn show that a higher increase is extended through the southern part, including Turkey (Figure 2D). There is also a higher increase for high topographical regions, including the northern Iberian Peninsula and the Atlas Mountains, most likely related to significant cryospheric changes in those regions (Zekollari et al., 2019). However, it is anticipated that there will be less increase in the other areas of the Mediterranean.
We investigated the change in patterns of four extreme temperature indices using the ERA5 dataset to see whether the end-century scaled patterns can be identified already for observed conditions. Figure 3 shows the change of TXx, TXn, TNx, and TNn for 2001–2020 compared to the period of 1981-2000. We find some similarities between model projections and observations for all four indices. An increase in the TXx is seen in western North Africa, the Mediterranean, Central, and Eastern Europe, also identified in end-century scaled patterns of TXx (Figures 2A, 3A). There is less increase in Scandinavia in observed conditions which is in line with model projections. In observations, a decrease in TXx over the North Atlantic Ocean is also compatible with less increase projected in model results for the same area. However, model results do not anticipate a decrease in TXx in eastern Iceland.
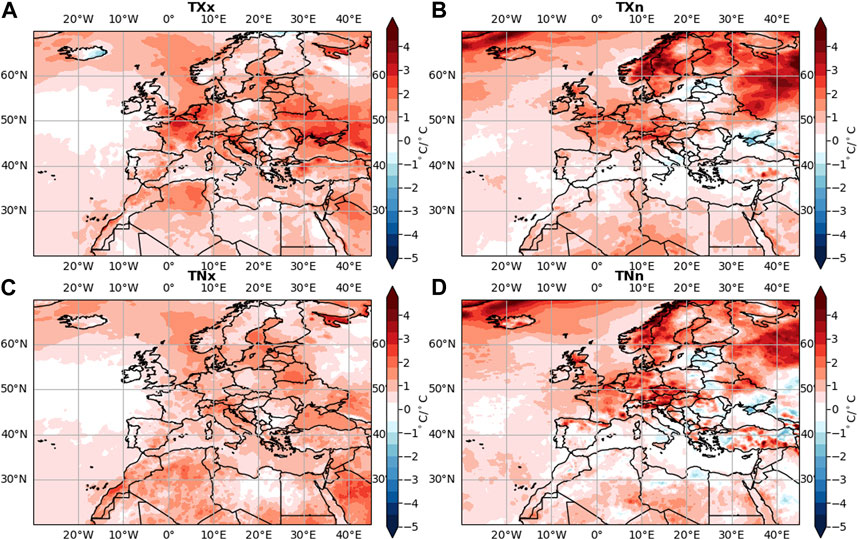
FIGURE 3. Change in (A) TXx, (B) TXn, (C) TNx, and (D) TNn for the period of 2001–2020 compared to 1981–2000 using the ERA5 dataset.
Observed changes in TNx are coherent with model projections with an increase in western North Africa and Central Europe, a slightly smaller rise in Scandinavia, and a decrease in the North Atlantic (Figures 2C, 3C). Change of TXn and TNn in observed conditions has a similar spatial pattern with an increase in the Northern part and less increase in the southern part, as we observed in model projections (Figures 2B, D, 3B, D). The observed conditions also show a high increase in Eastern Europe in TXn and TNn. It is seen that there is a high increase in the Northern part of Iceland and the North Atlantic for both TXn and TNn, which is also expected in model projections at the end of the century. The model results also show a higher increase in the northern Iberian Peninsula and the Atlas Mountains for TNn (Figure 3D).
To investigate the development of the end-of-century scaled pattern of TXx, TXn, TNx, and TNn, we developed a video animation displaying the temporal growth of the spatial patterns of the ensemble mean of individual model pairs (Supplementary Material S1). Animation also shows the robustness of the scaled patterns by displaying gray shading showing the areas where S/N<1. Results show that the end-of-century scaled patterns emerged already around 2010 for all the indices. It develops for TXn and TNn before the signal is above the noise. The median year 2010 here corresponds to the change for 2001–2020, which is the same period as we calculated for observed changes. Even though the signal was upscaled by a low scaling parameter (less than 1-degree global warming), we see a similar spatial pattern of higher increase over northern and northeastern Europe in TXn and TNn and relatively higher increase over the Mediterranean in TXx and TNx. The signal is considered robust for TXn and TNn around 2045 when gray shading disappears over the North Atlantic Ocean. If we look at the temporal evolution of the scaled pattern of TXx for each individual model pair, it is shown that the signal emerges about 2040 (Supplementary Material S2).
We computed the spatial correlation of the 20-year running mean of the scaled patterns from 1990 to 2089 (median year of the 20-year running mean) against the period of 2080–2099 to identify the development of the scaled pattern. Spatial correlations of the multi-model mean and the individual model pairs for TXx, TXn, TNx, and TNn are represented in Figures 4–7, respectively. The ensemble mean of model results for every index correlates well with the end-of-century scaled pattern. It shows the earlier emergence than the individual GCM-RCM pairs, as observed in animations. Almost all individual models correlate to end-of-century scaled patterns from about 2040 for TXx and TNx (Figures 4, 6). The ensemble mean of model projections is emerging around 2020. For TXn and TNn, the ensemble mean has a high correlation to end-of-century starting from very early years (Figures 5, 7). The individual model results show that some regional model outputs forced by CNRM do not correlate until around 2030. Some even correlate negatively to the pattern at the end of the century. However, starting from 2040, all individual model pairs correlate well with a higher correlation coefficient than TXx and TNx have.
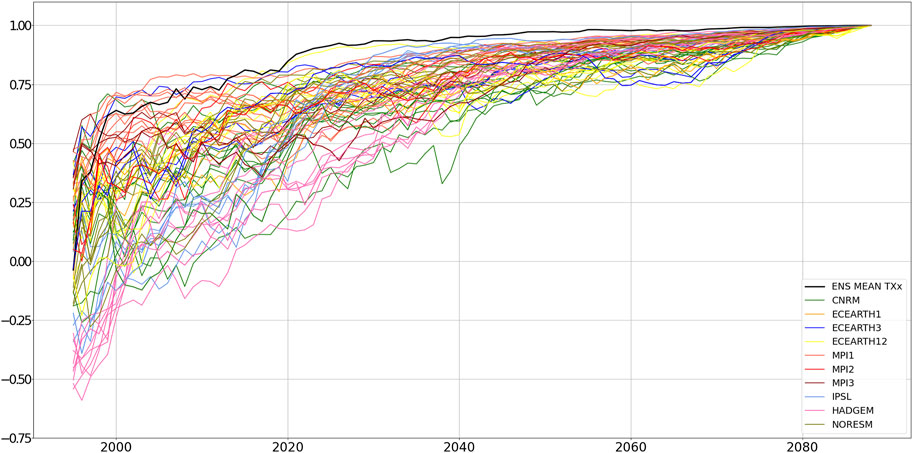
FIGURE 4. Spatial correlation of 20-year running means of scaled patterns of model pairs for TXx from 1990 to 2089 with the pattern of the end-of-the-century. The black line shows the multi-model ensemble mean of TXx.
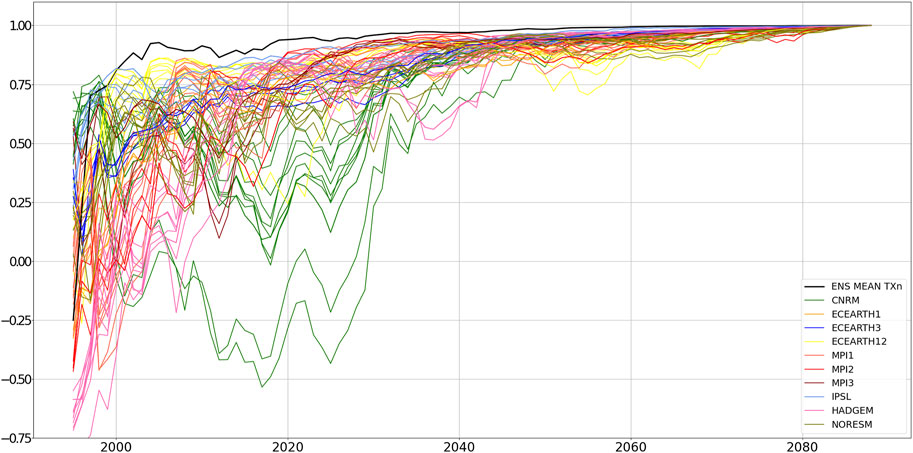
FIGURE 5. Spatial correlation of 20-year running means of scaled patterns of model pairs for TXn from 1990 to 2089 with the pattern of the end-of-the-century. The black line shows the multi-model ensemble mean of TXn.
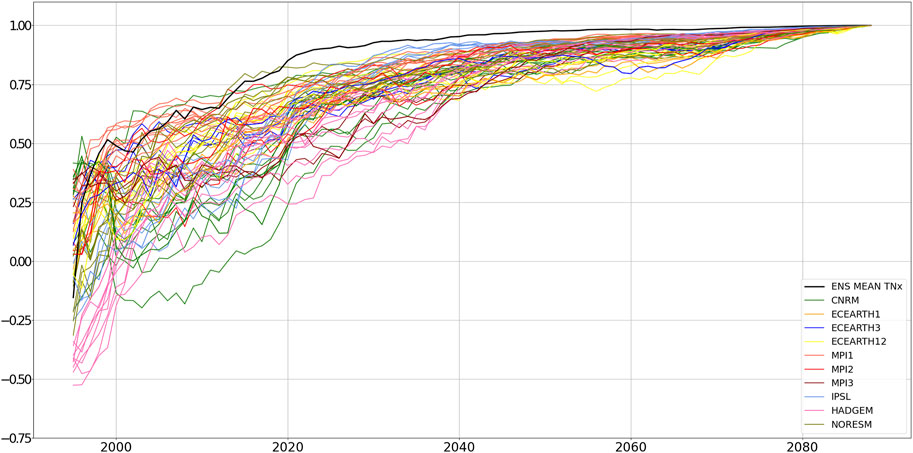
FIGURE 6. Spatial correlation of 20-year running means of scaled patterns of model pairs for TNx from 1990 to 2089 with the pattern of the end-of-the-century. The black line shows the multi-model ensemble mean of TNx.
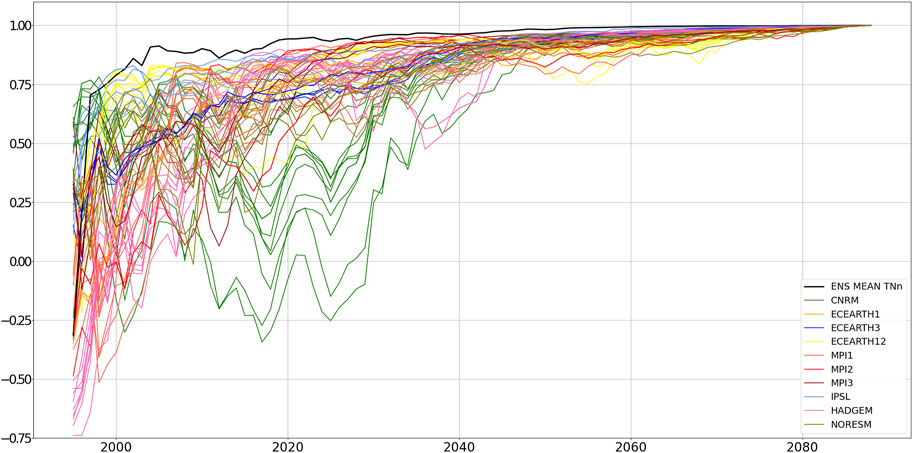
FIGURE 7. Spatial correlation of 20-year running means of scaled patterns of model pairs for TNn from 1990 to 2089 with the pattern of the end-of-the-century. The black line shows the multi-model ensemble mean of TNn.
This section investigated when the end-of-century pattern prevails in different global warming levels. The development of spatial scaled patterns throughout the century for each index with gray shading showing the areas where S/N<1 is presented in Figure 8. Results show that the scaled pattern of change is considered robust for all indices in every warming level except the 1°C pattern of TXn and TNn over the North Atlantic Ocean. This is likely due to high warming in all indices and agreement between individual model pairs. For all indexes and different warming levels, the spatial pattern seen at the end of the century emerges very quickly, starting from the year when the 1°C pattern prevails. Results show that scaled patterns of each index are almost the same throughout the century. This result is also consistent with the early emergence of the ensemble mean pattern and its high correlation to the end of the century.
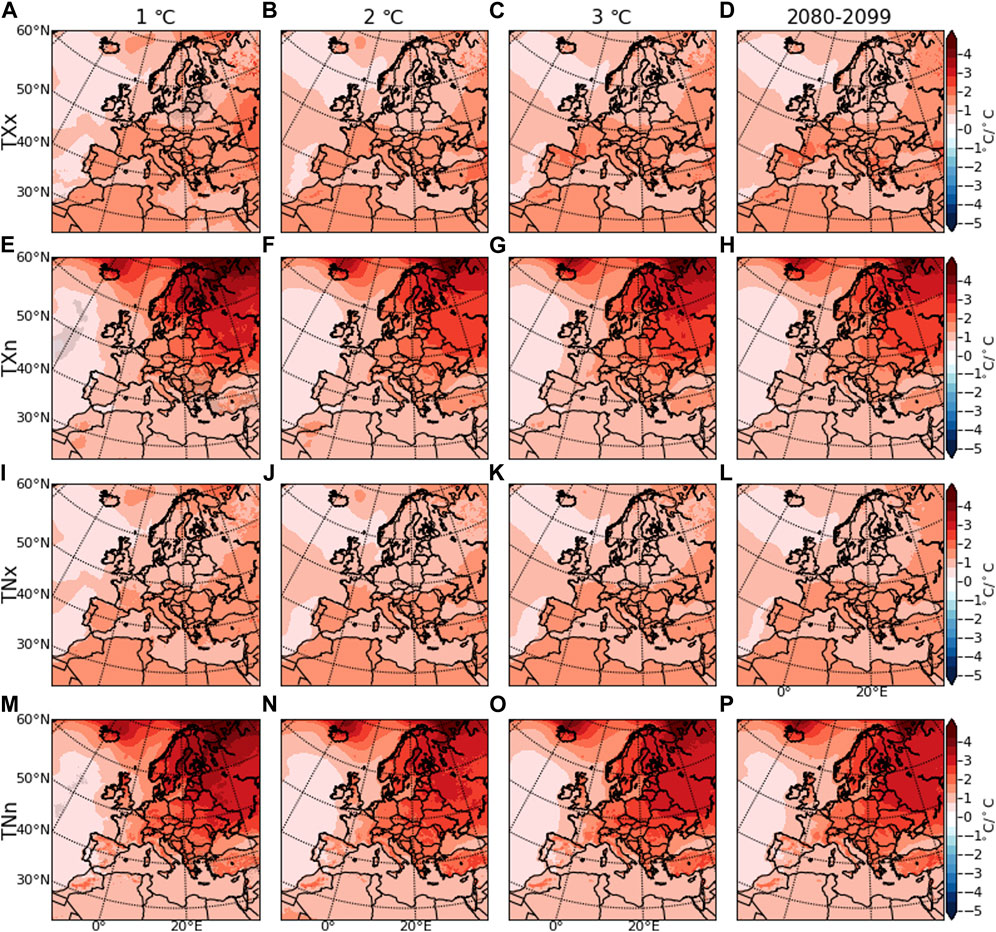
FIGURE 8. Scaled patterns of (A–D) TXx, (E–H) TXn, (I–L) TNx, and (M–P) TNn for the different warming levels and 2080–2099 relative to 1985–2004.
We have demonstrated how robust scaled patterns of four indicators for extreme temperatures behave over Europe and the Mediterranean. Results for the ensemble mean of model pairs show that positive change in these four indices is anticipated at the end of the century, and this change is robust regarding the S/N ratio. Summer extreme indices of TXx and TNx, which can be taken as the warmest day and the warmest night of the year, show more increase in the Mediterranean and Central Europe and a lower increase in Northern Europe. On the other hand the winter temperature indices of TXn and TNn, considered the coldest day and coldest night of the year, are anticipated to increase more in Northern Europe, Scandinavia, and Northeastern Europe.
When we looked at the temporal evolution of the scaled patterns of each index, the end-of-the-century pattern emerges as early as around 2010, even before it was robust, as defined by the S/N ratio exceeding a value of 1. Even though the noisiness of the signal, which is due to the low scaling parameter, appeared initially, the pattern revealed itself early. Even if the scaled pattern of the individual model pairs shows a bit different response, they also emerge by about 2040. Almost all models pair rapidly set to the end-of-the-century pattern and congregate individually.
We calculated the change in these four extreme indices for the last 20 years of 1981–2020 compared to the first 20 years using the ERA5 dataset to investigate if the scaled pattern is also identifiable in observed changes. Indeed, the observed patterns of change show similar changes with the end-of-the-century scaled patterns identified by the GCM/RCM sample. According to the results, a pattern at the end of the century appeared even in the observed conditions for some parts of the domain. The higher increase of TXx in the Mediterranean and Central Europe and the lower increase of TXx in Scandinavia, the higher increase of TNn in the northern and northeastern regions of the domain, and the lower increase in the southern part, are all seen in observations that are also to be anticipated as implied by the model results. The ensemble mean of the scaled pattern was found to be emerging around 2010, which corresponds to the period of 2001–2020. This result suggests a similar spatial pattern in the historical EURO-CORDEX runs as well.
The original contributions presented in the study are included in the article/Supplementary Material, further inquiries can be directed to the corresponding author. The EURO-CORDEX regional climate simulations analyzed in this work are found on the Earth System Grid Federation website (https:// esgf-data.dkrz.de/projects/cordex-dkrz/).
JC conceived the idea and contributed to the review and editing. TO led the study, performed the analysis, and led the writing. EC produced the figures. DM contributed to the analysis. TO, BB, and DM contributed to writing, reviewing, and editing. MK contributed to the review. All authors contributed to the article and approved the submitted version.
This study was funded by the Scientific and Technological Research Council of Turkey (TUBITAK) ARDEB 3501 Grant No 121Y587. JC acknowledges funding by the Independent Research Fund Denmark through the project GreenPlanning (grant no. 0217-00244B). This project was made possible thanks to the financial support Ouranos received from the Gouvernement du Québec.
The analysis represented in this paper was fully performed at TUBITAK ULAKBIM, High Performance and Grid Computing Center (TRUBA resources).
The authors declare that the research was conducted in the absence of any commercial or financial relationships that could be construed as a potential conflict of interest.
All claims expressed in this article are solely those of the authors and do not necessarily represent those of their affiliated organizations, or those of the publisher, the editors and the reviewers. Any product that may be evaluated in this article, or claim that may be made by its manufacturer, is not guaranteed or endorsed by the publisher.
The Supplementary Material for this article can be found online at: https://www.frontiersin.org/articles/10.3389/feart.2023.1178461/full#supplementary-material
Supplementary Video S1 | Temporal evolution of the ensemble mean of scaled patterns of (A) TXx, (B) TXn, (C) TNx, and (D) TNn.
Supplementary Video S2 | Temporal evolution of each member’s TXx scaled patterns.
Baldauf, M., Seifert, A., Förstner, J., Majewski, D., Raschendorfer, M., and Reinhardt, T. (2011). Operational convective-scale numerical weather prediction with the COSMO model: Description and sensitivities. Mon. Weather. Rev. 139 (12), 3887–3905. doi:10.1175/mwr-d-10-05013.1
Christensen, J. H., Larsen, M. A. D., Christensen, O. B., Drews, M., and Stendel, M. (2019). Robustness of European climate projections from dynamical downscaling. Clim. Dyn. 53, 4857–4869. doi:10.1007/s00382-019-04831-z
Christensen, O. B., Christensen, J. H., Machenhauer, B., and Botzet, M. (1998). Very high-resolution regional climate simulations over Scandinavia - present climate. J. Clim. 11 (12), 3204–3229. doi:10.1175/1520-0442(1998)011<3204:vhrrcs>2.0.co;2
Christensen, O. B., Yang, S., Boberg, F., Maule, C. F., Thejll, P., Olesen, M., et al. (2015). Scalability of regional climate change in Europe for high-end scenarios. Clim. Res. 64, 25–38. doi:10.3354/cr01286
Colin, J., Déqué, M., Radu, R., and Somot, S. (2010). Sensitivity study of heavy precipitation in limited area model climate simulations: Influence of the size of the domain and the use of the spectral nudging technique. Tellus A Dyn. Meteorol. Oceanogr. 62 (5), 591–604. doi:10.1111/j.1600-0870.2010.00467.x
Giorgi, F., Coppola, E., Solmon, F., Mariotti, L., Sylla, M. B., Bi, X., et al. (2012). RegCM4: Model description and preliminary tests over multiple CORDEX domains. Clim. Res. 52, 7–29. doi:10.3354/cr01018
Herger, N., Sanderson, B. M., and Knutti, R. (2015). Improved pattern scaling approaches for the use in climate impact studies. Geophys. Res. Lett. 42 (9), 3486–3494. doi:10.1002/2015GL063569
Herring, S. C., Christidis, N., Hoell, A., Kossin, J. P., Schreck, C. J., and Stott, P. A. (2018). Explaining extreme events of 2016 from a climate perspective. Bull. Am. Meteorol. Soc. 99 (1), 1–157. doi:10.1175/BAMS-ExplainingExtremeEvents2016.1
Herrmann, M., Somot, S., Calmanti, S., Dubois, C., and Sevault, F. (2011). Representation of spatial and temporal variability of daily wind speed and of intense wind events over the mediterranean sea using dynamical downscaling: Impact of the regional climate model configuration. Nat. Hazards Earth. Syst. Sci. 11, 1983–2001. doi:10.5194/nhess-11-1983-2011
Hoegh-GuldbergJacob, O. D., Taylor, M., Bindi, M., Brown, S., Camilloni, I., Diedhiou, A., et al. (2018). “Impacts of 1.5°C global warming on natural and human system global warming of 1.5°C: An IPCC special report on the impacts of global warming of 1.5°C above pre-industrial levels and related global greenhouse gas emission pathways,” in The context of strengthening the global response to the threat of climate change, sustainable development and efforts to eradicate poverty. Editors V. Masson-Delmotte, P. Zhai, H.-O. Pörtner, D. Roberts, J. Skea, P. R. Shuklaet al. (Cambridge, and New York, NY: Cambridge University Press), 175–312.
Huntingford, C., and Cox, P. M. (2000). An analogue model to derive additional climate change scenarios from existing GCM simulations. Clim. Dyn. 16 (8), 575–586. doi:10.1007/s003820000067
Ivanov, O. L., Bärring, L., and Wilcke, R. A. I. (2022). Climate change impact on snow loads in northern Europe. Struc. Saf. 97, 102231. doi:10.1016/j.strusafe.2022.102231
Jacob, D., Elizalde, A., Haensler, A., Hagemann, S., Kumar, P., Podzun, R., et al. (2012). Assessing the transferability of the regional climate model REMO to different coordinated regional climate downscaling experiment (CORDEX) regions. Atmos 3, 181–199. doi:10.3390/atmos3010181
Jacob, D., Petersen, J., Eggert, B., Alias, A., Christensen, O. B., Bouwer, L. M., et al. (2014). EURO-CORDEX: New high-resolution climate change projections for European impact research. Reg. Environ. Change. 14, 563–578. doi:10.1007/s10113-013-0499-2
Kupiainen, M., Samuelsson, P., Jones, C., Jansson, C., Willén, U., Hansson, U., et al. (2011). Rossby Centre regional atmospheric model, RCA4. Norrkoping: Rossby Centre Newsletter.
Lustenberger, A., Knutti, R., and Fischer, E. M. (2014). The potential of pattern scaling for projecting temperature-related extreme indices. Int. J. Climatol. 34, 18–26. doi:10.1002/joc.3659
IPCC (2021). in Climate change 2021: The physical science basis. Contribution of working group I to the sixth assessment report of the intergovernmental panel on climate change. Editors V. Masson-Delmotte, P. Zhai, A. Pirani, S. L. Connors, C. Péan, S. Bergeret al. (Cambridge, and New York, NY: Cambridge University Press).
Matte, D., Larsen, M. A. D., Christensen, O. B., and Christensen, J. H. (2019). Robustness and scalability of regional climate projections over Europe. Front. Environ. Sci. 6, 163. doi:10.3389/fenvs.2018.00163
Meinshausen, M., Raper, S. C. B., and Wigley, T. M. L. (2011). Emulating coupled atmosphere-ocean and carbon cycle models with a simpler model, MAGICC6 – Part 1: Model description and calibration. Atmos. Chem. Phys. 11, 1417–1456. doi:10.5194/acp-11-1417-2011
Mitchell, T. D., Reading, I., Walker-Bone, K., Palmer, K., Cooper, C., and Coggon, D. (2003). Pain tolerance in upper limb disorders: Findings from a community survey. Clim. Change 60, 217–221. doi:10.1136/oem.60.3.217
MossEdmonds, R. H. J., Hibbard, K. A., Manning, M. R., Rose, S. K., van Vuuren, D. P., Carter, T. R., et al. (2010). The next generation of scenarios for climate change research and assessment. Nature 463 (7282), 747–756. doi:10.1038/nature08823
Muñoz Sabater, J., (2019). ERA5-Land hourly data from 1981 to present copernicus climate change service (C3S) climate data store (CDS). (Accessed on 8-January-2023). doi:10.24381/cds.e2161bac
Ozturk, T., Matte, D., and Christensen, J. H. (2022). Robustness of future atmospheric circulation changes over the EURO-CORDEX domain. Clim. Dyn. 59, 1799–1814. doi:10.1007/s00382-021-06069-0
Räisänen, J. (2021). Snow conditions in northern Europe: The dynamics of interannual variability versus projected long-term change. Cryosphere 15, 1677–1696. doi:10.5194/tc-15-1677-2021
Riahi, K., Gruebler, A., and Nakicenovic, N. (2007). Scenarios of long-term socio-economic and environmental development under climate stabilization. Technol. Forecast. Soc. Chang. 74 (7), 887–935. doi:10.1016/j.techfore.2006.05.026
Riahi, K., van Vuuren, D. P., Kriegler, E., Edmonds, J., O’Neill, B. C., Fujimori, S., et al. (2017). The Shared Socioeconomic Pathways and their energy, land use, and greenhouse gas emissions implications: An overview. Glob. Environ. Change 42, 153–168. doi:10.1016/j.gloenvcha.2016.05.009
Rockel, B., Will, A., and Hense, A. (2008). The regional climate model COSMO-CLM (CCLM). Meteorol. Z. 17, 347–348. doi:10.1127/0941-2948/2008/0309
Samuelsson, P., Jones, C., Willén, U., Ullerstig, A., Gollvik, S., Hansson, U., et al. (2011). The rossby centre regional climate model RCA3: Model description and performance. Tellus 63 (1), 4–23. doi:10.1111/j.1600-0870.2010.00478.x
Santer, B. D., Wigley, T. M. L., Schlesinger, M. E., and Mitchell, J. F. B. (1990). Developing climate scenarios from equilibrium GCM results. Hamburg: Max Planck Institut für Meteorologie.
Skamarock, W. C., Klemp, J. B., Dudhia, J., Gill, D. O., Duda, M. G., Huang, X. -Y., et al. (2008). A description of the advanced research WRF version 3. NCAR Tech. note 475. doi:10.5065/D68S4MVH
IPCC (2013). in Climate change 2013: The physical science basis. Contribution of working group I to the fifth assessment report of the intergovernmental panel on climate change. Editors T. F. Stocker, D. Qin, G. -K. Plattner, M. Tignor, S. K. Allen, J. Boschunget al. (Cambridge, and New York, NY: Cambridge University Press).
Sanderson, M. G., Hemming, D. L., and Betts, R. A. (2011). Regional temperature and precipitation changes under high-end (≥ 4 c) global warming. Philos. Trans. R. Soc. A 369 (1934), 85–98. doi:10.1098/rsta.2010.0283
Tebaldi, C., and Arblaster, J. M. (2014). Pattern scaling: Its strengths and limitations, and an update on the latest model simulations. Clim. Change 122, 459–471. doi:10.1007/s10584-013-1032-9
Tinker, J., Lowe, J., Holt, J., Pardaens, A., and Wiltshire, A. (2015). Validation of an ensemble modelling system for climate projections for the northwest European shelf seas. Prog. Oceanogr. 138, 211–237. doi:10.1016/j.pocean.2015.07.002
van Meijgaard, E., van Ulft, L. H., Lenderink, G., de Roode, S. R., Wipfler, L., Boers, R., et al. (2012). Refinement and application of a regional atmospheric model for climate scenario calculations of Western Europe. Natl. Res. Programme Clim. Changes Spatial Plan. KvR 054/12. Available at: https://edepot.wur.nl/312258.
van Vuuren, D. P., Edmonds, J., Kainuma, M., Riahi, K., Thomson, A., Hibbard, K., et al. (2011). The representative concentration pathways: An overview. Clim. Change 109, 5–31. doi:10.1007/s10584-011-0148-z
Vautard, R., Gobiet, A., Sobolowski, S., Kjellström, E., Stegehuis, A., Watkiss, P., et al. (2014). The European climate under a 2 °C global warming. Environ. Res. Lett. 9, 034006. doi:10.1088/1748-9326/9/3/034006
Keywords: pattern scaling, extreme temperatures, climate change, EURO-CORDEX, regional climate modeling
Citation: Ozturk T, Canbaz E, Bilgin B, Matte D, Kurnaz ML and Christensen JH (2023) The emergence of projected scaled patterns of extreme temperatures over Europe. Front. Earth Sci. 11:1178461. doi: 10.3389/feart.2023.1178461
Received: 02 March 2023; Accepted: 06 June 2023;
Published: 28 June 2023.
Edited by:
Hans Von Storch, Helmholtz Zentrum Hereon, GermanyReviewed by:
Stefano Federico, National Research Council (CNR), ItalyCopyright © 2023 Ozturk, Canbaz, Bilgin, Matte, Kurnaz and Christensen. This is an open-access article distributed under the terms of the Creative Commons Attribution License (CC BY). The use, distribution or reproduction in other forums is permitted, provided the original author(s) and the copyright owner(s) are credited and that the original publication in this journal is cited, in accordance with accepted academic practice. No use, distribution or reproduction is permitted which does not comply with these terms.
*Correspondence: Tugba Ozturk, dHVnYmEub3p0dXJrQGlzaWt1bi5lZHUudHI=
Disclaimer: All claims expressed in this article are solely those of the authors and do not necessarily represent those of their affiliated organizations, or those of the publisher, the editors and the reviewers. Any product that may be evaluated in this article or claim that may be made by its manufacturer is not guaranteed or endorsed by the publisher.
Research integrity at Frontiers
Learn more about the work of our research integrity team to safeguard the quality of each article we publish.