 Ling Zou
 Lars Hoffmann
 Rolf Müller2,3
- 1Jülich Supercomputing Centre (JSC), Forschungszentrum Jülich, Jülich, Germany
- 2Center for Advanced Simulation and Analytics (CASA), Forschungszentrum Jülich, Jülich, Germany
- 3Institut für Energie- und Klimaforschung (IEK-7), Forschungszentrum Jülich, Jülich, Germany
As the tropopause plays a key role in regulating the entry of air from the troposphere into the stratosphere and in controlling stratosphere-troposphere exchange, variation of the tropopause impacts the atmospheric dynamics, circulation patterns, and the distribution of greenhouse gases in the upper troposphere and lower stratosphere (UTLS). Therefore, it is of particular interest to investigate the climatological characteristics and trends of the tropopause. Previous studies have investigated the tropopause characteristics using reanalyses and multi-source observations. This study extends the analysis of long-term variability and trends of tropical tropopause characteristics in earlier studies from 1980 up to 2021 using the modern ERA5 reanalysis and compares the results with those of other reanalyses, including ERA-Interim, MERRA-2, and NCEP1/2. Our analysis reveals a general rise and cooling of the tropical tropopause between 1980 and 2021. The geopotential height has increased by approximately 0.06 ± 0.01 km/decade (at a 95% confidence level), while the temperature has decreased by −0.09 ± 0.03 K/decade (at a 95% confidence level) for both the lapse rate tropopause and the cold point tropopause in ERA5. However, from 2006 to 2021, ERA5 shows a warming tropical tropopause (0.10 ± 0.11 K/decade) along with a slower rise in tropopause height (0.05 ± 0.02 km/decade) (at a 95% confidence level). Furthermore, our analysis demonstrates a decline in the rise and cooling of the tropical tropopause since the late 1990s, based on moving 20-year window trends in ERA5. Similar trends are observed in other investigated reanalyses. In addition, this study evaluated the variability of the width of the tropical belt based on tropopause height data from the reanalyses. The ERA5 data show a narrowing tropical belt (−0.16 ± 0.11°/decade) for the time period 1980–2021 according to the relative threshold method. It reveals a tropical widening (0.05 ± 0.22°/decade) for the period between 1980 and 2005, followed by a tropical narrowing (−0.17 ± 0.42°/decade) after 2006. However, the large uncertainties pose a challenge in drawing definitive conclusions on the change of tropical belt width. Despite the many challenges involved in deriving the characteristics and trends of the tropopause from reanalysis data, this study and the open reanalysistropopause data sets provided to the community will help to better inform future assessments of stratosphere-troposphere exchange and studies of chemistry and dynamics of the upper troposphere and lower stratosphere region.
1 Introduction
The tropopause is the transition layer separating the moist and turbulent troposphere from the relatively dry and stable stratosphere. Stratosphere-troposphere exchange has a direct influence on the distribution of greenhouse gases and aerosols in the upper troposphere and lower stratosphere (UTLS) (Holton et al., 1995; Stohl et al., 2003). Accurate determination of the height and temperature of the tropopause is critical for understanding water vapor transport in the UTLS, stratospheric ozone distributions, and stratospheric aerosols (Steinbrecht et al., 1998; Fueglistaler et al., 2009; Randel and Jensen, 2013; Griessbach et al., 2016). For example, the precise height of the tropopause is required in studies aimed at identifying stratospheric ice clouds, such as those conducted by Spang et al. (2015); Pan and Munchak (2011) and Zou et al. (2020, 2022). Meanwhile, precise knowledge of the tropopause is necessary for analyzing the tropospheric ozone column and ozone climatologies in the UTLS, as studied by Bethan et al. (1996) and Thouret et al. (2006). In addition, accurate knowledge of tropopause height and temperature is critical for assessing the stratospheric water vapor content, as noted by Randel and Park (2019) and Hardiman et al. (2015). However, the analysis of tropopause characteristics is challenging due to the different definitions, data sources, and identification methods used, which introduces uncertainties in the analyses. Therefore, accurate identification of tropopause properties and detection of long-term tropopause variability and trends are key points for understanding stratosphere-troposphere exchange and climate change.
There are various definitions of the tropopause based on the thermal structure of the atmosphere, dynamical properties such as potential temperature and potential vorticity, or the concentration of chemical species such as ozone (WMO, 1957; Holton et al., 1995; Browell et al., 1996; Hoinka, 1997; Highwood and Hoskins, 1998; Pan et al., 2004). The choice of the tropopause definition depends on the specific conditions and purpose of the study. The lapse rate tropopause (LRT), for example, is derived from the thermal structure and layering of the atmosphere. It is defined as the lowest level at which the lapse rate decreases to 2 K/km or less, provided that the average lapse rate between that level and all higher levels within 2 km does not exceed 2 K/km (WMO, 1957). The LRT definition is globally applied, usually provides strong stability, and signifies the chemical transition between the troposphere and stratosphere (Pan et al., 2004; Gettelman et al., 2011; Pan et al., 2018). On the other hand, the cold point tropopause (CPT) is found via the minimum temperature in the vertical temperature profile (Highwood and Hoskins, 1998). Due to its impact on the water vapor saturation pressure, the cold point temperature plays an important role in regulating water vapor in the tropics where upwelling of tropospheric air into the stratosphere is dominant (e.g., Randel et al., 2004; Randel and Park, 2019; Vogel et al., 2023). Since the LRT and CPT play specific roles in stratospheric chemical tracing and water vapor regulation, it is essential to study the properties and variations of both.
The variability and trends of the tropopause layer based on radiosonde data, satellite observations, reanalyses and climate models have been discussed in many studies (Seidel D. and Randel J., 2006; Schmidt et al., 2008; Wang et al., 2012; 2016; Randel et al., 2017; Fujiwara et al., 2022). Cooling of the tropical cold point has been detected from 1979 to 2005 in multi-reanalyses and adjusted radiosonde data (−0.3 to −0.6 K/decade) (Tegtmeier et al., 2020) and during 1973–1998 based on operational sounding data (−0.57 ± 0.06 K/decade) (Zhou et al., 2001). At 15°S-15°N latitude, an increase of the tropopause (20 m/decade), a decrease of the tropopause temperature (−0.5 K/decade) and a decrease of the tropopause pressure (−0.5 h Pa/decade) during 1978–1997 were observed from 83 radiosonde stations (Seidel et al., 2001).
However, a warming of the tropical tropopause layer (TTL) based on Global Positioning System Radio Occultation (GPS-RO) observations (0.9 K/decade) and NCAR’s CESM-WACCM (the Community Earth System Model-Whole Atmosphere Community Climate Model) model (0.5 K/decade) was found for the period 2001–2011 (Wang et al., 2015). Similarly, the temperature around the LRT in the Challenging Minisatellite Payload (CHAMP), the Constellation Observing System for Meteorology, Ionosphere and Climate (COSMIC), and three reanalysis datasets showed an increasing in LRT in the tropics from 2002 to 2017 (Shangguan et al., 2019, Figure 11). A warming of the cold point in 2010–2017 was also diagnosed from increasing of water vapor in the tropopause region detected from Microwave Limb Sounder (MLS) measurements aboard NASA’s Aura satellite, because of the strong correlation between both parameters (Randel and Park, 2019). For a longer time range (1981–2015), a significant increase of the lapse rate tropopause height, namely, 0.4–0.12 km/decade, was found in radiosonde data and four modern reanalyses (Xian and Homeyer, 2019). From the observational studies and reanalysis results, the tropical tropopause essentially experienced a cooling in the 1970s/1980s to the early 21st century, followed by a warming in the 21st century.
Meteorological reanalyses provide long-term comprehensive atmospheric information from ever improving forecast models, observations and data assimilation schemes (Fujiwara et al., 2017). Modern reanalyses such as ERA5 (Hersbach et al., 2020) and its predecessor ERA-Interim (Dee et al., 2011) produced by the European Centre for Medium-Range Weather Forecasts (ECMWF) and the Modern-Era Retrospective analysis for Research and Applications, Version 2 (MERRA-2) (Gelaro et al., 2017) from the National Aeronautics and Space Administration’s (NASA’s) Global Modeling and Assimilation Office (GMAO) provide a global picture of the tropopause by overcoming the spatial and temporal limitations of observational records (Manney et al., 2017; Xian and Homeyer, 2019; Tegtmeier et al., 2020; Hoffmann and Spang, 2022). Although the National Centers for Environmental Prediction and the National Center for Atmospheric Research Reanalysis 1 (NCEP1) (Kalnay et al., 1996; Kistler et al., 2001) was found to be “demonstrated unsuitable” for studying the tropopause temperature (Fujiwara et al., 2022), it has been used to investigate tropopause features in many previous studies (Randel et al., 2000; Santer et al., 2003; Wong and Wang, 2003; Borsche et al., 2007). The evaluation of the tropopause in the National Centers for Environmental Prediction-Department of Energy Atmospheric Model Intercomparison Project-II Reanalysis 2 (NCEP2) (Kanamitsu et al., 2002) is currently limited or insufficient. Therefore, further research and analysis are necessary to better clarify in which aspects the NCEP1 data might be considered “demonstrated unsuitable” for tropopause studies and whether the representation of the tropopause improved from NCEP1 to NCEP2.
Reanalysis datasets produced by different centers use distinct forecast models, assimilation schemes, and have varying sources of observations with different spatial and vertical resolutions (Fujiwara et al., 2017; Fujiwara et al., 2022). The ERA5 reanalysis stands out among other modern reanalyses because of significant improvements in the forecasting model and data assimilation scheme (Hennermann and Berrisford, 2018; Hoffmann et al., 2019; Hersbach et al., 2020). In particular, the high vertical resolution of the ERA5 data makes it an interesting source for studying tropopause characteristics and long-term variations on fine spatiotemporal scales (Hoffmann and Spang, 2022). Comparing tropopause characteristics derived from ERA5 with other reanalyses can provide a more comprehensive understanding of tropopause properties and long-term variations and helps to identify potential limitations of earlier data sets.
Considering numerous earlier studies on tropopause characteristics and trends using reanalysis and observational data, the primary objective of this study is to investigate the variability and trends of tropopause characteristics by utilizing the new, high-vertical-resolution ERA5 reanalysis data, covering an extended time period from 1980 to 2021. Furthermore, we undertake a comparative analysis and assessment of long-term tropopause characteristics across various reanalysis datasets, including ERA5, ERA-Interim, MERRA-2, as well as NCEP1 and NCEP2. In addition to investigating tropopause height, temperature and water vapor content, we also derive the tropical width and tropical edges from the different reanalyses. By examining these aspects, this study will enhance our understanding of the tropopause dynamics and its implications.
In Section 2, we provide information on the reanalysis datasets used in this study and the methods used to determine the different tropopause parameters. Section 3.1 provides a global perspective of the tropopause height, temperature, and water vapor content, including their long-term trends. In Section 3.2, we provide an intercomparison of tropical LRT and CPT derived from different reanalyses and examine their variability from 1980 to 2021. In Section 3.3, we estimate the tropical width using three different methods based on zonal mean tropopause height cross sections and explore the variability of the tropical width over the last 40 years. We discuss and conclude the study in Section 4 and Section 5.
2 Data and method
2.1 Reanalysis data sets
In this study, we assess tropopause characteristics, variability, and trends in ERA5 and compare it with other reanalysis data sets, including ERA-Interim, MERRA-2, NCEP/NCAR Reanalysis 1 and NCEP/DOE Reanalysis 2. The fifth-generation reanalysis ERA5 (Hersbach et al., 2020) is produced by ECMWF using the IFS Cycle 41r2 released in March 2016. ERA5 has a particularly high spatial and temporal resolution for a global reanalysis. Hourly data with a horizontal resolution of approximately 31 km (TL639 spectral grid) on 137 hybrid sigma pressure levels are available from 1950 to the present for atmospheric, terrestrial, and oceanic applications. The representation of various tropospheric and stratospheric processes has been improved in ERA5 (Hennermann and Berrisford, 2018; Hoffmann et al., 2019).
Handling the large amount of ERA5 data is particularly challenging. In this study, we used 6-hourly “low resolution” ERA5 data on a reduced 1° × 1° longitude-latitude grid but with the same vertical levels as the original data to derive tropopause characteristics for the time period from 1980 to 2021. A comparison with hourly “full resolution” ERA5 tropopause data on a longitude-latitude grid of 0.3° × 0.3° for the time period from 2005 to 2021 is presented in Supplementary Appendix SA. Although ERA5 with 6-hourly temporal resolution was reported to have a warmer CPT temperature compared to 3-hourly and 1-hourly resolutions for December-February in time period 2010–2019, the difference in cold point temperature between different horizontal resolutions (1° × 1°, 0.5° × 0.5°, and 0.25° × 0.25°) is negligible based on December-February 2017 data (Bourguet and Linz, 2022). The small differences between the low resolution and full resolution ERA5 tropopause data sets in Supplementary Appnedix Figures SA1, SA2 suggest that our approach of using down-sampled ERA5 data (6-hourly data on a 1° × 1° longitude-latitude grid) to study the tropopause characteristics is reliable.
The ERA-Interim reanalysis (Dee et al., 2011) was produced by ECMWF using the Integrated Forecast System (IFS) Cycle 31r2 released in December 2006. It provides 6-hourly data from January 1979 to August 2019, with a horizontal resolution of approximately 79 km and 60 model levels from the surface up to 0.1 hPa. We retrieved the ERA-Interim data on a 0.75° × 0.75° longitude-latitude grid and on all model levels for use in our analysis.
The MERRA-2 (Gelaro et al., 2017) is produced with the Goddard Earth Observing System, version 5 (GEOS-5) forecasting model and data assimilation system. MERRA-2 provides 3-hourly data from 1979 to the present on 72 hybrid levels from the surface up to 0.01 hPa, on a 0.65° × 0.5° longitude-latitude grid. New improvements on stratosphere, ozone, and cryospheric processes have been made in MERRA-2 (Koster et al., 2015).
The NCEP/NCAR Reanalysis 1 (Kalnay et al., 1996; Kistler et al., 2001) (referred to as NCEP1 in this study) uses a global numerical weather analysis/forecast system to perform data assimilation. It provides 6-hourly data from 1948 to the present with a horizontal resolution of 2.5° at 17 pressure levels up to 10 hPa. The National Centers for Environmental Prediction-Department of Energy (NCEP-DOE) Atmospheric Model Intercomparison Project (AMIP)-II Reanalysis 2 (Kanamitsu et al., 2002) (referred to as NCEP2) is an updated version of NCEP1 with improvements to the forecast model, data assimilation system, and diagnostic outputs. NCEP2 covers the satellite period from 1979 to the present and addresses some of the issues and limitations of NCEP1.
With a reduced set of vertical levels in NCEP1/2, accurately determining the tropopause height from them is more challenging than for ERA5, ERA-Interim, and MERRA-2 data. At 5–20 km of altitude, the NCEP1 and NCEP2 data have a vertical resolution between 1.2 and 2.9 km whereas ERA-Interim and MERRA-2 have about 0.5–1.2 km and ERA5 has 0.3–0.4 km. The tropopause information derived from reanalyses with higher vertical resolution is more reliable as reanalyses with higher vertical resolution tend to have a smaller bias for the tropopause towards radio occultation data and radiosondes (Wang et al., 2015; Tegtmeier et al., 2020; Hoffmann and Spang, 2022). All reanalysis data used here were interpolated from model levels to pressure levels and the vertical resolution was improved using a cubic spline interpolation (Hoffmann and Spang, 2022), which is particularly relevant for the coarser resolution NCEP data set.
In this study, we restricted the time series of the reanalysis datasets to the period from January 1980 to December 2021, except for ERA-Interim, which is available only until August 2019. Tropopause height, temperature, and water vapor content analyzed here are directly obtained from the data sets provided in the open reanalysis tropopause data repository introduced by Hoffmann and Spang (2021). A more detailed description of the methodology used for creating the data sets and a first comparison of the tropopause characteristics of ERA5 and ERA-Interim is provided by Hoffmann and Spang (2022).
2.2 Determination of tropical width
Tropical widening or expansion during recent decades has been discovered and discussed by Seidel and Randel (2007); Seidel et al. (2008); Staten et al. (2020). Various metrics are available for assessing tropical expansion based on different diagnostics and processes related to the tropopause, the jet stream, satellite-derived ozone profiles, or streamfunctions. The tropical edges calculated from different metrics may exhibit significant differences due to the underlying processes which are being considered (Lu et al., 2009; Davis and Rosenlof, 2012; Lucas et al., 2014). In this study, precise tropopause heights derived from the high-vertical-resolution ERA5 reanalysis data allows us to calculate the tropical edges and evaluate the characteristics of the tropical belt based on tropopause height-based metrics.
Following the approach proposed by Seidel and Randel (2007) and Lu et al. (2009), Davis and Rosenlof (2012) proposed two new methods to determine the tropical width based on tropopause height. The first method, referred to here as Davis2012 (Z=15 km), uses an absolute height threshold, where the tropical edge is the area-equivalent latitude at which the tropopause dips below 15 km for each longitude on each hemisphere. The second method, referred to as Davis2012 (ΔZ=1.5 km), detects the tropical edges as the latitude at which the tropopause height drops 1.5 km below the mean tropopause height in the latitude range of ±15°. This relative method eliminates the impact of globally uniform variations in tropopause height by defining the tropical edge relative to a tropical mean tropopause height. In this study, we use the monthly mean lapse rate tropopause in combination with two methods, Davis2012 (Z=15 km) and Davis2012 (ΔZ=1.5 km), to determine the tropical width from the different reanalysis data sets.
2.3 Trend analysis of tropopause parameters
To eliminate the seasonality of monthly tropopause data, we first calculated deasonalized data, which is the difference between the monthly mean values and the interannual mean of the month. The variability of the tropopause is influenced by both tropospheric and stratospheric forcing, such as El Niño-Southern Oscillation (ENSO) and Quasi-Biennial Oscillation (QBO) variability (Hatsushika and Yamazaki, 2001; Randel et al., 2009; Tegtmeier et al., 2020), and volcanic eruptions (VOL) (Free and Lanzante, 2009; Fujiwara et al., 2015). Then, following Randel et al. (2000); Tegtmeier et al. (2020), a multivariate regression analysis was employed to remove the effects of QBO, ENSO, and VOL:
Here, QBO70 and QBO30 represent the monthly mean zonal winds at 70 hPa and at 30 hPa from January 1980 to November 2021, based on radiosonde data observed in Singapore and provided by the Freie Universität Berlin (Naujokat, 1986, https://www.geo.fu-berlin.de/en/met/ag/strat/produkte/qbo/index.html). The ENSO index is a bi-monthly multivariate index obtained from https://psl.noaa.gov/enso/mei/. VOL refers to the monthly mean stratospheric aerosol optical depth (AOD) over the tropics (±20°) from the Global Space-based Stratospheric Aerosol Climatology (Thomason et al., 2018, https://doi.org/10.5067/GloSSAC-L3-V1.0). y is the quantity of interest (e.g., tropopause height or temperature) and t is the independent variable representing time. The application the multivariate regression model is discussed in Sect. 4, which shows the removal of possible contributions of the QBO, ENSO and AOD on the variability of CPT geopotential height and temperatures.
To address autocorrelation in the data, we use a multivariate regression analysis to calculate the trends of tropopause height, temperature, and water vapor, taking into account the contributions of QBO, ENSO, and AOD. Following Tegtmeier et al. (2020), to estimate the standard errors of the long-term trends, we take into account the effects of the autocorrelation by considering the effective sample size based on the lag-1 autocorrelation coefficients. Subsequently, we assess significance using a two-tailed test at a confidence level of 95%. Tests on autocorrelation of the long-term tropopause features are further discussed in Supplementary Appendix SB. The results indicate that the multivariate regression model has effectively accounted for the contributions of ENSO, QBO, and VOL in the analysis. However, some degree of autocorrelation remains to be present in the data, which needs to be taken into account in the error analysis.
3 Results
3.1 Global distributions and trends of the tropopause
Figure 1 shows the global mean distributions of the LRT geopotential height, temperature, and water vapor content as well as their standard deviations from the ERA5 reanalysis data during 1980–2021. As mentioned above, the ERA5 data mainly used in this study are 6-hourly “low resolution” data on a 1° × 1° longitude-latitude grid. The tropical tropopause exhibits the highest geopotential height and the lowest temperature and water vapor content of the LRT (Figures 1A, C, E). The geopotential height of the tropopause in the Northern Hemisphere at mid and high latitudes is lower than in the Southern Hemisphere, with higher temperature and humidity in the Northern Hemisphere. This interhemispheric difference may be attributed to the impact of topography and land cover on atmospheric circulation. Furthermore, Figure 1 reveals high variability and standard deviations in the Asian monsoon region and in the vicinity of the subtropical jet stream (Figures 1B, D, F). The high water vapor content at northern high latitudes relates to the large uncertainty in the identification of tropopause in polar winter conditions due to the near isothermal temperature profiles and influence of the polar vortex (Hoffmann and Spang, 2022).
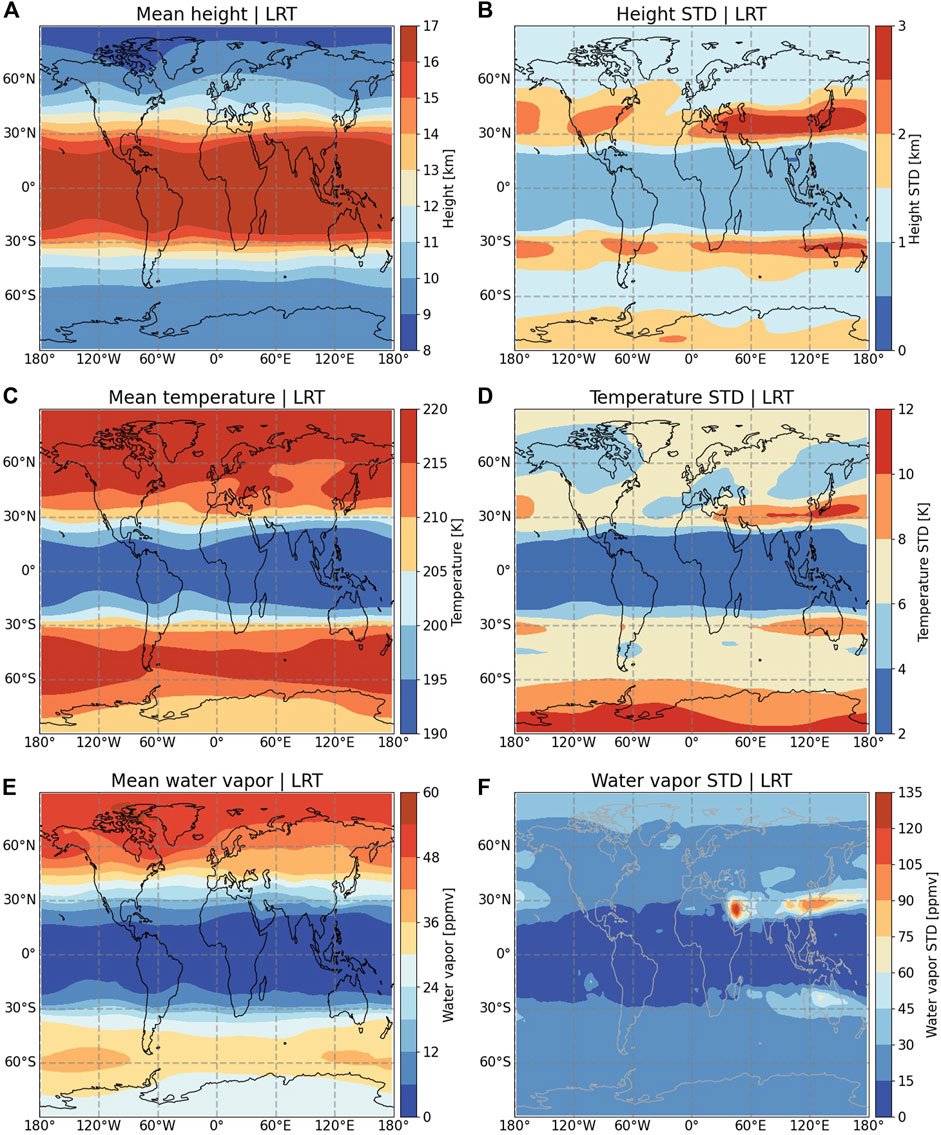
FIGURE 1. Mean spatial distribution of lapse rate tropopause (LRT) height, temperature, and water vapor content from 1980 to 2021 and their standard deviation (STD) from 6-hourly ERA5 data.
Figure 2 provides the zonal means of the LRT and CPT of the five reanalysis datasets, further illustrating the spatial distribution characteristics of the LRT and facilitating comparative analyses of different reanalysis data between the LRT and CPT. The differences between ERA5 and the other reanalyses (ERA-Interim, MERRA-2, NCEP1 and NCEP2) are also shown. The largest difference in geopotential height is found between ERA5 and NCEP1/2 reanalyses in the subtropics and the southern hemisphere. Tropopause features derived from NCEP1 and NCEP2 reanalyses are almost identical, with only small differences in geopotential height and temperature. In the tropics, the tropopause temperatures (both LRT and CPT) are approximately 3–4 K warmer in the NCEP1/2 reanalyses than in ERA5. Warmer temperatures in the NCEP1/2 reanalyses have been demonstrated also for the tropical tropopause during 1979–1997 compared to radiosonde data (Randel et al., 2000). The zonal mean height differences between ERA5 and ERA-Interim/MERRA-2 are less than 0.2 km, and the temperature differences are about 1 K. The water vapor content in the tropics in ERA5, ERA-Interim, and MERRA-2 is very close with differences less than 1 ppmv due to the low tropopause temperatures in this region. The water vapor content from NCEP1/2 was not analyzed in this study. Figures 2B, D, F exhibit low variability mostly in the tropics. However, ERA5 has relatively higher values compared to the other three reanalyses. The high spatial resolution of the ERA5 forecast model and better representation of mesoscale features like gravity waves leads to larger variability of the tropopause, which is consistent with the results of Hoffmann and Spang (2022), Figures 6C–F).
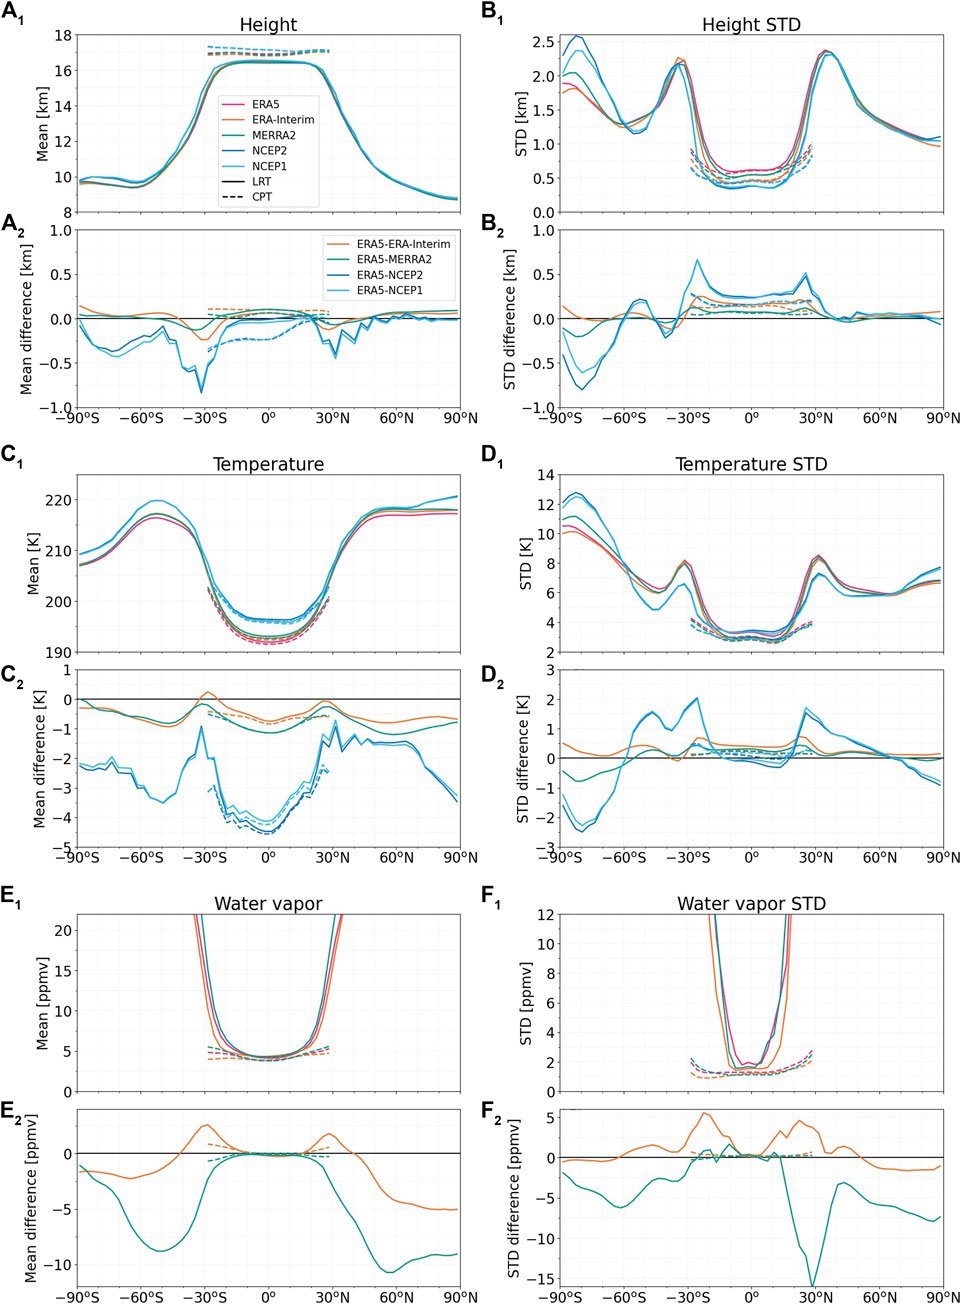
FIGURE 2. Comparison of zonal mean cold point (CPT) and lapse rate tropopause (LRT) height, temperature, and water vapor content of different reanalyses and their standard deviations (STD) during 1980–2021. Subplots labeled *1) are multi-year averages and subplots labeled *2) are differences between ERA5 and the other reanalyses. Note that curves for NCEP1 and NCEP2 are often overlapping.
The spatial and zonal mean trends of tropopause height, temperature, and water vapor from 1980 to 2021 are shown in Figure 3. Note that the trend for ERA-Interim is restricted to the period from 1980 to 2019. Similar to Figure 1, the maps show the results of the LRT from ERA5. The spatial and zonal mean trends show opposite trends in tropopause height and temperature over different regions, with a general increase in tropopause height and decrease in tropopause temperature observed over the tropics, the northern Pacific, eastern Asia, and the southern United States, while decreasing tropopause height and increasing tropopause temperature are found over the southeastern Pacific and southern South America. Similar trends in tropopause height were reported in Xian and Homeyer (2019, Figure 4) for ERA-Interim and MERRA-2 during 1981–2015. Their study found no significant trend in water vapor content over the tropics. However, a decreasing water vapor content at the tropopause is found at high latitudes in ERA5 in Figure 3H.
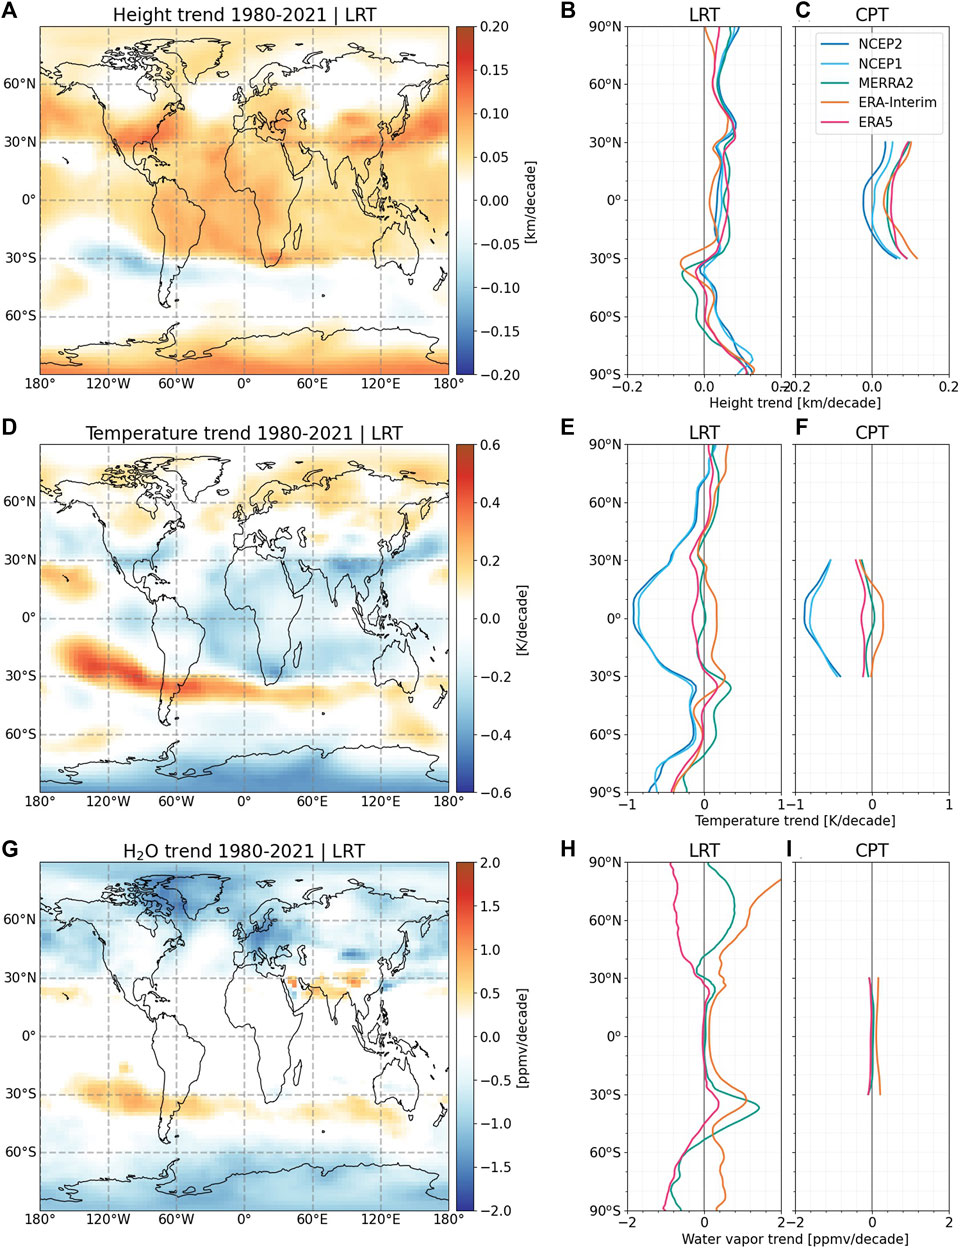
FIGURE 3. Spatial and zonal mean trends of tropopause height, temperature, and water vapor content for the period 1980–2021. Spatial distributions are shown for ERA5. Zonal mean LRT and CPT are shown also for the other reanalysis discussed in this study. Note that curves for NCEP1 and NCEP2 are often overlapping.
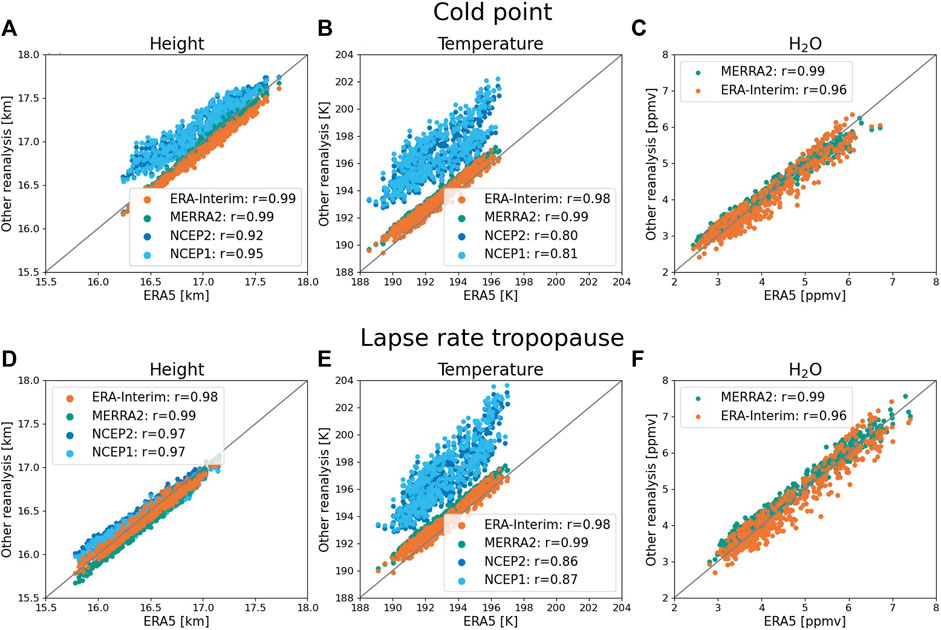
FIGURE 4. Scatter plots of monthly mean CPT and LRT features from ERA5, ERA-Interim, MERRA-2, NCEP1 and NCEP2 in the tropics over the latitudes of 20°S to 20°N. See plot keys for Pearson linear correlation coefficients r between ERA5 and the other reanalyses.
The zonal mean trends of tropopause height from different reanalyses are presented in Figures 3B, C, revealing a general increase in tropopause heights. At latitudes of 25°S-30°N, increasing tropopause heights for both the LRT and CPT are detected in all the reanalyses examined. ERA5 and MERRA-2 exhibit consistent increases in LRT and CPT heights of 0.04 km/decade to 0.06 km/decade. The smallest LRT trend is found in ERA-Interim (
In Figures 3E, F, the trends of tropopause temperatures in ERA5 and MERRA-2 are in range of −0.2 K/decade to 0 K/decade in the tropics. The largest warming trend is found in ERA-Interim, which could be due to its shorter time scale, while the largest cooling is found in the NCEP1/2 reanalyses. Although the high inconsistency of NCEP1/2 reanalyses with other reanalyses has been stated in previous studies (Tegtmeier et al., 2020; Fujiwara et al., 2022), it is still interesting to assess the differences between the NCEP datasets and the other reanalyses. The general cooling of tropopause detected in this study is consistent with the 1979–2014 stratospheric cooling found by Randel et al. (2017) based on satellite measurements and climate models. In the northern extratropics, a warming of the tropopause is found in ERA5, ERA-Interim, and MERRA-2. At southern mid and high latitudes, however, a general cooling of the tropopause is found in the ERA5, ERA-Interim, and the NCEP1/2 reanalyses. The differences in temperature trends between the reanalysis datasets are larger than the differences in height trends. The water vapor content of the tropopause in the tropics is slightly increasing in ERA5, ERA-Interim, and MERRA-2 during the period 1980–2021, but the trends are highly controversial at mid and high latitudes (Figure 3I).
Overall, the zonal mean tropopause features derived from multiple years of ERA5 data are consistent with those found in other reanalysis datasets, although uncertainties are largest over the extratropics. Over the long-term, a general trend of increasing tropopause height and decreasing tropopause temperature is observed over the tropics, the northern Pacific, eastern Asia, and the southern United States. In contrast, decreasing tropopause height and increasing tropopause temperature are found over the southeastern Pacific and southern South America. The zonal mean tropopause trends show a general increase in tropopause height at all latitudes, except for 30°S to 40°S, across all reanalyses. A slight cooling of the tropopause is detected in ERA5 and MERRA-2, while the warming trend found in ERA-Interim is attributed to its different timescale.
3.2 The tropical tropopause and its variability
Since upwelling of air dominates in the tropics in both, the troposphere and the stratosphere due to the Hadley circulation and the Brewer–Dobson Circulation (Brewer, 1949; Salby and Callaghan, 2005), studying the tropical tropopause and its variability is crucial for understanding the water vapor content, ozone, and aerosols in the stratosphere (Randel et al., 2004; 2017). This section focuses on the cold point tropopause (CPT) and lapse rate tropopause (LRT) in the tropics (taken as ± 20° of latitude) derived from different reanalyses and their variability over the last 42 years.
Figure 4 presents a comparison in terms of scatter plots of the monthly mean height, temperature, and water vapor content of the CPT and LRT in the tropics (1980–2021) from ERA5, ERA-Interim, MERRA-2, and NCEP1/2. Table 1 lists the mean difference (bias) and root mean square error (RMSE) between ERA5 and the other reanalyses. The monthly tropopause in ERA-Interim and MERRA-2 is highly correlated with the data in ERA5, with correlation coefficients of ∼0.99. The CPT and LRT heights in ERA5 are slightly higher than those in ERA-Interim and MERRA-2, with a mean difference and RMSE of about 0.1 km. However, CPT heights derived from NCEP1 and NCEP2 are on average 0.18 km higher in the tropics than in ERA5. The tropopause temperature in ERA5 is generally lower than in the other reanalyses, e.g., the CPT temperature in ERA5 is 0.62 K lower than in ERA-Interim and 0.93 K lower than in MERRA-2, while the LRT temperature in ERA5 is 0.49 K and 0.92 K lower than in ERA-Interim and MERRA-2, respectively. Large mean differences are found between ERA5 and the NCEP1/2 reanalyses, with a temperature difference of ∼4 K. The water vapor content is slightly higher in ERA5 than in ERA-Interim but slightly lower than in MERRA-2.
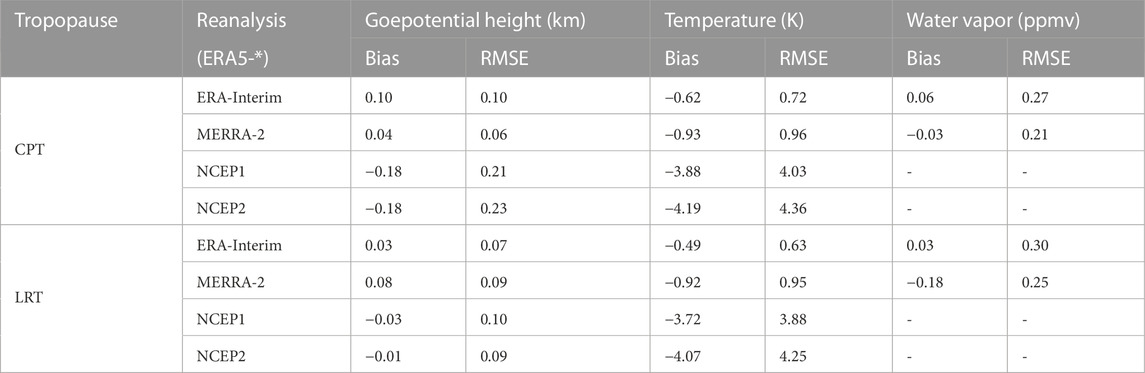
TABLE 1. Mean difference (bias) and root mean square error (RMSE) of tropopause geopotential height, temperature, and water vapor content between ERA5 and other reanalysis datasets, i. e., MERRA-2, NCEP1 and NCEP2 over ±20° during 1980–2021 and ERA-Interim during 1980–2019.
Figure 5 shows the mean annual cycle of tropical tropopause features from all reanalyses, which highlights also the differences between ERA5 and the other reanalyses as summarized in Table 1. From December to February, geopotential heights are high, while they are low from July to September. In contrast to geopotential heights, the tropopause temperature and water vapor content are high in July to September and low in December to February. Despite the larger mean difference between ERA5, ERA-Interim, and MERRA-2 on the one hand and NCEP1/2 on the other hand, the annual cycle patterns are similar for all reanalyses. The differences between the reanalyses follow their vertical resolution, with coarser vertical resolution data sets showing generally higher CPT and LRT temperature.
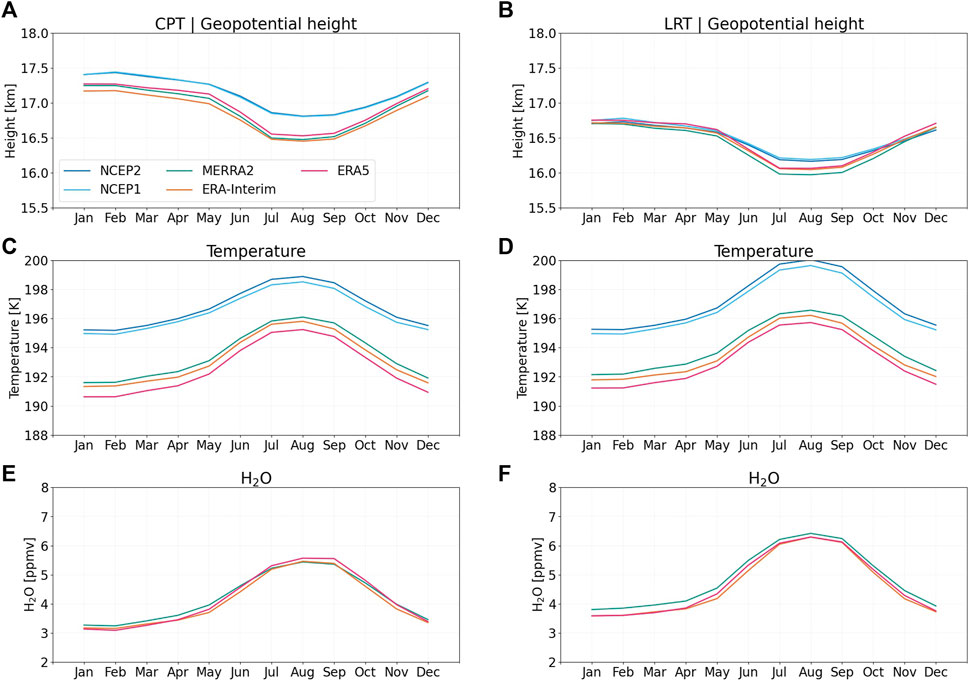
FIGURE 5. Mean annual cycles of CPT and LRT height, temperature and water vapor content in the tropics (±20°) derived from ERA5, ERA-Interim, MERRA-2, NCEP1 and NCEP2. Note that curves for NCEP1 and NCEP2 are mostly overlapping.
The time series of monthly mean tropopause height, temperature and water vapor content in the tropics (±20°) from 1980 to 2021 derived from the reanalyses are shown in Figure 6. The tropopause height, temperature and water vapor content in ERA5, ERA-Interim and MERRA-2 are highly consistent over time despite the large annual variability. Similar to previous studies of Randel et al. (2000) and Tegtmeier et al. (2020), the tropopause temperatures derived from NCEP1/2 reanalyses are generally higher than for the other reanalyses. However, the LRT geopotential heights in NCEP1/2 are consistent with the modern reanalyses.
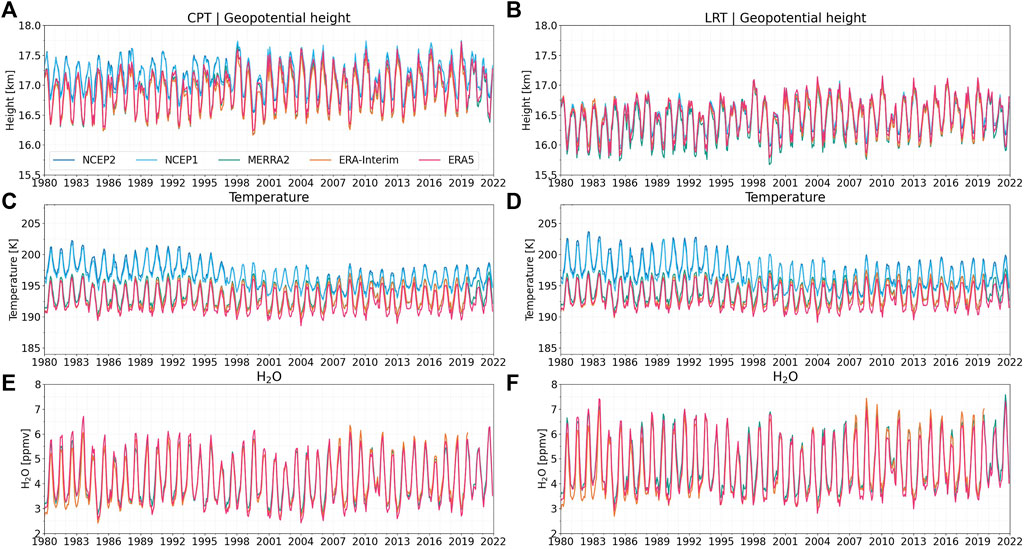
FIGURE 6. Time series of monthly mean CPT and LRT height, temperature and water vapor content in the tropics (±20°) derived from ERA5, ERA-Interim, MERRA-2, NCEP1 and NCEP2 from 1980 to 2021.
The time series of the monthly mean tropopause data were deseasonalized by subtracting the 1980–2021 multi-annual monthly means. The time series of the deseasonalized monthly anomalies of tropopause height, temperature, and water vapor content as well as their running 20-year trends for each month from 1980 to 2021 are shown in Figure 7. The trends fitted to tropopause height, temperature, and water vapor content over the full time period from 1980 to 2021 and two separate time periods (1980–2005 and 2006–2021) are listed in Table 2. Figure 7 *1 shows the long-term consistency of the deseasonalized CPT and LRT height, temperature and water vapor anomalies of ERA5, ERA-Interim and MERRA-2. Although the tropopause height and temperature are higher in NCEP1/2 than in the other reanalyses (Figure 6), the seasonal and interannual variability was reasonably captured by the NCEP1/2 reanalyses.
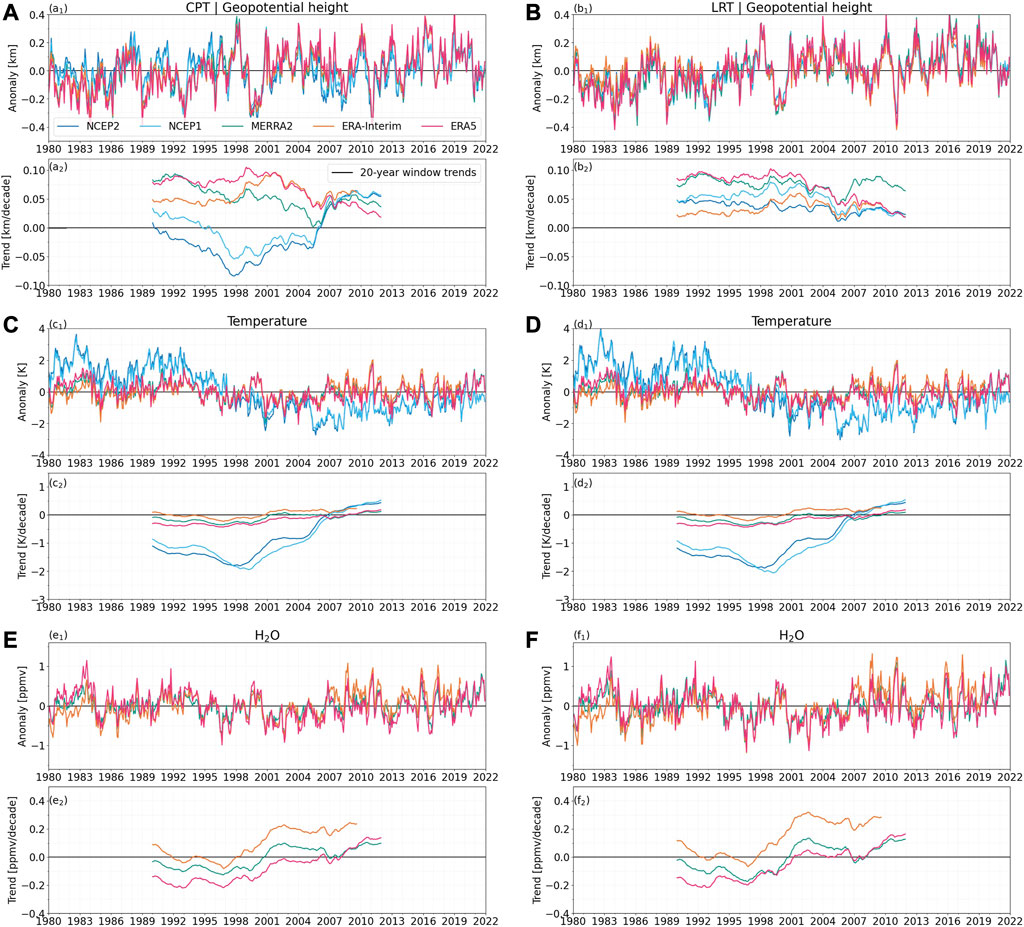
FIGURE 7. Time series of deseasonalized monthly anomalies of CPT and LRT height, temperature, and water vapor content in the tropics (±20°) from 1989 to 2021 (subplots labeled *1) and 20-year window trends for each month (subplots labeled *2, data points shown at the middle of each 20-year window).
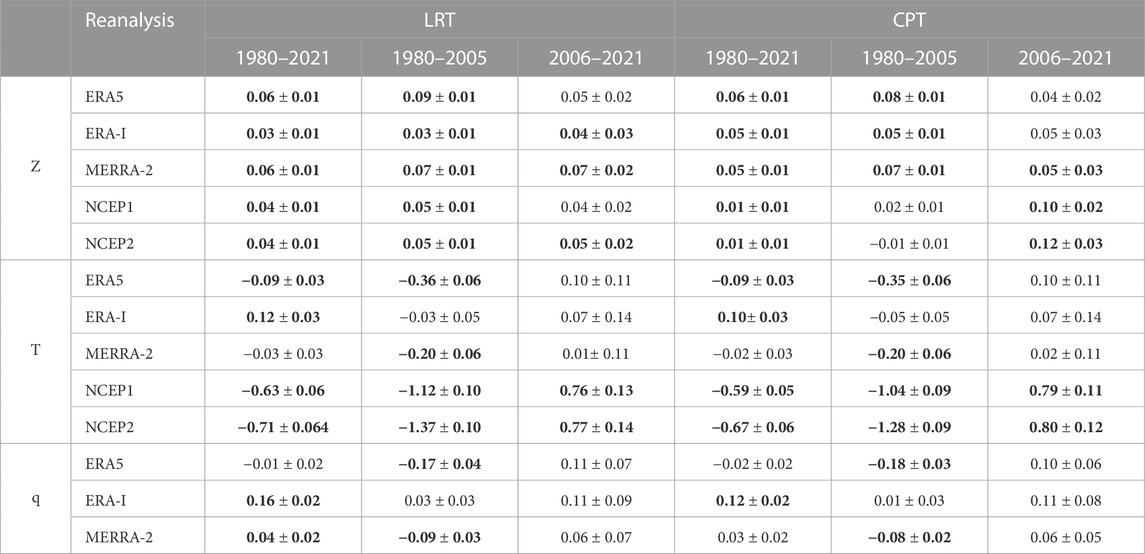
TABLE 2. Trends and standard errors (±σ) of the multivariate regression model fitted to tropopause height (Z: km/decade), temperature (T: K/decade), and water vapor content (q: ppmv/decade) for the tropics (±20° of latitude) over 1980–2021, 1980–2005, and 2006–2021 from ERA5, ERA-Interim, MERRA-2, NCEP1 and NCEP2. The regression models was applied after removing the seasonality of the data and considers the contributions of AOD, QBO and ENSO index. Bold font indicates trend significant at the 95% confidence level. Note that the time periods for the ERA-Interim data are 1980–2019 and 2006–2019.
A consistent and general rise in the tropical tropopause is found from 1980 to 2021 (Figure 7; Table 2). In ERA5, the long-term trend of the tropical tropopause height is approximately 0.06 km/decade. Similar positive trends are also found in ERA-Interim and MERRA-2 from 1980 to 2021 (noting that ERA-Interim data is limited to 1980–2019). In contrast to the rise in tropopause height, a tropopause cooling (−0.09 ± 0.03 K/decade) is detected in ERA5 from 1980 to 2021. Cooling of the tropical tropopause is also found in MERRA-2 and the NCEP reanalyses, but ERA-Interim has a warming tropopause, possibly due to different time scales. It is worth noting that the tropopause temperature in NCEP1/2 reanalyses decrease by about −0.6 K/decade, which should be treated with caution (Fujiwara et al., 2012; Fujiwara et al., 2010). Nearly no trend is found in the tropical tropopause water vapor content in ERA5, while moistening is shown in ERA-Interim (1980–2019) and MERRA-2. An increase in tropical tropopause height (about 0.7 km/decade) and a decrease in temperature (1.3 K/decade) have been found from the fifth Coupled Model Intercomparison Project (CMIP5) (Vallis et al., 2015; Hu and Vallis, 2019).
As radio occultation observations with a high sampling frequency were included in the reanalysis data since 2006 (Tegtmeier et al., 2020; Fujiwara et al., 2022), and an observable anomaly transition of tropopause temperature is found here (Figure 7C), as well as in comparison with previous studies, we separated the full time series into ranges of 1980–2005 and 2006–2021. Similar to the findings of Gettelman et al. (2010), Wang et al. (2012) and Tegtmeier et al. (2020), a cooling of the CPT is found in all reanalyses from the 1970s and early 1980s to 2005. The CPT temperature trends presented in Table 2 are comparable to the results in Tegtmeier et al. (2020) over 1979–2005 in NCEP1 (−1.04 K/decade vs. −1.3 K/decade), MERRA-2 (−0.20 K/decade vs. about −0.26 K/decade), and ERA-Interim (−0.05 K/decade vs. 0 K/decade), indicating the reliability of our results. Moreover, the deseasonalized CPT temperature anomalies in the modern reanalyses agree with the results of Randel and Park (2019, Figure 1) based on radiosonde and GPS data from 1991 to 2018, who also detected an increase of CPT temperature after 2006. ERA5 shows a cooling of the CPT (−0.35 ± 0.06 K/decade) during 1980–2005 along with a rise in tropopause height (0.08 ± 0.01 km/decade). However, from 2006 to 2021, ERA5 shows a warming of the CPT (0.10 K/decade) along with a slight rise in tropopause height (0.04 km/decade). Similar trends for tropical tropopause heights and temperatures are found in all reanalyses during those separate time periods (noting that ERA-Interim data is limited to 1980–2019).
In addition to analyzing fixed time periods, we also analyzed running 20-year window trends for each month, and the results are shown in Figure 7*2. We observe increasing tropopause heights for each 20-year period in all modern reanalyses. In ERA5, the increase in tropopause height is consistent during 1980–2010 (about 0.07 km/decade), but it slows down since 2001 (covering the window from 1991 to 2021). The 20-year trends of tropical tropopause temperature and water vapor content show similar patterns in ERA5, ERA-Interim, and MERRA-2, with temperature trends remaining relatively stable throughout the time period (±0.5 K/decade). However, the upward pattern of 20-year window trends in ERA5 suggests a decrease in tropopause cooling during 1990–2006 in Figures 7C2, D2 (1980–2016) and a transition to slight warming since 2006 (late 1990s). We also detect tropopause moistening since 2006. The warming and moistening of CPT since the late 1990s found in ERA5, ERA-Interim, and MERRA-2 has also been simulated in (Gettelman et al., 2010, Figures 16, 17) using models with different future scenarios.
Overall, the smallest differences are found between ERA5 and ERA-Interim/MERRA-2 in terms of tropical tropopause heights (≤0.1 km) and tropopause temperature (≤1 k). The tropopause height and temperature derived from NCEP1/2 reanalyses are generally higher than those from the modern reanalyses. A consistent increase in tropical tropopause height and cooling in tropical tropopause temperature is found in ERA5 and the other reanalyses from 1980 to 2021. However, a warming tropical tropopause is detected in ERA5 from 2006 to 2021, along with a continuous rise in tropopause height. The 20-year window trends also indicate a decline in the rise and cooling of the tropical tropopause, and a transition in temperature trend around the late 1990s.
3.3 Tropical width and its trend and variability
Along with global warming and the increase of the tropical tropopause height, the tropical belt was also found to be widening in recent decades (Seidel and Randel, 2007; Seidel et al., 2008; Birner, 2010; Staten et al., 2020). In this study, the methods of Davis2012 (ΔZ=1.5 km) and Davis2012 (Z=15 km) as described in Section 2.2) are used to identify the latitudes of the northern and southern edges of the tropical belt during 1980–2021. Davis2012 (Z=15 km) uses a fixed tropopause height threshold of 15 km to define the edges of the tropical region and analyzes the absolute variability of these edges over time. This approach is sensitive to globally uniform variations in tropopause height, and may not capture the local variability of the edges. In contrast, Davis2012 (ΔZ=1.5 km) is using a relative threshold metric to define the edges of the tropical region, based on the local variability of the WMO first tropopause height in the tropics. This approach allows for the analysis of local variations in the edges of the tropical region, and may provide a more accurate picture of the dynamics of the tropical tropopause. The annual tropical edges calculated from these two methods are shown in Figure 8, and the 42-year trends of the tropical edges and the width of the tropical belt are listed in Table 3.
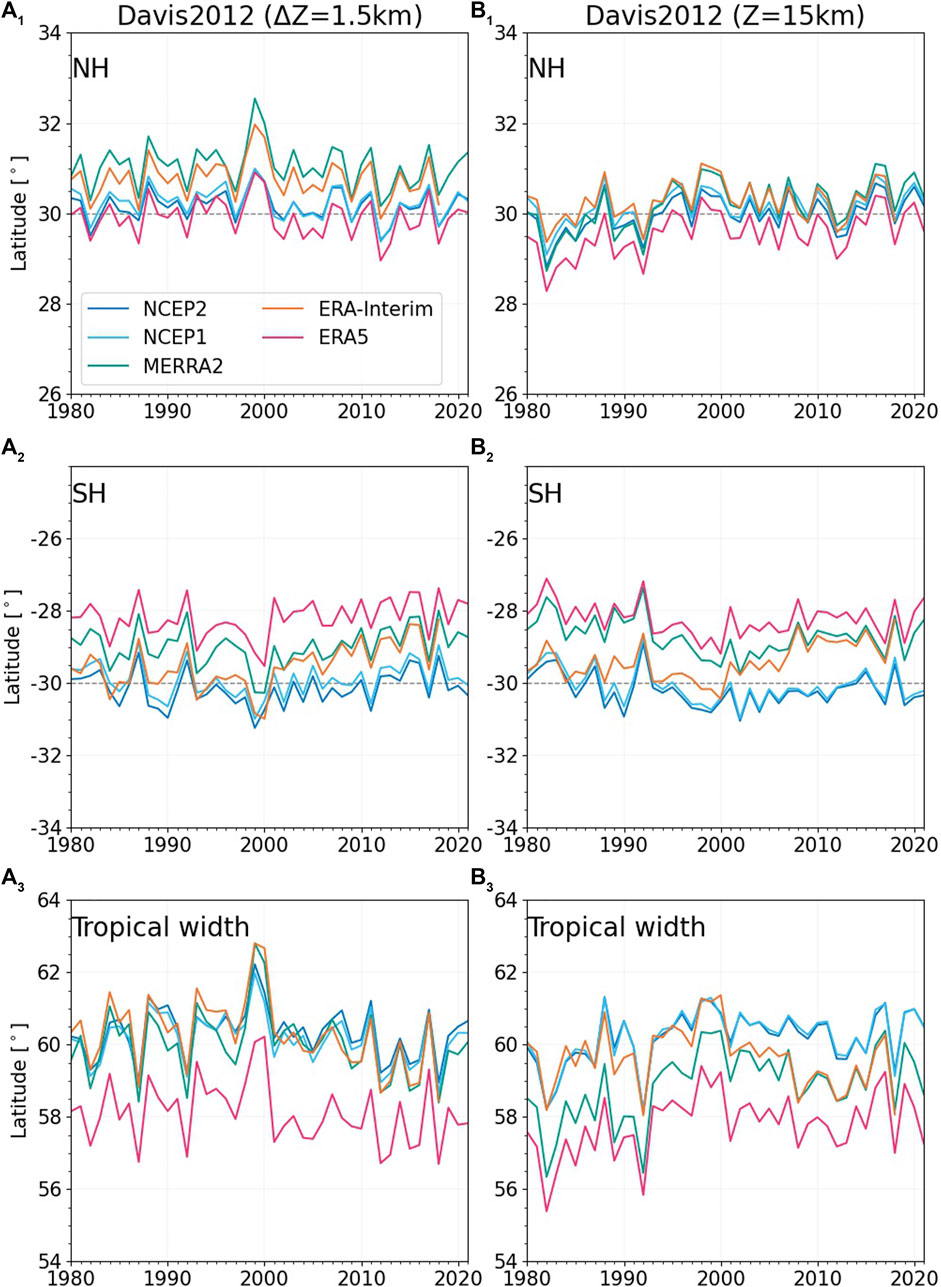
FIGURE 8. Time series of monthly zonal mean edges of the tropical belt and tropical widths during 1980–2021 based on the methods of Davis2012 (ΔZ=1.5 km) and Davis2012 (Z=15 km).
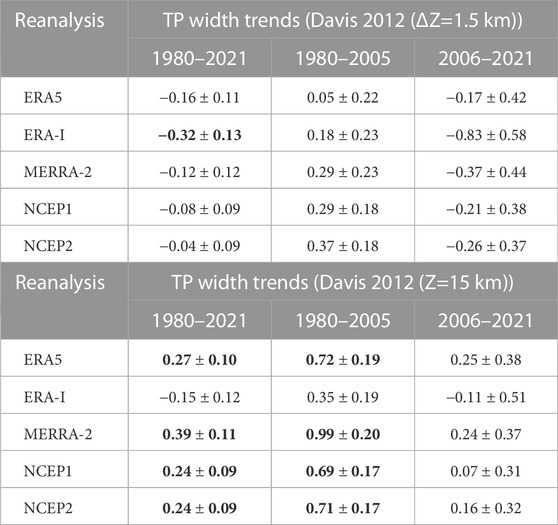
TABLE 3. Trends (°/decade) of tropical belt width from 1980 to 2021 and two separate time periods (1980–2005 and 2006–2021) based on the methods of Davis2012 (ΔZ=1.5 km) and Davis2012 (Z=15 km). The time periods for the ERA-Interim data are 1980–2019 and 2006–2019. Bold font indicates trends significant at the 95% confidence level.
In Figure 8, all reanalyses show consistent time series patterns within the same method from 1980 to 2021, which is in agreement with the results reported in Davis and Rosenlof (2012), Figure 2). ERA5 shows the narrowest tropical belt among all reanalyses. The differences in tropical width among the reanalyses may be attributed to their varying vertical resolution, as the reanalysis with the highest vertical resolution tends to have the smallest bias to radio occultation data and a warming tropopause (Wang et al., 2015; Tegtmeier et al., 2020). Large equatorward shifts detected in 1982, 1991, 2001, and 2018 are likely due to warming (or lowering) of the tropopause associated with volcanic eruptions (Lu et al., 2009). A strong poleward shift in 1999 detected in the Davis2012 (ΔZ=1.5 km) analysis is related to a particularly cold CPT before June caused by strong deep convection and tropical upwelling, and QBO variability (Cairo et al., 2008; Han et al., 2017).
Based on the absolute threshold in tropopause height (Davis2012 (Z=15 km)), a widening of the tropical belt is found in all reanalyses (except for ERA-Interim due to its different time scale) during 1980–2021 (Table 3). For instance, in ERA5, the tropical belt widens by 0.27 ± 0.10°/decade in Davis2012 (Z=15 km). Similarly, NCEP1 and NCEP2 show a widening trend of 0.24 ± 0.09°/decade, whereas MERRA-2 displays the largest tropical expansion of 0.39 ± 0.11°/decade. However, these trends from the absolute threshold metric may not reflect the actual poleward shift in the latitudinal pattern (Davis and Rosenlof, 2012).
In contrast, the relative threshold metric (Davis2012 (ΔZ=1.5 km)) shows a long-term tropical narrowing in all reanalyses from 1980 to 2021. According to Davis and Rosenlof (2012), the relative threshold metric, which is rather objective, accounts better for seasonal variations and latitudinal shifts in tropopause height, resulting in more accurate tropical edges and widths. In ERA5, for instance, the tropical belt narrows by −0.16 ± 0.11°/decade during 1980–2021. However, a widening of the tropics is found in 1980–2005 and narrowing is detected since 2006. Similar trends are found in other reanalyses. A narrowing of the tropics has been also found in Martin et al. (2020) with the objective tropopause break method showing that tropical width decreased by −0.46°/decade and −0.52°/decade in MERRA-2 and ERA-Interim from 1981 to 2015.
In Supplementary Appendix SC; Supplementary Appendix Table SC1 presents the trends of the tropical edges. The narrowing of the tropical belt can be observed in the equatorward trends of both edges using the Davis 2012 (ΔZ=1.5 km) metric. Conversely, the widening of the tropical belt can be observed in the polarward trends of both edges using the Davis 2012 (Z=15 km) metric. However, the presence of large standard deviations poses a challenge in drawing definitive conclusions regarding the trends of the tropical width. To gain a more comprehensive understanding of the trends in the tropical belt width, further research and the implementation of more robust analysis techniques are crucial.
Figure 9 displays the mean location of the tropical edges in ERA5 and the other reanalyses. The northern edge of the tropical belt ranges from 26°N to 34°N, while the southern edge varies from 23°S to 32°S. Land regions exhibit a more poleward tropical edge compared to the oceans. The farthest poleward edge is observed mostly over Asia between 30°E−160°E, while the farthest equatorward edge is located over the eastern Pacific (100°W-160°W). This longitudinal pattern agrees with previous studies investigating the tropopause break (Martin et al., 2020; Figure 2). The longitudinal pattern is consistent across different reanalyses, with the northern edges exhibiting better agreement than the southern edges. The closest equatorward edge is detected in ERA5 in both hemispheres. The trend of the edges between 1980 and 2021 is indicated by latitudinal arrows along the edge lines, with the length of the arrows indicating the magnitude of the trend. In the southern hemisphere, an equatorward trend is detected between 90°W and 150°W contributing most to the general tropical narrowing shown in Table 3.
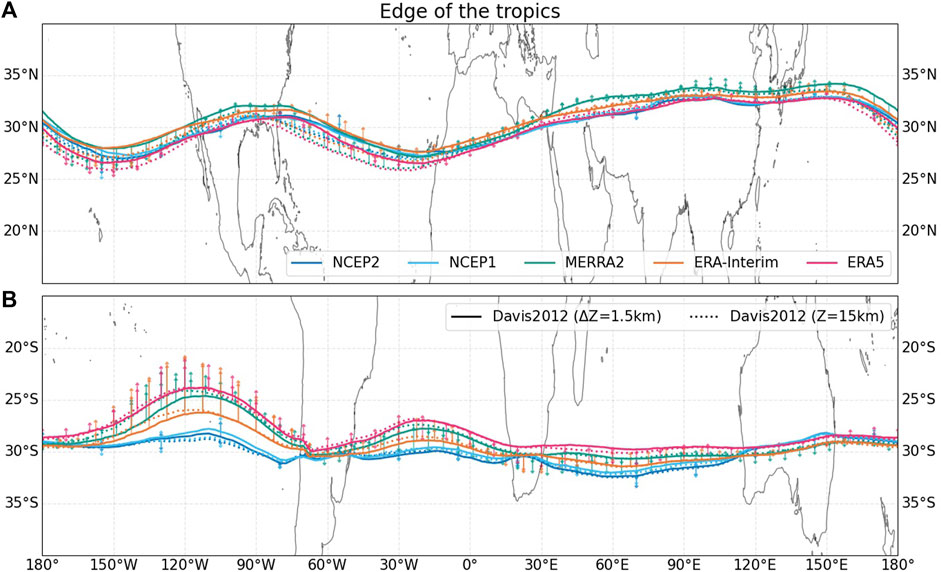
FIGURE 9. Mean location of the tropical edges in ERA5, ERA-Interim, MERRA-2, and NCEP1/2 from 1980 to 2021 (different colors), calculated using the methods of Davis 2012 (ΔZ=1.5 km) (solid lines) and Davis 2012 (Z=15 km) (dotted lines). The trend of the edges is indicated by latitudinal arrows along the edge lines. (A) Northern edge of the tropical belt, (B) Southern edge of the tropical belt.
Overall, our analysis indicates that all reanalyses show tropical narrowing using the relative threshold method (Davis2012 (ΔZ=1.5 km)) from 1980 to 2021 as well as from 2006 to 2021. However, using the absolute threshold method (Davis2012 (Z=15 km)), widening of tropics is found in all analyzed reanalyses (except for ERA-Interim due to its different time scale) during the same period. The choice of the method used to detect the tropical edges greatly impacts the assessment of tropical width, highlighting the need for a more objective approach. Additionally, the vertical resolution of the reanalysis data influences the location of tropical edges, for example, ERA5 has the narrowest tropical belt among the analyzed reanalyses.
4 Discussion
In addition to assessing the characteristics and trends of the tropopause in ERA5, in this study we also analyzed the tropopause from four other reanalyses. Large differences are detected between ERA5 and the NCEP1/2 reanalyses, which can be attributed to the different sources of temperature data used in their production (Fujiwara et al., 2022, Table. 2.21). However, the differences between NCEP1/2 and the other reanalyses decrease over time. For example, the CPT temperature difference decreases from ∼5 K from 1980 to the early 2000s to ∼2 K after the 2000s. NCEP data from 1982 to present were produced by running one stream, however, it was reprocessed again in the late 1990s and early 2000s (Fujiwara et al., 2022, Figure 2.19). The NCEP1 reanalyses was considered to be “demonstrated unsuitable” for tropopause temperature analyses (Fujiwara et al., 2022). However, NCEP1 data have been used in many previous studies (Randel et al., 2000; Santer et al., 2003; Wong and Wang, 2003; Borsche et al., 2007). Moreover, we find that the tropopause height differences between NCEP1/2 and ERA5 are small, especially for the LRT height, and the mean annual cycle and monthly mean time series show similar features as other modern reanalyses.
In this study, we also assessed whether the representation of the tropopause improved from NCEP1 to NCEP2. The NCEP2 reanalysis is an upgraded version of the NCEP1 reanalysis, specifically designed to address human processing errors present in the earlier dataset (NCEP/NCAR). Significant improvements have been made in the NCEP2 reanalysis mainly with regard to land surface parameters and land-ocean fluxes compared to the NCEP1 reanalysis. However, the actual differences we found between NCEP1 and NCEP2 in tropopause height and temperature are rather small. The tropical tropopause heights are nearly identical and the tropical tropopause temperature in NCEP2 is only about 0.3 K higher than that in NCEP1. This is in line with Kanamitsu et al. (2002), who found only minimal differences between NCEP1 and NCEP2 in primary analysis variables such as geopotential heights and winds in the free troposphere in the Northern Hemisphere extratropics. Additionally, Fujiwara et al. (2012, Figure 1) showed there are only small differences of temperature at 100 hPa from NCEP1 to NCEP2. The results found here are consistent with related work. While tropopause heights show more consistency, NCEP tropopause temperatures need to be considered more carefully because of their larger deviations and different trends compared to modern reanalyses. Caution should be taken when interpreting specific results from NCEP1/2.
We found a consistent and general rise of the tropical tropopause from 1980 to 2021, as shown in Figure 7 and summarized in Table 2). However, notable variability is observed in two distinct time periods: 1980–2005 and 2006–2021. During the time period from 1980 to 2005, significant differences in trends are observed among the reanalyses. However, from 2006 to 2021, the trends among the reanalyses show a higher degree of similarity. It is important to note that this latter time period coincides with the availability of a substantial amount of COSMIC GPS-RO observations for data assimilation, providing highly accurate atmospheric temperature profiles in the upper troposphere and lower stratosphere region on a global scale. Previous findings for similar time periods as in this study have been compiled in Table 4. During the 1980–2005 time period, the rise of the tropical tropopause height (0.08 ± 0.01 km/decade) is accompanied by cooling of the tropopause (−0.35 ± 0.04 K/decade) in the ERA5 dataset. The trends in cold point tropopause (CPT) temperatures across different reanalyses, as shown in Table 2, are comparable to the results presented in Tegtmeier et al. (2020, Figure 11) for the 1979–2005 period. For example, the trend in CPT temperature in MERRA-2 is reported as −0.20 K/decade in our study compared to ∼ − 0.26 K/decade in Tegtmeier et al. (2020). Similarly, the trends in ERA-Interim (−0.05 K/decade vs. 0 K/decade) and NCEP1 (−1.04 K/decade vs. −1.3 K/decade) are also consistent with the estimates in Tegtmeier et al. (2020). These findings indicate the reliability of our results.
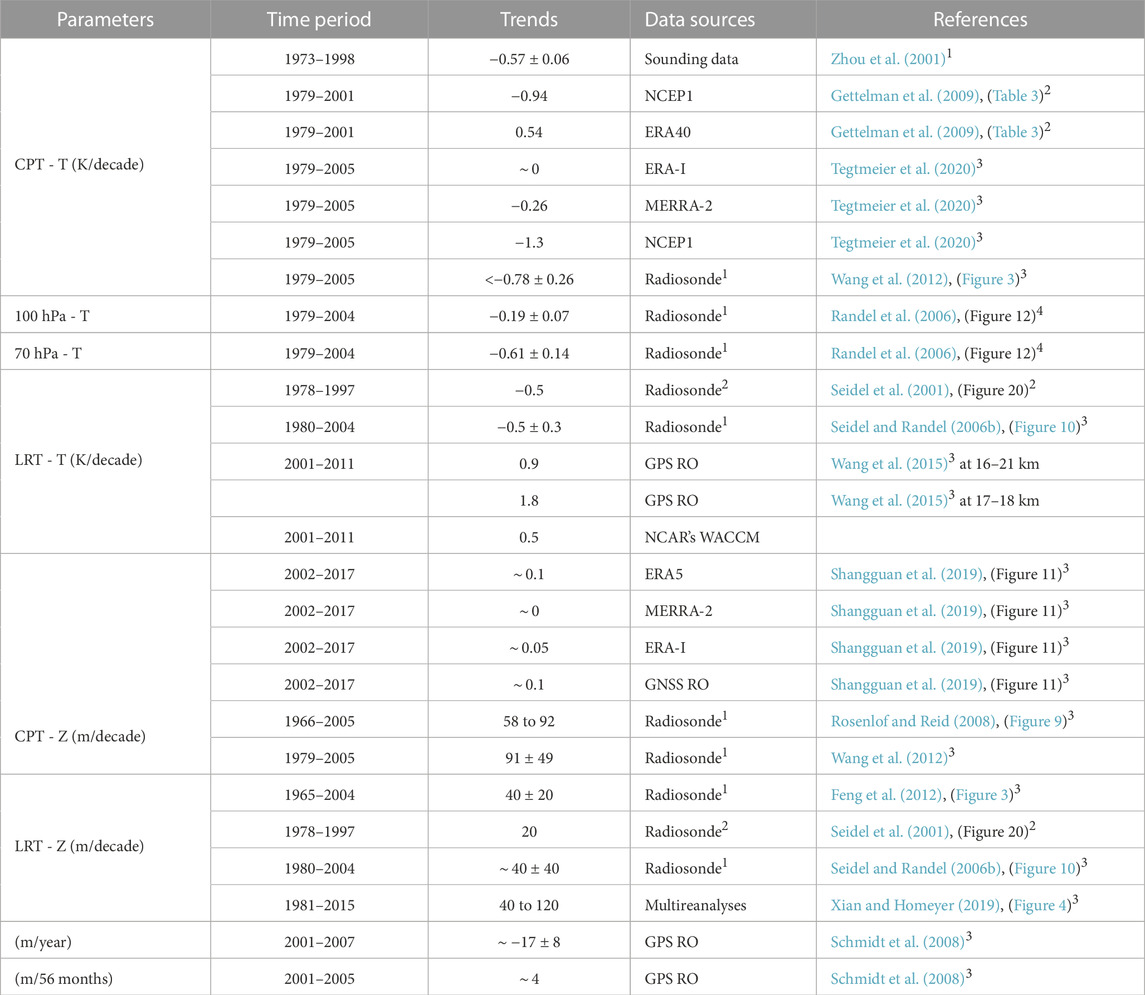
TABLE 4. Overview on trend estimates in tropical tropopause temperature (T) and height (Z) from different studies. Radiosondes1 is radiosonde data from the Integrated Global Radiosonde Archive (IGRA), Radiosondes2 refers to radiosonde data from the Comprehensive Aerological Reference Data Set. The superscripts for the references indicate the latitude ranges covered in each study: 1: 10°S-10°N; 2: 15°S-15°N; 3: 20°S-20°N; 4: 25°S-25°N.
The cooling of the CPT and LRT from the 1980s to the early 2000s is also supported by numerous other studies using various data sources, as summarized in (Table 4). For example, Gettelman et al. (2009) reported a CPT temperature change of −0.94 K/decade in NCEP1 from 1979 to 2001. Wang et al. (2012) and Seidel D. J. and Randel W. J. (2006) observed cooling trends in CPT (−0.78 ± 0.26 K/decade from 1979 to 2005) and LRT (−0.50 ± 0.30 K/decade from 1980 to 2004), respectively, using radiosonde data. Additionally, Wang et al. (2012) found an increase in CPT height of 91 ± 49 m/decade from 1979 to 2005, while Seidel D. J. and Randel W. J. (2006) reported an increase of approximately 40 ± 40 m/decade in LRT height from 1980 to 2004 and Feng et al. (2012) found an increase of 40 ± 20 m/decade from 1965 to 2004. The trends in LRT height (40–120 m/decade) from 1981 to 2015 presented by Xian and Homeyer (2019) for various reanalyses (including ERA-Interim, JRA-55, MERRA-2, and CFSR) are mostly consistent with our results for the time period from 1980 to 2021 (40–60 m/decade). The rising tropopause height and cooling of the tropopause are commonly attributed to the cooling of the stratosphere induced by ozone and greenhouse gases, along with warming of the upper troposphere (Santer et al., 2003).
During the time period from 2006 to 2021, we observe a slowing rise in tropopause height (0.05 ± 0.02 km/decade) accompanied by tropopause warming (0.10 ± 0.11 K/decade). The deseasonalized CPT temperature anomalies in ERA5 align with the results presented in Randel and Park (2019), Figure 1), who analyzed radiosonde and GPS data from 1991 to 2018 which also indicated an increase in CPT temperature after 2006. Positive trends in LRT temperature (ranging from 0 to approximately 0.10 K/decade) were also found by Shangguan et al. (2019), Figure 11) using Global Navigation Satellite System radio occultation (GNSS RO), ERA5, and ERA-Interim data from 2002 to 2017. Similarly, Wang et al. (2015) observed a warming trend of 1.8 K/decade in the LRT at an altitude range of 17–18 km from GPS radio occultation (RO) data for the period 2001–2011. It is worth noting that different studies may present different trends due to the selection of the different time periods for the analysis. For instance, Schmidt et al. (2008) found a decrease in tropopause height (−17 ± 8 m/year) over the time period of 2001–2007 using GPS RO data. However, in the same dataset, they observed a slight increase in LRT height (approximately 4 m/56 months) from May 2001 to December 2005. These discrepancies highlight the potential strong impact of the selected time periods on trend estimates due to the variability of the underlying data. The role of ozone in driving the slight warming observed in the tropical lower stratosphere has been investigated by Shangguan et al. (2019). While they found a weak contribution from ozone, they suggested that sea surface temperature could be another driver of long-term temperature trends in the UTLS.
The variability of the tropopause characteristics is known to be influenced by several factors, including ENSO, QBO, and volcanic eruptions (Randel et al., 2000; Wang et al., 2015; Tegtmeier et al., 2020). In order to eliminate their potential influence on the trends, we applied multivariate regression with the results presented in Table 2. Figure 10 illustrates the contributions of the QBO, ENSO, and the AOD on the long-term variability of CPT geopotential height and temperature. Rows 1-3 of Figure 10 present the individual contribution of QBO, ENSO, and AOD. We find that the contribution of AOD on the variability of tropopause is significant around 1983 and 1992, while the impact of QBO and ENSO on the variability of tropopause is relatively small. Row 4 of Figure 10 shows the deseasonalized data and the data where all contributions (QBO, ENSO, AOD) are removed. The differences between Table 2 and Table 5 indicate that the autocorrelation of long-term tropopause features related to AOD, QBO, and ENSO is partly eliminated by the multivariate regression analysis.
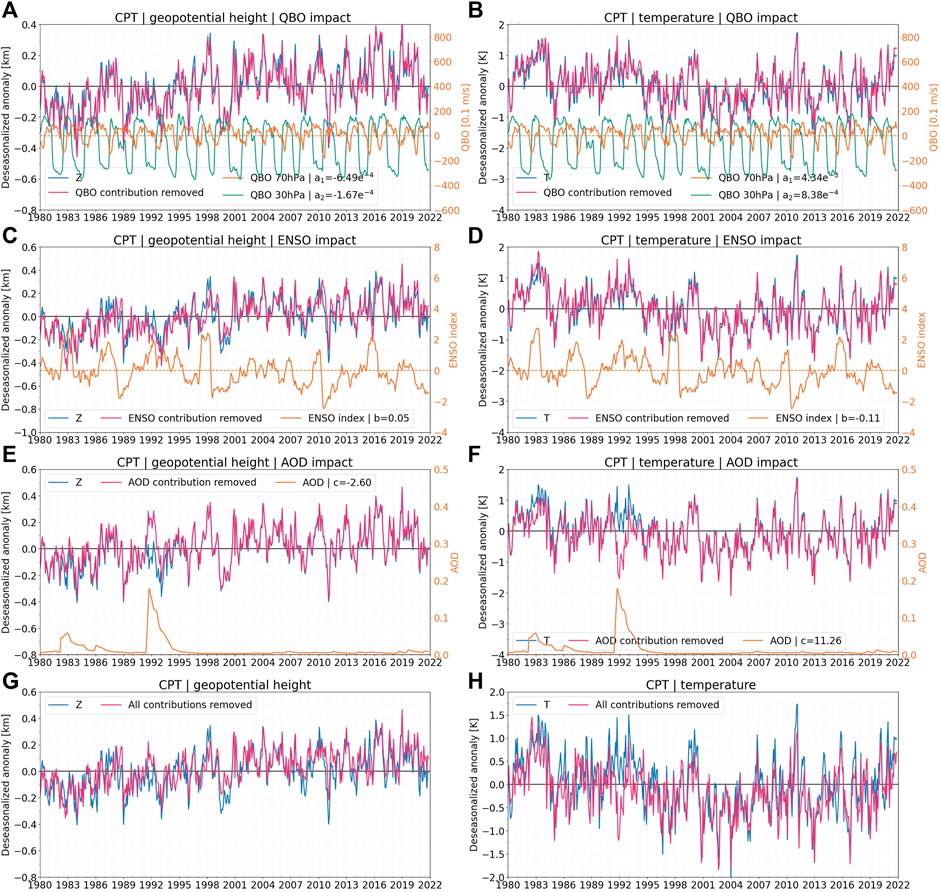
FIGURE 10. Example of multivariate regression analysis can be seen in the application of CPT geopotential height and temperature, where three variables are applied: QBO, ENSO index, and AOD.
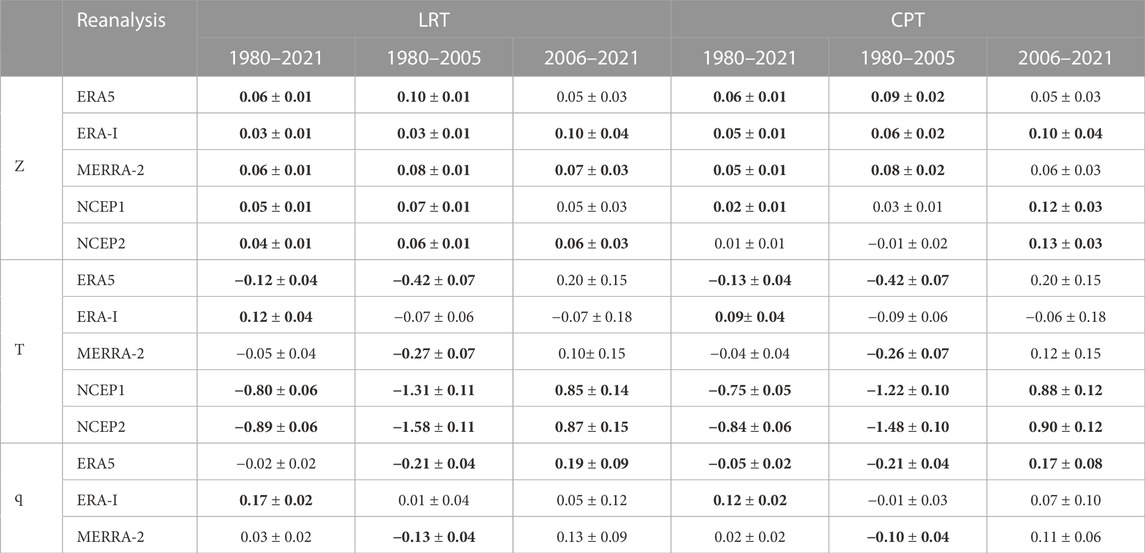
TABLE 5. Linear trends in tropopause height (Z: km/decade), temperature (T: K/decade), and water vapor content (q: ppmv/decade) and their uncertainties without applying the multivariate regression model for the tropics (±20°) over 1980–2021, 1980–2005, and 2006–2021 from ERA5, ERA-Interim, MERRA-2, and NCEP. The time periods for the ERA-Interim data are 1980–2019 and 2006–2019. Bold font indicates trend significant at the 95% level.
5 Conclusion
Given the significant role of the tropopause in regulating the exchange of air between the troposphere and stratosphere, as well as controlling the distribution of important atmospheric constituents such as ozone, aerosols, and water vapor in the stratosphere, it is imperative to accurately characterize its spatial and temporal variability. The study of the tropical tropopause and its variability is indeed crucial due to the dominant influence of upwelling of air in the tropics.
This study investigates the variability and trends of tropopause height, tropopause temperature, and tropopause water vapor content from 1980 to 2021 in the ERA5 reanalysis dataset, along with comparisons to four other reanalyses, i. e., ERA-Interim, MERRA-2, NCEP/NCAR Reanalysis 1, and NCEP/DOE Reanalysis 2. Both the WMO lapse rate tropopause (LRT) and cold point tropopause (CPT) are derived from the reanalysis datasets, and the tropical edges are identified based on tropopause height to deduce the variability of the tropical width as well as its trends.
Regarding the comparison and assessment of different reanalysis datasets, the smallest biases are found between ERA5 and ERA-Interim/MERRA-2 in terms of tropopause heights (≤0.1 km) and tropopause temperatures (≤1 K) in the tropics. NCEP1/2 reanalyses generally result in higher tropopause heights and temperatures than the other reanalyses. The tropical tropopause characteristics in NCEP1 and NCEP2 exhibit consistency between them, with minor differences observed in tropopause temperature.
Consistent increases in tropical tropopause height and decreases in tropical tropopause temperature are found in ERA5 (0.06 km/decade and −0.09 K/decade over a latitude range of ±20°) and other reanalyses from 1980 to 2021. The finding of tropical tropopause rise and cooling is consistent with previous studies attributing it to ozone- and greenhouse gas–induced cooling of the stratosphere and warming of the upper troposphere (Santer et al., 2003). However, an interesting shift in the tropopause temperature from cooling to warming has been identified in the period 2006–2021, accompanied by a continued rise in tropopause height. The 20-year window trends also indicate a reversal of the tropopause temperature trend from a decrease to an increase around the early 2000s. The inclusion of more radio occultation observations in the reanalysis data and the variability of the tropopause ozone and sea surface temperature could impact the transition of tropopause temperature after 2006 (Wang et al., 2015; Shangguan et al., 2019; Fujiwara et al., 2022).
Additionally, we applied the tropopause heights obtained from the aforementioned reanalysis datasets to assess the temporal and spatial variability of the tropical edges and the tropical width. We found a widening of the tropical belt (0.05 ± 0.22°/decade) during the time period from 1980 to 2005, followed by a narrowing (−0.17 ± 0.42°/decade) from 2006 to 2021, as indicated by ERA5 reanalysis data. However, the uncertainties associated with the trends are relatively large, which makes it challenging to draw definitive conclusions. Since changes in the width of the tropics can impact the distribution of precipitation, cloud cover, and atmospheric circulation patterns (Grise et al., 2018), we emphasize the need for further research and more robust analyses to reduce uncertainties and obtain a clearer understanding of the trends in the width of the tropical belt.
The results derived from ERA5 and other reanalyses offer valuable insights into tropopause characteristics, however, it is crucial to acknowledge potential uncertainties and biases inherent in reanalysis data. These uncertainties arise from evolving observational data assimilation and variations in biases and offsets of different instruments. Nevertheless, this study has advanced our understanding of the tropopause dynamics and its implications on the tropical belt. The open access reanalysis tropopause data sets (Hoffmann and Spang, 2022) analyzed and discussed here are regarded as an important asset to better understand the characteristics of the tropopause and its long-term changes in future work.
Data availability statement
The ERA5 and ERA-Interim reanalysis data sets (Dee et al., 2011; Hersbach et al., 2020) were retrieved from ECMWF’s Meteorological Archival and Retrieval System (MARS). Further details about the datasets can be found at https://www.ecmwf.int/en/forecasts/dataset/ecmwf-reanalysis-v5 and https://www.ecmwf.int/en/forecasts/dataset/ecmwf-reanalysis-interim. The MERRA-2 dataset (Gelaro et al., 2017) was obtained from the Goddard Earth Observing System, version 5 (GEOS-5) assimilation system. For more information about the MERRA-2 dataset, visit https://gmao.gsfc.nasa.gov/reanalysis/MERRA-2/. The NCEP/NCAR Reanalysis 1 (Kalnay et al., 1996; Kistler et al., 2001) was performed by the National Centers for Environmental Prediction and the National Center for Atmospheric Research. To access the NCEP/NCAR Reanalysis 1 dataset, please visit http://psl.noaa.gov/data/gridded/data.ncep.reanalysis.html. The National Centers for Environmental Prediction-Department of Energy (NCEP-DOE) Atmospheric Model Intercomparison Project (AMIP)-II Reanalysis 2 (Kanamitsu et al., 2002) dataset is available at https://www.ncei.noaa.gov/access/metadata/landing-page/bin/iso?id=gov.noaa.ncdc:C01311. The reanalysis tropopause datasets (Hoffmann and Spang, 2021) used in this study are publicly available through an open data repository hosted at https://datapub.fz-juelich.de/slcs/tropopause/ (last accessed on 19 July 2023) or via https://doi.org/10.26165/JUELICH-DATA/UBNGI2 (last accessed on 19 July 2023).
Author contributions
Conceptualization: LH, LZ, RM, and RS; Data curation: LH; Formal analysis: LZ; Investigation: LZ; Methodology: LH, LZ, RM, and RS; Software: LH; Visualization: LZ; Writing–original draft: LH and LZ; Writing–review editing: LH, RM, RS, and LZ. All authors contributed to the article and approved the submitted version.
Funding
This research was supported by the Helmholtz Association of German Research Centres (HGF) through the Joint Laboratory for Exascale Earth System Modeling (JL-ExaESM) at Forschungszentrum Jülich.
Acknowledgments
The authors are grateful to the Jülich Supercomputing Center for providing computing time and storage resources on the JUWELS supercomputer. The authors would also like to thank their colleagues at the Jülich Supercomputing Centre and at the Institute of Energy and Climate Research at Forschungszentrum Jülich for their valuable feedback and suggestions.
Conflict of interest
The authors declare that the research was conducted in the absence of any commercial or financial relationships that could be construed as a potential conflict of interest.
Publisher’s note
All claims expressed in this article are solely those of the authors and do not necessarily represent those of their affiliated organizations, or those of the publisher, the editors and the reviewers. Any product that may be evaluated in this article, or claim that may be made by its manufacturer, is not guaranteed or endorsed by the publisher.
Supplementary material
The Supplementary Material for this article can be found online at: https://www.frontiersin.org/articles/10.3389/feart.2023.1177502/full#supplementary-material
References
Bethan, S., Vaughan, G., and Reid, S. J. (1996). A comparison of ozone and thermal tropopause heights and the impact of tropopause definition on quantifying the ozone content of the troposphere. Q. J. R. Meteorological Soc. 122, 929–944. doi:10.1002/qj.49712253207
Birner, T. (2010). Recent widening of the tropical belt from global tropopause statistics: sensitivities. J. Geophys. Res. Atmos 115, D23109. doi:10.1029/2010JD014664
Borsche, M., Kirchengast, G., and Foelsche, U. (2007). Tropical tropopause climatology as observed with radio occultation measurements from CHAMP compared to ECMWF and NCEP analyses. Geophys. Res. Lett. 34, L03702. doi:10.1029/2006GL027918
Bourguet, S., and Linz, M. (2022). The impact of improved spatial and temporal resolution of reanalysis data on Lagrangian studies of the tropical tropopause layer. Atmos. Chem. Phys 22, 13325–13339. doi:10.5194/acp-22-13325-2022
Box, G. E., Jenkins, G. M., Reinsel, G. C., and Ljung, G. M. (2015). Time series analysis: forecasting and control. New Jersey, United States: John Wiley and Sons.
Browell, E. V., Fenn, M. A., Butler, C. F., Grant, W. B., Clayton, M. B., Fishman, J., et al. (1996). Ozone and aerosol distributions and air mass characteristics over the South Atlantic Basin during the burning season. J. Geophys. Res. Atmos. 101, 24043–24068. doi:10.1029/95JD02536
Brewer, A. W. (1949). Evidence for a world circulation provided by the measurements of helium and water vapour distribution in the stratosphere. Q. J. R. Meteorological Soc 75, 351–363. doi:10.1002/qj.49707532603
Cairo, F., Buontempo, C., MacKenzie, A. R., Schiller, C., Volk, C. M., Adriani, A., et al. (2008). Morphology of the tropopause layer and lower stratosphere above a tropical cyclone: a case study on cyclone davina (1999). Atmos. Chem. Phys 8, 3411–3426. doi:10.5194/acp-8-3411-2008
Davis, S. M., and Rosenlof, K. H. (2012). A multidiagnostic intercomparison of tropical-width time series using reanalyses and satellite observations. J. Clim. 25, 1061–1078. doi:10.1175/JCLI-D-11-00127.1
Dee, D. P., Uppala, S. M., Simmons, A. J., Berrisford, P., Poli, P., Kobayashi, S., et al. (2011). The ERA-interim reanalysis: configuration and performance of the data assimilation system. Q. J. R. Meteorological Soc. 137, 553–597. doi:10.1002/qj.828
Durbin, J., and Watson, G. S. (1950). Testing for serial correlation in least squares regression: i. I 37, 409–428. doi:10.2307/2332391
Feng, S., Fu, Y., and Xiao, Q. (2012). Trends in the global tropopause thickness revealed by radiosondes. Geophys. Res. Lett. 39, L20706. doi:10.1029/2012GL053460
Free, M., and Lanzante, J. (2009). Effect of volcanic eruptions on the vertical temperature profile in radiosonde data and climate models. J. Clim. 22, 2925–2939. doi:10.1175/2008JCLI2562.1
Fueglistaler, S., Dessler, A. E., Dunkerton, T. J., Folkins, I., Fu, Q., and Mote, P. W. (2009). Tropical tropopause layer. Rev. Geophys. 47. doi:10.1029/2008RG000267
Fujiwara, M., Hibino, T., Mehta, S. K., Gray, L., Mitchell, D., and Anstey, J. (2015). Global temperature response to the major volcanic eruptions in multiple reanalysis data sets. Atmos. Chem. Phys. 15, 13507–13518. doi:10.5194/acp-15-13507-2015
Fujiwara, M., Manney, G. L., Gray, L. J., and Wright, J. S. (2022). “SPARC reanalysis intercomparison Project (S-rip) final report,”. Report No: wcrp-6/2021 SPARC Report No. 10. doi:10.17874/800dee57d13
Fujiwara, M., Suzuki, J., Gettelman, A., Hegglin, M. I., Akiyoshi, H., and Shibata, K. (2012). Wave activity in the tropical tropopause layer in seven reanalysis and four chemistry climate model data sets. J. Geophys. Res. Atmos 117, D12105. doi:10.1029/2011JD016808
Fujiwara, M., Vömel, H., Hasebe, F., Shiotani, M., Ogino, S.-Y., Iwasaki, S., et al. (2010). Seasonal to decadal variations of water vapor in the tropical lower stratosphere observed with balloon-borne cryogenic frost point hygrometers. J. Geophys. Res. Atmos. 115, D18304. doi:10.1029/2010JD014179
Fujiwara, M., Wright, J. S., Manney, G. L., Gray, L. J., Anstey, J., Birner, T., et al. (2017). Introduction to the SPARC reanalysis intercomparison Project (S-rip) and overview of the reanalysis systems. Atmos. Chem. Phys. 17, 1417–1452. doi:10.5194/acp-17-1417-2017
Gelaro, R., McCarty, W., Suárez, M. J., Todling, R., Molod, A., Takacs, L., et al. (2017). The Modern-Era Retrospective analysis for research and applications, version 2 (MERRA-2). J. Clim. 30, 5419–5454. doi:10.1175/JCLI-D-16-0758.1
Gettelman, A., Birner, T., Eyring, V., Akiyoshi, H., Bekki, S., Brühl, C., et al. (2009). The tropical tropopause layer 1960–2100. Atmos. Chem. Phys. 9, 1621–1637. doi:10.5194/acp-9-1621-2009
Gettelman, A., Hegglin, M. I., Son, S.-W., Kim, J., Fujiwara, M., Birner, T., et al. (2010). Multimodel assessment of the upper troposphere and lower stratosphere: tropics and global trends. J. Geophys. Res. Atmos. 115, D00M08. doi:10.1029/2009JD013638
Gettelman, A., Hoor, P., Pan, L. L., Randel, W. J., Hegglin, M. I., and Birner, T. (2011). The extratropical upper troposphere and lower stratosphere. Rev. Geophys. 49, RG3003. doi:10.1029/2011RG000355
Griessbach, S., Hoffmann, L., Spang, R., von Hobe, M., Müller, R., and Riese, M. (2016). Infrared limb emission measurements of aerosol in the troposphere and stratosphere. Atmos. Meas. Tech 9, 4399–4423. doi:10.5194/amt-9-4399-2016
Grise, K. M., Davis, S. M., Staten, P. W., and Adam, O. (2018). Regional and seasonal characteristics of the recent expansion of the tropics. J. Clim. 31, 6839–6856. doi:10.1175/JCLI-D-18-0060.1
Han, Y., Xie, F., Zhang, S., Zhang, R., Wang, F., and Zhang, J. (2017). An analysis of tropical cold-point tropopause warming in 1999. Adv. Meteorology 2017, 1–11. doi:10.1155/2017/4572532
Hardiman, S. C., Boutle, I. A., Bushell, A. C., Butchart, N., Cullen, M. J. P., Field, P. R., et al. (2015). Processes controlling tropical tropopause temperature and stratospheric water vapor in climate models. J. Clim. 28, 6516–6535. doi:10.1175/JCLI-D-15-0075.1
Hatsushika, H., and Yamazaki, K. (2001). Interannual variations of temperature and vertical motion at the tropical tropopause associated with ENSO. Geophys. Res. Lett. 28, 2891–2894. doi:10.1029/2001GL012977
Hennermann, K., and Berrisford, P. (2018). What are the changes from ERA-Interim to ERA5? Available at: https://confluence.ecmwf.int/pages/viewpage.action?pageId=74764925.
Hersbach, H., Bell, B., Berrisford, P., Hirahara, S., Horányi, A., Muñoz-Sabater, J., et al. (2020). The ERA5 global reanalysis. Q. J. R. Meteorological Soc. 146, 1999–2049. doi:10.1002/qj.3803
Highwood, E. J., and Hoskins, B. J. (1998). The tropical tropopause. Q. J. R. Meteorological Soc. 124, 1579–1604. doi:10.1002/qj.49712454911
Hoffmann, L., Günther, G., Li, D., Stein, O., Wu, X., Griessbach, S., et al. (2019). From ERA-interim to ERA5: the considerable impact of ECMWF’s next-generation reanalysis on Lagrangian transport simulations. Atmos. Chem. Phys. 19, 3097–3124. doi:10.5194/acp-19-3097-2019
Hoffmann, L., and Spang, R. (2022). An assessment of tropopause characteristics of the ERA5 and ERA-Interim meteorological reanalyses. Atmos. Chem. Phys. 22, 4019–4046. doi:10.5194/acp-22-4019-2022
Hoffmann, L., and Spang, R. (2021). Reanalysis tropopause data repository. Jülich, Germany: Forschungszentrum Jülich GmbH. [Dataset]. doi:10.26165/JUELICH-DATA/UBNGI2
Hoinka, K. P. (1997). Die tropopause: entdeckung, definition, bestimmung. Meteorol. Z. 6, 281–303. doi:10.1127/metz/6/1997/281
Holton, J. R., Haynes, P. H., McIntyre, M. E., Douglass, A. R., Rood, R. B., and Pfister, L. (1995). Stratosphere-troposphere exchange. Rev. Geophys. 33, 403–439. doi:10.1029/95RG02097
Hu, S., and Vallis, G. K. (2019). Meridional structure and future changes of tropopause height and temperature. Q. J. R. Meteorological Soc. 145, 2698–2717. doi:10.1002/qj.3587
Kalnay, E., Kanamitsu, M., Kistler, R., Collins, W., Deaven, D., Gandin, L., et al. (1996). The NCEP/NCAR 40-year reanalysis Project. Bull. Am. Meteorological Soc. 77, 437–471. doi:10.1175/1520-0477(1996)077⟨0437:tNYRP⟩2.0.CO;2
Kanamitsu, M., Ebisuzaki, W., Woollen, J., Yang, S.-K., Hnilo, J. J., Fiorino, M., et al. (2002). NCEP–DOE AMIP-II reanalysis (R-2). Bull. Am. Meteorological Soc. 83, 1631–1644. doi:10.1175/BAMS-83-11-1631
Kistler, R., Kalnay, E., Collins, W., Saha, S., White, G., Woollen, J., et al. (2001). The NCEP–NCAR 50-year reanalysis: monthly means CD-ROM and documentation. Bull. Am. Meteorological Soc. 82, 247–267. doi:10.1175/1520-0477(2001)082⟨0247:tNYRM⟩2.3.CO;2
Koster, R. D., Bosilovich, M. G., Akella, S., Lawrence, C., Cullather, R., Draper, C., et al. (2015). Technical report series on global modeling and data assimilation. Report No:gsfc-e-daa-tn29739. Available at: https://ntrs.nasa.gov/citations/20160005045 43.
Lu, J., Deser, C., and Reichler, T. (2009). Cause of the widening of the tropical belt since 1958. Geophys. Res. Lett. 36, L03803. doi:10.1029/2008GL036076
Lucas, C., Timbal, B., and Nguyen, H. (2014). The expanding tropics: a critical assessment of the observational and modeling studies. WIREs Clim. Change 5, 89–112. doi:10.1002/wcc.251
Manney, G. L., Hegglin, M. I., Lawrence, Z. D., Wargan, K., Millán, L. F., Schwartz, M. J., et al. (2017). Reanalysis comparisons of upper tropospheric–lower stratospheric jets and multiple tropopauses. Atmos. Chem. Phys. 17, 11541–11566. doi:10.5194/acp-17-11541-2017
Manney, G. L., and Hegglin, M. I. (2018). Seasonal and regional variations of long-term changes in upper-tropospheric jets from reanalyses. J. Clim. 31, 423–448. doi:10.1175/JCLI-D-17-0303.1
Martin, E. R., Homeyer, C. R., McKinzie, R. A., McCarthy, K. M., and Xian, T. (2020). Regionally varying assessments of upper-level tropical width in reanalyses and CMIP5 models using a tropopause break metric. J. Clim. 33, 5885–5903. doi:10.1175/JCLI-D-19-0629.1
Meng, L., Liu, J., Tarasick, D. W., Randel, W. J., Steiner, A. K., Wilhelmsen, H., et al. (2021). Continuous rise of the tropopause in the northern hemisphere over 1980–2020. Sci. Adv. 7, eabi8065. doi:10.1126/sciadv.abi8065
Naujokat, B. (1986). An update of the observed quasi-biennial oscillation of the stratospheric winds over the tropics. J. Atmos. Sci. 43, 1873–1877. doi:10.1175/1520-0469(1986)043⟨1873:aUOTOQ⟩2.0.CO;2
Pan, L. L., Honomichl, S. B., Bui, T. V., Thornberry, T., Rollins, A., Hintsa, E., et al. (2018). Lapse rate or cold point: the tropical tropopause identified by in situ trace gas measurements. Geophys. Res. Lett. 45 (10), 756–763. doi:10.1029/2018GL079573
Pan, L. L., and Munchak, L. A. (2011). Relationship of cloud top to the tropopause and jet structure from CALIPSO data. J. Geophys. Res. Atmos. 116, D12201–D12217. doi:10.1029/2010JD015462
Pan, L. L., Randel, W. J., Gary, B. L., Mahoney, M. J., and Hintsa, E. J. (2004). Definitions and sharpness of the extratropical tropopause: a trace gas perspective. J. Geophys. Res. Atmos. 109, D23103. doi:10.1029/2004JD004982
Randel, W. J., Garcia, R. R., Calvo, N., and Marsh, D. (2009). ENSO influence on zonal mean temperature and ozone in the tropical lower stratosphere. Geophys. Res. Lett. 36, L15822. doi:10.1029/2009GL039343
Randel, W. J., and Jensen, E. J. (2013). Physical processes in the tropical tropopause layer and their roles in a changing climate. Nat. Geosci. 6, 169–176. doi:10.1038/ngeo1733
Randel, W. J., Polvani, L., Wu, F., Kinnison, D. E., Zou, C.-Z., and Mears, C. (2017). Troposphere-stratosphere temperature trends derived from satellite data compared with ensemble simulations from waccm. J. Geophys. Res. Atmos. 122, 9651–9667. doi:10.1002/2017JD027158
Randel, W. J., Wu, F., and Gaffen, D. J. (2000). Interannual variability of the tropical tropopause derived from radiosonde data and NCEP reanalyses. J. Geophys. Res. Atmos. 105, 15509–15523. doi:10.1029/2000JD900155
Randel, W. J., Wu, F., Oltmans, S. J., Rosenlof, K., and Nedoluha, G. E. (2004). Interannual changes of stratospheric water vapor and correlations with tropical tropopause temperatures. J. Atmos. Sci. 61, 2133–2148. doi:10.1175/1520-0469(2004)061⟨2133:icoswv⟩2.0.CO;2
Randel, W. J., Wu, F., Vömel, H., Nedoluha, G. E., and Forster, P. (2006). Decreases in stratospheric water vapor after 2001: links to changes in the tropical tropopause and the brewer-dobson circulation. J. Geophys. Res. Atmos. 111, D12312. doi:10.1029/2005JD006744
Randel, W., and Park, M. (2019). Diagnosing observed stratospheric water vapor relationships to the cold point tropical tropopause. J. Geophys. Res. Atmos. 124, 7018–7033. doi:10.1029/2019JD030648
Rosenlof, K. H., and Reid, G. C. (2008). Trends in the temperature and water vapor content of the tropical lower stratosphere: sea surface connection. J. Geophys. Res. Atmos. 113, D06107. doi:10.1029/2007JD009109
Salby, M. L., and Callaghan, P. F. (2005). Interaction between the brewer–dobson circulation and the Hadley circulation. J. Clim. 18, 4303–4316. doi:10.1175/JCLI3509.1
Santer, B. D., Sausen, R., Wigley, T. M. L., Boyle, J. S., AchutaRao, K., Doutriaux, C., et al. (2003). Behavior of tropopause height and atmospheric temperature in models, reanalyses, and observations: decadal changes. J. Geophys. Res. Atmos. 108, 4002. doi:10.1029/2002JD002258
Schmidt, T., Wickert, J., Beyerle, G., and Heise, S. (2008). Global tropopause height trends estimated from GPS radio occultation data. Geophys. Res. Lett. 35, L11806. doi:10.1029/2008GL034012
Seidel, D. J., and Randel, W. J. (2006a). Variability and trends in the global tropopause estimated from radiosonde data. J. Geophys. Res. Atmos. 111, D21101. doi:10.1029/2006JD007363
Seidel, D. J., Fu, Q., Randel, W. J., and Reichler, T. J. (2008). Widening of the tropical belt in a changing climate. Nat. Geosci. 1, 21–24. doi:10.1038/ngeo.2007.38
Seidel, D. J., and Randel, W. J. (2007). Recent widening of the tropical belt: evidence from tropopause observations. J. Geophys. Res. Atmos. 112, D20113. doi:10.1029/2007JD008861
Seidel, D. J., and Randel, W. J. (2006b). Variability and trends in the global tropopause estimated from radiosonde data. J. Geophys. Res. Atmos. 111, D21101. doi:10.1029/2006JD007363
Seidel, D. J., Ross, R. J., Angell, J. K., and Reid, G. C. (2001). Climatological characteristics of the tropical tropopause as revealed by radiosondes. J. Geophys. Res. Atmos. 106, 7857–7878. doi:10.1029/2000JD900837
Shangguan, M., Wang, W., and Jin, S. (2019). Variability of temperature and ozone in the upper troposphere and lower stratosphere from multi-satellite observations and reanalysis data. Atmos. Chem. Phys. 19, 6659–6679. doi:10.5194/acp-19-6659-2019
Spang, R., Günther, G., Riese, M., Hoffmann, L., Müller, R., and Griessbach, S. (2015). Satellite observations of cirrus clouds in the Northern Hemisphere lowermost stratosphere. Atmos. Chem. Phys 15, 927–950. doi:10.5194/acp-15-927-2015
Staten, P. W., Grise, K. M., Davis, S. M., Karnauskas, K. B., Waugh, D. W., Maycock, A. C., et al. (2020). Tropical widening: from global variations to regional impacts. Bull. Am. Meteorological Soc. 101, E897–E904. doi:10.1175/BAMS-D-19-0047.1
Steinbrecht, W., Claude, H., Köhler, U., and Hoinka, K. P. (1998). Correlations between tropopause height and total ozone: implications for long-term changes. J. Geophys. Res. Atmos. 103, 19183–19192. doi:10.1029/98JD01929
Stohl, A., Bonasoni, P., Cristofanelli, P., Collins, W., Feichter, J., Frank, A., et al. (2003). Stratosphere-troposphere exchange: a review, and what we have learned from staccato. J. Geophys. Res. Atmos. 108, 8516. doi:10.1029/2002JD002490
Tegtmeier, S., Anstey, J., Davis, S., Dragani, R., Harada, Y., Ivanciu, I., et al. (2020). Temperature and tropopause characteristics from reanalyses data in the tropical tropopause layer. Atmos. Chem. Phys. 20, 753–770. doi:10.5194/acp-20-753-2020
Thomason, L. W., Ernest, N., Millán, L., Rieger, L., Bourassa, A., Vernier, J.-P., et al. (2018). A global space-based stratospheric aerosol climatology: 1979–2016. Earth Syst. Sci. Data 10, 469–492. doi:10.5194/essd-10-469-2018
Thouret, V., Cammas, J.-P., Sauvage, B., Athier, G., Zbinden, R., Nédélec, P., et al. (2006). Tropopause referenced ozone climatology and inter-annual variability (1994–2003) from the MOZAIC programme. Atmos. Chem. Phys. 6, 1033–1051. doi:10.5194/acp-6-1033-2006
Vallis, G. K., Zurita-Gotor, P., Cairns, C., and Kidston, J. (2015). Response of the large-scale structure of the atmosphere to global warming. Q. J. R. Meteorological Soc 141, 1479–1501. doi:10.1002/qj.2456
Vogel, B., Volk, C. M., Wintel, J., Lauther, V., Müller, R., Patra, P. K., et al. (2023). Reconstructing high-resolution in-situ vertical carbon dioxide profiles in the sparsely monitored Asian monsoon region. Asian Monsoon Reg. 4, 72–12. doi:10.1038/s43247-023-00725-5
Wang, J. S., Seidel, D. J., and Free, M. (2012). How well do we know recent climate trends at the tropical tropopause? J. Geophys. Res. Atmos. 117, D09118. doi:10.1029/2012JD017444
Wang, W., Matthes, K., Omrani, N.-E., and Latif, M. (2016). Decadal variability of tropical tropopause temperature and its relationship to the Pacific Decadal Oscillation. Sci. Rep. 6, 29537. doi:10.1038/srep29537
Wang, W., Matthes, K., and Schmidt, T. (2015). Quantifying contributions to the recent temperature variability in the tropical tropopause layer. Atmos. Chem. Phys. 15, 5815–5826. doi:10.5194/acp-15-5815-2015
WMO (1957). Meteorology-a three-dimensional science:second session for the commisstion for aerology. WMO Bull. 6, 134–138.
Wong, S., and Wang, W.-C. (2003). Tropical–extratropical connection in interannual variation of the tropopause: comparison between NCEP/NCAR reanalysis and an atmospheric general circulation model simulation. J. Geophys. Res. Atmos. 108, 4043. doi:10.1029/2001JD002016
Xian, T., and Homeyer, C. R. (2019). Global tropopause altitudes in radiosondes and reanalyses. Atmos. Chem. Phys. 19, 5661–5678. doi:10.5194/acp-19-5661-2019
Zhou, X.-L., Geller, M. A., and Zhang, M. (2001). Cooling trend of the tropical cold point tropopause temperatures and its implications. J. Geophys. Res. Atmos. 106, 1511–1522. doi:10.1029/2000JD900472
Zou, L., Griessbach, S., Hoffmann, L., Gong, B., and Wang, L. (2020). Revisiting global satellite observations of stratospheric cirrus clouds. Atmos. Chem. Phys. 20, 9939–9959. doi:10.5194/acp-20-9939-2020
Keywords: tropical tropopause, tropopause height, tropopause temperature, reanalysis data, tropical width, tropical widening
Citation: Zou L, Hoffmann L, Müller R and Spang R (2023) Variability and trends of the tropical tropopause derived from a 1980–2021 multi-reanalysis assessment. Front. Earth Sci. 11:1177502. doi: 10.3389/feart.2023.1177502
Received: 01 March 2023; Accepted: 01 August 2023;
Published: 17 August 2023.
Edited by:
Irina Alexandrovna Mironova, Saint Petersburg State University, RussiaReviewed by:
Hauke Schmidt, Max Planck Society, GermanyOlaf Morgenstern, National Institute of Water and Atmospheric Research (NIWA), New Zealand
Copyright © 2023 Zou, Hoffmann, Müller and Spang. This is an open-access article distributed under the terms of the Creative Commons Attribution License (CC BY). The use, distribution or reproduction in other forums is permitted, provided the original author(s) and the copyright owner(s) are credited and that the original publication in this journal is cited, in accordance with accepted academic practice. No use, distribution or reproduction is permitted which does not comply with these terms.
*Correspondence: Ling Zou, bC56b3VAZnotanVlbGljaC5kZQ==, Y2hlcnlsX3pvdUB3aHUuZWR1LmNu