
94% of researchers rate our articles as excellent or good
Learn more about the work of our research integrity team to safeguard the quality of each article we publish.
Find out more
ORIGINAL RESEARCH article
Front. Earth Sci. , 20 June 2023
Sec. Biogeoscience
Volume 11 - 2023 | https://doi.org/10.3389/feart.2023.1173477
This article is part of the Research Topic Natural Methane Emissions in a Changing Arctic - Implications for Climate and Environment View all 16 articles
 Nil Rodes1*
 Peter Betlem1,2
 Kim Senger1
 Miriam Römer3,4Andy Hodson1,5Martin Liira6,7Tom Birchall1
 Srikumar Roy8
 Riko Noormets1Aleksandra Smyrak-Sikora1
 Snorre Olaussen1
 Gerhard Bohrmann3,4
This study presents the first systematic observations of active gas seepage from the seafloor in the main fjords of western Spitsbergen in the Svalbard archipelago. High-resolution acoustic water column data were acquired throughout two research cruises in August 2015 and June 2021. 883 gas flares have been identified and characterized in Isfjorden, and 115 gas flares in Van Mijenfjorden. The hydroacoustic data indicate active fluid migration into the water column. Interpretation of 1943 km of regional offshore 2D seismic profiles supplemented the water column and existing gas geochemical data by providing geological control on the distribution of source rocks and potential migration pathways for fluids. In the study area, bedrock architecture controls the fluid migration from deep source rocks. Faults, high permeability layers, heavily fractured units and igneous intrusions channel the gas seepage into the water column. The observations of gas seepage presented in this study are an important step towards the assessment of how near-shore seepage impacts upon the carbon budget of Svalbard fjords, which constitute a globally recognized early climate change warning system for the High Arctic.
Methane is a potent greenhouse gas that strongly influences the global climate (Shindell et al., 2009). When averaged over a 100-year timescale, the warming effect of methane per unit mass is 28 times higher than that of carbon dioxide (CO2) (Stocker et al., 2013), and its emissions constitute the second-largest contribution to historical warming after CO2. Contrary to the well-studied deep-water sites on the continental slope west of Svalbard (Gentz et al., 2014; Sahling et al., 2014; Mau et al., 2017), gas seepage is poorly constrained in the fjords. In the shallow waters of the fjords, gas seepage is more likely to avoid complete removal by dissolution and microbial oxidation of methane in the water column, and thus reach the water-atmosphere interface (Judd and Hovland, 2007). It is estimated that global CH4 emissions from marine seeps account for up to 65 Tg CH4 yr−1, but the flux of oceanic methane reaching the atmosphere is uncertain (Saunois et al., 2020). In Svalbard, microbial methane oxidation effects in near-surface sediments greatly reduce the flux of diffusive methane reaching the water column (Liira et al., 2019). However, Adventfjorden, Tempelfjorden and Van Mijenfjorden exhibit perennial supersaturation with respect to methane and the local conditions typically support a sea-air flux (Damm et al., 2021). Understanding the causes and effects of gas seepage into shallow waters is crucial as it provides valuable knowledge to constrain the contribution of gas emissions emanating from shallow Arctic water and fjords to the global atmospheric carbon pool. Herein, establishing the origin and composition of the gas forms an important first step to study climate feedbacks in Svalbard’s near-shore Arctic waters. This is important because Svalbard is warming faster than elsewhere in the Arctic (Nordli et al., 2014). Findings in Svalbard’s fjords may therefore tell us what to expect elsewhere in the Arctic, which itself is an important early warning system for climate change (Hassol et al., 2004).
Svalbard’s fjord and onshore geology consist of thick sedimentary units comprising both hydrocarbon source and reservoir rocks, along with documented onshore secondary and tertiary migrated hydrocarbons (Abay et al., 2017; Nicolaisen et al., 2019; Ohm et al., 2019) and offshore gas seeps (Roy et al., 2019). Multiple technical gas discoveries (predominantly methane) have been made in Late Palaeozoic-Mesozoic successions (Senger et al., 2019). The organic-rich Botneheia Formation (Middle Triassic) and the organic-rich Agardhfjellet Formation (Upper Jurassic to Lower Cretaceous) are both known gas sources in central Spitsbergen (Abay et al., 2017; Ohm et al., 2019; Senger et al., 2019; Birchall et al., 2021). Studying seabed methane leakage in Svalbard fjords has the advantage that the geological conditions conform to the well-known and easily accessible onshore geology. This facilitates direct onshore-offshore correlations for deciphering the controlling mechanisms of gas leakage. It also helps to demonstrate how fjords differ from the further offshore provinces, such as the well-studied Vestnesa Ridge (Bünz et al., 2012; Panieri et al., 2017; Sauer et al., 2021), the continental slope west of Svalbard and in particular the continental slope west of Prins Karls Forland, where thousands of gas flares have been described (Bünz et al., 2012; Gentz et al., 2014; Sahling et al., 2014; Mau et al., 2017).
Onshore natural gas in Svalbard is present beneath glaciers and permafrost (Hodson et al., 2020; Kleber et al., 2023) and as shale gas in thick organic-rich source rocks (Ohm et al., 2019). Late Pliocene to Holocene glaciations have formed large fjord systems in Svalbard, exposing excellent outcrops nearly identical to the subsurface geology. Deglaciation has also initiated isostatic uplift, exposing marine sediments to freezing and thus permafrost aggradation, trapping much of the deeper gas beneath (Hornum et al., 2020). Active gas seepage has therefore been identified in numerous terrestrial springs where gas-charged groundwaters are able to discharge through the permafrost layer (Hodson et al., 2020) or exploit the forefields of retreating glaciers (Kleber et al., 2023). Hodson et al. (2020) report that biogenic gas can contribute to the emissions from the pingos in Central Svalbard, but the overwhelming source of gas in terrestrial seeps is geogenic in origin (Kleber et al., 2023). In nearby marine settings, Mau and Rohardt (2016) identified 8 gas flares along a transect in Isfjorden in 2015 (Figure 1). Roy et al. (2019) also documented active seeps observed during a 2015 cruise in Nordfjorden and linked them to subsurface geological conditions.
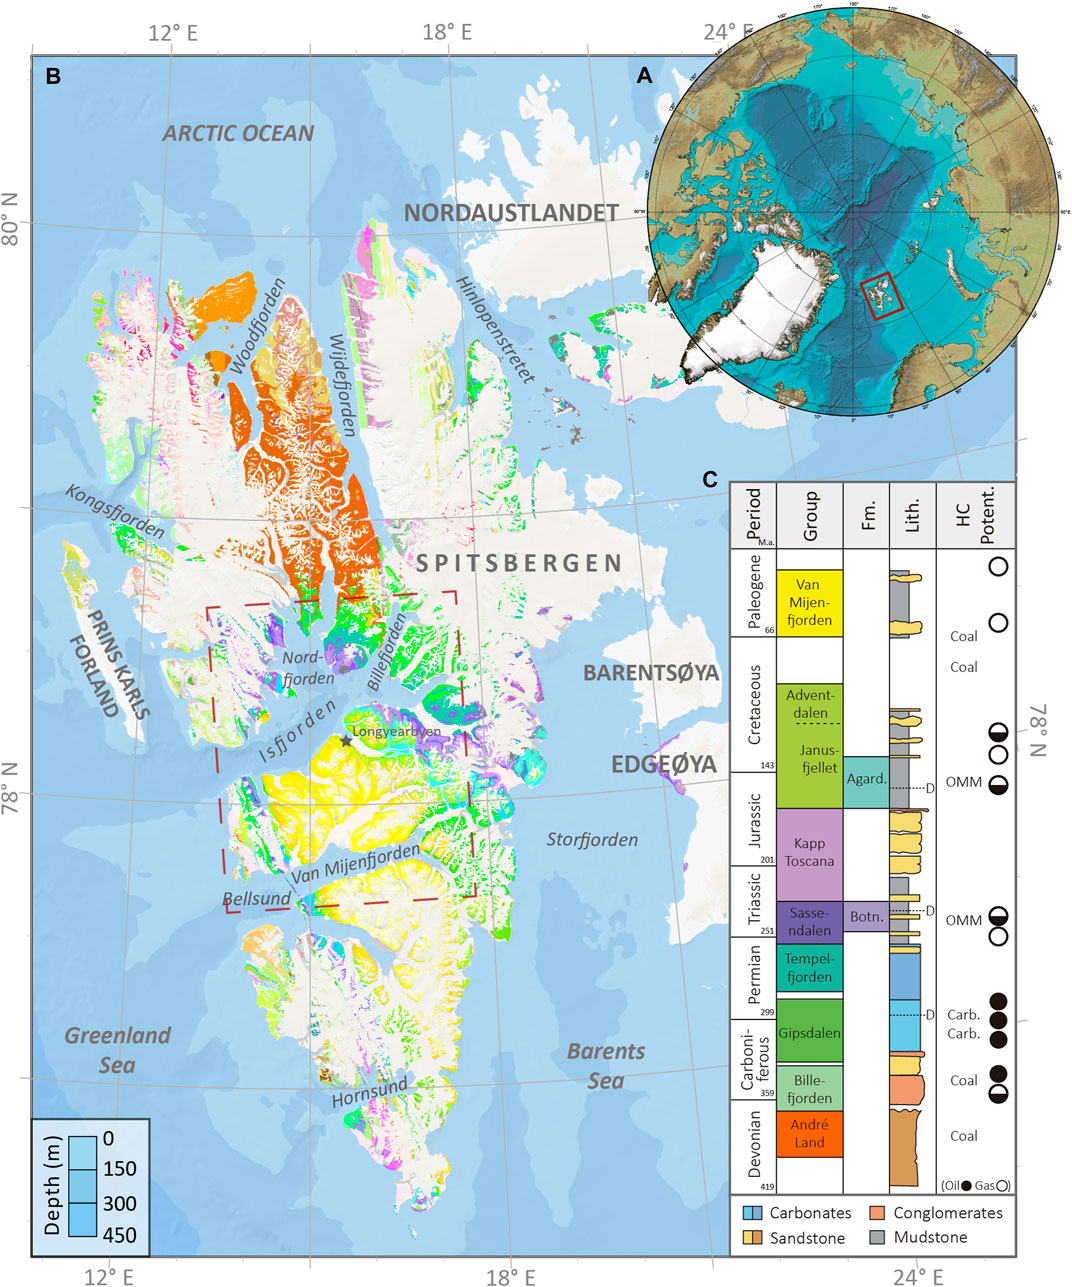
FIGURE 1. (A). Inset of the location of Svalbard (red square) on Jakobsson et al., 2020. (B). Bedrock map of the Svalbard archipelago. The geological map is courtesy of the Norwegian Polar Institute, 2016. The polygon marked with a red dashed line defines the area shown in Figure 2. (C). The stratigraphic log is based on an unpublished figure by Arild Andresen (University of Oslo), further updated with source rocks and hydrocarbon potential by Betlem et al. (2021) and Olaussen et al. (2022). Abbreviations: Fm.: Formation; Lith.; Lithology; HC Potent.: Hydrocarbon Potential; Agard.: Agardhfjellet Formation; Botn.: Botneheia Formation, Carb.: Carbonates; D.: Decollement; OMM: Organic Marine Mudstone.
In Isfjorden, the largest fjord system in western Spitsbergen, over 1,300 crater-like depression features on the seafloor have been mapped and interpreted as pockmarks. Over 50% of the pockmarks are related to source rocks, alluding to the presence of an underlying petroleum system (Roy et al., 2015). Different acoustic features such as enhanced reflections, acoustic turbidity zones and acoustic blankings have been interpreted on high-resolution sub-bottom acoustic profiles, preferentially distributed over regional faults (Roy et al., 2019; Roy et al., 2016; Roy et al., 2014). Integrated geophysical data analysis suggested that faults and igneous intrusions could have acted as migration pathways of fluids and gas, facilitating the seepage of the buoyant fluids into the water column and creating pockmarks on the seabed (Roy et al., 2015; Roy et al., 2014).
Modeling of the gas hydrate stability zone by Betlem et al. (2021) suggested that the deeper parts of Isfjorden currently lie close to the hydrate stability phase boundary. Here the authors assumed a 5% contribution of higher order hydrocarbons (ethane equivalent) to the gas feed and year-around bottom-water temperatures near the freezing point to identify the potential gas hydrate stability zone. These temperatures are consistent with the decadal temperature trends observed from 1987 to 2017 in Isfjorden (Skogseth et al., 2020). However, the waters of Svalbard and the Arctic are warming at unprecedented rates (Skogseth et al., 2020). Decadal water column thermal trends indicate heat transfer from the North Atlantic into the fjord waters of western Svalbard, raising the mean water temperatures by 0.7°C per decade in winter and 0.6°C per decade in summer (Skogseth et al., 2020). This temperature increase could result in the thawing of subsea permafrost and natural gas hydrate dissociation (Mienert et al., 2005; Betlem et al., 2021), causing additional methane release into the water column.
In the fjords of Spitsbergen, further knowledge needs to be acquired to ascertain ongoing fluid migration and assess the causes of the seepage in the shallow waters of this region in the Arctic. This is important as the spatial variation of active (ebullitive) gas seepage and the underlying geological controlling factors are unknown. Furthermore, the seasonal and yearly variation of ebullition (gas flaring) at individual seeps is virtually unknown in the study area. Moreover, there needs to be a an improved understanding of how gas seepage is governed by the major stratigraphic units and structural elements in the bedrock, different seabed morphologic expressions, and the effects of potentially widespread gas hydrate stability zone (GHSZ).
Here we present new acoustic flare data documenting active gas emissions in Isfjorden and Van Mijenfjorden based on two research cruises in 2015 and 2021. We characterize the gas flares using multibeam bathymetry and geological maps to investigate potential correlations between source rock intervals and flares. We have utilized 2D seismic and bathymetry data to correlate flares with the underlying geology, specifically migration pathways along fault zones. Additionally, we integrate all published marine gas geochemical data from and around Svalbard to better constrain the gas source. Finally, we address the significance of the regional onshore-offshore gas seepage in terms of potential gas hydrate occurrences and the observed climatic forcing in the region.
Svalbard represents the uplifted and exposed northwestern corner of the Eurasian plate. A nearly complete sedimentary succession from Devonian to Paleogene (with the exception of Upper Cretaceous) is exposed across the Archipelago (Harland et al., 1997; Dallmann, 2015) in addition to metamorphic basement rocks in the northwest (Figure 1). The Upper Palaeozoic and Mesozoic successions are linked to the stratigraphy of the prolific southwestern Barents Sea Hydrocarbon Province (Worsley et al., 1986; Nøttvedt et al., 1993; Henriksen et al., 2011).
The continental Upper Devonian Andrée Land Group succession is unconformably overlain by the Lower Carboniferous alluvial, lacustrine and coal-bearing deposits of the Billefjorden Group (Gjelberg and Steel, 1981; Harland et al., 1997). Subsequently, the Late Carboniferous-Early Permian succession of mixed siliciclastics, evaporites, and warm-water organic-rich carbonates of the Gipsdalen Group were deposited (Stemmerik, 2008; Sorento et al., 2020; Smyrak-Sikora et al., 2021) before transitioning to cool water carbonates of the Tempelfjorden Group (Matysik et al., 2018).
The entire siliciclastic dominated Mesozoic and Paleogene stratigraphic sequence began with the marine mudstones and subordinate deltaic sandstones of the Lower Triassic Sassendalen Group (Mørk et al., 1982; Steel and Worsley, 1984). The uppermost part of the Sassendalen Group hosts the organic-rich Botneheia Formation (Mørk et al., 1999; Krajewski, 2008). In Svalbard this marine basin was filled in from the east and southeast with the early Late Triassic deltaic succession of the lower Kapp Toscana Group (Mørk et al., 1982; Anell et al., 2014; Lord et al., 2017). In contrast, the Late Triassic-Middle Jurassic succession of the Wilhelmøya Subgroup is highly condensed with multiple hiatuses, forming up-to-25-m thick outcrops in central and western Spitsbergen (Rismyhr et al., 2019). The Adventdalen Group begins with the organic-rich, Middle Jurassic to Lower Cretaceous Agardhfjellet Formation (Koevoets et al., 2018), overlaid by regressive to transgressive Early Cretaceous deposits (Steel and Worsley, 1984; Olaussen et al., 2022). The Upper Cretaceous succession in Svalbard is missing, likely due to the emplacement of the High Arctic Large Igneous Province (HALIP) (Maher, 2001; Senger and Galland, 2022) and uplift related to the opening of the Arctic Ocean.
The Paleogene succession of the Van Mijenfjorden Group was deposited in the Central Spitsbergen Basin -a foreland basin formed in the front of the West Spitsbergen fold-thrust belt (Harland et al., 1997; Helland-Hansen and Grundvåg, 2021). The lowermost part of the Van Mijenfjorden Group consists of coal-bearing formations mined in Spitsbergen. Evidence of past and present faulting is widespread throughout the archipelago (Lowell, 1972; Harland et al., 1974). During the Palaeocene/Eocene, the western and central Spitsbergen was affected by transpression and structural shortening, followed by extensional faulting in the Oligocene, resulting in different migration pathways. Structural heterogeneities and permeable zones such as faults and decollements, permeable reservoir rocks, igneous intrusions, and near-shore permafrost are implied to have a crucial role in directing the flow from deep source rocks and terminating on the seafloor (Henriksen et al., 2011; Ogata et al., 2014; Roy et al., 2014).
Several organic-rich rocks are regionally widespread in Svalbard. The Upper Jurassic to Lower Cretaceous Organic Rich Marine Mudstone (OMM) Agardhfjellet Formation and the Middle Triassic OMM Botneheia Formation are the most important regional source rocks, with proven migration of hydrocarbons found throughout Spitsbergen (Nøttvedt et al., 1993; Abay et al., 2017; Ohm et al., 2019). These two units are also linked to the two prolific time-equivalent oil and gas-prone source rocks in the southwestern Barents Sea hydrocarbon province; the Hekkingen and Steinkobbe formations, respectively (Worsley, 2008; Abay et al., 2018; Lutz et al., 2021; Wesenlund et al., 2021). The maturation of Agardhfjellet and Botneheia formations decreases from west to east. In the westernmost part of Spitsbergen they are overmature, they are oil-prone in the east coast of Spitsbergen and are immature to the far east of the archipelago in Kong Karls Land (Olaussen et al., 2022). Additional hydrocarbon source rocks occur in the upper Palaeozoic, Lower Cretaceous and particularly Paleocene coal deposits (Gjelberg and Steel, 1995; Van Koeverdenet al., 2011; Uguna et al., 2017). All these organic-rich rocks are in the state of having expelled or are currently capable of expelling hydrocarbons in our study area (Abay et al., 2017; Nicolaisen et al., 2019; Olaussen et al., 2022).
The Middle Triassic Botneheia Formation is comprised predominantly of black shale with abundant small phosphate nodules and silty dolomite becoming calcareous in the upper part with numerous bivalves and reptile bone fragments (Mørk et al., 1982). The formation presents a varying thickness between 80 and 168 m. The upper part is very rich in organic material, presenting lateral variations in maturity, with total organic carbon (TOC) values (5%–10%), hydrogen index (HI) values of 400–600 mg HC/g TOC, low production index (PI) (0.04–0.1) and Tmax (439°C–446°C) suggesting excellent source rocks composed of oil-prone Type II kerogen. The Botneheia Formation was deposited in a offshore to prodelta depositional environment under periodically anoxic sea floe conditions (Wesenlund et al., 2021).
The Middle Jurassic to Lower Cretaceous Agardhfjellet Formation is 90–350 m thick and is largely missing in the east due to erosion related to Late Jurassic and Early Cretaceous inversion (Olaussen et al., 2022). Its dominant lithology is siltstone, sandstone, and beds of black organic-rich shales. Core data in central western Spitsbergen shows that the formation is dominated by type III kerogen in the silty part, while the clay dominated part has a higher amount of type II kerogen (Ohm et al., 2019). It is very rich in organic material with a TOC of 6%–10% and a high HI of 50–200 mgHC/g TOC. Average Tmax values are 455°C in the black paper shale in the lower part of the Agardhfjellet Formation (Koevoets et al., 2016; Ohm et al., 2019; Olaussen et al., 2022). The Agardhfjellet Formation is gas saturated in the lower part of Adventdalen. Open hole test in Borehole DH5R, near the base of the Formation, i.e., 640 m.b.s.l. produced thermogenic gas dominated by methane (Ohm et al., 2019). Up valley another dry gas was discovered in Cretaceous strata, This gas was suggested to be a mixture of biogenic thermogenic origin of the methane as seen in the fjords c.f. (Liira et al., 2019).
Multiple coal seams are present in sedimentary successions in Svalbard. Organic geochemical/petrological data on Carboniferous and Tertiary strata (Van Koeverden et al., 2011; Marshall et al., 2015) and Triassic–Lower Cretaceous units (Abay et al., 2017) suggest that most coals have the potential for gas generation, which makes them another potential source for the natural gas observed seeping into the water column.
In this study we provide new hydroacoustic data and integrate these with a broad range of seabed data (e.g., multibeam bathymetry and backscatter) and sub-seabed data (e.g., 2D seismic data and borehole data), to discuss the controlling mechanisms behind seepage into the fjords (Supplementary Table S1).
The multibeam bathymetric, seafloor backscatter and acoustic water column datasets were acquired during two research cruises. First, in August 2015, data were acquired using R/V Heincke during cruise HE-449 (Mau and Rohardt, 2016) across an area of 176 km2 in Isfjorden and 20 km2 in Van Mijenfjorden. The R/V Heincke was equipped with a Kongsberg EM710 multibeam echosounder operating at 70–100 kHz, which makes it suitable for the water depths encountered in the fjords and provides high-quality swath beam images and clear backscatter anomalies across the entire water column.
A second cruise was conducted in June 2021 onboard the R/V Clione motor sailer, with the intention of revisiting the sites used in the data from 2015. The vessel was equipped with a Norbit iWBMSh high-end turnkey multibeam sonar system, which was operated at frequencies of 200 kHz (deeper than 200 m.b.s.l.) or 400 kHz (shallower than 200 m.b.s.l.) for the acquisition of high-resolution hydrographic data. The high-frequency operational range provided a very fine depth resolution of 10 mm in shallow waters. It had a maximum depth range of 300 m.b.s.l., however, we experienced that the signal quality decreased greatly where water depths exceeded 150 m.b.s.l. Consequently, the survey in 2021 targeted the shallower waters of Isfjorden and the tributary fjords where data acquisition would be optimal. As a result, deep-water coverage across the deeper parts of Isfjorden was not as extensive as that surveyed in 2015 using a multibeam system Kongsberg EM710. The resulting hydroacoustic profiles in 2021 delivered high-resolution swath beam images showing sharp flares in waters shallower than 150 m.b.s.l. 16 CTD profiles were acquired across 4 main transects to calculate Sound Velocity Profiles (SVP) for calibrating the hydrographic data, which were inserted in the Data Collection Tool (DCT; Norbit Subsea). In total, 110 km2 of the seafloor was covered in Isfjorden and tributary fjords.
While technical differences in multibeam systems and survey design exist, the multibeam used equiangular swath width in both cruises, which enabled wide lateral coverage for bathymetric and seafloor backscatter mapping and facilitated the detection of acoustic flares. QPS FMMidwater 7.7.2 was used to identify anomalies from the hydroacoustic profiles attributed to the presence of gas bubbles, which relied on the observation of acoustic anomalies in the water column appearing in several successive swath beam images in the hydrographic profiles. A criterion used to differentiate gas flares from other anomalies, such as fish schools, is that the anomaly has to present a narrow and vertically oriented shape, often originating from the seafloor, and showing a constant upward movement over time, as do gas bubbles in the water column. We used the FMGeopicking Tool to extract the reference information related to the gas flares.
The ship track made during the hydroacoustic data acquisition did not cover the entirety of the fjords. Consequently, we computed the real footprint by buffering the depth-dependent points from the ship track based on the opening angle of the multibeam. Continuedly, we normalized the results with the real footprint and adjusted the data measured during the transects to see if there were statistically significant distribution anomalies. The 2021 dataset presented variable data qualities resulting from instrumental limitations. Depth range and bad weather days resulted in very low data confidence in deep areas as a consequence of high background noise. In order to maximize the data confidence, we only used binned values shallower than 150 m.b.s.l. to normalize the 2021 results.
In addition to the acoustic data acquired during the R/V Heincke and R/V Clione cruises, we used existing bathymetry data (resolution 5 m; Figure 2) (Roy et al., 2015) to characterize different seabed morphologies in Isfjorden.
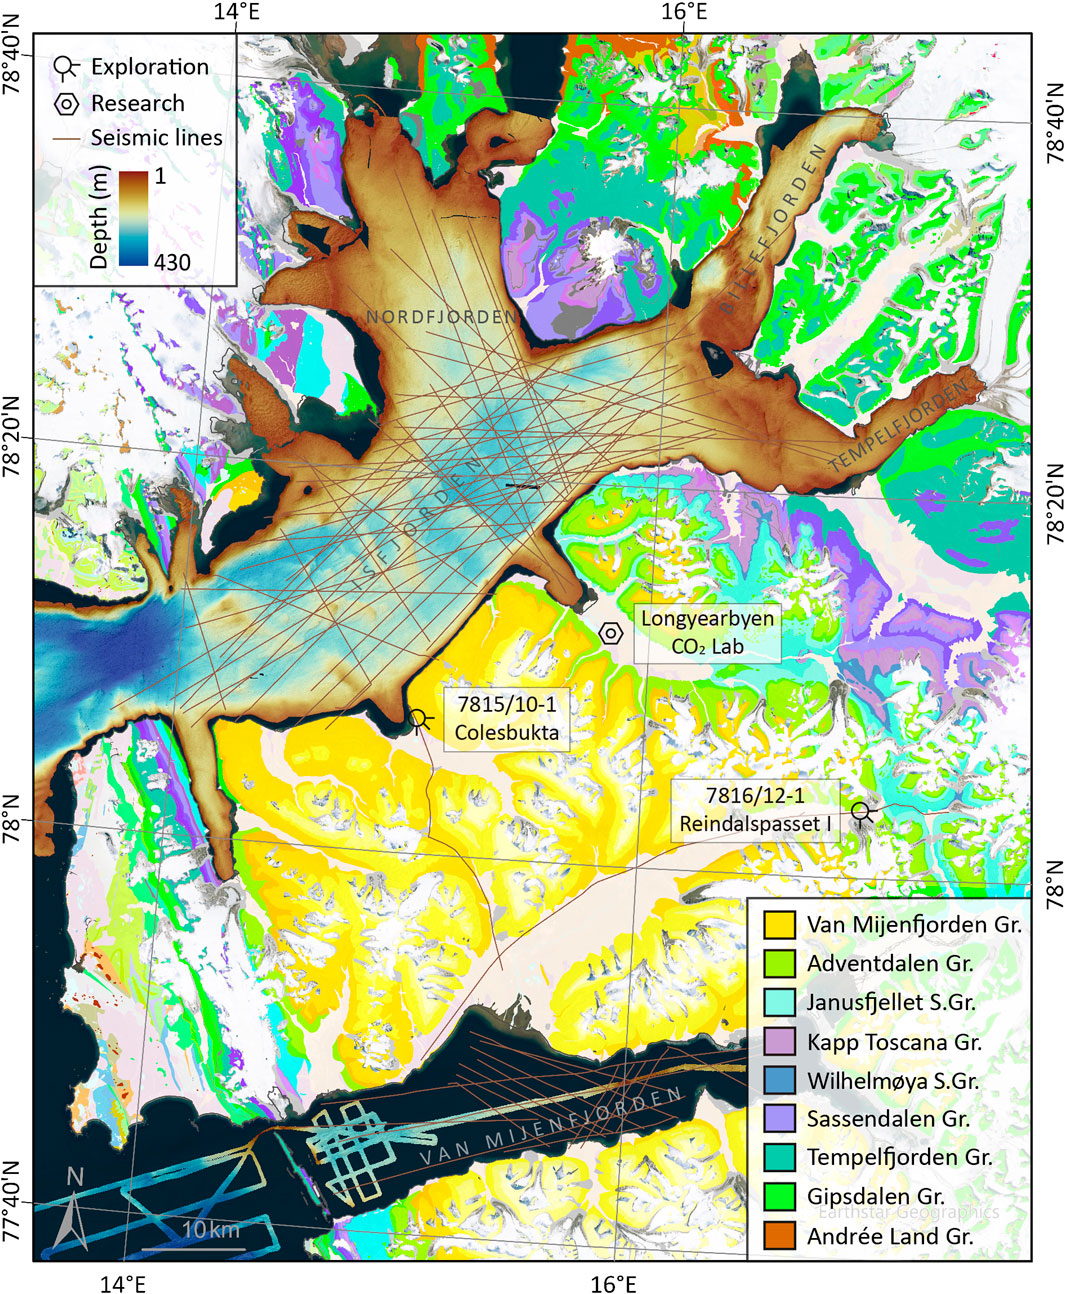
FIGURE 2. Regional map of the study area and the datasets used in this study. The geological map is courtesy of the Norwegian Polar Institute, 2016. The bathymetry in Isfjorden was provided by the Norwegian Hydrographic Service, and acquired during the HE-449 cruise in Van Mijenfjorden by the University of Bremen and MARUM. Seismic lines were interpreted in this work and tied by exploration wells onshore. EPSG:32633 projection. Abbreviations: Gr.: Group; S.Gr.: Subgroup.
We have interpreted the available 2D seismic data in Isfjorden and Van Mijenfjorden using Schlumberger’s Petrel E&P Software Platform v2019.1. The seismic data we used came from multiple surveys conducted by industry and academia (Supplementary Table S1), which are widely documented in the literature (Austegard et al., 1994; Blinova et al., 2012; Bælum and Braathen, 2012; Senger et al., 2013; Knudsen, 2015). The interpretations of deep stratigraphic units are based on the structure described by (Bælum and Braathen, 2012) from the petroleum exploration borehole 7816/12-1 Reindalspasset I (Figure 2) (Senger et al., 2019). Two land-based seismic tie lines linked the borehole onshore with the seismic profiles in Van Mijenfjorden, which were further extended to Isfjorden through the 7815/10-1 Colesbukta near-shore well (Figure 2). By extrapolating the borehole-constrained seismic reflectors we yielded regional stratigraphic surfaces.
The 2D seismic data were acquired using a relatively low frequency (0.01—180 Hz), resulting in deep penetration and moderately low resolution of the seismic profiles. The sedimentary packages feature abnormally high seismic velocity due to extensive diagenesis associated with compaction and cementation (Mørk, 2013). This complicates differentiation of fluid-related anomalies and reflectors, such as potential bottom-simulating reflectors (BSRs). Limitations to the 2D seismic data extent prevented a seismic-based interpretation of unit boundaries along the mouth and northern coast in Isfjorden, including parts of Nordfjorden, Billefjorden and Tempelfjorden. There, we interpreted the geology to follow general stratigraphical trends and onshore geology. We calibrated the Agardhfjellet Formation’s boundaries based on the sequence’s thickness in onshore exploration boreholes and outcrops.
Not all interpreted seismic horizons represent major stratigraphic boundaries. To define the different units, we followed the observations and descriptions made by Bælum and Braathen (2012) and Knudsen (2015). The reflectors representing the Van Mijenfjorden Group are continuous, parallel and layered, with a series of strong reflections at the bottom, representing the Firkanten Formation. A combination of strong reflectors characterizes the Helvetiafjellet Formation and weak discontinuous reflectors part of the Carolinefjellet Formation. The reflector defining the top of the Agardhfjellet Formation features high amplitude values and the base shows cutting reflectors corresponding to the unconformity between the Kapp Toscana Group and the Adventdalen Group. The base reflector of the Kapp Toscana Group is characterized by low amplitude values, interpreted as a dolerite sill. In the upper-Sassendalen Group, the Botneheia Formation is affected by a thick intrusion presenting strong reflectors. The base reflector of the Sassendalen Group is interpreted as an impedance contrast between weak amplitude reflectors above and strong amplitudes below, corresponding to the boundary between the Triassic shales and the silicified sandstones of Tempelfjorden Group. The base of the Tempelfjorden Group is more or less discontinuous with a slight amplitude contrast. Finally, the base of the Gipsdalen Group is characterized by a contrast of amplitudes between low values above and high amplitude values below from the carbonate/evaporite sequences. The interpretations of the older units have higher uncertainty as a result of their greater depths.
Geographical visualization, statistical analysis, and data georeferencing were performed using the ESRI ArcGIS Pro v2.7.0 software package (Supplementary Figure S1). The geostatistics and spatial analyses of the data were conducted programmatically. To determine the area of occurrence, we combined the locations of gas flares, pockmarks, and faults with the ship track’s footprint and geological units in the fjords. A minimal working example detailing the use of Python is provided in Supplementary Material.
In 2015, 681 flares were detected in Isfjorden over an area of 176 km2, and 115 flares were identified in Van Mijenfjorden over 20 km2 (Figure 3; Table 1). A total of 152 gas flares were identified in Isfjorden in 2021 over an area of 110 km2 and targeting shallower waters. Gas column heights for the combined data sets varied from 1.2 m to 192.2 m (Figures 3A–C). Bottom water depths ranged from 13 to 280 m.b.s.l. in Isfjorden, and from 30 to 120 m.b.s.l. in Van Mijenfjorden. The footprint of the flares for the combined data sets was between 2 m2 for small individual flares and 458 m2 for clusters comprising multiple flares.
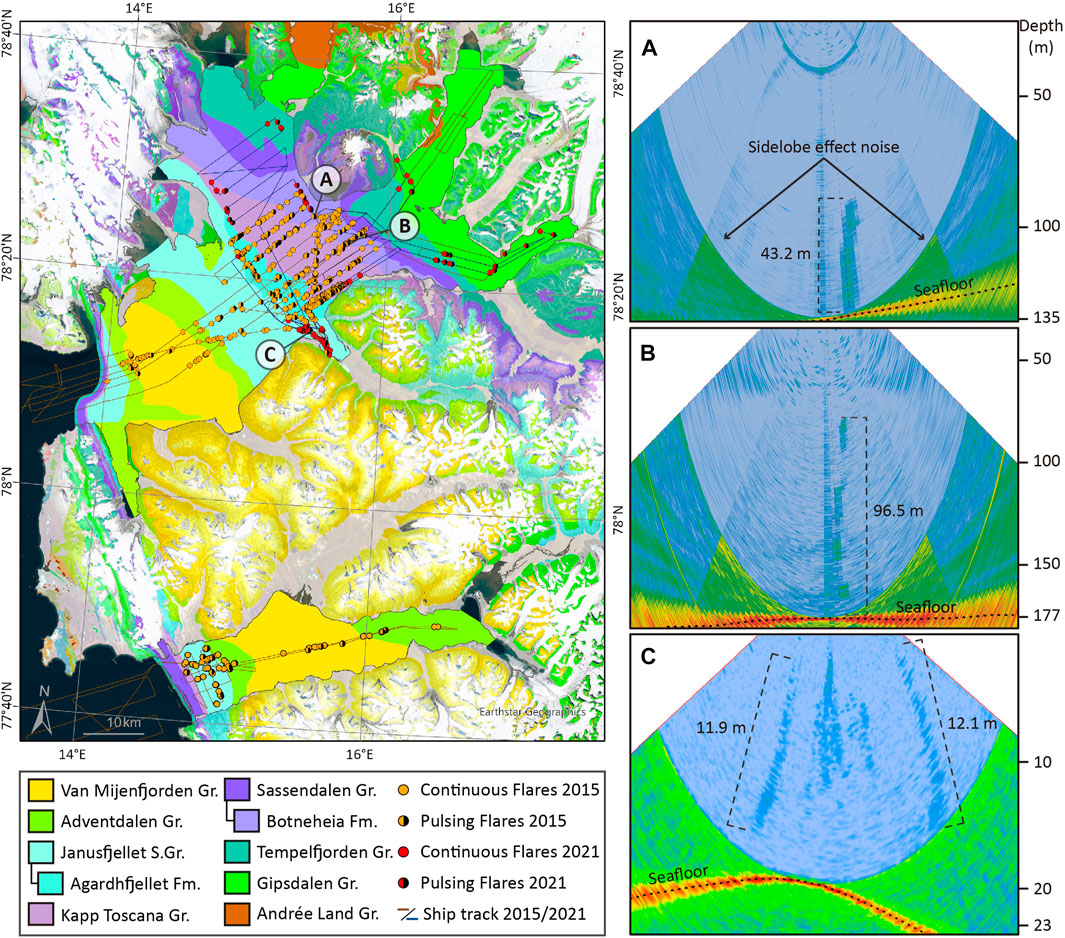
FIGURE 3. Geological map of western Spitsbergen showing the flare distribution and the stratigraphic units outcropping in the fjord result from the seismic profiles’ interpretations. In orange are the flares interpretations along the transect lines of the 2015 dataset, and in red are the flares observed in the 2021 dataset. (A,B) are examples of flares observed in the echograms using the Kongsberg EM710 multibeam echosounder. (C) is an example of flare observed in the echogram with the Norbit iWBMSh high-end turnkey multibeam sonar system. Onshore geological information is courtesy of the Norwegian Polar Institute, 2016. EPSG:32633 projection and base map courtesy of Earthstar Geographics.
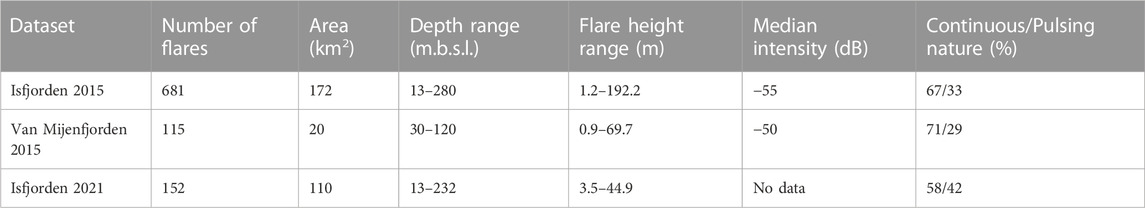
TABLE 1. Synthesis of flare characteristics from the different hydroacoustic datasets.
The intensities of the flares are related to the bubble size, volume and rate of gas discharge. In Isfjorden, the intensity values for the first and third quartile were −60 dB and −45 dB, respectively. The median value of the flares was −55 dB. In Van Mijenfjorden, the intensity ranged between −60 dB for the first quartile and −40 dB for the third quartile. The median value of the flares was −50 dB.
Most of the flares were observed continuously flowing (Figure 3A). However, 33% of the flares detected in 2015 in Isfjorden and 42% in 2021 exhibit a pulsing nature (Figure 3B). In Van Mijenfjorden the pulsing flares account for 29% of the total.
The 2D-seismic interpretation facilitated mapping the major stratigraphic elements outcropping in the fjords (Figure 4). The geology below Isfjorden forms a large ∼southerly plunging syncline (the Central Spitsbergen foreland Basin) with an almost vertical outcropping angle on the western side and a lower angle (∼10°) towards the east. We interpreted the major groups outcropping in the fjord: Van Mijenfjorden Group (250 km2), Adventdalen Group (690 km2), Kapp Toscana Group (275 km2), Sassendalen Group (335 km2), Tempelfjorden Group (225 km2) and Gipsdalen Group (390 km2). As part of the Adventdalen Group, we could identify the seismic boundaries of the Janusfjellet Subgroup (490 km2), which features large thickness variations caused by folding related to compressional tectonics from the Paleogene.
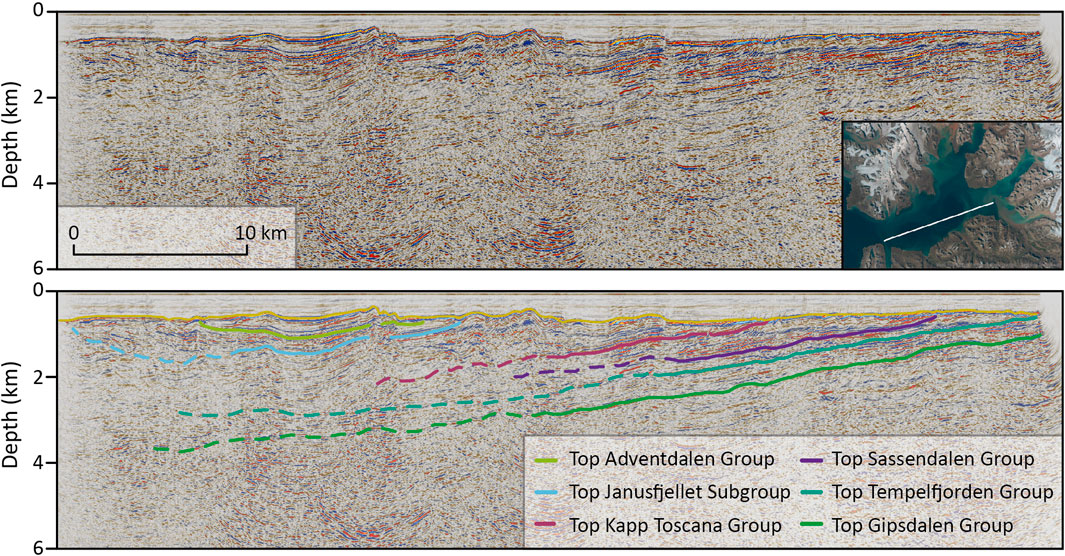
FIGURE 4. Interpretation of the seismic profile NH8509-NH8509-202-mig080001 crossing the main trunk of Isfjorden. The seismic profile is a central section of Isfjorden, and it is representative of the structures that are present on all profiles. It has a vertical exaggeration x10 and a depth scale converted from seismic assuming 4 km/s as constant velocity for the compacted rocks in Svalbard. The map shows the seismic line’s location in the fjord’s regional setting.
The Agardhfjellet Formation (the lower part of the Janusfjellet Subgroup) is of high interest in this study due to its potential as a source rock. The seismic data exhibit chaotic reflectors across the upper boundary of the formation. We estimated the total outcropping area of the formation in the fjord at 80 km2 (Figure 3). The Botneheia Formation, the youngest unit of the Sassendalen Group, is also a primary unit of interest in our study for its hydrocarbon potential and it outcrops over 195 km2 in the inner part of Isfjorden.
In Van Mijenfjorden, the stratigraphy of the syncline and the fjord’s general structure limit the seafloor exposures to mainly the Van Mijenfjorden Group and Adventdalen Group, covering 260 km2 and 210 km2, respectively. The Janusfjellet Subgroup (60 km2), Kapp Toscana Group (12 km2), Sassendalen Group (25 km2) and Tempelfjorden Group (2.5 km2) outcrop in the western part of the fjord.
In the 2015 dataset, the largest concentration of normalized flares in Isfjorden was within the outcropping Kapp Toscana Group (9.69 flares/km2), and the organic-rich formations Agardhfjellet Formation (7.96 flares/km2) and Botneheia Formation (7.13 flares/km2). A different distribution is found for the 2021 dataset, with 3.94 flares/km2 observed within Janusfjellet Subgroup, followed by the Gipsdalen Group (3.3 flares/km2) and the Tempelfjorden Group (1.74 flares/km2) (Figure 5). In Van Mijenfjorden, the largest concentration of flares was within Janusfjellet Subgroup (11.06 flares/km2), followed by Adventdalen Group (4.64 flares/km2), Van Mijenfjorden Group (2.44 flares/km2) and Kapp Toscana Group (1.21 flares/km2). No flares were detected across the seafloor extent of the Sassendalen and Tempelfjorden groups. Quantitative comparison of the distributions of outcropping geological units, pockmarks, gas flares, and structural elements relied on the normalization of the data sets to account for the limited area covered by the cruises in Isfjorden. The occurrence of these geological features was normalized according to the interpreted outcrop area of each geological unit in Isfjorden. The results firstly show that the geological units located in the inner part of Isfjorden concentrate a higher number of pockmarks per outcropping area. Secondly, the distribution of faults per outcropping area shows higher concentrations of faults in the Kapp Toscana and Sassendalen groups and the Janusfjellet Subgroup. Finally, the highest flare concentrations (per outcropping area of ship track) were found in the central parts of Isfjorden, across the areas corresponding to the Janusfjellet Subgroup, Agardhfjellet Formation, and the Kapp Toscana Group.
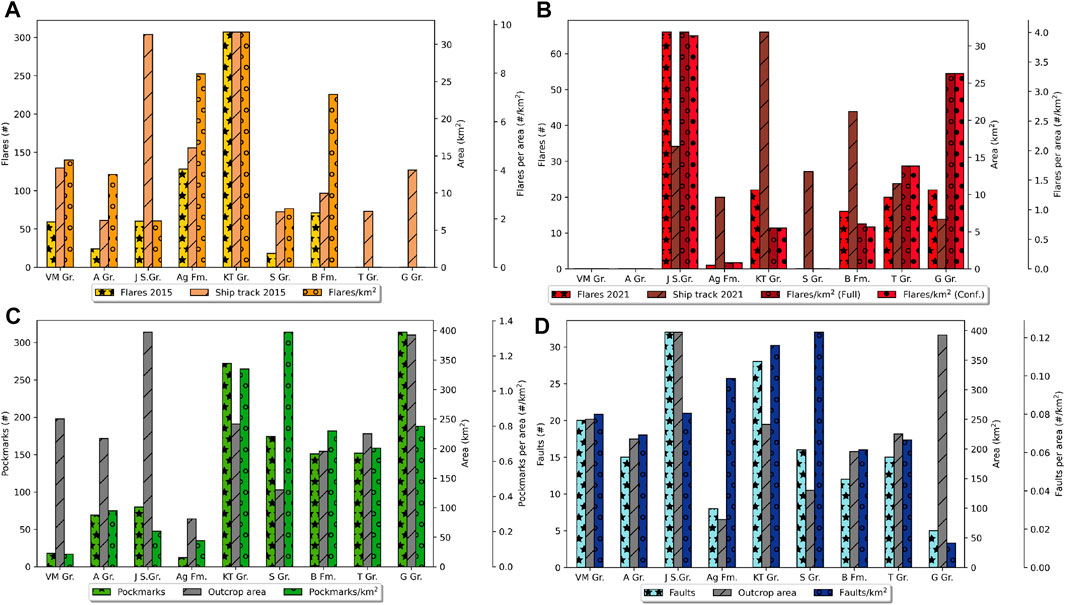
FIGURE 5. (A,B): Bar charts of the percentage of flares, ship track, and normalized flares within each stratigraphic unit (youngest to oldest from left to right) in Isfjorden for the 2015 and 2021 datasets. (C,D): Bar charts of the percentage of pockmarks and faults normalized with the outcropping stratigraphic units in Isfjorden. VM Gr.: Van Mijenfjorden Group; A Gr.: Adventdalen Group; J S.Gr.: Janusfjellet Subgroup; Ag Fm.: Agardhfjellet Formation; KT Gr.: Kapp Toscana Group; B. Fm.: Botneheia Formation; S Gr.: Sassendalen Group; T Gr.: Tempelfjorden Group; G Gr.: Gipsdalen Group.
The differences in water depth settings and acquisition parameters between the two surveys limit the comparison of spatial and temporal aspects. However, as a single Supplementary Dataset, they prove pivotal in correlating seepage within the underlying geology. Consequently, in this section, we discuss the main reasons for the distribution of flares by comparing them with the geological units and organic-rich formations, migration pathways, seafloor surface expressions, oceanographic setting, and gas geochemistry characteristics. In addition, we discuss the implications of shallow seepage for the atmospheric greenhouse gas budget in the High Arctic.
Geochemical studies show that the Middle Jurassic to Lower Cretaceous OMM Agardhfjellet Formation and Middle Triassic Botneheia Formation have the potential to generate mixed oil and gas, and are likely the two most important regional source rocks for gas generation in Spitsbergen (Ohm et al., 2019; Wesenlund et al., 2022; 2021; Olaussen et al., 2022). Roy et al. (2014), suggest secondary migration of gas from the source rocks to the seafloor. Knies et al. (2004) found high concentrations of adsorbed methane and ethane in the southern part of Nordfjorden, implying a thermogenic gas origin from the organic-rich source rocks.
Faults are common migration routes for fluids in many basins worldwide, providing direct routes for the buoyant hydrocarbon fluids to migrate from deeper stratigraphy (Ligtenberg, 2005). In the West Spitsbergen Fold-and-thrust Belt complex, various types of faults and fracture networks have been documented (Teyssier et al., 1995; Braathen et al., 2012), revealing an important role in the migration of fluids ascending from deep source rocks and seeping into the marine environment (Roy et al., 2015). The Kapp Toscana Group is highly fractured and heavily faulted (Figures 5, 6) (Roy et al., 2015). The spatial pockmark distribution on the seafloor over this unit correlates with the faults interpreted by Blinova et al. (2012), and so they most likely act as conduits for gas coming from the underlying Botneheia Formation. Similarly, the Janusfjellet Subgroup consists of highly fractured shale (Braathen et al., 2012; Ogata et al., 2014) with over 25% of the total faults interpreted in Isfjorden. These likely serve as migration pathways for the gas coming from the underlying Agardhfjellet Formation.
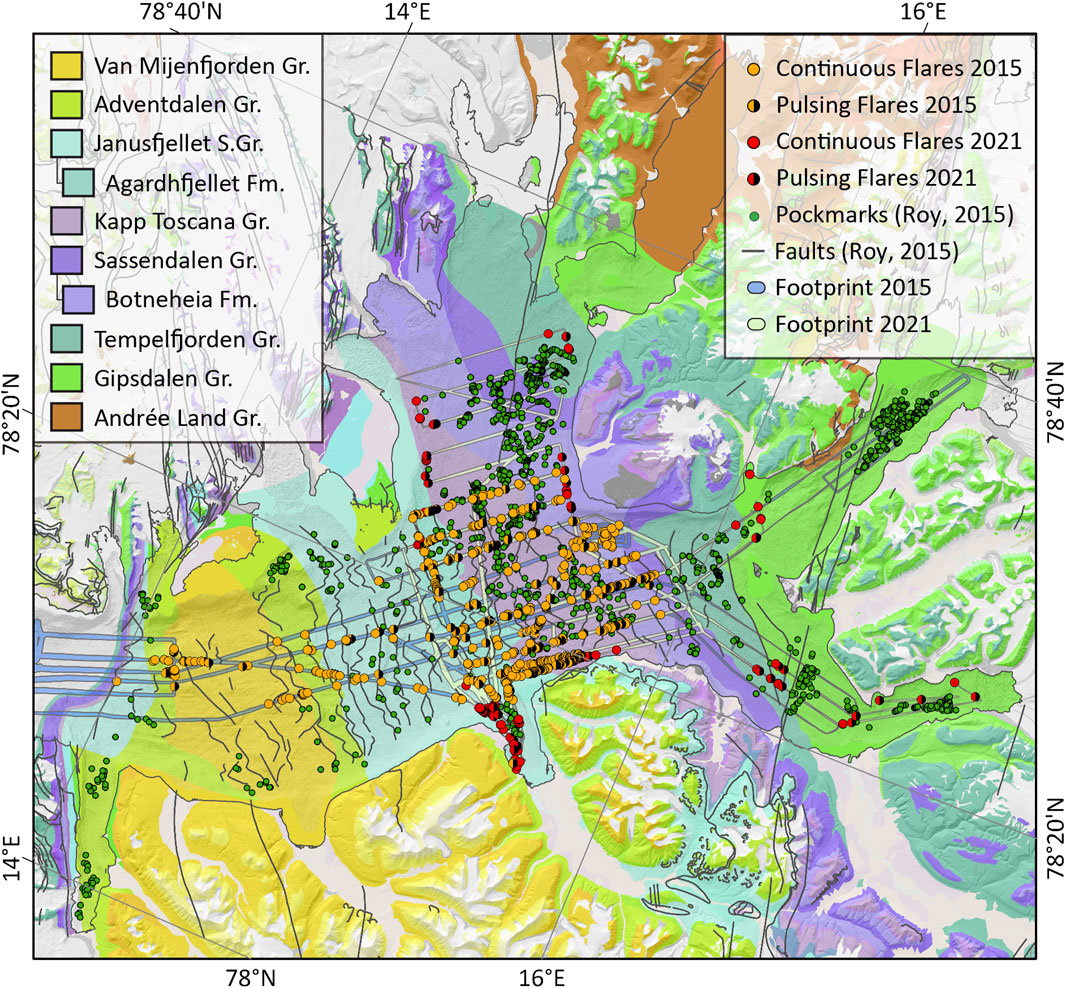
FIGURE 6. Flare distribution in Isfjorden on top of the geological units outcropping in the fjords. In orange are the flares interpretations from the 2015 dataset and in red are the flares interpretation from the 2021 dataset. Pockmark and fault distribution described by (Roy et al., 2015). Stratigraphic units outcropping in Isfjorden result from the interpretations of the seismic profiles. Onshore is the Geological map of the study area from Norwegian Polar Institute, 2016. EPSG:32633 projection.
The results from the geostatistical analyses show that in Isfjorden, gas occurrences described in 2015 are in close association with Agardhfjellet Formation, Kapp Toscana Group and Botneheia Formation. In June 2021, the highest flare concentrations were over the mapped Janusfjellet Subgroup (mainly distributed in Adventfjorden) and Kapp Toscana Group. Therefore we find that collectively, both surveys support the conclusion of Knies et al. (2004) and Roy et al. (2015), who suggested that stratigraphy, lithology and faulting control the fluid flow migration from source rocks in Isfjorden.
Pingos and pockmarks are morphological features related to the expulsion of fluids on land or the seabed (Hovland and Judd, 1988). In high latitudes, pore-water seepage, thawing permafrost, gas hydrate dissociation, and up-drifting ice detached from the seafloor are important factors for pockmark formation (Roy et al., 2015). In Isfjorden, the abundance of pockmarks aligned along the outcropping edge of doleritic intrusions from the Early Cretaceous (Senger et al., 2013; Roy et al., 2014), suggesting that they act as crucial conduits channeling the buoyant fluid flow toward the surface (Figures 7, 8). There are also numerous pockmark occurrences aligned with steep faults suggesting that these could provide direct routes for the methane-rich fluids from organic-rich formations (Agardhfjellet and Botneheia formations), which would then seep through the seafloor, remobilizing the soft, fine-grained sediments and forming pockmarks (Forwick et al., 2009; Roy et al., 2014).
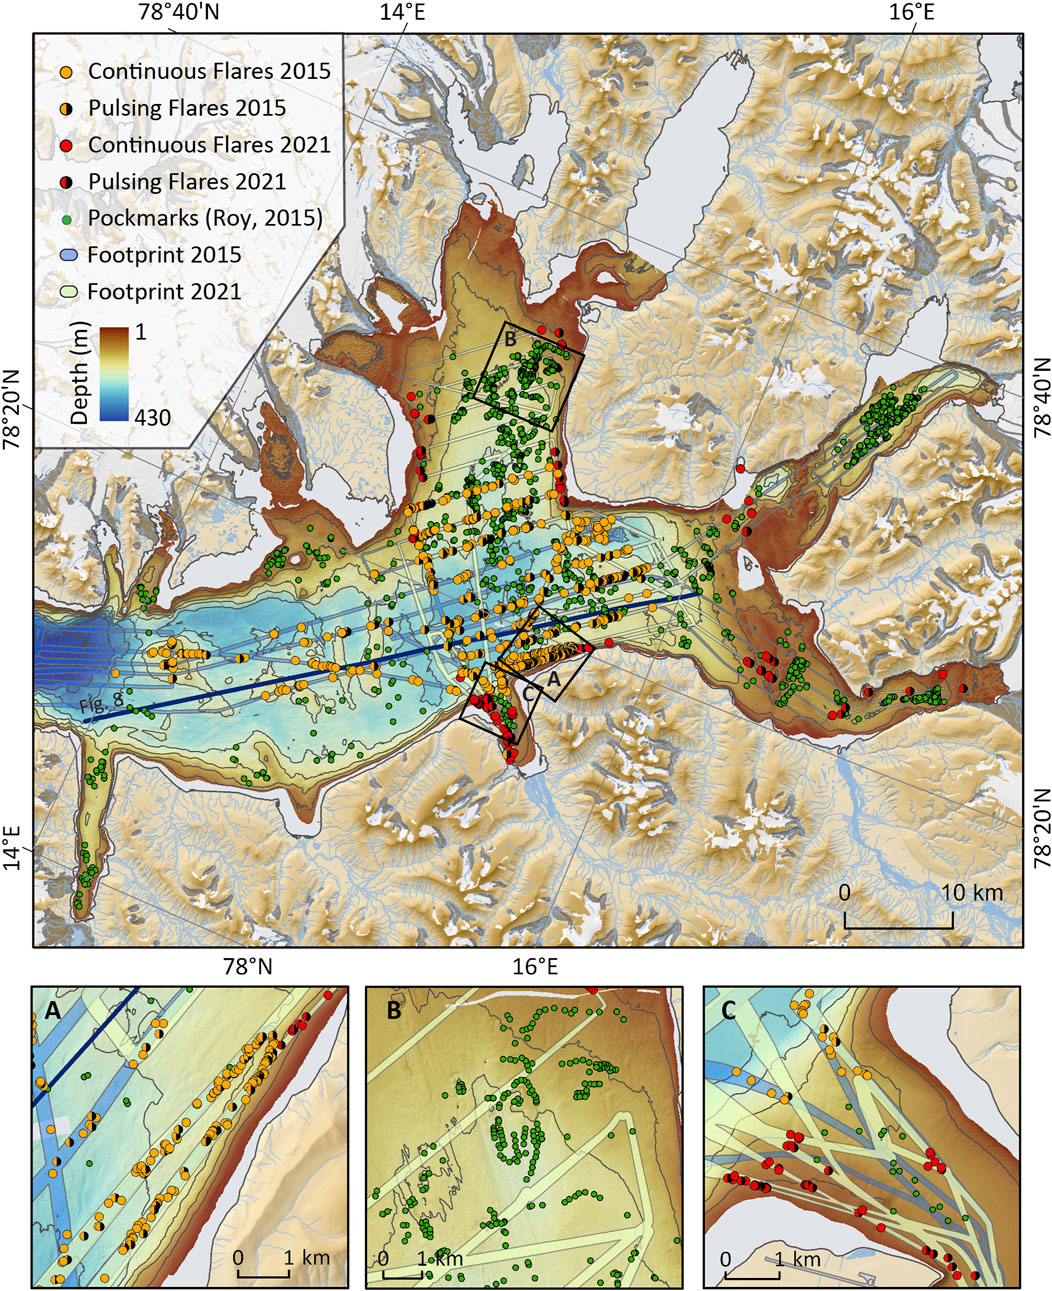
FIGURE 7. Flare distribution in Isfjorden overlain on bathymetry. In orange are the interpreted flares from the 2015 dataset and in red are the flares interpreted from the 2021 dataset. The pockmark distribution described by Roy et al. (2015) is displayed in green. The bathymetry has a 50 m isobath interval. (A). No correlation between areas with high concentrations of flares and pockmarks. (B). Clusters of pockmarks follow the trends of interpreted faults. No flares were detected in the ship transects. (C). Temporal and spatial variation of the seepage detected in 2015 and 2021. The blue line defines the transect represented in Figure 8. EPSG:32633 projection.
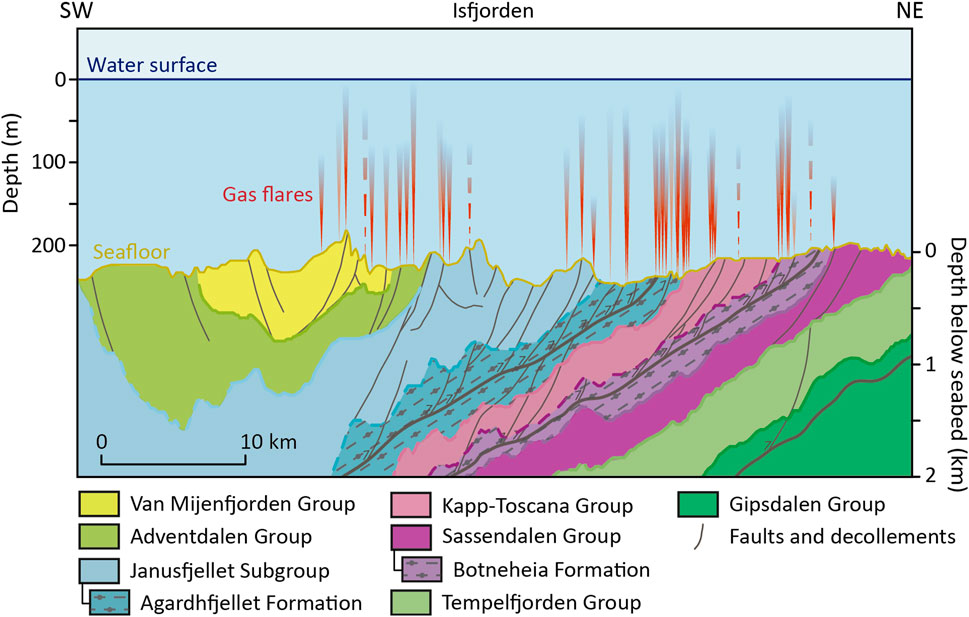
FIGURE 8. Conceptual model of the gas system across Isfjorden demonstrating the main stratigraphic groups outcropping beneath the fjord. The seismic is depth converted assuming 4 km/s as constant velocity. The organic-rich units are the source of the thermogenic gas that migrates through the fault system (Leever et al., 2011; Roy et al., 2015) to the surface. The organic-rich source rocks display a clear spatial correlation with the frequency of the gas flares interpreted in the dataset from 2015 along the transect.
No correlation was observed between the occurrence of pockmarks and flares, as evidenced by the complete absence of flares in areas with high pockmark concentrations (Figure 7B). Neither did we observe high backscatter in the data, which may be associated with coarser sediments that prevent pockmark development (Forwick et al., 2009). A plausible explanation for the notable absence relates to the phase of the fluid outflows. Acoustic flares are detected in the water column only when the outflows contain gases or are in a gaseous phase. The pockmarks may thus still be features affected by ongoing fluid flow, such as pore-water escape, but the gas remains dissolved. In Isfjorden, however, the pockmarks are concentrated in the inner part of the fjord where the oldest stratigraphical units outcrop. Previous findings by Roy et al. (2015) indicate no ongoing fluid seepage of any fluid. The paleo-pockmarks were therefore caused by fluid seepage that most likely migrated along fault zones, doleritic intrusions, and geological unconformities towards the seabed. Since then, however, the escaping fluids may have migrated to new seep locations in the seabed, ceased to flow, or become sealed by changing thermobaric conditions.
High organic matter deposition rates of 5–17 g m-2 yr-1 were reported in the fjords of Svalbard (Winkelmann and Knies, 2005), favoring biogenic methane production by the degradation of organic matter in near-surface sediments (Damm et al., 2021). Therefore, in-situ microbial activity could produce gas accumulations that form bubbles when methane concentrations in the sediment are high enough. For example, a mixture of thermogenic and microbial methane was found in the surface sediments of Isfjorden (Knies et al., 2004; Liira et al., 2019). These gases are proven to seep from the seafloor, suggesting a slow and steady degassing of the fjord subsurface. Most importantly, the geochemical characterization corroborates the occurrence of thermogenic gas migration in Isfjorden (Knies et al., 2004; Liira et al., 2019).
The fjords undergo significant seasonal variability in the water column temperature (Skogseth et al., 2020). In June (late spring/early summer conditions), the water column becomes stratified, with a warm surface and cold water at depth (Skogseth et al., 2020). However, in August (late summer/early autumn), with the water column mixing, the temperature rises in the deeper parts of the fjords. On the one hand, the temperature increase in June may affect the microbial activity in the superficial sediments, favoring the methane production by the degradation of organic matter in near-surface sediments, as suggested by Damm et al. (2021). On the other hand, the summer temperature increase may contribute to the gradual thinning and degradation of near-shore permafrost leading to captured or trapped gas release, as discussed by Roy et al. (2014). The fluids may migrate beneath the onshore impermeable permafrost and then seep through to the seabed, where the permafrost is absent or discontinuous.
Methane fluxes into the atmosphere increase with shallower water depths (Greinert et al., 2010). Shallow sites (depths <100 m.b.s.l.) may represent a significant source of methane to the surface water and direct local emissions into the atmosphere (Schmale et al., 2005; Graves et al., 2015). The flares observed in the deep parts of Isfjorden do not reach the water surface but contribute to keeping the fjord waters supersaturated with methane. Methane is mixed within the water column and transported along vertical isopycnals until it reaches the water-atmosphere interface (Damm et al., 2021) enabling diffusion into the atmosphere, or it is removed by methane-consuming processes in the sediments or water column such as microbial oxidation. Shallow sites with large flares clusters are likely to contribute methane directly into the atmosphere via ebullition (i.e., bubble bursts at the water surface).
Studies from offshore and onshore Svalbard demonstrate the existence of active hydrocarbon systems in the region (Abay et al., 2017; Betlem et al., 2021; Blinova et al., 2012; Blumenberg et al., 2018; Hornum et al., 2020; Knies et al., 2004; Liira et al., 2019; Mau et al., 2017; Ohm et al., 2019; Roy et al., 2016; Roy et al., 2015; Roy et al., 2019; Senger et al., 2019; Weniger et al., 2019, and references therein). Although methane is the most common hydrocarbon gas in on- and offshore sediments (Forster et al., 2007; Judd and Hovland, 2007), gas samples, proven source rocks outcropping in the fjords and an active petroleum system indicate input from deeper thermogenic hydrocarbon sources. This is unsurprising given the existence of numerous prolific source rocks throughout the Barents Shelf (Henriksen et al., 2011) and 45% of wellbores drilled on the Barents Shelf are classified as discoveries (Senger et al., 2019).
Blumenberg et al. (2016) reported hydrocarbons from near-surface sediments of the Barents Sea north of Svalbard, where thermogenic methane gas adsorbed to the sediment matrix was found. Similarly Weniger et al., (2019), found that near-surface sediment-bound gases in the northern Barents Sea generally have compositional and stable carbon isotope signatures of thermogenic gas. Knies et al. (2004) presented geochemical evidence from Isfjorden and east of Spitsbergen that proposed that thermogenic hydrocarbons from deep sources had migrated to near-seafloor sediments. Liira et al. (2019) reported slow and steady hydrocarbon gas emissions of the Isfjorden pockmarks and surrounding undisturbed seafloor, having elevated concentrations of the higher hydrocarbon homologies, indicating, at least to some extent, input from thermogenic sources to the overall seeping gas budget (Figure 9).
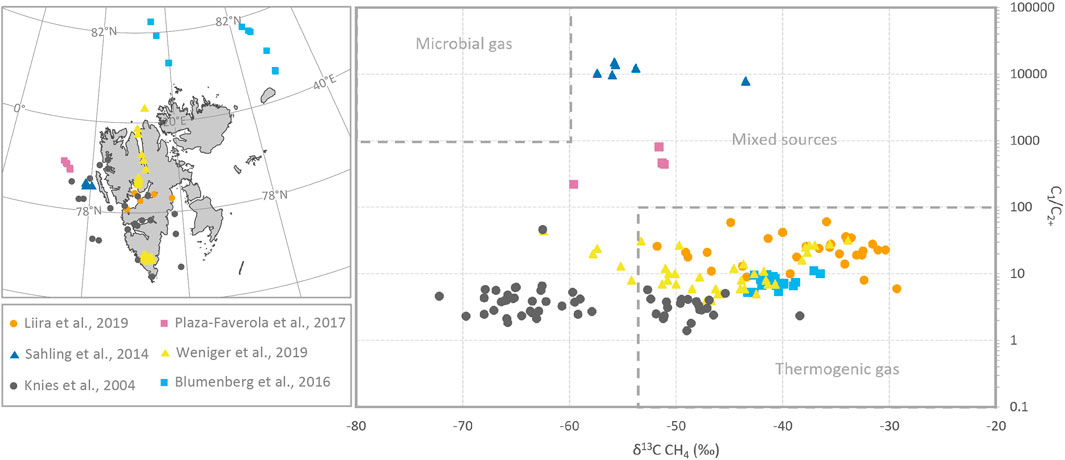
FIGURE 9. Compilation of the published sorbed and free gas geochemical analysis data from offshore sediments around Svalbard. The plot C1/C2+ versus the isotopic composition of CH4 illustrates the predominantly thermogenic signature of the analyzed gas.
Onshore gas analyses from the Longyearbyen CO2 lab boreholes in Adventdalen (Huq et al., 2017; Ohm et al., 2019) show that methane encountered in the shallow subsurface is from a microbial source, based on δ13C values of degassed methane and CO2 (Huq et al., 2017). Hodson et al. (2020) revealed year-round sub-permafrost methane migration in Adventdalen, central Spitsbergen, via open system pingos where isotope data mostly suggests a microbial origin. In Adventdalen, the shallow gas accumulations are composed of methane with a significant contribution of higher order hydrocarbons (wet gas) encountered through the Jurassic source rock and underlying reservoirs (Huq et al., 2017; Ohm et al., 2019). The wetter gas is likely due to its thermogenic origin from the marine source rock of the Agardhfjellet Formation (Ohm et al., 2019), while the methane-dominated shallower gas is a likely result of microbial or coalbed (coal is prolific in the upper parts of the wellbore) origin. Kleber et al., (2023) show that the thermogenic methane is by far the most common gas source in the terrestrial seeps found in glacier forefields.
Spatially, gas has been frequently encountered in shallow intervals throughout Svalbard (Birchall et al., 2021) and shows little prevalence in any particular stratigraphic interval, except where there is no prolific source rock present due to erosion. Although samples are limited, the shallow gas composition varies, with samples from Spitsbergen appearing to be more methane dominated. In contrast, gas sampled from Hopen Island in the southeasternmost part of Svalbard revealed wet gas (C2 and heavier making up > 31%). Given the large variations in gas composition, further studies are required to better understand the origins of the gas encountered throughout the onshore and nearshore areas of Svalbard. However, the variability and existence of numerous prolific source rocks and coal seams suggests that gas is common in the shallow subsurface of the archipelago. Ongoing migration is also evident in numerous seeps and flares, with some gas accumulations having been encountered in sediments less than 600 years old (Birchall et al., 2021).
An increased inflow of Atlantic Water results in temperature and salinity rise in the water column from Isfjorden (Skogseth et al., 2020). This increment in temperature would reduce the extent of potential sub-marine permafrost, releasing the gas trapped underneath. Methane release from such sub-permafrost stores represents a significant uncertainty in the Arctic greenhouse gas budget (Hodson et al., 2020). In addition, although the presence of gas hydrates from the fjords of Svalbard has to date not been documented to our knowledge, modelling shows that parts of central Isfjorden present favorable thermobaric conditions for natural gas hydrate formation down from the seafloor (Betlem et al., 2021). Given the numerous gas flares observed in the area, together with the organic-rich units outcropping there, the occurrence of gas hydrates is not unlikely. Where present, temperature variations may affect their stability. Further investigations are needed to assess the extent of natural gas hydrates in the fjords, and the effects hereon of bottom-water temperature change, especially in the context of the recentness of shallow gas accumulations. This is equally important for close-to-shore areas that may host sub-sea permafrost but have not been surveyed yet (Birchall et al., 2021).
Most of the Circum Arctic has a shared geological and glacial history with Svalbard and is equally exposed to the effects of climate change (Batchelor et al., 2019). Svalbard’s fjords which are extensively studied due to their easy accessibility, present a similar and exposed geology to the Barents Sea (Worsley, 2008). Hence, due to its easy access and data availability, Svalbard may be an excellent place to study the mechanisms that result in the release of methane from the sub-surface into the water column and the atmosphere in the High Arctic. Shallow fjord methane emissions are likely to be particularly important in Arctic regions like Svalbard, and their climate-sensitivity means they could contribute to the atmospheric carbon pool, thus enhancing the Arctic amplification of global warming (Westbrook et al., 2009).
In this study, we document widespread active gas seepage in Svalbard’s fjord system with 948 individual gas flares observed during two research cruises in 2015 and 2021. We have integrated the hydroacoustic data to decipher the likely source and migration pathways of the gas and conclude that:
• Gas seepage is widespread in the fjords of western Svalbard, proving an active fluid flow system.
• Geostatistical analyses prove that gas flares in Isfjorden are found within or close to organic-rich stratigraphic sequences -Botneheia Fm and Agardhfjellet Fm- outcropping in the fjord.
• Gas migration towards the seafloor occurs along faults, high permeability layers, and heavily fractured rock units.
• There is no spatial correlation between the distribution of pockmarks and the observed active gas flares, suggesting that the pockmarks observed throughout the seabed are not the result of present-day gas emissions.
The datasets generated and analyzed in this study can be found in Zenodo repository, https://doi.org/10.5281/zenodo.7822180. We provide a minimal working example as a Python script to calculate the flare density per multibeam area of outcropping geological units. This information has also been included in the Supplementary Material.
NR: Conceptualization, Methodology, Software, Validation, Formal analysis, Investigation, Resources, Data Curation, Writing—Original Draft, Visualization, Project administration, Funding acquisition, Writing—Review and Editing. PB: Conceptualization, Methodology, Software, Validation, Formal analysis, Investigation, Data Curation, Writing—Original Draft, Visualization, Project administration, Supervision, Funding acquisition, Writing—Review and Editing. KS: Conceptualization, Investigation, Resources, Data Curation, Writing—Original Draft, Supervision, Funding acquisition, Writing—Review and Editing. MR: Conceptualization, Methodology, Investigation, Resources, Data Curation, Funding acquisition, Writing—Review and Editing, Supervision. AH: Resources, Writing—Review and Editing, Funding acquisition. ML: Investigation, Visualization, Writing—Original Draft, Writing—Review and Editing. TB: Investigation, Writing—Original Draft. SR: Investigation, Data Curation, Writing—Review and Editing. RN: Data Curation, Writing—Review and Editing. AS-S: Investigation, Writing—Review and Editing. SO: Writing—Review and Editing. GB: Resources, Funding acquisition, Supervision. All authors contributed to the article and approved the submitted version.
This study was partly funded by the Svalbard Science Forum (SSF) via an Arctic Field Grant 2021 (RCN #322189) and The Research Council of Norway (RCN) through the CLIMAGAS project (RCN #294764), the Norwegian CCS Research Centre (NCCS; industry partners and RCN #257579) and the Research Centre for Arctic Petroleum Exploration (ARCEx; industry partners and RCN #228107).
We sincerely thank Norbit Subsea for lending us an excellent multibeam system for the GASGEM2021 cruise. We thank the crew and chief scientist Dr. Susan Mau for their support in enabling and conducting hydroacoustic water column mapping during R/V Heincke cruise HE449. Depth data from the Mapping Authority sea division, reproduced with permission no. 13/G706, provided by the Norwegian Hydrographic Service. We also acknowledge the Czech Arctic Research Station and the crew of RV Clione for their assistance during the GASGEM2021 cruise. Finally, we sincerely appreciate the constructive feedback provided by Shyam Chand and Pavel Serov, as well as the excellent editorial handling by Jochen Knies.
The authors declare that the research was conducted in the absence of any commercial or financial relationships that could be construed as a potential conflict of interest.
All claims expressed in this article are solely those of the authors and do not necessarily represent those of their affiliated organizations, or those of the publisher, the editors and the reviewers. Any product that may be evaluated in this article, or claim that may be made by its manufacturer, is not guaranteed or endorsed by the publisher.
The Supplementary Material for this article can be found online at: https://www.frontiersin.org/articles/10.3389/feart.2023.1173477/full#supplementary-material
Abay, T. B., Karlsen, D. A., Lerch, B., Olaussen, S., Pedersen, J. H., and Backer-Owe, K. (2017). Migrated petroleum in outcropping mesozoic sedimentary rocks in spitsbergen: Organic geochemical characterization and implications for regional exploration. J. Pet. Geol. 40, 5–36. doi:10.1111/jpg.12662
Abay, T. B., Karlsen, D. A., Pedersen, J. H., Olaussen, S., and Backer-Owe, K. (2018). Thermal maturity, hydrocarbon potential and kerogen type of some triassic-lower cretaceous sediments from the SW Barents Sea and Svalbard. Pet. Geosci. 24, 349–373. doi:10.1144/petgeo2017-035
Anell, I., Braathen, A., and Olaussen, S. (2014). The triassic – early jurassic of the northern Barents shelf: A regional understanding of the longyearbyen CO2 reservoir. Nor. J. Geol. Available at: https://www.duo.uio.no/handle/10852/62025 94, 83–98.
Austegard, A., Baturin, D., Eiken, O., Faleide, J. I., Thor, S., Peter, G., et al. (1994). Seismic Atlas of Western Svalbard. selection of regional seismic transects. Oslo.
Bælum, K., and Braathen, A. (2012). Along-strike changes in fault array and rift basin geometry of the Carboniferous Billefjorden Trough, Svalbard, Norway. Tectonophysics 546–547, 38–55. doi:10.1016/j.tecto.2012.04.009
Batchelor, C. L., Dowdeswell, J. A., Rignot, E., and Millan, R. (2019). Submarine moraines in southeast Greenland fjords reveal contrasting outlet-glacier behavior since the last glacial maximum. Geophys Res. Lett. 46, 3279–3286. doi:10.1029/2019GL082556
Betlem, P., Roy, S., Birchall, T., Hodson, A., Noormets, R., Römer, M., et al. (2021). Modelling of the gas hydrate potential in Svalbard’s fjords. J. Nat. Gas. Sci. Eng. 94, 104127. doi:10.1016/j.jngse.2021.104127
Birchall, T., Jochmann, M., Betlem, P., Senger, K., and Olaussen, S. (2021). Permafrost trapped natural gas in svalbard, Norway. Cryosphere Discuss. doi:10.5194/tc-2021-226
Blinova, M., Inge Faleide, J., Gabrielsen, R. H., and Mjelde, R. (2012). Seafloor expression and shallow structure of a fold-and-thrust system, Isfjorden, west Spitsbergen. Polar Res. 31, 11209. doi:10.3402/polar.v31i0.11209
Blumenberg, M., Lutz, R., Schlömer, S., Krüger, M., Scheeder, G., Berglar, K., et al. (2016). Hydrocarbons from near-surface sediments of the Barents Sea north of Svalbard - indication of subsurface hydrocarbon generation? Mar. Pet. Geol. 76, 432–443. doi:10.1016/j.marpetgeo.2016.05.031
Blumenberg, M., Weniger, P., Kus, J., Scheeder, G., Piepjohn, K., Zindler, M., et al. (2018). Geochemistry of a middle Devonian cannel coal (Munindalen) in comparison with Carboniferous coals from Svalbard. arktos 4, 1–8. doi:10.1007/s41063-018-0038-y
Braathen, A., Bælum, K., Christiansen, H. H., Dahl, T., Eiken, O., Elvebakk, H., et al. (2012). The longyearbyen CO2 lab of svalbard, Norway—Initial assessment of the geological conditions for CO2 sequestration. Nor. J. Geol. Available at: https://d1wqtxts1xzle7.cloudfront.net/33078163/Braathen_et_al_2012_%28CO2%29.pdf?1393332456=&response-content-disposition=inline%3B+filename%3DBraathen_et_al_2012_CO2_sequestration.pdf&Expires=1686585036&Signature=hSCoxonW2pnEgNSQAOAMEbKVw∼qiPFpXX65jtHc63EqRoPBPR7CCir-aGdidIZGlHP1tH1c-2WbhVDDnxsN3FXYB8tqbaS∼RE∼2CU8Tc5r9rtKCSc4Hp9w12EVZDiuEXj85WfHLnD50Fh0sLoFENXLT1gXOl3qaTFNtZvPowJ0V6PZC∼0V5Vsm7qEAoXA8o9aizOOCibjCbxhbv∼VoDHQdscDButHkVrDEeNV∼Ekfxif6tKcQogpxvsN∼0dAsP-zQoSB78u8KMOxv3PuGnX7J50lpzIG83Dn0Qxc2SqazC7Cc6∼u-nGGN-∼rpgMj5mFfZCAzOQGEUADA7bHFdud6uA__&Key-Pair-Id=APKAJLOHF5GGSLRBV4ZA 92, 353–376.
Bünz, S., Polyanov, S., Vadakkepuliyambatta, S., Consolaro, C., and Mienert, J. (2012). Active gas venting through hydrate-bearing sediments on the Vestnesa Ridge, offshore W-Svalbard. Mar. Geol. 332–334, 189–197. doi:10.1016/j.margeo.2012.09.012
Damm, E., Ericson, Y., and Falck, E. (2021). Waterside convection and stratification control methane spreading in supersaturated Arctic fjords (Spitsbergen). Cont. Shelf Res. 224, 104473. doi:10.1016/j.csr.2021.104473
Forster, P., Ramaswamy, V., Artaxo, P., Berntsen, T., Betts, R., Fahley, D. W., et al. (2007). “Changes in atmospheric constituents and in radiative forcing,” in Climate change 2007: The physical science basis. Contribution of working group I to the 4th assessment report of the intergovernmental panel on climate change (Cambridge).
Forwick, M., Baeten, N., and Vorren, T. (2009). Pockmarks in spitsbergen fjords. Nor. J. Geology/Norsk Geol. Forening 89, 65–77. doi:10.1016/j.palaeo.2009.06.026
Gentz, T., Damm, E., Schneider von Deimling, J., Mau, S., McGinnis, D. F., and Schlüter, M. (2014). A water column study of methane around gas flares located at the West Spitsbergen continental margin. Cont. Shelf Res. 72, 107–118. doi:10.1016/j.csr.2013.07.013
Gjelberg, J. G., and Steel, R. J. (1981). An outline of lower-middle carboniferous sedimentation on svalbard: Effects of tectonic, climatic and sea level changes in rift basin sequences. Available at: https://www.sciencedirect.com/science/article/pii/S0928893706800871.
Gjelberg, J., and Steel, R. J. (1995). Helvetiafjellet Formation (Barremian-Aptian), spitsbergen: Characteristics of a transgressive succession. Nor. Pet. Soc. Spec. Publ. 5, 571–593.
Graves, C. A., Steinle, L., Rehder, G., Niemann, H., Connelly, D. P., Lowry, D., et al. (2015). Fluxes and fate of dissolved methane released at the seafloor at the landward limit of the gas hydrate stability zone offshore Western Svalbard. J. Geophys Res. Oceans 120, 6185–6201. doi:10.1002/2015JC011084
Greinert, J., McGinnis, D. F., Naudts, L., Linke, P., and De Batist, M. (2010). Atmospheric methane flux from bubbling seeps: Spatially extrapolated quantification from a Black Sea shelf area. J. Geophys Res. Oceans 115, C01002. doi:10.1029/2009JC005381
Harland, W. B., Cutbill, J. L., Friend, P. F., Gobbett, D. J., Holliday, D. W., Maton, P. I., et al. (1974). The Billefjorden Fault Zone, Spitsbergen the lang history of a major tectonic lineament NORSK POLARINSTITUTT, OSLO.
Harland, W. B., Anderson, L. M., Manasrah, D., Butterfield, N. J., Challinor, A., Doubleday, P. A., et al. (1997). The geology of svalbard The Geological Society, London.
Hassol, S. J., Salomons, E., Zijderveld, J., and Corell, R. (2004). Impacts of a warming arctic–arctic climate impact assessment Cambridge University Press.
Helland-Hansen, W., and Grundvåg, S. A. (2021). The svalbard eocene-oligocene (?) central basin succession: Sedimentation patterns and controls. Basin Res. 33, 729–753. doi:10.1111/bre.12492
Henriksen, E., Bjørnseth, H. M., Hals, T. K., Heide, T., Kiryukhina, T., Kløvjan, O. S., et al. (2011). Chapter 17: Uplift and erosion of the greater Barents Sea: Impact on prospectivity and petroleum systems. Geol. Soc. Mem. 35, 271–281. doi:10.1144/M35.17
Hodson, A. J., Nowak, A., Hornum, M. T., Senger, K., Redeker, K., Christiansen, H. H., et al. (2020). Sub-permafrost methane seepage from open-system pingos in Svalbard. Cryosphere 14, 3829–3842. doi:10.5194/tc-14-3829-2020
Hornum, M. T., Hodson, A. J., Jessen, S. R., Bense, V., and Senger, K. (2020). Numerical modelling of permafrost spring discharge and open-system pingo formation induced by basal permafrost aggradation. Cryosphere 14, 4627–4651. doi:10.5194/tc-14-4627-2020
Hovland, M., and Judd, A. (1988). Seabed pockmarks and seepages: Impact on geology, biology and the marine environment London: Graham & Trotman. doi:10.1111/j.1749-6632.1993.tb18844.x
Huq, F., Smalley, P. C., Mørkved, P. T., Johansen, I., Yarushina, V., and Johansen, H. (2017). The Longyearbyen CO2 Lab: Fluid communication in reservoir and caprock. Int. J. Greenh. Gas Control 63, 59–76. doi:10.1016/j.ijggc.2017.05.005
Jakobsson, M., Mayer, L. A., Bringensparr, C., Castro, C. F., Mohammad, R., Johnson, P., et al. (2020). The international bathymetric chart of the Arctic Ocean version 4.0. Scientific data 7(1), 176.
Judd, A., and Hovland, M. (2007). Seabed fluid flow: The impact on geology, biology and the marine environment Cambridge University Press.
Kleber, G. E., Hodson, A. J., Magerl, L., Mannerfelt, E. S., Bradbury, H., Zhu, Y., et al. (2023). Groundwater springs formed during glacial retreat are a large source of methane in the high Arctic. Nat. Geosci. doi:10.1038/s41561-023-01210-6
Knies, J., Damm, E., Gutt, J., Mann, U., and Pinturier, L. (2004). Near-surface hydrocarbon anomalies in shelf sediments off Spitsbergen: Evidences for past seepages. Geochem. Geophys. Geosystems 5. doi:10.1029/2003GC000687
Knudsen, E. W. (2015). Processing and interpretation of multichannel seismic data from van mijenfjorden. Svalbard: University of Bergen.
Koevoets, M. J., Abay, T. B., and HammerOlaussen, S. (2016). High-resolution organic carbon-isotope stratigraphy of the middle jurassic-lower cretaceous Agardhfjellet Formation of central spitsbergen, svalbard. Palaeogeogr. Palaeoclimatol. Palaeoecol. 449, 266–274. doi:10.1016/j.palaeo.2016.02.029
Koevoets, M. J., Hammer, Ø., Olaussen, S., Senger, K., and Smelror, M. (2018). Integrating subsurface and outcrop data of the middle Jurassic to lower Cretaceous Agardhfjellet Formation in central Spitsbergen. Nor. J. Geol. 98, 1–34. doi:10.17850/njg98-4-01
Krajewski, K. P. (2008). The Botneheia Formation (middle triassic) in edgeøya and barentsøya, svalbard: Lithostratigraphy, facies, phosphogenesis, paleoenvironment. Pol. Polar Res. Available at: https://citeseerx.ist.psu.edu/document?repid=rep1&type=pdf&doi=8ab1828c4f15c775b9df05ab69600a31490b9a34 29, 319–364.
Leever, K. A., Gabrielsen, R. H., Faleide, J. I., and Braathen, A. (2011). A transpressional origin for the West Spitsbergen fold-and-thrust belt: Insight from analog modeling. Tectonics 30. doi:10.1029/2010TC002753
Ligtenberg, J. H. (2005). Detection of Fluid migration pathways in seismic data: Implications for fault seal analysis. Basin Res. 17, 141–153. doi:10.1111/j.1365-2117.2005.00258.x
Liira, M., Noormets, R., Sepp, H., Kekišev, O., Maddison, M., and Olaussen, S. (2019). Sediment geochemical study of hydrocarbon seeps in isfjorden and mohnbukta: A comparison between Western and eastern spitsbergen, svalbard. Arktos 5, 49–62. doi:10.1007/s41063-019-00067-7
Lord, G. S., Johansen, S. K., Støen, S. J., and Mørk, A. (2017). Facies development of the upper triassic succession on barentsøya, Wilhelmøya and NE spitsbergen, svalbard. Nor. J. Geol. 97, 33–62. doi:10.17850/njg97-1-03
Lowell, J. D. (1972). Spitsbergen tertiary orogenic belt and the spitsbergen fracture zone. Geol. Soc. Am. Bull. 83, 3091–3102. doi:10.1130/0016-7606(1972)83[3091:stobat]2.0.co;2
Lutz, R., Klitzke, P., Weniger, P., Blumenberg, M., Franke, D., Reinhardt, L., et al. (2021). Basin and petroleum systems modelling in the northern Norwegian Barents Sea. Mar. Pet. Geol. 130, 105128. doi:10.1016/j.marpetgeo.2021.105128
Maher, H. D. (2001). Manifestations of the cretaceous high arctic large igneous province in svalbard. J. Geol. 109, 91–104. doi:10.1086/317960
Marshall, C., Uguna, J., Large, D. J., Meredith, W., Jochmann, M., Friis, B., et al. (2015). Geochemistry and petrology of palaeocene coals from Spitzbergen - Part 2: Maturity variations and implications for local and regional burial models. Int. J. Coal Geol. 143, 1–10. doi:10.1016/j.coal.2015.03.013
Matysik, M., Stemmerik, L., Olaussen, S., and Brunstad, H. (2018). Diagenesis of spiculites and carbonates in a permian temperate ramp succession – tempelfjorden group, spitsbergen, arctic Norway. Sedimentology 65, 745–774. doi:10.1111/sed.12404
Mau, S., and Rohardt, G. (2016). Physical oceanography during HEINCKE cruise HE449 Alfred Wegener Institute, Helmholtz Centre for Polar and Marine Research, Bremerhaven.
Mau, S., Römer, M., Torres, M. E., Bussmann, I., Pape, T., Damm, E., et al. (2017). Widespread methane seepage along the continental margin off Svalbard-from Bjørnøya to Kongsfjorden. Sci. Rep. 7, 42997. doi:10.1038/srep42997
Mienert, J., Vanneste, M., Bünz, S., Andreassen, K., Haflidason, H., and Sejrup, H. P. (2005). Ocean warming and gas hydrate stability on the mid-Norwegian margin at the Storegga Slide. Mar. Pet. Geol. 22, 233–244. doi:10.1016/j.marpetgeo.2004.10.018
Mørk, A., Knarud, R., and Worsley, D. (1982). Depositional and diagenetic environments of the triassic and lower jurassic succession of svalbard. Available at: https://archives.datapages.com/data/cspg_sp/data/008/008001/371_cspgsp0080371.htm.
Mørk, A., Elvebakk, G., Forsberg, A. W., Hounslow, M. W., Nakrem, H. A., Vigran, J. O., et al. (1999). The type section of the Vikinghogda formation: A new lower triassic unit in central and eastern svalbard. Polar Res. 18, 51–82. doi:10.1111/j.1751-8369.1999.tb00277.x
Mørk, M. B. E. (2013). Diagenesis and quartz cement distribution of low-permeability Upper Triassic-Middle Jurassic reservoir sandstones, Longyearbyen CO2 lab well site in Svalbard, Norway. Am. Assoc. Pet. Geol. Bull. 97, 577–596. doi:10.1306/10031211193
Nicolaisen, J. B., Elvebakk, G., Ahokas, J., Bojesen-Koefoed, J. A., Olaussen, S., Rinna, J., et al. (2019). Characterization of upper palaeozoic organic-rich units in svalbard: Implications for the petroleum systems of the Norwegian Barents shelf. J. Pet. Geol. 42, 59–78. doi:10.1111/jpg.12724
Nordli, Ø., Przybylak, R., Ogilvie, A. E. J., and Isaksen, K. (2014). Long-term temperature trends and variability on spitsbergen: The extended svalbard airport temperature series, 1898-2012. Polar Res. 33, 21349. doi:10.3402/polar.v33.21349
Nøttvedt, A., Livbjerg, F., Midbøe, P. S., and Rasmussen, E. (1993). “Hydrocarbon potential of the central Spitsbergen Basin,” in Norwegian petroleum society special publications, 333–361. doi:10.1016/B978-0-444-88943-0.50026-5
Ogata, K., Senger, K., Braathen, A., Tveranger, J., and Olaussen, S. (2014). Fracture systems and mesoscale structural patterns in the siliciclastic Mesozoic reservoir-caprock succession of the Longyearbyen CO2 Lab project: Implications for geological CO2 sequestration in Central Spitsbergen, Svalbard. Nor. J. Geol. Available at: https://www.researchgate.net/profile/Kei-Ogata/publication/271443183_Fracture_systems_and_mesoscale_structural_patterns_in_the_siliciclastic_Mesozoic_reservoir-caprock_succession_of_the_Longyearbyen_CO2_Lab_project_Implications_for_geological_CO2_sequestration_in_Centr/links/54c7b3100cf22d626a36e118/Fracture-systems-and-mesoscale-structural-patterns-in-the-siliciclastic-Mesozoic-reservoir-caprock-succession-of-the-Longyearbyen-CO2-Lab-project-Implications-for-geological-CO2-sequestration-in-Centr.pdf 94, 121–154.
Ohm, S. E., Larsen, L., Olaussen, S., Senger, K., Birchall, T., Demchuk, T., et al. (2019). Discovery of shale gas in organic-rich Jurassic successions, Adventdalen, central Spitsbergen, Norway. Nor. J. Geol. 99, 349–376. doi:10.17850/njg007
Olaussen, S., Grundvåg, S.-A., Senger, K., Anell, I., Betlem, P., Birchall, T., et al. (2022). The svalbard carboniferous to cenozoic composite tectono-stratigraphic element, 57. London: Geological Society. Memoirs. doi:10.1144/m57-2021-36
Panieri, G., Bünz, S., Fornari, D. J., Escartin, J., Serov, P., Jansson, P., et al. (2017). An integrated view of the methane system in the pockmarks at Vestnesa Ridge, 79°N. Mar. Geol. 390, 282–300. doi:10.1016/j.margeo.2017.06.006
Rismyhr, B., Bjærke, T., Olaussen, S., Mulrooney, M. J., and Senger, K. (2019). Facies, palynostratigraphy and sequence stratigraphy of the Wilhelmøya subgroup (upper triassic–middle jurassic) in western central spitsbergen, svalbard. Nor. J. Geol. 99, 189–218. doi:10.17850/njg001
Roy, S., Senger, K., Braathen, A., Noormets, R., Hovland, M., Olaussen, S., et al. (2014). BDNF mediated activity dependent maturation of visual Wulst following prenatal repetitive auditory stimulation at a critical developmental period in domestic chicks (Gallus domesticus). Nor. Geol. Tidsskr. 94, 99–108. doi:10.1016/j.brainresbull.2014.10.003
Roy, S., Hovland, M., Noormets, R., and Olaussen, S. (2015). Seepage in isfjorden and its tributary fjords, West Spitsbergen. Mar. Geol. 363, 146–159. doi:10.1016/j.margeo.2015.02.003
Roy, S., Hovland, M., and Braathen, A. (2016). Evidence of fluid seepage in Grønfjorden, Spitsbergen: Implications from an integrated acoustic study of seafloor morphology, marine sediments and tectonics. Mar. Geol. 380, 67–78. doi:10.1016/j.margeo.2016.07.002
Roy, S., Senger, K., Hovland, M., Römer, M., and Braathen, A. (2019). Geological controls on shallow gas distribution and seafloor seepage in an Arctic fjord of Spitsbergen, Norway. Mar. Pet. Geol. 107, 237–254. doi:10.1016/j.marpetgeo.2019.05.021
Sahling, H., Römer, M., Pape, T., Bergès, B., dos Santos Fereirra, C., Boelmann, J., et al. (2014). Gas emissions at the continental margin west of Svalbard: Mapping, sampling, and quantification. Biogeosciences 11, 6029–6046. doi:10.5194/bg-11-6029-2014
Sauer, S., Hong, W. L., Yao, H., Lepland, A., Klug, M., Eichinger, F., et al. (2021). Methane transport and sources in an Arctic deep-water cold seep offshore NW Svalbard (Vestnesa Ridge, 79°N). Deep Sea Res.167, 103430. doi:10.1016/j.dsr.2020.103430
Saunois, M., Stavert, R. A., Poulter, B., Bousquet, P., Canadell, J. G., Jackson, B., et al. (2020). The global methane budget 2000-2017. Earth Syst. Sci. Data 12, 1561–1623. doi:10.5194/essd-12-1561-2020
Schmale, O., Greinert, J., and Rehder, G. (2005). Methane emission from high-intensity marine gas seeps in the Black Sea into the atmosphere. Geophys Res. Lett. 32, 1–4. doi:10.1029/2004GL021138
Senger, K., and Galland, O. (2022). Stratigraphic and spatial extent of HALIP magmatism in central spitsbergen. Geochem. Geophys. Geosyst. 23. doi:10.1029/2021GC010300
Senger, K., Roy, S., Braathen, A., Buckley, S. J., Bælum, K., Gernigon, L., et al. (2013). Geometries of doleritic intrusions in central spitsbergen, svalbard: An integrated study of an onshore-offshore magmatic province with implications for CO2 sequestration. Nor. J. Geol. Available at: https://core.ac.uk/download/pdf/30908485.pdf 93, 143–166.
Senger, K., Brugmans, P., Grundvåg, S. A., Jochmann, M., Nøttvedt, A., Olaussen, S., et al. (2019). Petroleum, coal and research drilling onshore svalbard: A historical perspective. Nor. J. Geol. 99, 1–30. doi:10.17850/njg99-3-1
Shindell, D. T., Faluvegi, G., Koch, D. M., Schmidt, G. A., Unger, N., and Bauer, S. E. (2009). Improved attribution of climate forcing to emissions. Sci. Rep. 326, 716–718. doi:10.1126/science.1174760
Skogseth, R., Olivier, L. L. A., Nilsen, F., Falck, E., Fraser, N., Tverberg, V., et al. (2020). Variability and decadal trends in the Isfjorden (Svalbard) ocean climate and circulation – an indicator for climate change in the European Arctic. Prog. Oceanogr. 187, 102394. doi:10.1016/j.pocean.2020.102394
Smyrak-Sikora, A., Nicolaisen, J. B., Braathen, A., Johannessen, E. P., Olaussen, S., and Stemmerik, L. (2021). Impact of growth faults on mixed siliciclastic-carbonate-evaporite deposits during rift climax and reorganisation—Billefjorden Trough, svalbard, Norway. Basin Res. 33, 2643–2674. doi:10.1111/bre.12578
Sorento, T., Olaussen, S., and Stemmerik, L. (2020). Controls on deposition of shallow marine carbonates and evaporites – lower Permian Gipshuken Formation, central Spitsbergen, Arctic Norway. Sedimentology 67, 207–238. doi:10.1111/sed.12640
Steel, R. J., and Worsley, D. (1984). “Svalbard’s post-caledonian strata — An atlas of sedimentational patterns and palaeogeographic evolution,” in Petroleum geology of the North European margin (Dordrecht: Springer Netherlands), 109–135. doi:10.1007/978-94-009-5626-1_9
Stemmerik, L. (2008). “Influence of late paleozoic gondwana glaciations on the depositional evolution of the northern pangean shelf, north Greenland, svalbard, and the Barents Sea,” in Resolving the late paleozoic ice age in time and space, 205–217.
Stocker, T. F., Qin, D., Plattner, G.-K., Tignor, M. M. B., Allen, S. K., Boschung, J., et al. (2013). Climate change 2013: The physical science basis Cambridge University press.
Teyssier, C., Kleinspehn, K., and Pershing, J. (1995). Analysis of fault populations in Western Spitsbergen: Implications for deformation partitioning along transform margins.
Uguna, J. O., Carr, A. D., Marshall, C., Large, D. J., Meredith, W., Jochmann, M., et al. (2017). Improving spatial predictability of petroleum resources within the central tertiary basin, spitsbergen: A geochemical and petrographic study of coals from the eastern and Western coalfields. Int. J. Coal Geol. 179, 278–294. doi:10.1016/j.coal.2017.06.007
Van Koeverden, J. H., Karlsen, D. A., and Backer-Owe, K. (2011). Carboniferous non-marine source rocks from spitsbergen and bjørnøya: Comparison with the Western arctic. J. Pet. Geol. 34(1), 53–66. doi:10.1111/j.1747-5457.2011.00493.x
Weniger, P., Blumenberg, M., and Kus, J. (2019). “Thermal maturity of Paleocene coal from Svalbard - influence of citrinite refletance suppression,” in 29 th International Meeting on Organic Geochemistry (IMOG).
Wesenlund, F., Grundvåg, S. A., Engelschiøn, V. S., Thießen, O., and Pedersen, J. H. (2021). Linking facies variations, organic carbon richness and bulk bitumen content – a case study of the organic-rich Middle Triassic shales from eastern Svalbard. Mar. Pet. Geol. 132, 105168. doi:10.1016/j.marpetgeo.2021.105168
Wesenlund, F., Grundvåg, S. A., Engelschiøn, V. S., Thießen, O., and Pedersen, J. H. (2022). Multi-elemental chemostratigraphy of Triassic mudstones in eastern Svalbard: Implications for source rock formation in front of the World’s largest delta plain. Depositional Rec. 8, 718–753. doi:10.1002/dep2.182
Westbrook, G. K., Thatcher, K. E., Rohling, E. J., Piotrowski, A. M., Pälike, H., Osborne, A. H., et al. (2009). Escape of methane gas from the seabed along the West Spitsbergen continental margin. Geophys Res. Lett. 36. doi:10.1029/2009GL039191
Winkelmann, D., and Knies, J. (2005). Recent distribution and accumulation of organic carbon on the continental margin west off Spitsbergen. Geochem. Geophys. Geosyst. 6. doi:10.1029/2005GC000916
Worsley, D., Aga, O. J., Dalland, A., Elverhøi, A., and Thon, A. (1986). “Evolution of an arctic archipelago,” in The geological history of svalbard (Stavanger, Norway: Den norske stats oljeselskap as), 121.
Keywords: gas seepage, gas flares, hydrocarbon sources, hydroacoustic mapping, water column anomalies, Arctic fjord systems, Svalbard archipelago
Citation: Rodes N, Betlem P, Senger K, Römer M, Hodson A, Liira M, Birchall T, Roy S, Noormets R, Smyrak-Sikora A, Olaussen S and Bohrmann G (2023) Active gas seepage in western Spitsbergen fjords, Svalbard archipelago: spatial extent and geological controls. Front. Earth Sci. 11:1173477. doi: 10.3389/feart.2023.1173477
Received: 24 February 2023; Accepted: 09 June 2023;
Published: 20 June 2023.
Edited by:
Jochen Knies, Geological Survey of Norway, NorwayReviewed by:
Shyam Chand, Geological Survey of Norway, NorwayCopyright © 2023 Rodes, Betlem, Senger, Römer, Hodson, Liira, Birchall, Roy, Noormets, Smyrak-Sikora, Olaussen and Bohrmann. This is an open-access article distributed under the terms of the Creative Commons Attribution License (CC BY). The use, distribution or reproduction in other forums is permitted, provided the original author(s) and the copyright owner(s) are credited and that the original publication in this journal is cited, in accordance with accepted academic practice. No use, distribution or reproduction is permitted which does not comply with these terms.
*Correspondence: Nil Rodes, bmlscm9kZXNAeWFob28uY29t
Disclaimer: All claims expressed in this article are solely those of the authors and do not necessarily represent those of their affiliated organizations, or those of the publisher, the editors and the reviewers. Any product that may be evaluated in this article or claim that may be made by its manufacturer is not guaranteed or endorsed by the publisher.
Research integrity at Frontiers
Learn more about the work of our research integrity team to safeguard the quality of each article we publish.