
94% of researchers rate our articles as excellent or good
Learn more about the work of our research integrity team to safeguard the quality of each article we publish.
Find out more
ORIGINAL RESEARCH article
Front. Earth Sci., 20 July 2023
Sec. Geochemistry
Volume 11 - 2023 | https://doi.org/10.3389/feart.2023.1172643
This article is part of the Research TopicVolcanic and Tectonic Degassing: Fluid Origin, Transport and ImplicationsView all 11 articles
 Antonio Caracausi1Marco Camarda1
 Lauro Chiaraluce2
 Sofia De Gregorio1*Rocco Favara1Antonino Pisciotta1
Static and dynamic stress, along with earthquakes, can trigger the emission and migration of crustal fluids, as frequently observed on the surface and within the upper crust of tectonically active areas such as the northern Apennines of Italy. To investigate the origin of these fluids and their interconnection with the seismogenic process, we complemented The Alto Tiberina Near Fault Observatory (TABOO-NFO), a multidisciplinary monitoring infrastructure composed of a dense array of seismic, geodetic, strain, and radon sensors, with a proper geochemical network grounded on four soil CO2 flux monitoring stations and weather sensors, placed near the main vents of the superficial manifestations. The TABOO-NFO is a state-of-the-art monitoring infrastructure, which allows for studying various geophysical parameters connected to the deformation processes active along a crustal fault system dominated by the Alto Tiberina fault (ATF), which is a 60 km long normal fault dipping at a low angle (<15°–20°). The region is favourable for conducting geochemical studies, as it is characterised by the presence of over-pressurised fluids trapped at certain depths and superficial manifestations associated with the emission of large quantities of fluids. After describing the theoretical framework and the technological aspects based on which we developed the geochemical monitoring network, we described the data recorded in the first months. Over the studied period, the results showed that soil CO2 flux was primarily influenced by environmental parameters, and that the selected sites received a regular supply of deep-origin CO2.
Crustal faults are complex natural systems whose mechanical properties change over time. Hence, understanding multi-scale chemical-physical processes, which control rock deformation, faulting, and seismicity, requires the examination of processes at the boundaries between different research fields, and the availability of multidisciplinary long-term series of data. To fulfil this aim, the Italian National Institute of Geophysics and Vulcanology created The Alto Tiberina Near Fault Observatory (TABOO-NFO) (Chiaraluce et al., 2014) located in the upper Tiber Valley within the inner sector of the northern Apennines (Italy). TABOO continuously monitors at a high rate and resolution a relatively small and actively deforming area (120 km × 120 km) using state-of-the-art geophysical networks comprising multidisciplinary instruments (Chiaraluce et al., 2014). Specifically, TABOO focuses on investigating preparatory processes, slow and fast deformations along a fault system, dominated by a 60 km long low-angle normal fault (Alto Tiberina fault, ATF), active since the Quaternary. The region is characterised by high-pressure fluids (mainly CO2) at a certain depth (Chiodini and Cioni, 1989; Chiodini et al., 2004) and very high flux of CO2 emissions (up to 5,800 t/yr) on the surface in the absence of any evidence of active volcanism (Italiano et al., 2009; Burton et al., 2013). The ATF strongly influences the redistribution of CO2-rich emissions and represents a key pathway for gas transfers from regions deep below the surface to the surface (e.g., Chiodini et al., 2000; 2004; Collettini et al., 2008). Indeed, the ATF crosscuts the entire upper crust, showing continuous microseismic events from 15 km to 4 km below the surface (Chiaraluce et al., 2007; Valoroso et al., 2017). Regarding this aspect, several studies have shown that tectonic stress can influence the circulation of crustal fluid, generating detectable changes in the superficial fluid discharge (Horálek and Fischer, 2008; Wang and Manga, 2010; De Gregorio et al., 2012; Carapezza et al., 2018; Martinelli et al., 2021; Liu et al., 2022). Several studies have extensively investigated the relationships between fluid circulation and tectonic stress in the West Bohemia-Vogtland district, a natural laboratory that displays frequent earthquake swarms and anomalous fluid emissions (Weinlich et al., 2006; Bräuer et al., 2008; Bräuer et al., 2009; Faber et al., 2009; Weinlich et al., 2013; Fischer et al., 2014; Fischer et al., 2017; Fischer et al., 2020). Also, in Central Italy, the relationships between fluid circulation and tectonic stress were comprehensively examined in the last decade by conducting dedicated geochemical investigations at the regional and local scales, searching for the key elements describing fluid circulation processes and variations in the chemical composition of gases and solids dissolved in cold and thermal groundwater (Heinicke et al., 2000; Italiano et al., 2004; Caracausi et al., 2005; Heinicke et al., 2006; Italiano et al., 2009; Bonfanti et al., 2012; Chiodini et al., 2020; Martinelli et al., 2020; Di Luccio et al., 2022). The relationship between tectonic stress and fluid circulation is not completely constrained. According to Sibson (1994) and Miller et al. (2004), tectonic stress can modify the properties of rocks, such as porosity, permeability, and pore fluid pressure. Buttitta et al. (2020) showed that micro-fracturation due to the stress field generated by the local seismicity can increase the release of volatiles stored in the rocky matrix. The flow of fluids into fault zones can trigger two main types of weakening mechanisms that operate over different timescales and facilitate the movement of faults by reducing the shear stress or frictional resistance to slip. Crustal fluids can be trapped by low-permeability mature fault zone seals or stratigraphic barriers (Yang et al., 2021). Doglioni et al. (2014) inferred that crustal fluids flow can be controlled by the formation of dilated or over-compressed bands along active fault zones and that tectonic-related fluids anomalies recorded at surface depend on the tectonic style and the stage of the seismic cycle (interseismic, pre-seismic, co-seismic, and post-seismic). Besides undergoing the influence of tectonic stress acting in the crust, fluids can play an active role in seismogenic processes since an increase in fluid pore pressure can induce seismicity via a decrease in the shear strength of the faults (Sibson, 1994; Hickman et al., 1995; Miller et al., 2004). Specifically for Apennine earthquakes, fluid over-pressure is a key triggering mechanism (Chiodini et al., 2004; Miller et al., 2004; Antonioli et al., 2005; Collettini et al., 2008; Di Luccio et al., 2022). In this framework, the area of the ATF represents a natural laboratory to investigate the relationship between soil CO2 flux variations and tectonic crustal stress. To realise this aim, within TABOO-NFO, we established a network of four stations to continuously monitor the soil CO2 flux at the sites of CO2-rich gas emissions. In this study, we described the characteristics of monitoring stations, the criteria, and the investigations conducted to select the monitoring sites, and finally, we discussed the data acquired during the first 5 months of monitoring.
The northern Apennines consist of a complex pattern of thrusts, folds, and normal faults, which reflect the superposition of several tectonic phases. The last two phases consist of a compressional phase during upper Miocene-lower Pleistocene, generating N-NE verging thrusts and folds, and a Quaternary extensional phase, forming intermountain basins bounded by NW-SE trending normal faults and offsetting earlier structures (Barchi et al., 1998; Boncio et al., 2000; Collettini and Barchi, 2002; Pauselli et al., 2006). The ATF is found in this region and represents the youngest and eastern expression of crustal extension in the northern Apennines. It is located in the inner sector of the Umbria-Marche Apennines, where an extensional stress field is currently active (Barchi et al., 1998; Boncio et al., 2000; Collettini and Barchi, 2002; Pauselli et al., 2006). The ATF is a 60 km long NNW-trending low-angle normal fault (LANF) dipping toward the ENE (Chiaraluce et al., 2007) (Figure 1). It has accumulated a minimum time-averaged long-term slip rate of about 1–3 mm/year in the last two million years without large historical events unambiguously associated with this fault (Chiaraluce et al., 2007; Mirabella et al., 2011; Latorre et al., 2016). More seismic reflection profiles provided by the CROP03-NVR data (Crosta Profonda Project Near Vertical Reflection) showed that in the northern Apennines, the extension is mainly accommodated by a system of east-dipping LANF with associated high-angle antithetic structures (Figure 2A) (Pialli et al., 1998). From a seismological perspective, the ATF is characterised by an active hanging wall block and an aseismic footwall. In the hanging wall block, seismic reflection profiles and seismological data showed that moderately to steeply synthetic and antithetic structures were present (Chiaraluce et al., 2007; De Luca et al., 2009; Valoroso et al., 2017). Micro-earthquakes (ML < 2.5) continuously nucleate along the ATF plane, whereas the higher angle synthetic and antithetic structures located within the hanging wall block usually generate seismic sequences led by events of relatively larger (ML < 3.7) magnitudes (Chiaraluce et al., 2007). Vuan et al. (2020) systematically investigated the seismicity patterns and concluded that a source of overpressurised fluids was present in the fault footwall. This inference matched with those of previous studies on seismicity patterns characterizing the main seismic sequences that occurred in this sector of the Apennines that found that fluid overpressure can promote the generation of prolonged aftershock sequences (Miller et al., 2004; Antonioli et al., 2005; Collettini et al., 2008; Chiarabba et al., 2009). The presence of deep-seated CO2 reservoirs along the ATF is confirmed by the data on two deep boreholes drilled in the area (Figure 2B). Specifically, the S. Donato borehole placed about 20 km NW of the town of Perugia encountered an overpressure of 99 MPa at depths of 4,700 m and the Pieve S. Stefano borehole encountered CO2 overpressure of about 67 MPa at depths of 3,700 m (Chiodini and Cioni, 1989). This area has deep CO2-rich fluids and a complex structural arrangement of faults (Figure 2C). In this scenario, the fluids along the pathway that rise to the surface can be entrapped when encountering stratigraphic or structural seals (Collettini and Barchi, 2002; Chiodini et al., 2004). In geological traps, the continuous input of CO2 leads to the formation of CO2 reservoirs. The gases tend to escape from the overpressurised reservoirs via low-permeability zones mainly placed along tectonic discontinuities present in the upper crust, generating numerous surface manifestations consisting of cold CO2-rich gas seepages (Minissale et al., 2000; Chiodini et al., 2000; Rogie et al., 2000; Chiodini et al., 2004; Minissale, 2004; Italiano et al., 2009; Trippetta et al., 2013). Though, CO2-rich seepage sites and CO2 trapped at depth were placed only on the western side of the Tiber River (e.g., S. Donato and Pieve Santo Stefano wells), whereas no CO2-rich seepage sites were found on the eastern side. Furthermore, in a deep borehole drilled on the eastern side of the Tiber River, Montecivitello (Figure 2B), no CO2 trapped at depth was encountered (Trippetta et al., 2013). According to Trippetta et al. (2013) the key parameters driving CO2 trapping are: the distance from the deep CO2 source and the structural setting. In particular, the western side of the Tiber River is closer to the deep CO2-degassing area outlined by Chiodini et al. (2004). Further, on the western side the formation trapping the CO2, i.e., the Triassic Evaporites of the Burano Fm.(TE) is placed in the footwall of the ATF (Figure 2C) and the maximum fault displacement, on the order of 10 km is observed (Mirabella et al., 2011). Conversely, on the eastern side, the TE is located in the hanging wall of both the ATF and its major antithetic (i.e., Gubbio fault, Figure 2C) (Trippetta et al., 2013).
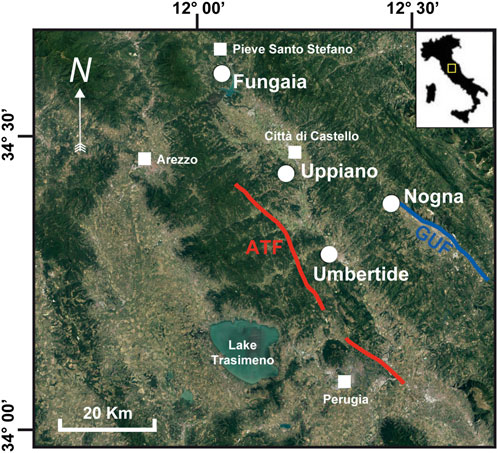
FIGURE 1. A Google Earth satellite image of the investigated area is shown with the Alto Tiberina Fault (ATF), GUF (Gubbio Fault) and the four monitoring sites at Fungaia, Uppiano, Umbertide, and Nogna.
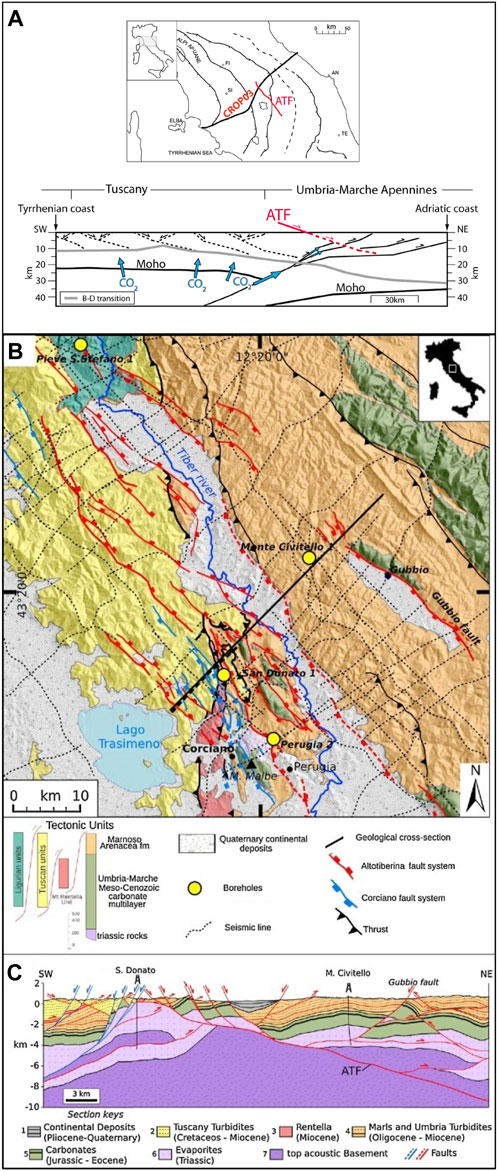
FIGURE 2. (A) Cross-section, based on the CROP03 deep seismic reflection profile (after Barchi et al., 1998), modified from Trippetta et al. (2013) and Collettini and Barchi, (2002) and conceptual model of deep CO2 degassing from Chiodini et al. (2004; 2011). (B) Geological sketch of the study area and (C) geological section showing the depth geometries of the structures (modified from Trippetta et al. (2013) and Mirabella et al. (2011).
The origin of fluids emitted in the seepage sites of the northern Apennines is a widely debated topic due to the lack of the presence of unique and consistent isotopic markers. The isotopic composition of CO2 emitted in seepage sites displays a wide range of δ13C values ranging from 1.5 to −6.1‰ (Chiodini et al., 2004; Collettini et al., 2008), and helium isotopic compositions range from 0.019 R/Ra to 1.5 R/Ra (where R is the 3He/4H ratio in the sample and Ra is the air 3He/4H ratio). These values do not correspond to a pure mantellic marker, but point out also a crustal contribution. Many of the superficial manifestations linked to fluid emission (seepage sites) are located along the Tiber Valley, which runs parallel to the east (e.g., hanging wall) of the ATF breakaway zone. Thus, both the periodic monitoring of the variations in chemical and isotopic composition of fluids emitted from main vents of seepage sites and the high-frequency acquisition of the soil CO2 flux emitted around them, are important issues that need further investigation. Through the periodic monitoring of the chemical and isotopic composition of gases emitted in main vents of seepage sites the origin of the emitted fluids can be evaluated. Whereas, using contemporaneous high-frequency (hourly) monitoring of soil CO2 flux emitted around the main vents the acquired data can be compared with high-frequency geophysical data (e.g., seismic, geodetic) to investigate possible relationships. Thus, the contemporary record of high-frequency geophysical and geochemical parameters, along with the periodic acquisition of more detailed geochemical data in the seismogenic area, is the key to building conceptual models that can describe the relationship between fluid emission seismicity patterns and faulting. These relationships might help to better understand the preparatory processes of earthquakes, including the identification of seismic precursors (e.g., transient signals detected almost regularly before the occurrence of relatively larger seismic events).
The seepage sites along the Tiber Valley generally consist of areas of high fluid discharge with dry vents and muddy water pools with bubbling gas (Minissale et al., 2000; Chiodini et al., 2004; Minissale, 2004; Heinicke et al., 2006) (Supplementary Video S1). The site selection process within the TABOO area starts with the accurate geochemical characterisation of fluids emitted by the main vents of seepage sites. It is the fundamental requirement for any study that aims to investigate the relationships between fluid variations and crustal stress changes. We selected fluid seepage sites along the ATF (Figure 1), which we sampled periodically to collect the emitted fluids for analysing the chemical and isotopic composition. Among the selected sites, we identified four sites where the fluids were released not only through the main vents but also via the surrounding soil. Depending on the superficial geological, morphological, and lithological features, deep-seated CO2 might be released through the soil near the main vents. We adopted this strategy because, in case of an increase in fluid pressure at a certain depth, the disposal of gases can increase not only in the main vents but also along the soil. In this framework, monitoring the soil CO2 flux is a valid proxy to detect changes in the rate of fluid emissions. However, the variations recorded in soil CO2 flux must always be compared to the chemical and isotopic variation of fluids emitted by the main vents to better frame and understand the ongoing processes. The four sites are located far from each other and covered a distance of 50 km, almost covering the whole ATF (Figure 1). The northernmost site (Fungaia) is located 4 km southwest of the Pieve Santo Stefano village on the northern flank of Mt. Fungaia. The anomalous emission area covers a surface of about 1 km2, and the main vent is a muddy pool with vigorous bubbling gas (Figure 3A; Supplementary Video S1). About 1.5 km westward to Fungaia, a group of CO2-rich vents is located, known as Caprese Michelangelo (Vaselli et al., 1997; Minissale, 2004). Heinicke et al. (2006) reported anomalous fluid expulsion triggered by fluid redistribution and induced by local seismic activity in Caprese Michelangelo. For this area, detailed studies on structural control on seepage sites distributions pointed out as the main venting centers are located along a transverse system of steep faults associated with the Arbia-Val Marecchia Line (AVML) (Supplementary Figure S1) (Bonini, 2009). In addition, Bicocchi et al. (2013) suggested that Caprese Antiform acted as the main structural control on the main fluid reservoir of Caprese Michelangelo, and steep transverse faults pertaining to AVML are pathways connecting the Caprese Reservoir with the Mt. Fungaia gas seepage sites. The second site (Uppiano) is located north of Citta di Castello near the small town of Uppiano. The site consists of ferruginous bubbling pools generated by the outpouring of several springs with different chemical characteristics (Figure 3B) with a mean water temperature of 22°C. The third site (Umbertide) is located near the town of Umbertide. Unlike the other two sites, this is a man-made manifestation, indeed the seepage site was created during drilling for hydrocarbon exploration up to a depth of about 4,800 m. The site includes a semi-circular depression about 6 m deep and 15 m in diameter. A muddy water pool with vigorous bubbling gases is found at the bottom of the depression (Figure 3C). The water temperature is around 13°C, and the venting gas had a flow rate of about 16 t d−1 (Rogie et al., 2000). The last site (Nogna) is located 10 km northeast of Gubbio and consists of an artesian well with bubbling gases.
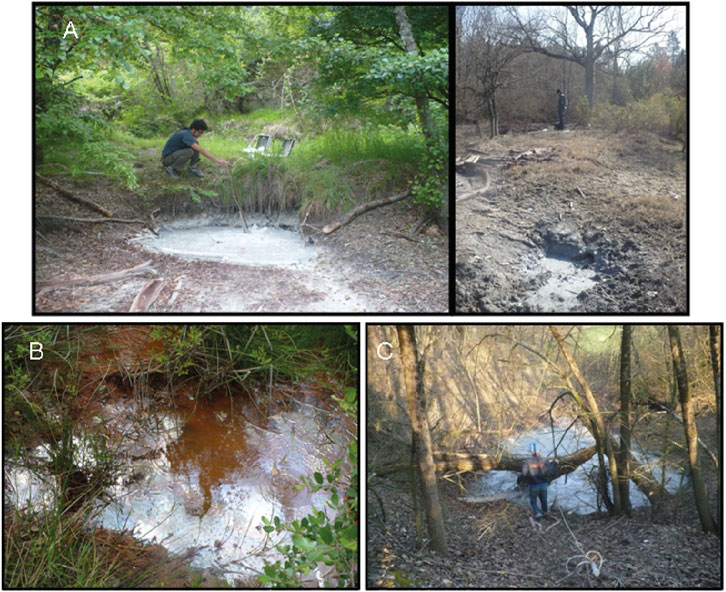
FIGURE 3. The main vents of three high CO2 discharging sites are: (A) Fungaia; (B) Uppiano; (C) Umbertide. The stations were located around the main vents.
The chemical and isotopic composition of the collected gases is reported in Table 1. Carbon dioxide was the main component in the three sites (Table 1), whereas methane dominated the emission in Nogna. The sites in Fungaia and Umbertide had a similar chemical composition with the highest CO2 concentration (>90%) and very low concentrations of CH4 (<0.3%), N2 (5%), and He (<40 ppm). Uppiano had a slightly lower CO2 concentration (82%) along with higher concentrations of CH4 (5%), N2 (21%), and He (>300 ppm). Enrichment in less soluble gases relative to CO2 was partially due to the scrubbing processes during the rise of fluids toward the surface. The emission of fluids in Uppiano was characterised by a significantly lower emission rate relative to that in Fungaia and Umbertide. A lower emission rate allows wider water-gas interactions, which promotes the scrubbing of more soluble gases. However, the carbon isotopic composition of CO2 in the three sites was slightly variable and had a δ13C range between −3.4‰ and −4.8‰. Similarly, the helium isotopic composition had a narrow range of 0.026–0.019 R/Ra. Finally, in Nogna, the CH4 concentration was >90%, and the CO2 concentration and δ13C values were the lowest (0.5% and −12.1‰, respectively). The R/Ra value of Nogna, although slightly lower, was similar to that of other sites (R/Ra =0.013). The chemical and isotopic composition of bubbling gases supported the deep origin of fluids emitted in the selected sites. Additionally, the low O2 concentrations and the high 4He/20Ne ratios in all the analysed gas samples indicated that these gases had low air contamination.
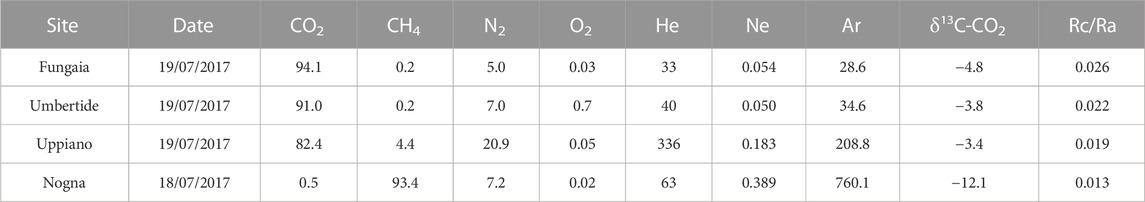
TABLE 1. Chemical and isotopic composition of bubbling gases emitted in the selected sites. CO2, CH4, N2 and O2 concentrations expressed in vol%,: He, Ne, Ar in ppm. Carbon isotope ratios (δ13C-CO2) are expressed as δ‰ units vs. V-PDB. All the measured 3He/4He ratios are expressed as Rc/Ra units and normalized to the atmospheric ratio [Ra= 1.38 10−6 (Ozima and Podosek, 2002)]. Rc/Ra is the R/Ra value corrected for air component.
The monitoring stations (Figure 4A) were designed and developed by the INGV staff following the methodology proposed by Camarda et al. (2016). Each station (Figure 4B) had a data logger with an on-board programmable real-time clock, an electronic circuit board for signal and power supply input (input module), a GSM modem for telemetry, a CO2 Infrared Gas Analyser (IRGA; NG Gascard, manufactured by Edinburgh Gas Sensors, accuracy 2% full scale 0%–10% vol. or 0%–100% vol., depending on the site), and a pneumatic module consisting of a pump, an electrovalve, and a fluxmeter. The power supply was provided by a solar panel, a charge controller, and a battery. The stations acquired hourly data on the soil CO2 flux and main environmental parameters and transmitted the recorded data to the INGV acquisition centre daily.
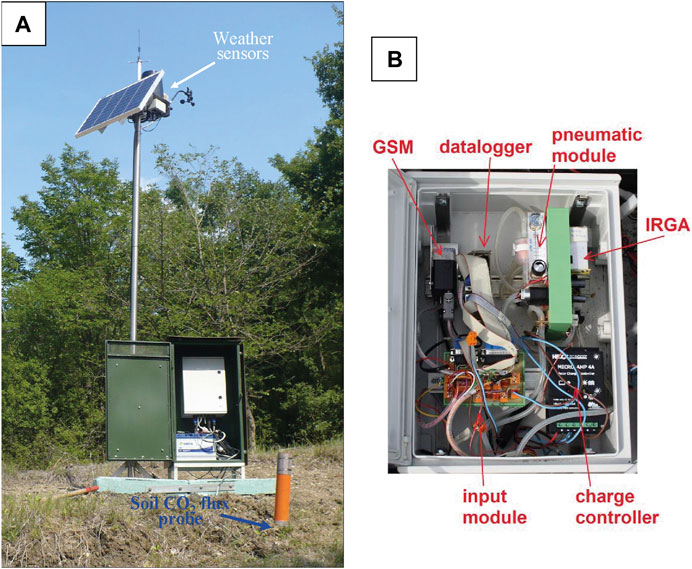
FIGURE 4. Monitoring station. (A) The arrangement of the monitoring station: the orange tube is the upper part of the soil CO2 measurement probe, and the lower part of the probe was inserted 50 cm into the soil. The green case had a watertight box carrying the electronic devices and the battery. The weather sensors and solar panels were installed on top of the steel pool. (B) The details of the inner part of the station with the layout of the main components.
The soil CO2 flux was measured by using the dynamic concentration method (Camarda et al., 2006). Using this method, the CO2 concentration was measured in a mixture of air and soil gas generated in a specially designed probe, which was inserted 50 cm below the soil surface. The gas mixture was obtained by producing a very small negative pressure in the probe using a pump at constant flux. The concentration of CO2 in the mixture was determined by using the IRGA. After keeping the pump on for a certain time (generally less than 1 min), the gas mixture reached a constant CO2 concentration, known as the dynamic concentration, which is proportional to the soil CO2 flux. The relationship used to calculate the CO2 flux from dynamic concentration values was determined in the laboratory by measuring the dynamic concentration several times in a soil layer that had known and constant values of CO2 flux (Camarda et al., 2006). Four soil samples with air permeability ranging from 0.36 to 123 μm2 were examined; such a wide range adequately represented the range of permeability values normally found in the soil.
The emission of gases from the soil is strongly influenced by environmental parameters, such as atmospheric pressure, air temperature, and precipitation (Granieri et al., 2003; Viveiros et al., 2009; De Gregorio et al., 2013; Laiolo et al., 2016; Camarda et al., 2019). These factors can directly modulate the CO2 emission generating forced flux and also modulate indirectly by inducing changes in the physical characteristics of the soil such as diffusion coefficient, permeability, and soil volumetric water content (VWC). Information on these parameters is hence required to adequately filter the signal of soil CO2 flux. Thus, the soil CO2 flux stations were equipped with sensors for measuring the atmospheric parameters and soil characteristics. Weather sensors were placed at the top of a steel pool close to the station to measure the air temperature, atmospheric pressure, and precipitation (Figure 4A). To directly measure soil proprieties, a sensor for measuring the soil VWC was inserted 50 cm below the soil surface.
Soil gases were sampled at a depth of 50 cm using a Teflon tube (5 mm in diameter) connected to a syringe. Then, the gas was stored in glass flasks equipped with vacuum stopcocks. The isotopic composition of carbon in the collected CO2 was measured using a Finnigan Mat Delta Plus Mass Spectrometer. The isotopic values were expressed as δ13C in per mill relative to the Vienna Pee Dee Belemnite (V-PDB) standard; the uncertainty was ±0.2‰.
Whether each monitoring station was working properly was checked by analysing daily data; any errors were noted to arrange maintenance interventions in advance. Field maintenance campaigns were periodically performed to repair the detected faults. Maintenance included specific tests to verify the functionality of all the pneumatic components and the IRGA. To test whether the IRGA was working properly, an independent measurement of the soil CO2 flux was performed each time using a portable IRGA. Then, the value of CO2 flux was compared with the flux value acquired by the station.
In the selected seepage sites, CO2 was released not only through the main vents but also via the surrounding soil. The selection of the soil CO2 flux monitoring site is important for recording variations linked to changes in the crustal stress and the associated deformations. A basic requirement is that the site must receive a deep supply of CO2. Generally, in the soil, CO2 is produced by superficial organic processes, such as microbial decomposition of soil organic matter and root respiration. A deep supply of CO2 is recorded in soils located in areas undergoing tectonic and volcanic activity (Burton et al., 2013; Camarda et al., 2019; Di Martino et al., 2020). Deep-origin CO2 can derive directly from the mantle, by the exsolution from a magmatic rising body, via the decarbonation of crustal limestone and from deep-seated sediments rich in organic matter (Chiodini et al., 2004; Lee et al., 2016; Camarda et al., 2020). The deep-origin gases, such as CO2 and He, migrate to the surface preferentially through faults and high permeability zones (McCaig, 1989; Rowland and Sibson, 2004; Caracausi et al., 2013; Cui et al., 2019; Yang et al., 2021). Thus, they are particularly sensitive to crustal stress changes and also to processes acting within the crust, in general.
The soil CO2 flux values ascribable to the CO2 of organic origin are known, and several studies reported values, ranging from 0.2 to 21 g m−2 d−1, for various ecosystems (Raich and Schlesinger, 1992; Raich and Tufekcioglu, 2000). Hence, to detect a deep supply component, it is usually used a threshold value that exceeded the value generally recorded in various ecosystems, i.e., 21 g m−2 d−1 (Raich and Schlesinger, 1992; Raich and Tufekcioglu, 2000).
In certain situations, however, sites with typical CO2 values of biogenic origin might also receive a deep CO2 supply during the anomalous release of fluid linked to crustal transients (Camarda et al., 2019). Hence, these sites are the most sensitive ones for recording deep-origin soil CO2 flux variations. However, these sites are quite difficult to identify because the process requires conducting several soil CO2 surveys over time, and at least one survey must be performed during an anomaly emission (Camarda et al., 2019). However, since such data were unavailable for the selected areas, we started selecting sites by identifying those with soil CO2 flux values above the organic origin threshold. For selecting the monitoring site, besides a minimum threshold value, it is important to be careful with very high values of soil CO2 flux. A high value of the soil CO2 flux implies a stronger influence of atmospheric and soil parameters (e.g., permeability and VWC) (De Gregorio et al., 2013; Camarda et al., 2019). Therefore, in sites with high soil CO2 flux, temporal records showed large variations associated with environmental parameters. However, although such variations can be removed through a careful data filtering process, the variation linked to the crustal transient can be easily masked and, therefore, might be more difficult to detect. Thus, regarding the usage of soil CO2 flux values for selecting the best monitoring site, we followed the saying “medio stat virtus” since, as explained above, the more suitable values of soil CO2 flux should neither be too high nor too low.
Another marker for detecting deep CO2 supply is the isotopic composition of the carbon in soil CO2. The CO2 of different origins have a well-defined isotopic signature: CO2 of atmospheric origin has values of δ13C (CO2) of −8‰ (Di Martino and Capasso, 2021); CO2 of organic origin has values of δ13C (CO2) in the range of −30‰ to −24‰ (Hoefs, 1980; O’Leary, 1988); CO2 of deep origin derived directly from the mantle or by the exsolution from the rising magmatic body generally have values between −4‰ and −8‰ (Pineau and Javoy, 1983; Javoy et al., 1986; Taylor, 1986). However, for volcanoes in the Mediterranean region, fewer negative values were reported (Chiodini et al., 2011). CO2 generated via the decarbonation of crustal limestone has the same value as that of the carbonatic basement, and hence, is around or above 0‰.
Another key requirement for the monitoring site is a morphological position, avoiding stagnation or a massive flux of water. While measuring the soil CO2 flux, water might be aspired by a pump and might enter the IRGA, permanently damaging the measuring system.
Based on the above-mentioned considerations, a fundamental step in site selection has to include at least one soil CO2 flux survey in the surrounding location of the main emission vent coupled with isotopic determinations. Accordingly, we conducted several measurements of soil CO2 flux and isotopic determinations in the surrounding area of each manifestation. The maps with the placements of soil CO2 flux measurements, the main vents, and the monitoring stations are shown in Figures 5–7. In every site, the measurement points were asymmetrically distributed relative to the main vents, covering only one side most of the time. We were forced to operate in this way because not all areas around the main vents were accessible for technical and practical reasons.
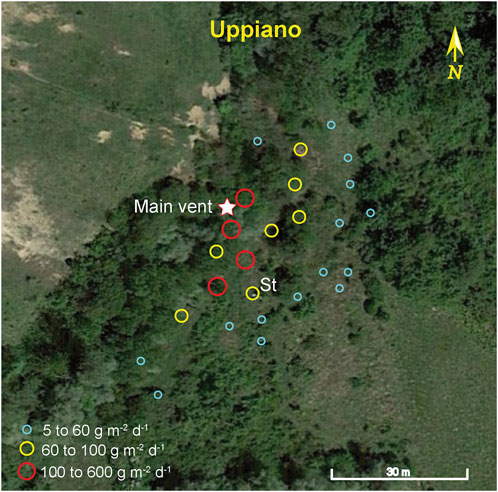
FIGURE 5. A Google Earth satellite image of the site at Uppiano. The location in which the measurements were performed to select the monitoring site with the relative soil CO2 flux values (circles); “St” indicates the site selected for installing the monitoring station. The location of the main vent is shown by the star.
In Uppiano (Figure 5), we performed 28 measurements over an area of about 1 km2. The soil CO2 flux varied from 5 to 570 g m−2 d−1. The sites with the highest values (red dots in Figure 5) were placed closer to the main flow line, i.e., the preferential drainage area of the water. As discussed above, an area with such features is unsuitable for continuous monitoring purposes. Hence, we selected a site with a lower soil CO2 flux value, but above the selected organic threshold value (21 g m−2 d−1), located at the highest position. We selected the site for the suitability of its position and because it was the nearest to the highest emission zone. The δ13C value of the carbon of CO2 measured in the selected site was −2.5‰, which indicated a prevalent deep intake of CO2.
In Fungaia, we performed 18 measurements over an area of about 600 m2 (Figure 6) with values between 5 and 4,300 g m−2 d−1. The site with higher flux also had an optimal morphology position since it was located on the apical part of the impluvium, which ensured good drainage of the measuring site (Figure 6). In addition, the selected site is located in a zone away from the treetops, this last feature ensured optimal exposure of the solar panel and efficient recharge of the battery. The value of δ13C was −6.3‰, indicating that this site also had a high deep CO2 component. In Umbertide, the main vent was placed in a wide almost semi-circular depression. Thus, we decided to perform the measurements outside it. The soil CO2 flux values recorded here were lower than those recorded in Fungaia and Uppiano, and they varied between 20 and 180 g m–2 d–1. The highest emission points were located 50 m northwest of the main vent (Figure 7). We selected the site closest to the forest border because, among other reasons, it offered the best sun exposure conditions for the solar panel. For this site, we obtained a δ13C CO2 value equal to −14.4‰. This value was between those of deep-origin CO2 (ranging from 1.5‰ to −6‰) for the area (Chiodini et al., 2004) and those of organic origin CO2 (−24‰), which reflected a mix between these two-end members. Thus, we inferred that this site might be suitable for recording variations in deep CO2 supply.
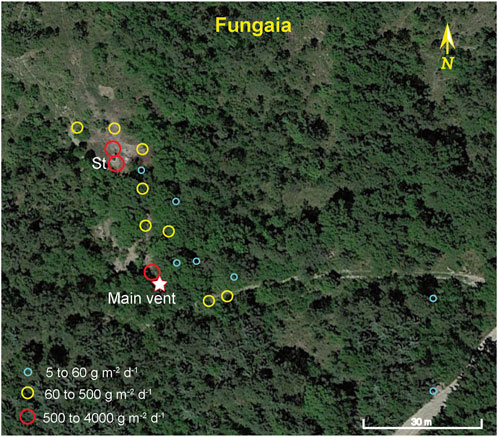
FIGURE 6. A Google Earth satellite image of the site at Fungaia. The location in which the measurements were performed to select the monitoring site with the relative soil CO2 flux values (circles); “St” indicates the site selected for installing the monitoring station. The location of the main vent is shown by the star.
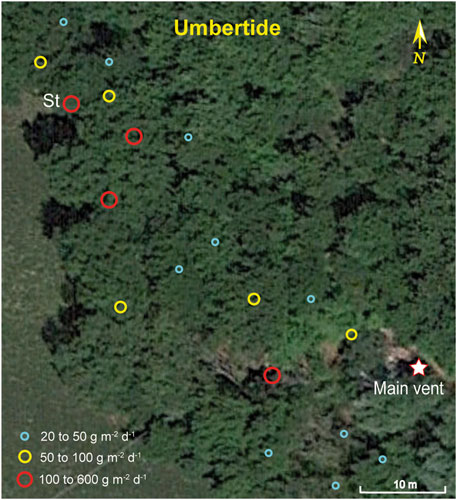
FIGURE 7. A Google Earth satellite image of the site at Umbertide. The location in which the measurements were performed to select the monitoring site with the relative soil CO2 flux values (circles); “St” indicates the site selected for installing the monitoring station. The location of the main vent is shown by the star.
Finally, in Nogna, we performed a few measurements near the well. The soil CO2 flux values were between 10 and 280 g m−2 d−1. We selected a point with a soil CO2 flux of 200 g m−2 d−1 located between the monitoring station and the well. For this site, we obtained the lowest value of δ13C CO2 equal to −20‰. The deep CO2 supply at this site was lower than that in other sites because the main component of the bubbling gas in the well water at this site was methane.
After identifying the most suitable sites, we installed the stations; the stations at Fungaia and Uppiano were installed in June 2015, the station at Umbertide was installed in November 2015, and finally, the station at Nogna was installed in October 2016. As shown in Figure 8, the four soil CO2 flux monitoring stations were well-integrated within the NFO-TABOO infrastructure.
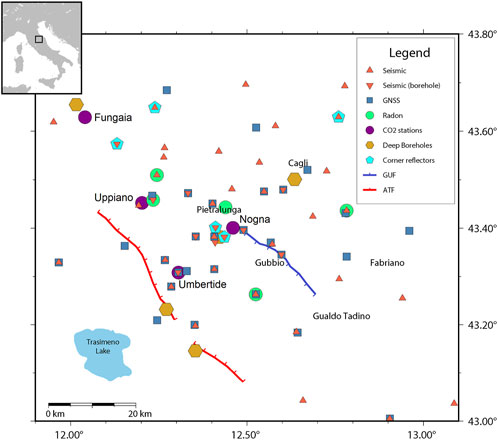
FIGURE 8. The TABOO network stations.
A preparatory step for investigating the relationship between the soil CO2 flux and tectonic stress was to identify all the processes related to the exogenous factors that affected the emission of soil CO2. The primary exogenous factors that can influence soil CO2 emissions were found to be environmental parameters, such as air temperature, atmospheric pressure, VWC, and precipitation (Granieri et al., 2003; Viveiros et al., 2008; Camarda et al., 2019). Besides directly modulating the soil CO2, these parameters can also change the soil properties (Camarda et al., 2019). Thus, for investigating the relationship between soil CO2 flux and atmospheric parameters we compared the time series of the soil CO2 flux with the time series of the air temperature, atmospheric pressure, VWC, and precipitation. To minimise the stress-induced perturbations in the signals of the soil CO2 flux, whenever possible, we used the data preceding the earthquake (ML = 6.0) that occurred on 24 August 2016, which affected a large part of the central Apennine. For consistency, we used the same time length of 5 months for all sites. The daily running average of air temperature, atmospheric pressure, the VWC, precipitation, and the soil CO2 flux at Fungaia, Uppiano, and Umbertide are reported in Figures 9–11. The data from Nogna was not considered because the station was installed after August 2016.
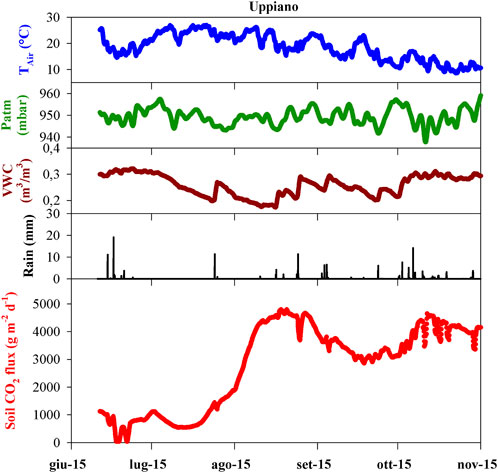
FIGURE 9. Daily running average time series of the air temperature, atmospheric pressure, VWC, precipitation, and soil CO2 flux acquired at Uppiano.
The soil CO2 flux series are characterised by mean values that are different, ranging from 370 g m−2 d−1 at Umbertide to 2,800 g m−2 d−1 at Uppiano (Table 2). At each site, the soil CO2 flux showed a highly uneven trend with different coefficients of variation (CV). The CV is obtained from the ratio of the standard deviation to the average and shows the extent of variability concerning the mean of the population. They varied from the lowest value of 13% at Umbertide to the highest value of 54% at Uppiano. The CV was positively correlated with the mean soil CO2 flux, which suggested that over 5 months of observation, the variability in soil CO2 flux was mainly induced by environmental parameters, given that the higher the flux, the heavier the influence of environmental parameters, and hence, the greater the variability.
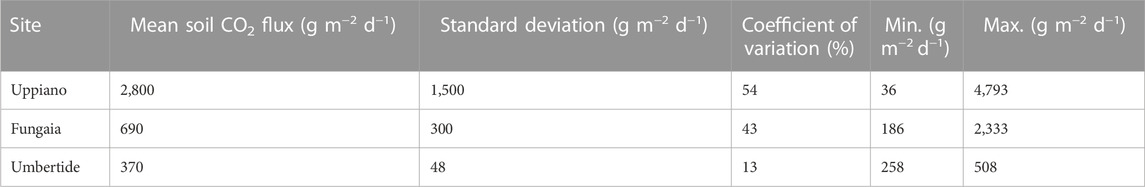
TABLE 2. Basic statistical parameters for Uppiano, Fungaia e Umbartide sites.
Regarding environmental parameters, the air temperature changed with the seasonal cycle, with a maximum value of 28°C recorded in late July 2015 at Fungaia and a minimum value of −2°C recorded in mid-January at Umbertide. The time-dependent evolution of VWC was more variable because it was influenced by air temperature and precipitation. The VWC decreases when depletion caused by evapotranspiration losses exceeds input from precipitation. The VWC dynamic depends on soil moisture conditions: under dry soil conditions, precipitation sharply increases the VWC, whereas under wet soil conditions, only small fluctuations are recorded in response to the precipitation.
At Uppiano (Figure 9), during the first 2 months of monitoring, the values were low, with a mean value of 1,000 g m−2d−1. In early August, the soil CO2 flux increased and reached an average value of 4,000 g m−2d−1 and remained around this value until the end of November 2015.
At Fungaia (Figure 10), the average value of soil CO2 flux showed narrow long-term variability, but in the short-term, the signal displayed wide and frequent oscillations, especially from August to September 2015. In this last period, particularly intense precipitation was recorded.
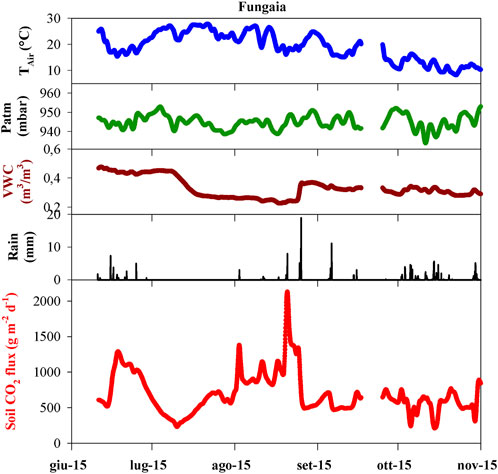
FIGURE 10. Daily running average time series of the air temperature, atmospheric pressure, VWC, precipitation, and soil CO2 flux acquired at Fungaia.
At Umbertide (Figure 11), the soil CO2 flux mean value was slightly variable and remained around a mean value of 350 g m−2d−1. From late December 2015 until the middle of January 2016, the soil CO2 flux decreased to about 250 g m−2d−1. Then, the values increased, with episodes of small and brief decreases, reaching the maximum value at the end of March 2016. Even in this case, the period of higher variability coincided with the main rainy events.
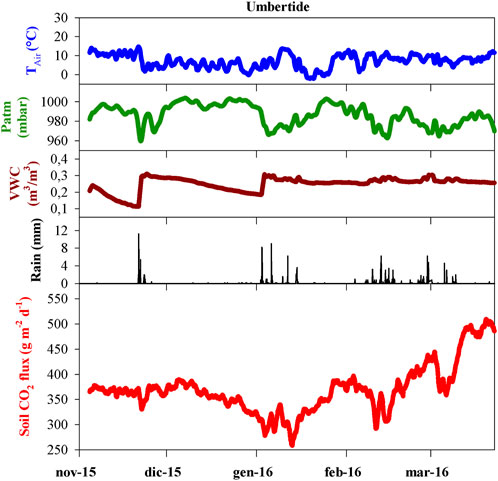
FIGURE 11. Daily running average time series of the air temperature, atmospheric pressure, VWC, precipitation, and soil CO2 flux acquired at Umbertide.
To more comprehensively evaluate the relationship between the soil CO2 flux and the environmental and soil parameters, we applied two different approaches: frequency analyses and multivariate regression analyses (MRA). We used frequency analysis to identify correlation on a short time scale by searching equivalent high-frequency signals among the data series of CO2 flux and environmental parameters. The frequency analysis was performed by using the Fast Fourier Transform (FFT) method that transforms a function of time into a function of frequency. The results of FFT analysis of air temperature, atmospheric pressure, and VWC are very similar (Figure 12) displaying dominant peaks at the diurnal frequency and smaller peaks at the semidiurnal frequency. The FFT of soil CO2 flux gives a very similar picture to that shown by atmospheric parameters and VWC. The similarity demonstrates that the soil CO2 flux is strongly influenced by external parameters on the short time scale. The high-frequency oscillations are clearly visible in hourly data signals, for example, in Supplementary Figure S2 we reported the first period of monitoring at Fungaia site, with hourly data recording and daily running average.
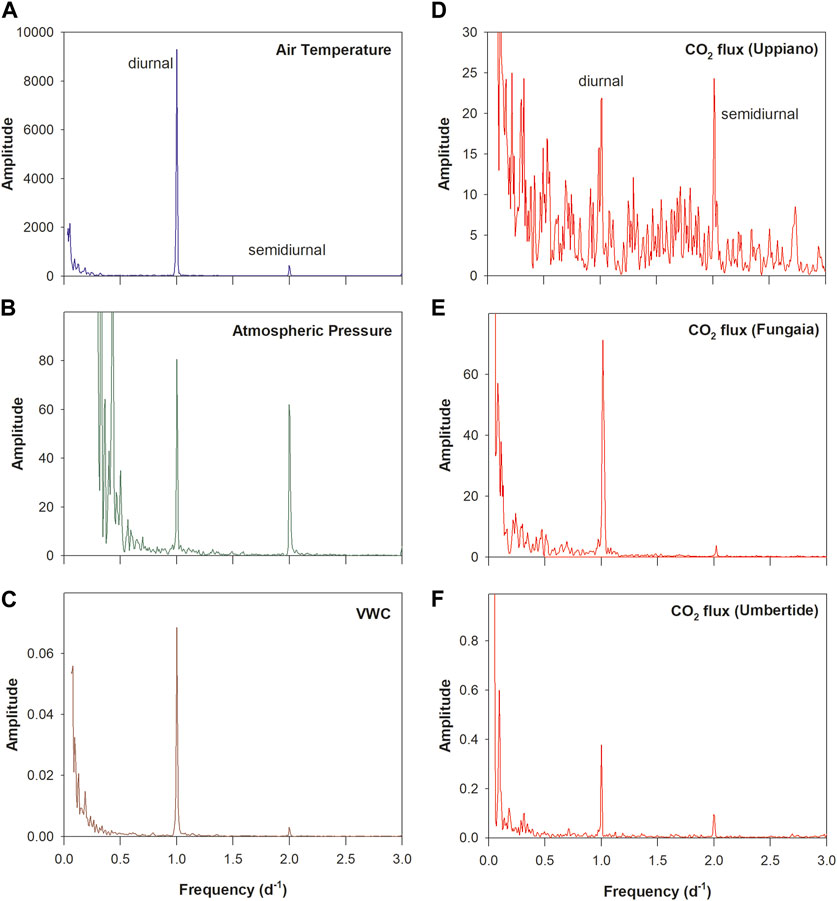
FIGURE 12. Result of Fast Fourier Trasformer analysys: (A) Air temperature, (B) Atmospheric pressure; (C) VWC; (D) Soil CO2 flux in Uppiano site; (E) Soil CO2 flux in Fungaia site; (F) Soil CO2 flux in Umbertide site. Low frequencies (<0.5 d−1) include noise because of relatively short duration of measurement.
To investigate the mid time scale correlations, we applied, to daily running average signals, the multiple regression analyses (MRA). The MRA is a statistical tool for the investigation of the relationships between two or more variables. In this analysis the values of one parameter are compared with one or more parameters by means of scatter plots. The degree of correlation between parameters is obtained by the value of the correlation coefficient (R) of best-fitting straight lines.
We performed the MRA among the datasets of the soil CO2 flux, the air temperature, the atmospheric pressure, and the VWC, the results are reported in Table 3. For the air temperature and the atmospheric pressure series, to avoid perturbations induced by rainy events, we performed the MRA without considering rainy periods. In the sites, Umbertide and Uppiano, the air temperature exerts a moderate influence with positive R values of 0.41 and 0.37, respectively. The positive correlation between soil CO2 flux is a behavior commonly observed in other environments, such as geothermal and volcanic areas (e.g., Viveiros et al., 2008). Indeed, the variation of the air temperature can modify the parameters affecting the gas transport through the soils (e.g., bulk diffusion coefficient). Then a moderate negative correlation was observed with the atmospheric pressure in the sites Umbertide and Fungaia, with R values of −0.41 and −0.34, respectively. The atmospheric pressure changes induce the subsurface motion of gases in porous media and specifically concern transport by advection driven by a pressure gradient. The phenomenon is reported in the literature as “barometric pumping” (Auer et al., 1996) and was described particularly for soil CO2 emissions on the Island of Vulcano (Camarda et al., 2019). In detail, a decrease in atmospheric pressure enhances the pressure gradient between the gas source and the atmospheric one, leading to an increase in the soil CO2 flux; as a result a negative correlation is observed. Lastly, the VWC has a slight negative influence on the soil CO2 emissions, with R absolute values lower than 0.3.
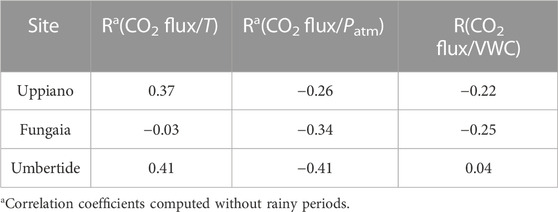
TABLE 3. Correlation Matrix between soil CO2 flux and environmental parameters.
Over the period under consideration, the results show the soil CO2 flux was primarily influenced by environmental parameters, especially on the short time scale. On the mid time scale, only air temperature and atmospheric pressure displayed moderate influences in some sites. Overall, the soil CO2 flux values are differently affected by the environmental parameters in each site concerning the peculiar characteristics of each. However, is noteworthy that, the soil CO2 flux values, albeit with fluctuations, remain well above the typical values for organic-derived CO2 (21 g m−2d−1), indicating a regular supply of deep-origin CO2 for the selected sites.
These findings are promising for future studies on the possible links between soil CO2 flux and stress and seismic rate variations.
The data acquired by the four stations are available in the Data Portal of the European Plate Observing System (EPOS) at the following web address: http://fridge.ingv.it/nfoineurope.php, along with the data from six European NFOs.
The datasets presented in this study can be found in online repositories. The names of the repository/repositories and accession number(s) can be found below: Data are available inside on EPOS Data Portal—the European Plate Observing System at the following web address: http://fridge.ingv.it/nfoineurope.php.
AC, MC, and SD install the stations; MC and SD analysed and interpreted the data; LC and SD wrote the original draft of the manuscript; MC, LC, and SD drafted the figures. All authors contributed to the article and approved the submitted version.
Part of this work has been financially supported by the EPOS Research Infrastructure through the contribution of the Italian Ministry of University and Research (MUR).
The authors would to thank Giuseppe Messina and Ivano Carluccio for database management, Fabio Di Gangi for field work support for the installation of the stations, Santo Cappuzzo for technical support.
The authors declare that the research was conducted in the absence of any commercial or financial relationships that could be construed as a potential conflict of interest.
All claims expressed in this article are solely those of the authors and do not necessarily represent those of their affiliated organizations, or those of the publisher, the editors and the reviewers. Any product that may be evaluated in this article, or claim that may be made by its manufacturer, is not guaranteed or endorsed by the publisher.
The Supplementary Material for this article can be found online at: https://www.frontiersin.org/articles/10.3389/feart.2023.1172643/full#supplementary-material
Antonioli, A., Piccinini, D., Chiaraluce, L., and Cocco, M. (2005). Fluid flow and seismicity pattern: Evidence from the 1997 Umbria-Marche (central Italy) seismic sequence. Geophys. Res. Lett. 32, L10311. doi:10.1029/2004GL022256
Auer, L. H., Rosenberg, N. D., Birdsell, K. H., and Whitney, E. M. (1996). The effects of barometric pumping on contaminant transport. J. Contam. Hydrol. 24, 145–166. doi:10.1016/s0169-7722(96)00010-1
Barchi, M., Minelli, R., and Pialli, G. (1998). The crop 03 profile: A synthesis of results on deep structures of the northern apennines. Mem. Soc. Geol. Ital. 52, 383–400.
Bicocchi, G., Tassi, F., Bonini, M., Capecchiacci, F., Ruggieri, G., Antonella Buccianti, A., et al. (2013). The high pCO2 Caprese Reservoir (Northern Apennines, Italy): Relationships between present- and paleo-fluid geochemistry and structural setting. Chem. Geol. 351, 40–56. doi:10.1016/j.chemgeo.2013.05.001
Boncio, P., Brozzetti, F., and Lavecchia, G. (2000). Architecture and seismotectonics of a regional low-angle normal fault zone in central Italy. Tectonics 19, 1038–1055. doi:10.1029/2000tc900023
Bonfanti, P., Genzano, N., Heinicke, J., Italiano, F., Martinelli, G., Pergola, N., et al. (2012). Evidence of CO2-gas emission variations in the central Apennines (Italy) during the L’Aquila seismic sequence (March-April 2009). B. Geofis. Teor. Appl. 53, 147–168. doi:10.4430/bgta0043
Bonini, M. (2009). Structural controls on a carbon dioxide-driven mud volcano field in the northern apennines (Pieve Santo Stefano, Italy): Relations with pre-existing steep discontinuities and seismicity. J. Struct. Geol. 31, 44–54. doi:10.1016/j.jsg.2008.10.003
Bräuer, K., Kämpf, H., Niedermann, S., Strauch, G., and Tesař, J. (2008). Natural laboratory NW bohemia: Comprehensive fluid studies between 1992 and 2005 used to trace geodynamic processes. Geochem. Geophys. Geosyst. 9 (Q04018). doi:10.1029/2007GC001921
Bräuer, K., Kämpf, H., and Strauch, G. (2009). Earthquake swarms in non-volcanic regions: What fluids have to say. Geophys. Res. Lett. 36, L17309. doi:10.1029/2009GL039615
Burton, M. R., Sawyer, G. M., and Granieri, D. (2013). Deep carbon emissions from volcanoes. Rev. Mineral. Geochem. 75, 323–354. doi:10.2138/rmg.2013.75.11
Buttitta, D., Caracausi, A., Chiaraluce, L., Favara, R., Morticelli, M. G., and Sulli, A. (2020). Continental degassing of helium in an active tectonic setting (northern Italy): The role of seismicity. Sci. Rep. 10, 162. doi:10.1038/s41598-019-55678-7
Camarda, M., Gurrieri, S., and Valenza, M. (2006). CO2 flux measurements in volcanic areas using the dynamic concentration method: Influence of soil permeability. J. Geophys. Res. 111, B05202. doi:10.1029/2005JB003898
Camarda, M., De Gregorio, S., Di Martino, R. M. R., and Favara, R. (2016). Temporal and spatial correlations between soil CO2 flux and crustal stress. J. Geophys. Res. Solid Earth 121, 7071–7085. doi:10.1002/2016JB013297
Camarda, M., De Gregorio, S., Capasso, G., Di Martino, R. M. R., Gurrieri, S., and Prano, V. (2019). The monitoring of natural soil CO2 emissions: Issues and perspectives. Earth-Sci. Rev. 198, 102928. doi:10.1016/j.earscirev.2019.102928
Camarda, M., De Gregorio, S., Di Martino, R. M. R., Favara, R., and Prano, V. (2020). Relationship between soil CO2 flux and tectonic structures in SW Sicily. Ann. Geophys. 63 (1). doi:10.4401/ag-8264
Caracausi, A., Italiano, F., Martinelli, G., Paonita, A., and Rizzo, A. (2005). Long-term geochemical monitoring and extensive/compressive phenomena: Case study of the Umbria region (central apennines, Italy). Ann. Geophys. 48 (1), 43–53. doi:10.4401/ag-3178
Caracausi, A., Martelli, M., Nuccio, P. M., Paternoster, M., and Stuart, F. M. (2013). Active degassing of mantle-derived fluid: A geochemical study along the vulture line, southern apennines (Italy). J. Volc. Geother. Res. 253, 65–74. doi:10.1016/j.jvolgeores.2012.12.005
Carapezza, M. L., Barberi, F., Ranaldi, M., Tarchini, L., and Pagliuca, N. M. (2018). Faulting and gas discharge in the Rome area (Central Italy) and associated hazards. Tectonics 38 (3), 941–959. doi:10.1029/2018tc005247
Chiarabba, C., Amato, A., Anselmi, M., Baccheschi, P., Bianchi, I., Cattaneo, M., et al. (2009). The 2009 L'Aquila (central Italy) MW6.3 earthquake: Main shock and aftershocks. Geophys. Res. Lett. 36, L18308. doi:10.1029/2009GL039627
Chiaraluce, L., Chiarabba, C., Collettini, C., Piccinini, D., and Cocco, M. (2007). Architecture and mechanics of an active low-angle normal fault: Alto Tiberina Fault, northern Apennines, Italy. J. Geophys. Res. 112, B10310. doi:10.1029/2007JB005015
Chiaraluce, L., Amato, A., Carannante, S., Castelli, V., Cattaneo, M., Cocco, M., et al. (2014). The Alto Tiberina Near Fault Observatory (northern apennines, Italy). Ann. Geophys. 57 (3). doi:10.4401/ag-6426
Chiodini, G., and Cioni, R. (1989). Gas geobarometry for hydrothermal systems and its application to some Italian geothermal areas. Appl. Geochem. 4, 465–472. doi:10.1016/0883-2927(89)90004-8
Chiodini, G., Frondini, F., Cardellini, C., Parello, F., and Peruzzi, L. (2000). Rate of diffuse carbon dioxide Earth degassing estimated from carbon balance of regional aquifers: The case of central Apennines, Italy. J. Geophys. Res. 105 (B4), 8423–8434.
Chiodini, G., Cardellini, C., Amato, A., Boschi, E., Caliro, S., Frondini, F., et al. (2004). Carbon dioxide Earth degassing and seismogenesis in Central and southern Italy. Geophys. Res. Lett. 31, L07615. doi:10.1029/2004gl019480
Chiodini, G., Caliro, S., Cardellini, C., Frondini, F., Inguaggiato, S., and Matteucci, F. (2011). Geochemical evidences for and characterization of CO2 rich gas sources in the epicentral area of the Abruzzo 2009 earthquakes. Earth Planet. Sci. Lett. 304, 389–398. doi:10.1016/j.epsl.2011.02.016
Chiodini, G., Cardellini, C., Di Luccio, F., Selva, J., Frondini, F., Caliro, S., et al. (2020). Correlation between tectonic CO2 Earth degassing and seismicity is revealed by a 10-year record in the Apennines. Italy. Sci. Adv. 6 (35), eabc2938. doi:10.1126/sciadv.abc2938
Collettini, C., and Barchi, M. R. (2002). A low angle normal fault in the Umbria region (central Italy): A mechanical model for the related microseismicity. Tectonophysics 359, 97–115. doi:10.1016/s0040-1951(02)00441-9
Collettini, C., Cardellini, C., Chiodini, G., De Paola, N., Holdsworth, R. E., and Smith, S. A. F. (2008). Fault weakening due to CO2 degassing in the northern apennines: Short- and long-term processes. Geol. Soc. Lond. Spec. Publ. 299, 175–194. doi:10.1144/SP299.11
Cui, Y. J., Li, Y., Si, X. Y., Yang, L. X., Liu, Z. F., Sun, F. X., et al. (2019). Tectonic controls on near-surface variations in CH4 and CO2 concentrations along the northwestern margin of the ordos block, China. Geofluids 2019, 1–10. doi:10.1155/2019/7909483
De Gregorio, S., Federico, C., Cappuzzo, S., Favara, R., Giudice, G., Gurrieri, S., et al. (2012). Stress-induced temperature variations in groundwater of the Monferrato area (north-western Italy). Geofluids 12, 142–149. doi:10.1111/j.1468-8123.2011.00348.x
De Gregorio, S., Camarda, M., Cappuzzo, S., and Gurrieri, S. (2013). An innovative method for continuous measurement of soil CO2 flux. Chem. Geol. 341, 102–109. doi:10.1016/j.chemgeo.2013.01.011
De Luca, G., Cattaneo, M., Monachesi, G., and Amato, A. (2009). Seismicity in central and northern Apennines integrating the Italian national and regional networks. Tectonophysics 476, 121–135. doi:10.1016/j.tecto.2008.11.032
Di Luccio, F., Palano, M., Chiodini, G., Cucci, L., Piromallo, C., Sparacino, F., et al. (2022). Geodynamics, geophysical and geochemical observations, and the role of CO2 degassing in the Apennines. Earth-Sci. Rev. 234, 104236. doi:10.1016/j.earscirev.2022.104236
Di Martino, R. M. R., and Capasso, G. (2021). On the complexity of anthropogenic and geological sources of carbon dioxide: Onsite differentiation using isotope surveying. Atmos. Environ. 256, 118446. doi:10.1016/j.atmosenv.2021.118446
Di Martino, R. M. R., Capasso, G., Camarda, M., De Gregorio, S., and Prano, V. (2020). Deep CO2 release revealed by stable isotope and diffuse degassing surveys at Vulcano (Aeolian Islands) in 2015–2018. J. Volc. Geother. Res. 401, 106972. doi:10.1016/j.jvolgeores.2020.106972
Doglioni, C., Barba, S., Carminati, E., and Riguzzi, F. (2014). Fault on-off versus coseismic fluids reaction. Geosci. Front. 5, 767–780. doi:10.1016/j.gsf.2013.08.004
Faber, E., Horálek, J., Boušková, A., Teschner, M., Koch, U., and Poggenburg, J. (2009). Continuous gas monitoring in the West bohemian earthquake area, Czech republic: First results. Stud. Geophys. Geod. 53, 315–328. doi:10.1007/s11200-009-0020-z
Fischer, T., Horálek, J., Hrubcová, P., Vavryčuk, V., Bräuer, K., and Kämpf, H. (2014). Intra-continental earthquake swarms in west-bohemia and vogtland: A review. Tectonophysics 611, 1–27. doi:10.1016/j.tecto.2013.11.001
Fischer, T., Matyska, C., and Heinicke, J. (2017). Earthquake-enhanced permeability – evidence from carbon dioxide release following the ML 3.5 earthquake in West Bohemia. Earth Planet. Sci. Lett. 460, 60–67. doi:10.1016/j.epsl.2016.12.001
Fischer, T., Vlček, J., and Lanzendörfer, M. (2020). Monitoring crustal CO2 flow: Methods and their applications to the mofettes in West Bohemia. Solid Earth. 11 (3), 983–998. doi:10.5194/se-11-983-2020
Granieri, D., Chiodini, G., Marzocchi, W., and Avino, R. (2003). Continuous monitoring of CO2 soil diffuse degassing at phlegraean fields (Italy): Influence of environmental and volcanic parameters. Earth Planet. Sci. Lett. 212, 167–179. doi:10.1016/S0012-821X(03)00232-2
Heinicke, J., Italiano, F., La Penna, V., Martinelli, G., and Nuccio, P. M. (2000). Coseismic geochemical variations in some gas emissions of Umbria region (Central Italy). Phys. Chem. Earth 25, 289–293. doi:10.1016/s1464-1895(00)00046-6
Heinicke, J., Braun, T., Burgassi, P., Italiano, F., and Martinelli, G. (2006). Gas flow anomalies in seismogenic zones in the upper Tiber Valley, central Italy. Geophys. J. Int. 167, 794–806. doi:10.1111/j.1365-246x.2006.03134.x
Hickman, S., Sibson, R., and Bruhn, R. (1995). Introduction to special section: Mechanical involvement of fluids in faulting. J. Geophys. Res. 100 (B7), 12831–12840. doi:10.1029/95JB01121
Horálek, J., and Fischer, T. (2008). Role of crustal fluids in triggering the West Bohemia/vogtland earthquake swarms: Just what we know (a review). Stud. Geophys. Geod. 52, 455–478. doi:10.1007/s11200-008-0032-0
Italiano, F., Martinelli, G., and Rizzo, A. (2004). Geochemical evidence of seismogenic-induced anomalies in the dissolved gases of thermal waters: A case study of Umbria (central apennines, Italy) both during and after the 1997-1998 seismic swarm: 1997-1998 SEISMIC SWARM, UMBRIA. Geochem. Geophys. Geosyst. 5 (11). doi:10.1029/2004GC000720
Italiano, F., Martinelli, G., Bonfanti, P., and Caracausi, A. (2009). Long-term (1997-2007) geochemical monitoring of gases from the Umbria-Marche region. Tectonophysics 476, 282–296. doi:10.1016/j.tecto.2009.02.040
Javoy, M., Pineau, F., and Delorme, H. (1986). Carbon and nitrogen isotopes in the mantle. Chem. Geol. 57, 41–62. doi:10.1016/0009-2541(86)90093-8
Laiolo, M., Ranaldi, M., Tarchini, L., Carapezza, M. L., Coppola, D., Ricci, T., et al. (2016). The effects of environmental parameters on diffuse degassing at Stromboli volcano: Insights from joint monitoring of soil CO2 flux and radon activity. J. Volc. Geother. Res. 315, 65–78. doi:10.1016/j.jvolgeores.2016.02.004
Latorre, D., Mirabella, F., Chiaraluce, L., Trippetta, F., and Lomax, A. (2016). Assessment of earthquake locations in 3-D deterministic velocity models: A case study from the altotiberina Near Fault Observatory (Italy). J. Geophys. Res. Solid Earth 121 (11), 8113–8135. doi:10.1002/2016jb013170
Lee, H., Muirhead, J. D., Fischer, T. P., Ebinger, C. J., Kattenhorn, S. A., Sharp, Z. D., et al. (2016). Massive and prolonged deep carbon emissions associated with continentalrifting. Nat. Geosci. 9, 145–149. doi:10.1038/ngeo2622
Liu, W., Guan, L., Liu, Y., Xie, X., Zhang, M., Chen, B., et al. (2022). Fluid geochemistry and geothermal anomaly along the Yushu-Ganzi-Xianshuihe fault system, eastern Tibetan Plateau: Implications for regional seismic activity. J. Hydrol. 607, 127554. doi:10.1016/j.jhydrol.2022.127554
Martinelli, G., Facca, G., Genzano, N., Gherardi, F., Lisi, M., Pierotti, L., et al. (2020). Earthquake-related signals in Central Italy detected by hydrogeochemical and satellite techniques. Front. Earth Sci. 8, 584716. doi:10.3389/feart.2020.584716
Martinelli, G., Ciolini, R., Facca, G., Fazio, F., Gherardi, F., Heinicke, J., et al. (2021). Tectonic-related geochemical and hydrological anomalies in Italy during the last fifty years. Minerals 11 (2), 107. doi:10.3390/min11020107
Miller, S. A., Collettini, C., Chiaraluce, L., Cocco, M., Barchi, M., and Kaus, J. P. K. (2004). Aftershocks driven by a high-pressure CO2 source at depth. Nature 427 (6976), 724–727. doi:10.1038/nature02251
Minissale, A., Magro, G., Martinelli, G., Vaselli, O., and Tassi, G. F. (2000). Fluid geochemical transect in the northern apennines (central-northern Italy): Fluid Genesis and migration and tectonic implications. Tectonophysics 319 (3), 199–222. doi:10.1016/S0040-1951(00)00031-7
Minissale, A. (2004) Origin, transport and discharge of CO2 in central Italy. Earth-Sci. Rev. 66 (1-2), 89–141. doi:10.1016/j.earscirev.2003.09.001
Mirabella, F., Brozzetti, F., Lupatelli, A., and Barchi, M. R. (2011). Tectonic Evolution of a low angle extensional fault system from restored cross-sections in the Northern Apennines (Italy). Tectonics 30, TC6002. doi:10.1029/2011TC002890
O’Leary, M. H. (1988). Carbon isotopes in photosynthesis. Bioscience 38, 328–336. doi:10.2307/1310735
Ozima, M., and Podosek, F. A. (2002). Noble gas Geochemistry. 2nd ed. Cambridge, New York, Melbourne: Cambridge University Press. xiv + 286.
Pauselli, C., Barchi, M. R., Federico, C., Magnani, M. B., and Minelli, G. (2006). The crustal structure of the northern apennines (Central Italy): An insight by the crop03 seismic line. Am. J. Sci. 306, 428–450. doi:10.2475/06.2006.02
Pialli, G., Barchi, M., and Minelli, G. (1998). Results of the CROP 03 deep seismic reflection profile. Mem. Soc. Geol. It. 52, 1–647.
Pineau, F., and Javoy, M. (1983). Carbon isotopes and concentrations in mid-oceanic ridge basalts. Earth Planet. Sci. Lett. 62, 239–257. doi:10.1016/0012-821x(83)90087-0
Raich, J. W., and Schlesinger, W. H. (1992). The global carbon dioxide flux in soil respiration and its relationship to vegetation and climate. Tellus 44B, 81–99. doi:10.1034/j.1600-0889.1992.t01-1-00001.x
Raich, J. W., and Tufekcioglu, A. (2000). Vegetation and soil respiration: Correlations and controls. Biogeochemistry 48, 71–90. doi:10.1023/a:1006112000616
Rogie, J. D., Kerrick, D. M., Chiodini, G., and Frondini, F. (2000). Flux measurements of nonvolcanic CO2 emission from some vents in central Italy. J. Geophys. Res. Solid Earth 105, 8435–8445. doi:10.1029/1999jb900430
Rowland, J. V., and Sibson, R. H. (2004). Structural controls on hydrothermal flow in a segmented rift system, Taupo Volcanic Zone, New Zealand. Geofluids 4, 259–283. doi:10.1111/j.1468-8123.2004.00091.x
Sibson, R. H. (1994). “Crustal stress, faulting and fluid flow,” in Geofluids: Origin, migration and evolution of fluids in sedimentary basins. Editor J. Parnell (Geological Society, London, Special Publication), 78, 69–84.
Taylor, B. E. (1986). Magmatic volatiles: Isotopic variation of C, H and S. Rev. Mineral 16, 185–225.
Trippetta, F., Collettini, C., Barchi, M. R., Lupattelli, A., and Mirabella, F. (2013). A multidisciplinary study of a natural example of a CO2 geological reservoir in central Italy. Int. J. Greenh. Gas. Control 12, 72–83. doi:10.1016/j.ijggc.2012.11.010
Valoroso, L., Chiaraluce, L., Di Stefano, R., and Monachesi, G. (2017). Mixed-mode slip behavior of the Altotiberina low-angle normal fault system (Northern Apennines, Italy) through high-resolution earthquake locations and repeating events. J. Geophys. Res. Solid Earth 122, 10,220. 10,240. doi:10.1002/2017JB014607
Vaselli, O., Tassi, F., Minissale, A., Capaccioni, B., Magro, G., and Evans, W. C. (1997). Geochemistry of natural gas manifestations from the upper Tiber Valley (central Italy). Mineral. Petrog. Acta 40, 201–212.
Viveiros, F., Ferreira, T., Cabral Vieira, J., Silva, C., and Gaspar, J. L. (2008). Environmental influences on soil CO2 degassing at furnas and fogo volcanoes (são miguel Island, azores archipelago). J. Volcanol. Geotherm. Res. 177, 883–893. doi:10.1016/j.jvolgeores.2008.07.005
Viveiros, F., Ferreira, T., Silva, C., and Gaspar, J. L. (2009). Meteorological factors controlling soil gases and indoor CO2 concentration: A permanent risk in degassing areas. Sci. Total Environ. 407, 1362–1372. doi:10.1016/j.scitotenv.2008.10.009
Vuan, A., Brondi, P., Sugan, M., Chiaraluce, L., Di Stefano, R., and Michele, M. (2020). Intermittent slip along the Alto Tiberina low-angle normal fault in central Italy. geophys. Res. Lett. 47, e2020GL089039. doi:10.1029/2020GL089039
Wang, C. Y., and Manga, M. (2010). Hydrologic responses to earthquakes and a general metric. Geofluids 10, 206–216. doi:10.1111/j.1468-8123.2009.00270.x
Weinlich, F. H., Faber, E., Boušková, A., Horálek, J., Teschner, M., and Poggenburg, . J. (2006). Seismically induced variations in MariánskéLázně fault gas composition in the NW Bohemian swarm quake region, Czech Republic – a continuous gas monitoring. Tectonophysics 421, 89–110. doi:10.1016/j.tecto.2006.04.012
Weinlich, F. H., Stejskal, V., Teschner, M., and Poggenburg, J. (2013). Geodynamic processes in the NW Bohemian swarm earthquake region, Czech Republic, identified by continuous gas monitoring. Geofluids 13, 305–330. doi:10.1111/gfl.12027
Keywords: soil CO2 emissions, Tiberina fault, tectonic stress and strain, TABOO-NFO, seismogenic processes
Citation: Caracausi A, Camarda M, Chiaraluce L, De Gregorio S, Favara R and Pisciotta A (2023) A novel infrastructure for the continuous monitoring of soil CO2 emissions: a case study at the alto Tiberina near fault observatory in Italy. Front. Earth Sci. 11:1172643. doi: 10.3389/feart.2023.1172643
Received: 23 February 2023; Accepted: 10 July 2023;
Published: 20 July 2023.
Edited by:
Soumendra Nath Bhanja, Oak Ridge National Laboratory (DOE), United StatesReviewed by:
Josef Vlcek, Charles University, CzechiaCopyright © 2023 Caracausi, Camarda, Chiaraluce, De Gregorio, Favara and Pisciotta. This is an open-access article distributed under the terms of the Creative Commons Attribution License (CC BY). The use, distribution or reproduction in other forums is permitted, provided the original author(s) and the copyright owner(s) are credited and that the original publication in this journal is cited, in accordance with accepted academic practice. No use, distribution or reproduction is permitted which does not comply with these terms.
*Correspondence: Sofia De Gregorio, c29maWEuZGVncmVnb3Jpb0Bpbmd2Lml0
Disclaimer: All claims expressed in this article are solely those of the authors and do not necessarily represent those of their affiliated organizations, or those of the publisher, the editors and the reviewers. Any product that may be evaluated in this article or claim that may be made by its manufacturer is not guaranteed or endorsed by the publisher.
Research integrity at Frontiers
Learn more about the work of our research integrity team to safeguard the quality of each article we publish.