 Yuya Ikenaga
 Fukashi Maeno
 Atsushi Yasuda
94% of researchers rate our articles as excellent or good
Learn more about the work of our research integrity team to safeguard the quality of each article we publish.
Find out more
ORIGINAL RESEARCH article
Front. Earth Sci., 15 September 2023
Sec. Volcanology
Volume 11 - 2023 | https://doi.org/10.3389/feart.2023.1172615
This article is part of the Research TopicVolcanoes’ Change of Mood and Their Impact: Effusive - Explosive Eruptions and Vice VersaView all 5 articles
Basaltic eruptions sometimes show an explosive and complex nature; thus, clarifying the sequence and controlling parameters is essential for understanding their causes. The An’ei eruption of the Izu-Oshima volcano during 1777–1792 was a complex basaltic eruption producing lava flows, pyroclastic falls, and ash plumes. We reconstructed the transition of the eruption style based on geological data combined with comparisons with data from historical documents and used chemical analyses to develop a magma plumbing model. The An’ei eruption started in August 1777 with scoria ejection. The scoria deposit was classified into Units A–C. Unit A scoria was produced by early weak explosions and more intense subsequent explosions. Unit B scoria marked a return to weak plumes before the summit eruption reached its climactic phase in November 1778 and explosively ejected Unit C scoria. Several lava flows were also effused from the foot of the scoria cone during these periods of scoria ejection. After a 5-year hiatus, the eruption ultimately shifted to persistent, weak ash ejection and pyroclastic surges. The tephra volumes of Units A, B, and C were estimated at 1.9–4.3 × 10⁷, 0.6–4.5 × 10⁶, and 1.3–3.2 × 10⁷ m3, respectively. Associated column heights of 8–11, 3–10, and 9–12 km were obtained for Units A, B, and C, respectively, resulting in sub-Plinian classification. Chemical analyses have shown that the plagioclase phenocryst content increased as the eruption progressed. The transition from relatively weak activity with Strombolian and sub-Plinian explosions, caused by aphyric magma, to short-period activity with more intense sub-Plinian explosions, caused by porphyritic magma, can be explained by evacuation of magma from multiple reservoirs with different contents of plagioclase phenocrysts. Simultaneous lava flows that have different petrological features from those of the scoria eruptions also suggest multiple magma reservoirs and pathways. This view of the temporal change in eruptive style, corresponding to change in magma type, is essential for understanding the eruptive processes of large-scale basaltic eruptions of the Izu-Oshima volcano and contributes to clarifying the nature and hazards of basaltic eruptions which turn into explosive activities in general.
Explosive Plinian and sub-Plinian eruptions that generate a large buoyant plume are the most powerful eruptions observed on Earth’s surface. Such eruptions affect not only proximal areas but also areas more distant from the volcano via the ejection of large volumes of pyroclastic material. Most explosive eruptions of these types involve eruptions by silicic magma; however, some are basaltic explosive eruptions. Examples of highly explosive mafic eruptions include the eruption of Etna in 122 BC (Coltelli et al., 1998), 1886 Tarawera eruption (Walker et al., 1984), Las Sierras-Masaya caldera complex eruptions of 60 and 2 ka (Williams, 1983; Pérez and Freundt, 2006; Wehrmann et al., 2006), 1707 Mt. Fuji eruption (Miyaji et al., 2011), and the explosive eruption of Parícutin during 1943–1952 (Foshag and González-Reyna, 1956). Many of these eruptions record complex transitions in intensity, style, and duration; thus, elucidation of their temporal changes and identification of their controlling parameters are essential for understanding the causes of basaltic explosive eruptions.
The mechanisms that cause basaltic explosive eruptions have been studied for many years. The increase in explosivity known to have occurred during some basaltic eruptions (e.g., Etna in 122 BC, Mt. Fuji in 1707, and Tarawera in 1888) is proposed to have been caused by rapid ascent of magma with high bubble overpressure, due to viscosity increase attributable either to ambient cooling or to microlite crystallization associated with depressurization and dehydration (Houghton et al., 2004; Sable et al., 2009; Sable et al., 2006; Arzilli et al., 2019; Bamber et al., 2020). The importance of the chemical properties of pre-eruptive magma reservoir conditions and their heterogeneities has also been investigated, for example, considering the higher content of volatiles as a possible factor in the higher explosivity of basaltic eruptions [e.g., the 1943–1952 Paricutin eruption (Pioli et al., 2008), the 1959 Kilauea Iki eruption (Sides et al., 2014)]. However, there have also been basaltic eruptions for which the mechanisms controlling the high explosivity and the transition of eruption style remain unclear [e.g., the Masaya triple layer (Costantini et al., 2010)]. Thus, as highlighted by the above-mentioned recent studies, the controlling mechanisms of basaltic explosive eruptions are debated.
To elucidate the mechanisms that drive such eruptions to become explosive, it is essential to understand the detail of the temporal sequence of basaltic explosive eruptions through analysis of historical examples. In this study, we focused on the An’ei eruption of the Izu-Oshima volcano, which was one of the largest basaltic explosive eruptions in Japan that occurred in the 18th century.
The eruptive history and the representative eruptions of the Izu-Oshima volcano have been examined in previous studies (Isshiki, 1984a; Isshiki, 1984b; Kawanabe, 1998; Koyama and Hayakawa, 1996; Nakamura, 1964; Tazawa, 1980; Tazawa, 1981; Tsukui et al., 2009). However, details of the sequence, characterization of transitions in the eruption style, and change in eruption intensity of large-scale explosive eruptions which erupted magma of >1011 kg, corresponding to a magnitude greater than 4, remain unconstrained. The An’ei eruption is the most recent Izu-Oshima eruption with a magnitude greater than 4, and whilst its deposits are well preserved, the transition of the eruption style and the change in eruption intensity have been poorly constrained because of the lack of detailed geological and petrological studies. Studying the stratigraphy of the eruptive products, including several pyroclastic units and lava flows, allows us to constrain the timing of the tephra deposition and lava emplacement through comparison with historical records that describe detailed timings of the lava flows. By combining this construction of the eruptive sequence with chemical characterization of the eruptive products, we aim to examine details of the basaltic magma system operating during the eruption. In this study, we reconstruct the temporal changes in the intensity and the style of the An’ei eruption by estimating certain key physical parameters based on detailed descriptions and analyses of the deposits. Chemical compositions of the eruptive materials are also used to constrain the magma supply system of the basaltic explosive eruption.
Izu-Oshima is an active island-arc volcano located approximately 110 km south-southwest of Tokyo, Japan (Figure 1A), which has erupted primarily basaltic and basaltic–andesitic magmas for at least 40,000 years (Togashi and Isshiki, 1983; Fujii et al., 1988; Kawanabe, 1991; Ishizuka et al., 2014; Ishizuka et al., 2015). Through geological investigation, Nakamura (1964) investigated the major tephra-forming events that resulted in a total erupted mass of >1011 kg, corresponding to a magnitude greater than 4, and recognized that the product of each major eruption comprised a sequence of scoria fall, lava flow, and ashfall. The ashfalls outside the caldera in the final phase of the major eruptions were considered caused by clouds of ash from pyroclastic surges around the summit crater (Nakamura, 1964). Based on geology, radiocarbon dating, historical documents, and archaeological surveys, Nakamura (1964) identified 12 such major eruptions that occurred every 100–200 years over the past 1700 years. These eruptions were named S2–S1, N4–N1, and Y6–Y1 in chronological order by Nakamura (1964). Koyama and Hayakawa (1996) investigated the tephra deposits outside the caldera and the loess, representing intervals between eruptive events, and found that some major eruptions should be separated into several events (24 in total). Although the durations of most eruptions are unknown, Y1 and Y2 eruptions were estimated to have continued for 15 years and 6 years respectively, based on historical documents (Tsukui et al., 2009). The S2 eruption, which occurred in 1.7 ka, included a caldera formation that accompanied large pyroclastic density currents that covered almost the entire island (Yamamoto, 2006). The major eruptions are estimated to have occurred approximately every 145 years for 10,000 years before the caldera formation (Tazawa, 1980). Some major eruptions were accompanied by flank eruptions that formed scoria cones and fissures outside the caldera aligned in the north-northwest–south-southeast direction (Kawanabe, 1998; Figure 1B).
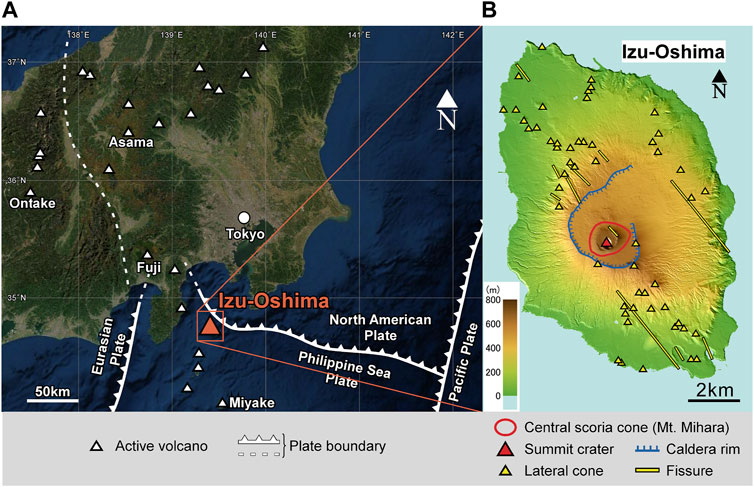
FIGURE 1. (A) Locations of active volcanoes and the tectonic setting around Izu-Oshima. The base map is derived from the General Bathymetric Chart of the Oceans and the National Oceanic and Atmospheric Administration National Centers for Environmental Information. (B) Topographic map and distributions of the summit and flank craters and fissures of Izu-Oshima.
Whole-rock chemical compositions of the eruptions with a magnitude greater than 4 at Izu-Oshima are basaltic, but also indicate that the magma was gradually differentiated at certain depths after the 1.7-ka caldera-forming eruption (Fujii et al., 1988; Kawanabe, 1991). The depths of the magma reservoirs have been estimated using seismic tomography (Mikada et al., 1997) and experimental petrology (Hamada et al., 2011; Hamada et al., 2014) at ∼4 and ∼9 km. Recently, based on estimation of the crystallization condition of pyroxenes, Kuritani et al. (2018) argued that the depth of the deeper magma reservoir might be 13–18 km.
The An’ei (or Y1) eruption that started in August 1777 is the most recent eruption with a magnitude greater than 4. The distribution of the tephra and lava flows was described by Nakamura (1964), Koyama and Hayakawa (1996), and Kawanabe (1998) as shown in Figure 2. Based on their work, the An’ei eruption sequence is described as an early stage of scoria fall, middle stage of lava flows, and final stage of ash emission accompanying pyroclastic surges near the crater. This is the same as the typical sequence of the major eruption proposed by Nakamura (1964). While scoria and ash were ejected from the summit of Mt. Mihara, all lavas effused from the foot of Mt. Mihara; L1 was from the northern foot to the north, L2 was from the southern foot to the southwest, Lx was from the eastern foot to the east, and L3 were from the northern foot to the northeast (Figure 2A). Misonou et al. (2007) estimated that the source of both L1 and L3 was the lava mound near Mt. Mihara (Figure 2B) and proposed that the lava mound was formed in the final stage of the effusion of L3. The total volume of the lava was estimated at 0.14 km3 by Nakamura (1964) using lava distribution from field data and assuming the thickness of 30 m. The volume of the scoria and ashfall deposits was estimated at 0.03 and 0.2 km3, respectively (Koyama and Hayakawa, 1996).
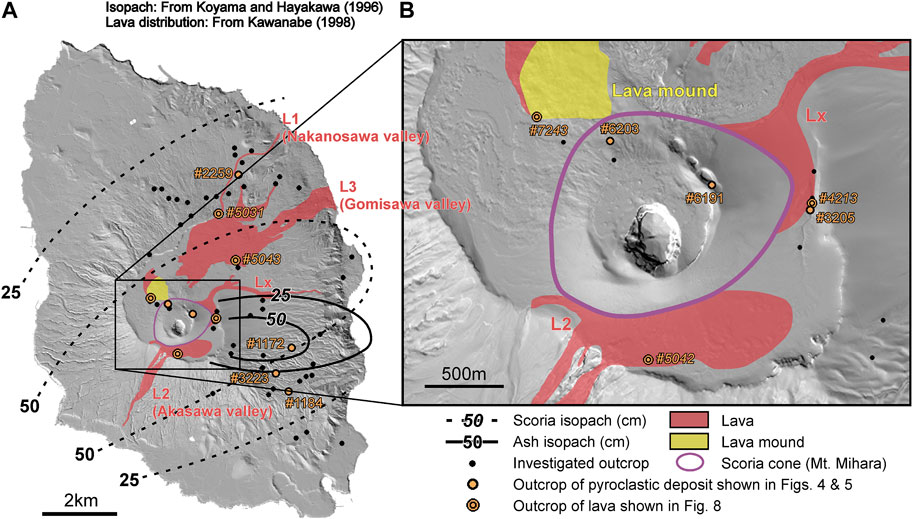
FIGURE 2. Locations of investigated outcrops (A) all over the island and (B) near the summit crater. Isopach contours of the scoria and ash are from the work of Koyama and Hayakawa (1996), and the distribution of the lavas is from Kawanabe (1998).
Tsukui et al. (2009) also reconstructed the sequence of the An’ei eruption based on interpretation of historical documents (Supplementary Figure S1). They suggested that the initial stage of the An’ei eruption started with scoria ejection, which continued intermittently until its peak in April 1778. The description in the historical documents that the main part of Mt. Mihara was formed in April 1778 indicates that the scoria eruption reached its most violent level at this time. Tsukui et al. (2009) estimated that the main part of the scoria deposits that are distributed to the east of the island were also formed at this stage. In this climactic stage, lava (L1) effused from the base of the scoria cone (Mt. Mihara) and was directed toward the Nakanosawa valley in the north. Lava again effused from the base of Mt. Mihara and was directed toward a southern valley (Akasawa) and a northeastern valley (Gomisawa) in November 1778 (L2 and L3, respectively). The date of effusion of the eastern lava flow (Lx) remains unclear. After a 5-year hiatus, the eruption resumed with ash ejection in 1783 and it continued for 9 years until 1792, at which point an ash layer with thickness of several tens of centimeters was formed over almost the entire island.
Misonou et al. (2005) reported that spatter deposits were formed near the summit crater during the An’ei eruption, and these deposits can be divided into several units in which the volume percentage of plagioclase phenocrysts increases toward the upper part of the deposit. Although these proximal spatter deposits likely formed during the scoria eruption, the spatter units have not been correlated with the distal scoria deposits. The period in which each spatter unit was deposited has not been constrained via comparison with the historical records. Moreover, the detailed chemical characteristics of the pyroclasts and their variations have also not been analyzed. Therefore, the entire sequence of the eruptive products of the An’ei eruption has not yet been established.
We surveyed the distribution of deposit thickness (th), maximum clast size (MC), grading features, and volume percentage of phenocrysts of the scoria layer at 53 outcrops and divided the scoria layer into several units. We also investigated the stratigraphic order among lava flows and pyroclastic units at five outcrops. The locations of the investigated outcrops are shown in Figure 2. The MC value was derived from the arithmetic mean of the three major axes of the three largest clasts, i.e., averaging technique of A3/3 in Bonadonna et al. (2013). Scoria samples for measuring MC were obtained from the surface of outcrops where the width and height of the sampling area of scoria are both 20 cm, which is relevant to the unspecified-area strategy of Bonadonna et al. (2013). At outcrops where the thickness of the deposit is less than 20 cm, the height of the sampling area is the same as the thickness of the deposit. Only juvenile clasts were used for MC measurement because almost no lithic fragments were observed in the scoria layer. For each scoria unit, the erupted volume was calculated from the th data using the fitting methods of Hayakawa (1985), Fierstein and Nathenson (1992), and Bonadonna and Costa (2012). The Fierstein and Nathenson method, which adopts the regression of multiple line segments, and the Bonadonna and Costa method, which uses Weibull fitting, can incorporate the effect of the steep proximal slope on the volume estimation, unlike the Hayakawa method that regresses the plot to a single line. In the Fierstein and Nathenson method, th is assumed constant over a distance of 100 m from the summit crater. The column height was estimated from the MC data using methods based on a one-dimensional steady eruption plume model (Carey and Sparks, 1986; Rossi et al., 2019). Isopleth lines of 16 and 20 mm were used for the Carey and Sparks model and Rossi model, respectively. Irregularly large spatter and bombs were excluded in the measurement of the MC value at all outcrops because they are expected to be ballistic ejecta and their sizes are not suitable for calculating the plume height. The rate and duration of magma discharge of each unit were estimated based on the models by Degruyter and Bonadonna (2012) and Woodhouse et al. (2013). Column heights and wind speeds at the tropopause, based on the model of Carey and Sparks (1986), were used for the calculation, and the source temperature was assumed to be 1,100°C, which is the same as that of the magma of the eruptions after caldera formation (Fujii et al., 1988; Kawanabe, 1991). Wind velocity was assumed proportional to height below the tropopause. The input parameters are shown in Supplementary Table S1.
The whole-rock chemical compositions of the scoria and lava ejected in the An’ei eruption were analyzed using an X-ray fluorescence spectrometer (ZSX Primus II, Rigaku Co., Ltd.) at the Earthquake Research Institute (ERI), The University of Tokyo. JB-1a and JG-1a of the Geological Survey of Japan were used for some analyses as secondary standards. Relative error of each element is reported by Hokanishi et al. (2015). Scoria samples were obtained from Units A and C at outcrops #1172 and #6191 from multiple stratigraphic levels. Unit B scoria samples were collected at outcrop #2259 and outcrops near #2259 from a single level. The Unit B scoria was sampled only from a single level because the Unit B deposit is thin. The L1–L3 and Lx flows were also sampled. The sample preparation follows the protocol by Hokanishi et al. (2015). The samples were crushed into powder and heated to remove water and organic matter (scoria at 950°C and lava at 1,000°C for 10 min). The powder was then mixed with lithium tetraborate at a mass ratio of 1:5, and the mixture was melted at 1,150°C in a bead sampler (KT-4100M, Tokyo Kagaku Co., Ltd.) at ERI. The glass beads made from the rock powder samples were then analyzed using X-ray fluorescence.
Modal phenocryst contents can be obtained by analyzing thin section images (e.g., Cashman and Marsh, 1988; Allen and McPhie, 2003; Takeuchi et al., 2021). Outcrops and stratigraphic levels of the samples for the phenocryst mode composition analysis were listed in Supplementary Table S2. The central part of scoria and lava clast samples were cut, and one thin section was prepared per sample. The numbers of samples investigated were three for each scoria unit and one or two for each lava flow. In this study, thin-section image analysis was carried out as follows. The full area of the thin sections was imaged using polarizing and reflecting microscopes. The resolution of the images is 3,426 × 3,426 pixels for 1 cm2. Phenocrysts more than 50 μm in diameter and bubbles in the scoria units and the lava flows were manually traced. Except several samples, phenocrysts were traced across the nearly full thin section and bubbles were traced in 0.5 × 0.5 cm2 area of the thin section images. Bubbles of one scoria sample were traced in the nearly full area and bubbles of several lava samples were traced in 0.5 × 1 cm2, 1 × 1 cm2, or nearly full area of the thin section images. The traced images were then processed by “ImageJ” (https://imagej.nih.gov/ij/) to obtain the volume percentages of phenocrysts and bubbles. The volume percentage of phenocrysts was recalculated for dense rock equivalent using bubble volume percentage to obtain the modal phenocryst contents. Hereafter, the volume percentage of phenocrysts means the recalculated value for the dense rock equivalent. In this modal crystal content analysis, some measurement errors may occur due to heterogeneities between pyroclast samples. However, this error does not significantly affect the discussion in the later section.
Scanning and backscattered electron microscope images were also obtained using a field emission electron probe microanalyzer (JXA-8530F, JEOL Co., Ltd.) at ERI to observe the shapes and textures of the phenocrysts. The acceleration voltage was 12 kV and the beam current was 6 nA.
The major element compositions of the plagioclase phenocryst cores, groundmass glass, and glass inclusions in the plagioclase phenocrysts were analyzed using an electron probe microanalyzer (JXA-8800, JEOL Co., Ltd.) at ERI. The acceleration voltage was 15 kV, the beam current was 12 nA, and the beam diameter was 10 μm. Counting times were 20 s for on-peak and 10 s for each off-peak. The analyzed data were corrected using the ZAF method. Relative errors for glass composition measurements are the same as those reported by Iwahashi et al. (2020).
In previous studies, the scoria fall deposits of the An’ei eruption were considered a single unit that covered a wide area of the island from the central caldera to the eastern coast, which was overlain by ash deposits named the ‘Ash Unit’. However, here we subdivide the scoria fall deposits into three units named Units A–C in ascending order. We differentiate the units by clast size, clast shape, areal distribution, and the volume percentage of plagioclase phenocrysts. The order of the units was resolved using whole-rock geochemistry which is explained in Section 4.2. Here we describe the full details of each unit. They include some qualitative and comparative descriptions as the focus is on field observations, but the values for some key parameters such as plagioclase phenocryst contents, which can be determined by laboratory works, are given in later sections. Photographs and columnar sections of representative outcrops are shown in Figures 3, 4, isopach and isopleth maps of Units A–C are summarized in Figure 5, and detailed observations at each outcrop are presented in the Supplementary Material. Common features of the scoria units are that they are massive and represent clast-supported structures with minor ash components and contain almost no lithic fragments. All tephra deposits, including the Ash Unit, contain plagioclase and minor mafic minerals as phenocrysts.
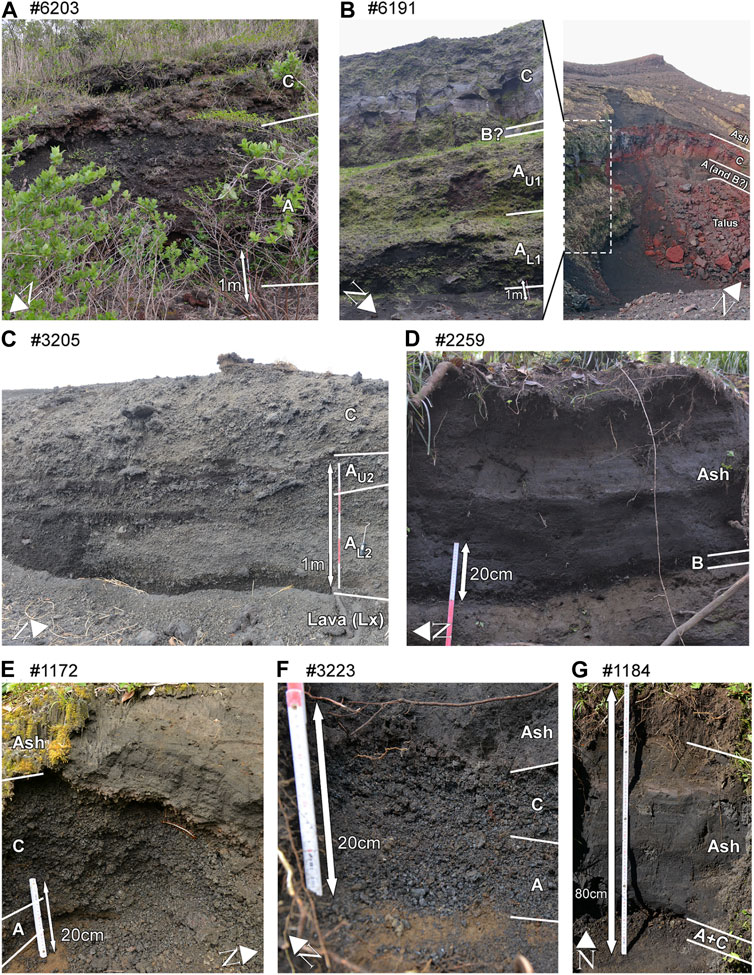
FIGURE 3. Photographs of representative outcrops of pyroclastic deposits. The numbers of the outcrops are (A) #6203, (B) #6191, (C) #3205, (D) #2259, (E) #1172, (F) #3223, and (G) #1184. Stratigraphic positions of the scoria and ash units are indicated in each photograph. At outcrop #6191, left-side photograph shows the left-side wall in the right-side photograph. The locations of the outcrops are shown in Figure 2.
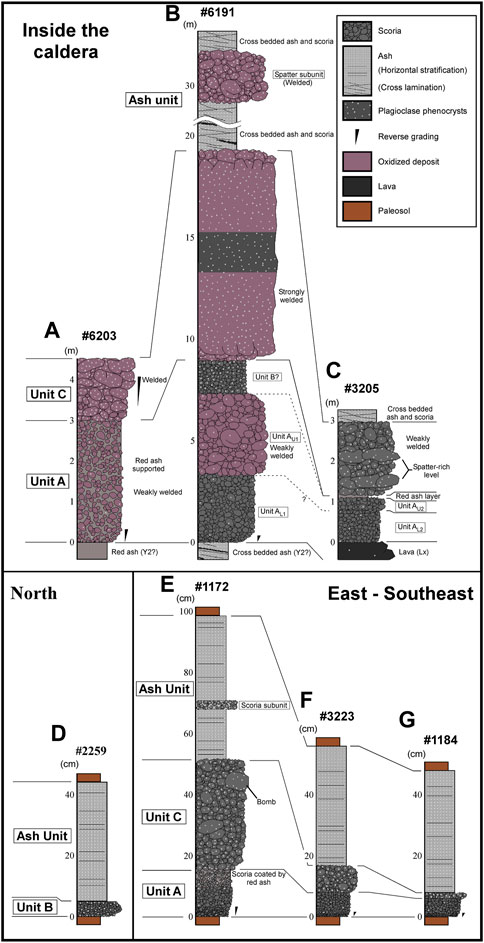
FIGURE 4. Columnar sections of representative outcrops of pyroclastic deposits. The numbers of the outcrops are (A) #6203, (B) #6191, (C) #3205, (D) #2259, (E) #1172, (F) #3223, and (G) #1184. The width of the column indicates relative maximum clast size. The locations of the outcrops are shown in Figure 2.
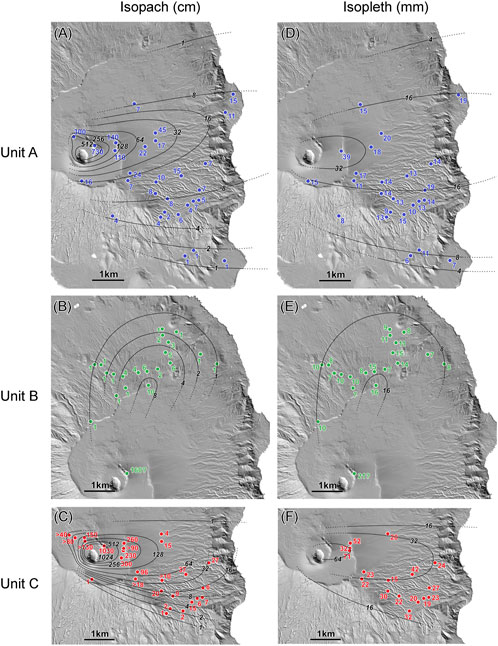
FIGURE 5. Thickness of (A) Unit A, (B) Unit B, and (C) Unit C, and maximum diameter of scoria of (D) Unit A, (E) Unit B, and (F) Unit C.
The lowest unit, Unit A, is dispersed primarily toward the east but it is also found in the northeast and the south–southeast (Figures 5A, D). Although Unit A is characterized as fall deposits that consist of well-vesiculated and well-sorted black scoria containing few plagioclase phenocrysts, Unit A does contain weakly welded spatter clasts that are oxidized with reddish color at some proximal outcrops (#6203 in Figures 3A, 4A and #6191 in Figures 3B, 4B). Inside the caldera, this unit can be subdivided into upper and lower subunits at some outcrops. The lower subunit consists of multiple layers of fine-grained scoria. The upper subunit is massive with subrounded scoria and is coarser than the lower subunit (Figure 4B). Outside the caldera, the base of Unit A shows reverse grading and contains small scoria with very irregular shapes <1 cm in diameter at some outcrops (Figures 4E–G).
Unit B is distributed to the north and deposited within a narrower area in comparison with Unit A (Figures 5B, E). This unit presents no grading and consists of black vesicular scoria with elongated and irregular shapes (Figure 3D; Figure 4D). The scoria of Unit B contains a large volume percentage of plagioclase phenocrysts. The th and MC values of this unit are the smallest among Units A–C when compared at approximately the same distance from the summit crater (Figure 6). There are no distal outcrops of deposits that can be determined as Unit B in contact with either Unit A or Unit C.
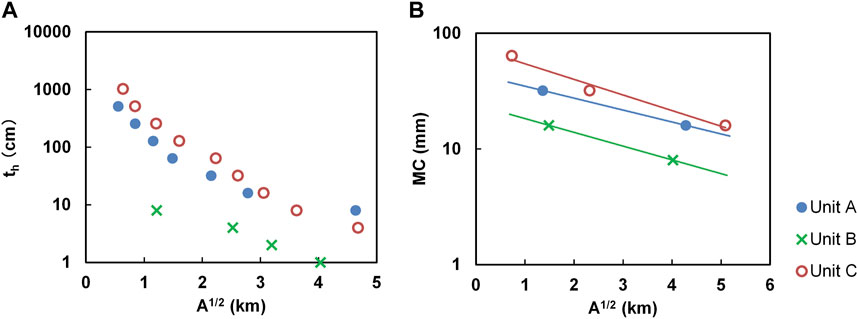
FIGURE 6. Plots of (A) thickness and (B) maximum clast size of scoria units versus the square root of the area (A1/2) enclosed by isopach or isopleth lines.
Unit C forms the upper part of the scoria layer and it can be observed in the eastern region similar to Unit A, but its areal distribution is narrower (Figures 5C, F). We observe a reddish ash between Units A and C that forms a thin layer with a th of several centimeters near the summit crater and fills in between the scoria particles in the upper part of Unit A at distal outcrops (Figure 4). Unit C has almost no grading and contains a large volume percentage of plagioclase phenocrysts, like Unit B. Outside the caldera rim, Unit C is massive and consists of black scoria (Figures 3E–G; Figures 4E–G). The scoria of Unit C is less vesiculated than that of Units A and B and has angular or subrounded shapes, sometimes with fluidal surface textures. Unit C deposits are clast supported and well sorted and this unit includes irregularly large scoria bombs (e.g., #1172 in Figure 4E). The surface features of the bombs are like those of the scoria; however, the centers of the bombs contain larger bubbles than the surface and are sometimes oxidized with a reddish color. Near the caldera rim, Unit C consists of vesiculated but weakly welded black spatter and scoria (#3205 in Figure 3C; Figure 4C). The deposits are clast supported and poorly sorted, presenting as scoria with sizes of approximately several centimeters to spatter with sizes of more than 10 cm. The shapes, inner bubble sizes, and colors of the scoria and spatter are similar to those of the scoria and bombs, respectively, outside the caldera rim. Spatter is concentrated at two or three stratigraphic levels in Unit C. At the outcrop nearest the summit crater (#6191), the deposits of Unit C are strongly welded and consist of agglutinates (Figures 3B, 4B). The middle part of the deposit is black, and the upper and lower parts are reddish and oxidized.
The Ash Unit overlies the scoria deposit with a th of several tens of centimeters to 1 m, showing that the Ash Unit was deposited after the end of a series of scoria fall events (Figures 3, 4). This unit is traceable over almost the entire island, as reported by Koyama and Hayakawa (1996). At outcrops outside the caldera, Ash Unit consists of more than ten subunits with th of several centimeters and color that varies between purple, gray, and black. The subunits show stratification and consist of well-sorted ash, indicating that these subunits are fall deposits (Figure 3D–G; Figure 4D–G). In the eastern part of the island, a black, well-vesiculated, and plagioclase-rich scoria subunit exists in the middle of the Ash Unit (e.g., #1172 in Figure 4E). Some scoria clasts show elongated shapes. This scoria subunit has a th of several centimeters, is poorly sorted, and has ash particles mixed between the scoria clasts. Inside the caldera, the Ash Unit consists of alternation of irregular-shaped small scoria and coarse ash subunits that are somewhat sorted (Figures 3B, C; Figures 4B, C). The deposit of the unit is black or gray and sometimes shows a cross-bedding structure; based on its depositional structure, it is assumed to have been deposited by pyroclastic surges, as proposed by Nakamura (1964). Reddish spatter clasts with a large volume percentage of plagioclase phenocrysts, which are estimated to correspond to the scoria subunit in Ash Unit in the eastern part of the island, are in some places deposited in the middle of the Ash Unit (e.g., #6191 in Figure 4B). Near the summit crater, this spatter is weakly welded and oxidized to a reddish color.
We estimated the erupted volumes and column heights based on our geological data and several fitting or modeling methods. The coordinates of the outcrops and the th and MC data of the scoria units are listed in Supplementary Table S3. The thickness versus area1/2 plots of Units A, B, and C (Figure 6A) indicate that the th values of Units A and C are larger than those of Unit B. The th values of Unit A include the lower and upper subunits. Unit C has similar th values to Unit A in distal regions but it is much thicker than Unit A in the proximal region. The erupted volumes of Units A, B, and C were estimated using several methods (Hayakawa, 1985; Fierstein and Nathenson, 1992; Bonadonna and Costa, 2012). As expected from the thickness versus area1/2 plots, all methods indicate that the volume of Unit B (0.6–4.5 × 10⁶ m3) is smaller than that of either Unit A (1.0–4.3 × 10⁷ m3) or Unit C (1.3–3.2 × 10⁷ m3) (Table 1). The estimated volumes differ depending on the method used. One important characteristic is that the slopes of the thickness versus area1/2 plots of Units A and C are steep near the vent. The volume of both Unit A and Unit C estimated by the Fierstein and Nathenson and Bonadonna and Costa methods might therefore be more reliable than that estimated using the Hayakawa method. The volume of Unit B varies more markedly than that of either Unit A or Unit C depending on the selected method, most likely because we could not find a proximal outcrop of Unit B and only have data from distal outcrops. In summary, the tephra volume of the three major scoria fall units is estimated at 2.4–7.6 × 10⁷ m3 and the magma volume is estimated at 4.3–13.6 × 10⁶ m3 dense rock equivalent (DRE), assuming that the density of the magma and lava is 2,800 kg/m3 and that the bulk density of the scoria deposits is 500 kg/m3, i.e., the same as adopted by Koyama and Hayakawa (1996).
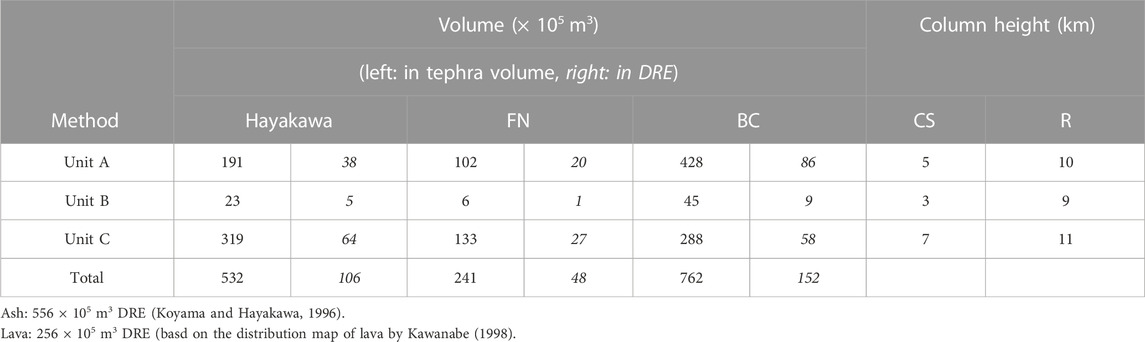
TABLE 1. Tephra volumes, volumes in DRE (in italic), and column heights for Units A, B, and C estimated on the basis of several methods [H: Hayakawa (1985), FS: Fierstein and Nathenson (1992), BS: Bonadonna and Costa (2012), CS: Carey and Sparks (1986), and R: Rossi et al. (2019)].
Koyama and Hayakawa (1996) estimated the magma volume of the Ash Unit at 5.0 × 10⁷ m3 DRE. The volume of the lava flows is estimated at 3.1 × 10⁷ m3 DRE based on the lava distribution map by Kawanabe (1998) when the thicknesses of the lava flows and the lava mound are assumed to be 5 and 10 m, respectively (Table 1). Therefore, by including these with our new data for Units A–C, the total eruptive volume of the An’ei eruption is estimated at approximately 0.09 km3 DRE, corresponding to an eruption magnitude of 4.4. The eruption magnitude is given by
where M is the eruption magnitude and m is the mass of magma in kg (Hayakawa, 1993; Pyle, 2015). Considering the inherent errors in the estimations of the volume of tephra and lava, the actual eruption magnitude might have been within the range of 4–5.
The trend of MC with distance in the MC versus area1/2 plots (Figure 6B) shows that the clast size of Unit C is the largest and that of Unit B is the smallest compared at the same distance. The tallest column was estimated to have formed during the deposition of Unit C (9–12 km). The column for Unit A is the second tallest (8–11 km), and Unit B is considered the event with the shortest column (3–10 km) (Table 1). For each eruption, the lower value was obtained from the Carey and Sparks model and the higher value was obtained from the Rossi model.
The results of calculations of the rate and duration of magma discharge for each unit are shown in Table 2. The discharge rates were calculated to be 2.3–2.9 × 10⁶ kg/s for Unit A, 5.3–7.4 × 10⁶ kg/s for Unit B, and 3.8–4.9 × 10⁶ kg/s for Unit C. The minimum duration of discharge for each unit was calculated approximately based on the averaged tephra volume derived from each of the three methods (Hayakawa, 1985; Fierstein and Nathenson, 1992; Bonadonna and Costa, 2012), resulting in a duration of 68–86 min for Unit A, 280–390 min for Unit B, and 42–54 min for Unit C.
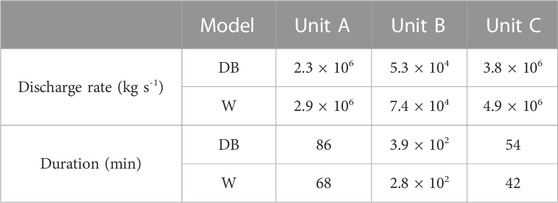
TABLE 2. Discharge rates and durations of Unit A, B, and C estimated following the models [DB: Degruyter and Bonadonna (2012), W: Woodhouse et al. (2013)]. Average values of the volumes determined using three different models (Hayakawa, 1985; Fierstein and Nathenson, 1992; Bonadonna and Costa, 2012) were used for the calculation of eruption duration.
Eruptive styles of the scoria units were estimated based on the classification scheme by Pyle (1989) (Figure 7A), and the tephra thinning trends of scoria units were compared with those of other sub-Plinian eruptions (Figure 7B). All three scoria units are classified as sub-Plinian and are also comparable with other well-studied sub-Plinian eruptions.
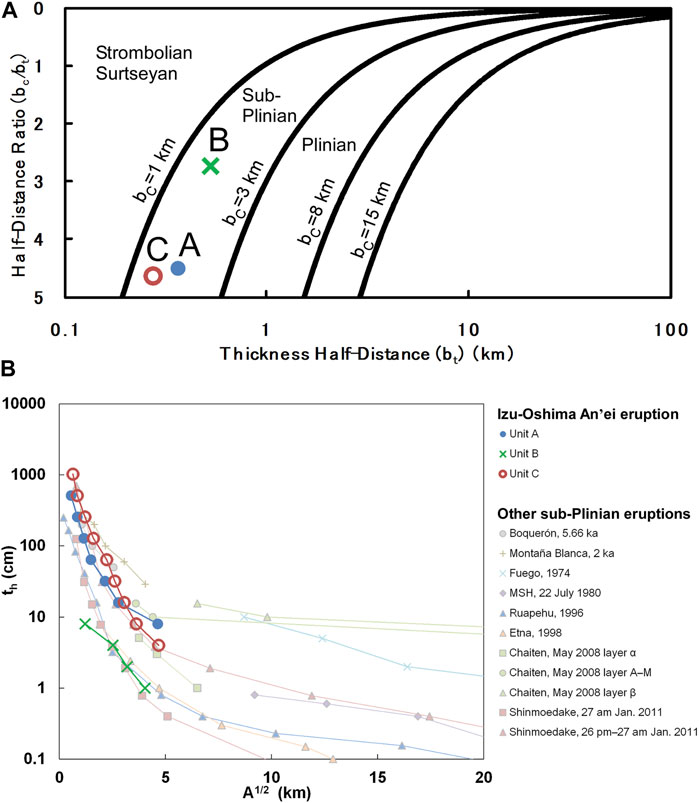
FIGURE 7. (A) Thickness half-distance (bt) and half-distance ratios (bc/bt) of Units A, B, and C plotted on a classification scheme of the eruptive style according to Pyle (1989). (B) Comparison of semi-log plots of thickness versus the square root of the area (A1/2) enclosed by isopach lines between the An’ei eruption and several representative sub-Plinian eruptions. Data are from Boquerón, 5.66 ka (García et al., 2012); Montaña Blanca, 2 ka (Ablay et al., 1995); Fuego, 1974 (Rose et al., 2008); Mount St. Helens, 18 May 1980 (Sarna-Wojcicki et al., 1981); Ruapehu, 17 June 1996 (Bonadonna and Houghton, 2005); Etna, 1998 (Bonadonna and Costa, 2012); Chaiten, May 2008 (Alfano et al., 2011); and Shinmoedake, January 2011 (Maeno et al., 2014).
The distributions of lava flows are shown in Figure 2, photographs of the outcrops are shown in Supplementary Figure S2, and detailed observations at each outcrop are presented in the Supplementary Material. The horizons of the lava flows can be determined as follows.
L1 is located beneath Unit B, as observed at outcrop #5031 (Supplementary Figure S2B). This indicates that L1 could have formed before the eruption of Unit B; however, the exact horizon was undetermined because L1 was mainly emplaced in the north of the island that is outside of the coverage of Unit A.
At outcrop #5042, L2 is covered by Units A and C, which indicates that L2 effused before or during the Unit A eruption (Supplementary Figure S2C). We could not observe the bottom of L2 to confirm whether the formation of Unit A had started before the effusion of L2.
L3 is not covered by any scoria units, as represented by outcrop #5043 (Supplementary Figure S2E). However, the L3 horizon can be estimated from the horizon of the lava mound near the summit cone. Although L3 cannot be traced to the lava mound because the area between L3 and the lava mound is covered by lavas of more recent eruptions, Misonou et al. (2005) interpreted that the lava mound was the source of the L3 flow based on mapping of the morphology of the lava surface (Misonou et al., 2005). This lava mound is covered by the spatter of Unit C at outcrop #7243, suggesting that this flow formed before or during the deposition of Unit C (Supplementary Figure S2A).
Lx is observed in the scoria deposit of Unit A at outcrop #4213, indicating that Lx formed during the eruption of Unit A (Supplementary Figure S2D). We cannot constrain the eruption period of the scoria units from the stratigraphic level of Lx because the effusion date of this lava is not given in the historical documents.
Harker diagrams of the lava and pyroclastic units are shown in Figure 8A. Harker diagrams of major elements other than Al2O3 versus SiO2 plot are shown in Supplementary Figure S3, and the values of the whole-rock chemical compositions of the pyroclastic deposits, lava flows, secondary standards, and relative error values from Hokanishi et al. (2015) are summarized in Supplementary Table S4. The SiO2 and Na2O+K2O contents of all ejecta are 51.0–54.0 wt% and 2.0–2.6 wt%, respectively, indicating that the magma of the An’ei eruption can be classified as basalt–basaltic andesite. Importantly, the whole-rock compositions form a single trend on the Harker diagrams plot on a straight line. Notably, the composition of each deposit forms a separate group on the SiO2 versus Al2O3 plot (Figure 8A). The Al2O3, Na2O, and CaO contents increase while the SiO2, MgO, and FeO contents decrease in the following order: the lavas, Unit A, Unit B, Unit C, and the Ash Unit. For the lavas, even though the vent locations and the effusion dates are different, there are minimal differences among the whole-rock compositions of L1–L3 and Lx.
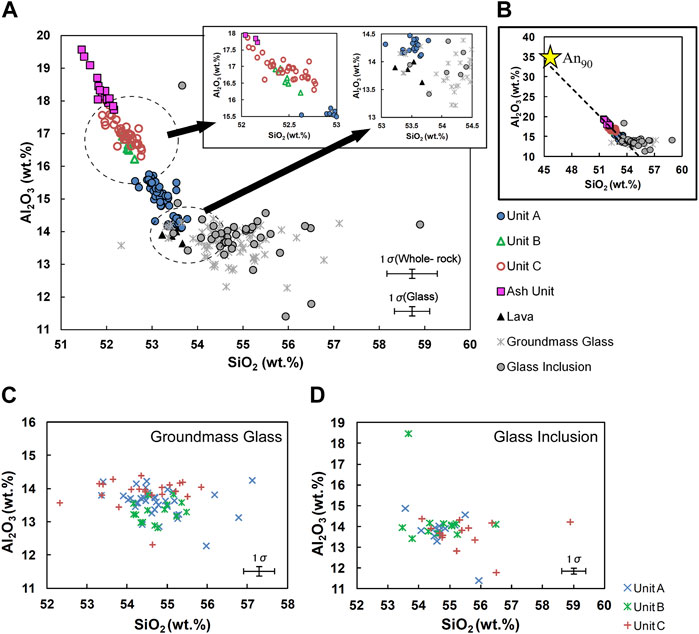
FIGURE 8. (A) Whole-rock Al2O3 versus SiO2 contents of the lava, scoria units, and Ash Unit. Insets show details of the areas surrounded by dotted lines. (B) Comparison between the regression line of the whole-rock compositions and the composition of plagioclase phenocryst of An90 (indicated by a yellow star). (C) Al2O3 and SiO2 contents of the groundmass glass of the scoria units. (D) Al2O3 and SiO2 contents of the melt inclusions of plagioclase phenocrysts.
The Al2O3 content, which reflects mainly the volume percentage of plagioclase phenocrysts, increases not continuously but stepwise through the eruption. At outcrop #1172, the amount of Al2O3 increases from the bottom to the top of Unit A. The Al2O3 content abruptly increases from Unit A to C, and is constant through Unit C (Figure 9B). At outcrop #6191, the Al2O3 content abruptly increases between Unit AL1 and AU1, Unit AU1 and Unit B, and Unit C and the Ash Unit (Figure 9A). The gap in Al2O3 content of Unit A at ∼14.6 wt% in the Harker diagram (Figure 8A) corresponds to the boundary between Unit AL1 and AU1.
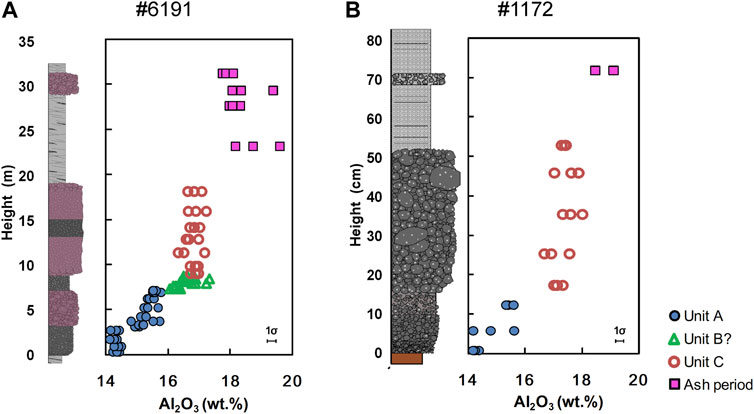
FIGURE 9. Transitions in the whole-rock Al2O3 content versus the stratigraphic level of the pyroclastic deposit at (A) #6191 and (B) #1172.
The Al2O3 content in Unit B, 16.1–17.0 wt%, is between that in Unit A (14.1–15.8 wt%) and Unit C (16.3–18.0 wt%) (Figure 8A). At outcrop #6191, there is a stratigraphic level just beneath Unit C where the Al2O3 content of the scoria is nearly the same as that of Unit B deposited in the northern part of the island. Although it is difficult to conclude that this stratigraphic level is the product of the Unit B eruption based only on geological observations, the whole-rock composition suggests that this level might correspond to Unit B which is why we place it stratigraphically between Unit A and C.
Thin section images manually traced for phenocrysts and bubbles are shown in Supplementary Figure S4. The volume percentage of plagioclase phenocrysts varies within the units of the An’ei eruption. The volume percentages of plagioclase phenocrysts in Units B and C (12–26 vol%) are higher than those in the lavas (1–4 vol%) and Unit A (5–10 vol%) (Figure 10; Table 3). Conversely, mafic phenocrysts, such as clinopyroxene and orthopyroxene, and Fe–Ti oxide phenocrysts are rarely observed (less than 1 vol%) (Figure 10; Table 3). Most plagioclase phenocrysts are euhedral with diameters of 0.5–2 mm and usually display a glomeroporphyritic texture (Figure 10). The plagioclase phenocrysts in the pyroclasts are clear and homogeneous with almost no compositional zoning or dusty zones (Figures 10A–D), whereas the plagioclase phenocrysts in the lavas have thick sodic rims (more than a few tens of micrometers) that are clearly distinguishable from the plagioclase phenocrysts observed in the pyroclasts (Figure 10E).
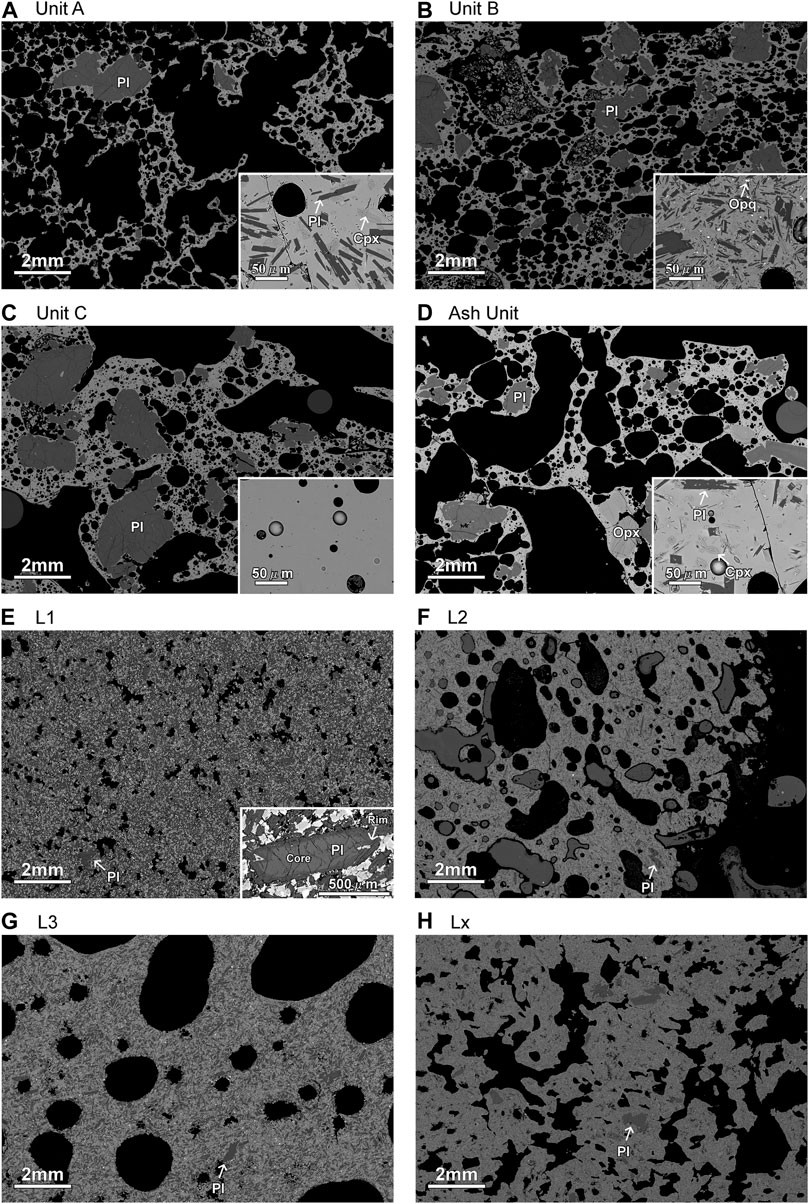
FIGURE 10. Backscattered images of thin sections of scoria in (A) Unit A, (B) Unit B, (C) Unit C, and (D) Ash Unit, and lava flows of (E) L1, (F) L2, (G) L3, and (H) Lx. Images on the lower right show close-up views of the groundmass. Dark gray: plagioclase (Pl), gray: orthopyroxene (Opx), light gray: clinopyroxene (Cpx), white: Fe-Ti oxide (Opq).
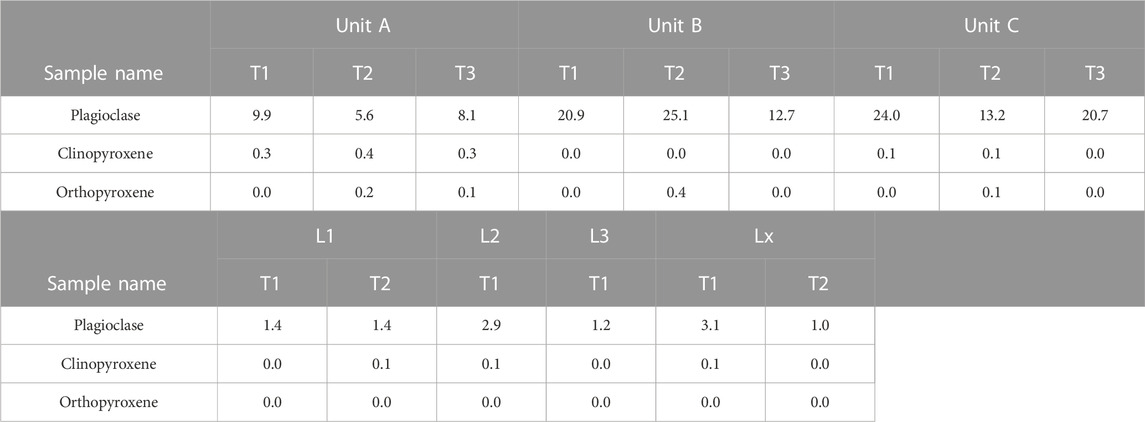
TABLE 3. Volume percentages of phenocrysts in the scoria units and lava flows derived from manual tracing of the bubbles and phenocrysts in the thin section images. Outcrops and stratigraphic levels of the samples are listed in Supplementary Table S2.
Even though weak zoning was occasionally observed, backscattered images of thin sections (Figure 10) show that there are almost no backscatter electron grayscale contrasts and compositional variations in the core and rim of plagioclase phenocrysts, except for the lava. We therefore focused on the core composition of plagioclase phenocrysts. The plagioclase core compositions of the lava and scoria of Units A–C are summarized in Supplementary Figure S5. As Supplementary Figure S5 shows, the frequency distributions of the plagioclase core compositions of all the lava flows and scoria units are unimodal, and most plagioclase phenocrysts have compositions between An85 and An95 with a peak near An90.
The values of the glass compositions of Units A–C and the relative error values from Iwahashi et al. (2020) are shown in Supplementary Table S5. The SiO2 content of the groundmass glass is 53.0–58.0 wt%, corresponding to basalt–andesite (Figure 8C). The groundmass glass compositions of Unit A are the most scattered of the three scoria units (Figure 8C). The glass compositions of all units plot in the area with slightly higher SiO2 content than the whole-rock compositions of the lava flows (Figure 8A). The glass inclusions in the plagioclase phenocrysts in the scoria units have compositions that are nearly the same as the groundmass glass (Figure 8D). Some inclusions in Unit B are rich in MgO (Supplementary Figure S3; Supplementary Table S5).
The important feature is that the melt and the core compositions of plagioclase phenocrysts remained constant while the whole-rock and modal compositions changed during the eruption. It indicates that the An’ei eruption was not likely fed by magmas with different degrees of differentiation.
The column height estimated from the eruption style classification scheme by Pyle (1989) (Figure 7A) is more than 14 km, which is larger than that estimated at 3–12 km from the models by Carey and Sparks (1986) and Rossi et al. (2019) (Table 1). This is because Pyle’s method cannot evaluate the effect of strong wind, which might have been important in the An’ei eruption, as deduced from the shapes of the isopach maps (Figure 5). For example, in the Shinmoedake 2011 sub-Plinian eruption (Kyushu, Japan), which was accompanied by strong wind, the observed column height was ∼7 km, whereas the height estimated using Pyle’s method was >14 km (Maeno et al., 2014).
The sub-Plinian classification of Unit A is imperfect because this eruptive phase consists of multiple subunits potentially reflecting different eruptive episodes. The upper subunit of Unit A has larger-sized clasts than the lower subunit of Unit A indicating that the latter stage was more intense than the earlier stage in the Unit A formation (e.g., #6191 of Figure 4B). Because the sub-Plinian classification of the eruptive style is based on MC for Unit A, this corresponds to the most intense period of the Unit A eruption, the upper subunit. It is possible that the lower part of Unit A, especially the onset of Unit A which erupted small scoria with irregular shapes, reflects a weaker eruptive style. Similarly, when calculating the duration of the Unit A eruption in Section 4.1.2, the discharge rate could correspond to the upper part of Unit A; however, the volume used was that of the entirety of Unit A giving a duration of the event of the upper subunit of 1 h or less. This total duration (∼1 h) is much shorter than the total possible period of Unit A deposition estimated from the stratigraphy and lava effusion dates. It is reasonable to consider then that the upper subunit of Unit A is the product of a short event (∼1 h or less) and the lower subunit inside the caldera was formed by multiple explosions that occurred over a longer time period.
The estimated plume height of Unit B is the lowest (3–10 km), therefore, it is thought to have resulted from the weakest sub-Plinian eruption of the three scoria units. We assume the intensity of the Unit B event was constant because there is no grading in the deposit. The tephra thinning trend of Unit B also overlaps those of Vulcanian eruptions (e.g., Miyabuchi et al., 2013). However, Unit B eruption should be classified as rather sub-Plinian than Vulcanian because multiple layers of blocky ash, typical of Vulcanian deposits, were not observed in Unit B.
The intensity of Unit C, which was also a sub-Plinian event, is considered the strongest based on the estimated column height (9–12 km), and considered constant based on the constant clast size The steep slope of the thickness versus area1/2 plot of Unit C near the crater (Figure 6A) indicates that a large amount of spatter and bombs was deposited around the crater forming a thick scoria unit.
The Ash Unit was deposited by repeated explosive events because more than ten subunits are recognized in the Ash Unit outside the caldera. The duration of the Ash Unit was ten or more times longer than those of scoria units, and a large volume of deposits as much as 0.2 km3 was produced. Nakamura (1964) interpreted that this unit was formed by pyroclastic surges inside the caldera and accompanying ash clouds outside the caldera. Although our observations of the cross-bedding deposits inside the caldera and the ash subunits outside the caldera are consistent with the interpretation by Nakamura (1964), we also found that the deposit includes weakly welded spatter near the summit crater and scoria fall outside the caldera. It suggests that the eruptive style changed temporarily into a more intense phase with extensive spatter and scoria fallout while the eruptive style was broadly an ash-dominant type that might have been accompanied by pyroclastic surges. Even though Ash Unit is deposited with th values of tens of centimeters, and in some places nearly 1 m outside the caldera (Figures 4D–G), it is usually unobservable or very thin inside the caldera (e.g., #6203 in Figures 3A, 4A). The reason for the ash deposits having such a large variation in th is likely linked to wind erosion inside the caldera, where there is little vegetation and strong winds were often observed during our survey. Although more detailed analyses of the ash particles and grain size distribution are needed, the interaction of the magma with the groundwater is a possible mechanism that caused magma fragmentation and surges. The eruptive style for the intense phase could be classified as Strombolian or sub-Plinian.
The possible timings of the scoria deposition from Unit A to Unit C can be constrained from the stratigraphic relationship between the scoria units and the lava flows (Figure 11) because the effusion dates of the Nakanosawa (L1, April 1778), Akasawa, and Gomisawa (L2 and L3, both November 1778) lava flows were estimated reasonably reliably based on the historical documents (Tsukui et al., 2009). It should be noted that Figure 11 shows the possible periods of formation of the scoria units; however, the formation events are considered to have occurred over shorter durations.
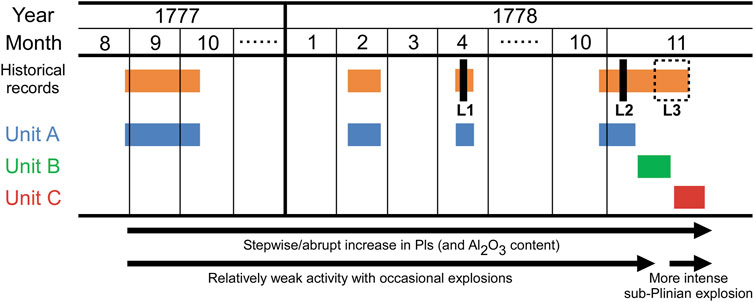
FIGURE 11. Possible periods of Unit A–C eruptions inferred on the basis of our study and the historical documents (Tsukui et al., 2009). Horizontal bars indicate the period of the summit scoria eruption for each unit. Vertical black bars show the flank lava effusion events. Dotted black bar in November 1778 indicate the possible timing of L3 effusion. Lx is estimated to have effused at certain points during the Unit A period.
One of the key points is that Unit A deposition was completed after the deposition of L2 in November 1778. It is possible that the lava flows of the An’ei eruption represent the earliest products of the eruption because almost no Unit A deposits were found beneath the lava flows, although the distributions of Unit A and all lava flows except Lx do not overlap. However, the historical descriptions suggest that there were several explosions and tephra emissions between August 1777 and April 1778, i.e., before the lava flow (L1) was first described, although there is a possibility that the earliest phase such as the event in August 1777 was a small event and the deposit is not preserved. These explosions are likely related to the eruptions during the Unit A period, and we argue that the An’ei eruption started with small explosions that deposited the lowest part of Unit A, which is distributed in the limited area where the lava flows (except Lx) were not emplaced. Other key observations are that the activity of Unit A had already ended before the formation of the lava mound northwest of Mt. Mihara, and that the Unit C event ended after the lava mound had been formed. This lava mound is interpreted as the source of L3, which was effused in November 1778 (Misonou et al., 2007). The formation of Unit C must have occurred during or after the L3 effusion. Unit B is estimated to have been deposited between the Unit A and Unit C events, as described in Section 5.1.
Combining understanding of the stratigraphy of the deposits with descriptions in the historical documents, the sequence of the An’ei eruption during the scoria and lava periods is proposed as follows. On 31 August 1777, the An’ei eruption started with an eruption of plagioclase-poor magma at the summit crater. After several intermittent small explosive eruptions, which formed the bottom part of Unit A, an intense explosive scoria eruption occurred at the summit crater by mid-November 1778 and the main upper part of Unit A was deposited in the eastern region of the island. This last of the Unit A-forming eruptions was relatively explosive, possibly being sub-Plinian, and deposited weakly welded spatter near the summit crater (Figure 11). During the Unit A period, several lava flows also effused from the vents on the foot of Mt. Mihara: L1 in the northward direction on April 19–21, 1778; L2 in the southwestward direction on 6 November 1778; and Lx in the eastward direction at an uncertain effusion date (Figure 2A; Figure 11). Lx might have effused in the early stage of the Unit A period because Lx is observed near the bottom of the Unit A deposit (Supplementary Figure S2D). The wind direction was east throughout the events depositing Unit A (Figures 5A, D). Soon after the Unit A eruption, the wind direction changed to the north and a weaker scoria eruption occurred at the summit crater, which deposited Unit B (Figures 5B, E). The wind directed again to the east and the most intense stage of the summit scoria eruption started after the eruption of Unit B. This peak eruptive period formed the tallest eruptive column and produced the largest volume of plagioclase-rich scoria throughout the entire An’ei eruption and formed Unit C (Figures 5C, F; Table 1). Large ballistic scoria bombs were ejected out of the caldera and spatter deposits and agglutinate formed inside the caldera (Figure 3A–C, Figure 4A–C). The Unit B and C eruptions occurred in the middle of November 1778 (Figure 11). A lava mound appeared northwest of Mt. Mihara, and L3 effused from this mound to the northeast and into the sea on November 14–15, 1778, which was during the possible period of formation of Units B and C (Figure 2, Figure 11). There might have been some intervals between the units, at least as long as the time necessary for wind direction change.
In a previous study, it was hypothesized that the peak stage of the scoria eruption occurred in April 1778, based on the description of explosive eruptions in the historical documents (Tsukui et al., 2009). It was also reported that pollen from spring flowers was detected in the scoria layer of the An’ei eruption, which might indicate that the strongest scoria eruption was in April (Endo et al., 1994), although it is uncertain in which scoria unit the pollen was detected. In contrast, our study indicates that the peak stage, namely Unit C, occurred in November 1778, which is half a year later than estimated previously (Figure 11). Additionally, our data suggest that there were several explosive (Strombolian to sub-Plinian) eruptions during the period of formation of Unit A, and that the event that deposited the upper subunit of Unit A near the crater was stronger. The historical description of an explosive eruption in April 1778 might represent this stronger explosive event that formed Unit A.
Nakamura (1964) proposed a model suggesting that the sequences of the major large eruptions of Izu-Oshima, including the An’ei eruption, have a common order of progression: scoria ejection, lava effusion, and ash emission. However, our results suggest that Unit C, the main part of the scoria layer, was deposited after L3, the last lava effusion, occurred in the An’ei eruption. The scoria layer of most of the major large eruptions has previously been described as a single tephra fallout unit (Nakamura, 1964; Koyama and Hayakawa, 1996); however, the scoria layer of the An’ei eruption can be divided into at least three separate fallout units. Our new data contradict the classical view of large-scale explosive eruptions at Izu-Oshima. We propose that multiple major sub-Plinian events can occur during a single episode, each with duration of several hours or less, and that lava flows can be issued before the end of scoria eruption phase.
Although the eruption from 1783 to 1792 which formed the Ash Unit was mainly ash eruption accompanying surges, we found that the eruption also contained a small intense phase. In this intense phase, scoria was deposited on the eastern side of the island and spatter was formed inside the caldera, such as the early scoria fall units. The eruption style during the period of Ash Unit was not uniform but changed over time. Tsukui et al. (2009) reported that ashfall was observed even at Toshima Island, i.e., 20 km from Izu-Oshima, during June–July of 1785 and in September and October of 1786. These observations might correspond to the intense phase during the ash period.
In this section, we discuss the magma-feeding system of the An’ei eruption based on the observed changes in magma composition and eruptive style. We examine models of magma systems to better constrain the magmatic evolution of the An’ei eruption. First, we discuss the origin of the linear trend in the whole-rock chemical compositions. In the Harker diagram, the Al2O3 content increases with eruptive events along a straight line connecting the composition of the most Al2O3-poor magma with the plagioclase composition of An90 (Figure 8B). The melt compositions (groundmass glass and melt inclusions) remain almost constant throughout the eruption (Figure 8C), indicating that melt produced by differentiation was not responsible for this compositional variation. The majority of phenocrysts in the An’ei products is plagioclase with An∼90 (35 wt% Al2O3); thus, it is reasonable to assume that the Al2O3 content in the An’ei eruption was dependent solely on the volume percentage of plagioclase phenocrysts. Using Al2O3 content of An∼90 (35 wt%), whole-rock Al2O3 contents of lava and scoria units, and the results of the modal composition analysis of lava (2 vol% plagioclase phenocrysts in average), the plagioclase phenocryst contents of the scoria units can be calculated to be 2–11 vol% for Unit A, 12–17 vol% for Unit B, and 13–22 vol% for Unit C. These values are broadly consistent with the results of the modal composition analyses, although some samples from Unit B showed slightly higher plagioclase phenocryst contents than those calculated from the whole-rock compositions (Table 3). The discrepancy for Unit B is considered as the error in the modal phenocryst content analysis, originating from heterogeneities between pyroclast samples.
The idea that whole-rock chemical composition is controlled purely by the volume percentage of plagioclase phenocrysts was proposed originally to explain the eruptive products of the recent small–medium-scale eruptions at Izu-Oshima (Aramaki and Fujii, 1988; Nakano and Yamamoto, 1991; Hamada et al., 2011). Even in the case of the An’ei eruption, the key point in understanding the magma-feeding system is to determine what caused the variation in the volume percentage of plagioclase phenocrysts. Aramaki and Fujii (1988) and Nakano and Yamamoto (1991) proposed the plagioclase floating model for the recent eruptions, in which plagioclase phenocrysts are assumed to float and accumulate on the top of a magma reservoir owing to their lower density than that of the melt. If we accept the same model for the An’ei eruption, the earlier ejecta of the eruption should be rich in plagioclase phenocrysts. However, this contradicts our observation that the earlier ejecta were relatively poor in plagioclase phenocrysts compared to later phases. Additionally, Aramaki and Fujii (1988) assumed that the density of the melt must be greater than that of the plagioclase phenocrysts because of the low H2O content (<1 wt%) in the melt; however, Hamada et al. (2011) estimated that the magmas in the shallow (∼4 km) and deep (∼9 km) reservoirs of Izu-Oshima have H2O contents of 3 and 5 wt%, respectively. In such magmas rich in H2O, the density of the plagioclase phenocrysts is greater than that of the melt, making it unlikely that the plagioclase phenocrysts would float.
Conversely, when phenocrysts are denser than the melt, they should sink and make the lower part of the magma reservoir richer in phenocrysts than the upper part. In this model, the porphyritic magma might erupt after the evacuation of aphyric magma; therefore, the increased volume percentage of plagioclase phenocrysts during the An’ei eruption might be explained more easily. However, this model cannot explain why the pyroxene phenocryst content is nearly constant throughout all the depositional units of the An’ei eruption. Pyroxenes are expected to accumulate in the lower part of the magma reservoir owing to their density being greater than that of the melt, and thus their content should increase as the eruption progresses, similar to that of plagioclase phenocrysts.
It might also be difficult to explain the stepwise increase in the volume percentage of plagioclase phenocrysts from Unit A to the Ash Unit and the explosivity during the series of the An’ei eruption by the above two models (plagioclase phenocrysts’ float or sink), which assume a single magma reservoir. These models also assume that plagioclase phenocrysts and melt are in equilibrium; however, a recent petrological study by Kuritani et al. (2018) indicated that the plagioclase phenocrysts might not be in equilibrium with the aphyric magma (melt), suggesting that the compositional diversity of the An’ei eruption might be generated by mixing of plagioclase-rich porphyritic magmas with aphyric magma from multiple reservoirs. Kuritani et al. (2018) estimated the depth of the porphyritic and aphyric magma reservoirs at 13–18 and 8–10 km, respectively, based on the chemical analyses of the major eruptions in the past 1700 years. Although it should be noted that the depth estimation of the deeper porphyritic magma reservoir has a large error (about 10 km), it is a plausible idea that multiple magma reservoirs with different content of plagioclase phenocrysts are developing at certain depths beneath the summit crater and producing chemical variations in the whole-rock compositions via mixing. Applying this model to the An’ei eruption, the eruption style transition can be explained in the following: most of the aphyric shallow magmas erupted and deposited as Unit A and lava flows in the early stage, whereas porphyritic deep magma ascended to the surface and formed the plagioclase-rich Unit C. The short duration and rapid ascent of the deep magma made the Unit C event the most explosive. However, Unit B is less explosive than Unit A despite the relatively high plagioclase volume percentage of Unit B. It is possible that magma ascended slowly during Unit B event although a certain amount of deep magma was supplied to the shallow part.
Lava flows that effused from the foot of Mt. Mihara during the explosive pyroclastic eruptions provide additional information on the magma-feeding system of the An’ei eruption. A noticeable feature is that plagioclase accumulation was not observed for the lavas. The latest lava (L3) effused almost simultaneously with the Unit C eruption but from a different vent, maintaining its aphyric nature. Moreover, the plagioclase phenocrysts have different textural characteristics between the pyroclasts and the lavas; the plagioclase phenocrysts of the lavas have thick sodic rims, indicating that the lavas experienced conditions of magma storage or ascent that were different from those of the pyroclasts. The detailed process of magma ascent for the lavas is not yet constrained; however, petrological observation suggests that the lava-forming magmas experienced different pathways in the shallow crustal region from those of the magmas that caused the summit explosions. This relationship between the pyroclastic eruptions and the lava flows is different from the explosive–effusive hybrid activities from a single magma reservoir, which is often observed in cone-forming eruptions by basaltic magmas such as the eruptions of Parícutin in Mexico during 1943–1952 (Pioli et al., 2008) and Lathrop Wells volcano in the US of 75–80 ka (Valentine et al., 2005). In these hybrid activities, efficient gas–melt segregation causes moderately explosive behavior as a result of the expansion of the gas-rich part of the magma, while the degassed magma moves laterally and yields lava flows; however, this is not the case for the An’ei eruption. Based on the above discussion of lava effusion during the An’ei eruption, it is reasonable to consider multiple magma reservoirs with degassed and undegassed magmas to explain the variation in the eruptive products. Nevertheless, the volume of the shallow magma reservoir that erupted the lavas (3.1 × 10⁷ m3 in DRE) might have been much larger than that of the magma reservoirs that produced the pyroclastic units (Units A–C, 4.3–13.6 × 10⁶ m3 in DRE) (Table 1). Whether the preceding large volume of lava promoted the rise of the following deep magma that formed Unit C is yet unknown; however, the evacuation of a large volume of magma from the shallow crustal region might have affected the eruptive activity, and further studies are needed to clarify the role of lava flows in the eruption process of the An’ei eruption.
Multiple magma reservoirs might explain the spatiotemporal changes in the petrological features, e.g., content of plagioclase phenocrysts, and variation in eruption styles (less explosive to/and more explosive) of the An’ei eruption. The temporal changes in the chemistry and the explosivity of this type of eruption are similar to those of some mafic and silicic magma systems, where interconnected multiple magma reservoirs (large dykes and sills in mafic systems) are involved in changing the explosivity and products in a series of a single eruptive activity (Cashman and Giordano, 2014; Gansecki et al., 2019). This idea might explain some of the key observations of the An’ei eruption. However, the process via which the aphyric magma was generated from the porphyritic magma has yet to be elucidated, and the depths of the magma reservoirs remain problematic. Although we discussed whether our data are consistent with previously proposed magma system models which assumed plagioclase floating, sinking, or multiple magma reservoirs with different volume percentages of plagioclase, further geochemical data and constraining of the physical conditions of the magma reservoirs, such as H2O content, and more precise estimation of the pressure and temperature from mineralogy, will be crucial to construct a more sophisticated magma system model for the An’ei eruption.
Several types of hazards may be posed by large-scale eruptions at Izu-Oshima, including significant scoria and ash fall, pyroclastic surges in the caldera, and lava flows from flank eruptions. In addition, on the basis of our geological data, ballistic ejecta is also likely to be a hazard that cannot be ignored because volcanic bombs with diameters of more than 10 cm crossed the caldera rim and reached near the eastern coast of the island during the Unit C period. Even though very few people inhabit the eastern region of the island, other locations near the coast are populated. The tephra deposits distributed all over the island during the ash eruption period of the An’ei eruption indicate that wind sometimes blows in directions other than east above the island. If widely spread tephra fallout, including large ballistic bombs, are ejected in the next eruption, there is a possibility that inhabitants and buildings will be severely damaged by such tephra fall and bombs.
In terms of preparation for future eruptions, geophysical and geochemical monitoring before or/and during an eruption will be crucial. In large-scale eruptions, magma might be supplied from multiple magma reservoirs, as hypothesized for the An’ei eruption. If magma reservoirs with different volume percentages of plagioclase phenocrysts are located in different places, changes in the area and depth of seismic activity and ground deformation source, which might be represented by the migration of magma after weak activity, such as during the Unit A eruption, might be captured by geophysical observations. Furthermore, monitoring the geochemistry and the content of plagioclase phenocrysts of eruptive products will be fundamental for evaluating the involvement of different parts of the magma system and assessing the possibility of the eruption being more explosive.
We have reconstructed the eruptive sequence of the 1777–1792 An’ei eruption of Izu-Oshima based on the stratigraphy of the eruptive deposits, the chemical characteristics, and the historical records. The scoria layer can be divided into Units A, B, and C. Unit A is distributed to the east and is the product of several explosive eruptions, including a sub-Plinian event, from August 1777 to November 1778. Unit B was deposited to the north by a small sub-Plinian event that followed the Unit A period. The eruption evolved into a peak sub-Plinian stage, which formed Unit C to the east. Units B and C were both formed during a short period from early to mid-November 1778. Lava was effused from the base of the scoria cone in the early stage of Unit A in April and November 1778. Activity at the summit crater resumed in 1783 with an ash eruption and pyroclastic surges and it continued until 1792. The ash eruption changed temporarily into a slightly more intense eruption, ejecting spatter and scoria. The volumes of Units A, B, and C were estimated at 1.0–4.3 × 10⁷, 0.6–4.5 × 10⁶, and 1.3–3.2 × 10⁷ m3, respectively, and the associated column heights were estimated at 8–11, 3–10, and 9–12 km, respectively. Chemical analyses of the eruptive products suggest that the amount of Al2O3 and the volume percentage of plagioclase phenocrysts in the magma increased throughout the eruption. The eruption, therefore, changed from several weak explosions (Unit A), involving aphyric magma, to a more intense explosion (Unit C), erupting porphyritic magma with higher Al2O3 content and a greater volume percentage of plagioclase phenocrysts. The lava flows have different petrological features from those of the explosive scoria eruptions. The existence of multiple magma reservoirs is proposed to explain the abrupt transition in the volume percentage of plagioclase phenocrysts and the change in explosivity during the An’ei eruption of Izu-Oshima. The relationship between eruption style and magma type, and the causes of their temporal change as observed in the An’ei eruption, are vitally important for understanding the eruptive processes, surface phenomena, and hazards of not only large-scale explosive eruptions of Izu-Oshima volcano but also those associated with other episodes of explosive basaltic volcanism on Earth.
The raw data supporting the conclusion of this article will be made available by the authors, without undue reservation.
YI carried out geological field survey, analyzed the chemical compositions of the eruptive products, and wrote the first draft of the manuscript, which was then revised by all the authors. FM took part in the field survey and AY participated in the chemical analyses. All authors contributed to the article and approved the submitted version.
This work was supported by the Integrated Program for Next-Generation Volcano Research and Human Resource Development (INeVRH) “Theme C” of the Ministry of Education, Culture, Sports, Science, and Technology of Japan (MEXT) and by the Earthquake and Volcano Hazards Observation and Research Program of MEXT (ERI03).
We would like to thank N. Hokanishi for her help in the X-ray fluorescence and electron probe microanalyzer analyses. Constructive comments and suggestions by K. Mannen were very helpful for improving our manuscript. We appreciate the editorial handling by H. M. Wright and valuable suggestions by two reviewers. We thank James Buxton MSc, from Edanz (https://jp.edanz.com/ac), for editing a draft of this manuscript.
The authors declare that the research was conducted in the absence of any commercial or financial relationships that could be construed as a potential conflict of interest.
All claims expressed in this article are solely those of the authors and do not necessarily represent those of their affiliated organizations, or those of the publisher, the editors and the reviewers. Any product that may be evaluated in this article, or claim that may be made by its manufacturer, is not guaranteed or endorsed by the publisher.
The Supplementary Material for this article can be found online at: https://www.frontiersin.org/articles/10.3389/feart.2023.1172615/full#supplementary-material
SUPPLEMENTARY FIGURE S1 | Approximate timeline of the An’ei eruption inferred by Tsukui et al. (2009) based on historical documents.
SUPPLEMENTARY FIGURE S2 | Photographs indicating the stratigraphic relationship between lavas and pyroclastic deposits. The locations of the outcrops are shown in Figure 2.
SUPPLEMENTARY FIGURE S3 | Harker diagrams of major elements other than Al2O3 versus SiO2 plot of whole-rock and glass chemical compositions.
SUPPLEMENTARY FIGURE S4 | Open nicol thin section images manually traced for phenocrysts and bubbles to obtain the mode composition. The areas for phenocryst and bubble analyses are indicated by orange and black lines, respectively. Bubbles of one scoria sample (T2 of Unit A) were traced in the nearly full area, and bubbles of the other scoria samples were traced in the area of 0.5 × 0.5 cm2 of thin section. The areas of bubble analyses of lava are different among the samples, from 0.5 × 0.5 cm2 to the nearly full area of thin sections.
SUPPLEMENTARY FIGURE S5 | Core compositions of the plagioclase phenocrysts in the scoria and lava.
SUPPLEMENTARY TABLE S1 | Input parameters for calculating discharge rates and durations of Unit A, B, and C using the model of Degruyter and Bonadonna (2012) and Woodhouse et al. (2013). Column heights and wind velocities based on the model of Carey and Sparks (1986) and the source temperature of 1100 °C assumed from Fujii et al. (1988) and Kawanabe (1991) are used for calculation.
SUPPLEMENTARY TABLE S2 | Outcrops and stratigraphic levels of thin section samples.
SUPPLEMENTARY TABLE S3 | Thickness and Maximum clast size data of the outcrops of Units A–C.
SUPPLEMENTARY TABLE S4 | Whole-rock chemical compositions for scoria samples of Units A–C and Ash Unit, and lava samples of L1–L3 and Lx (in wt.%). For the samples with bold red analysis number (see the furthest right column), secondary standards were analyzed during the analysis of ejecta. Analysis data of secondary standards for each analysis number and relative errors of analyzed elements (Hokanishi et al. 2015) are listed below the data of scoria and lava. Latitude and longitude of outcrops are described in Supplementary Table S3.
SUPPLEMENTARY TABLE S5 | Major element chemical compositions of groundmass glass and glass inclusions in plagioclase phenocrysts for scoria samples of Units A–C (in wt.%). Relative errors from Iwahashi et al. (2020) are listed in the bottom line. Latitude and longitude of outcrops are described in Supplementary Table S3.
Ablay, G. J., Ernst, G. G. J., Marti, J., and Sparks, R. S. J. (1995). The ∼2 ka subplinian eruption of Montaña Blanca, Tenerife. Bull. Volcanol. 57, 337–355. doi:10.1007/BF00301292
Alfano, F., Bonadonna, C., Volentik, A. C. M., Connor, C. B., Watt, S. F. L., Pyle, D. M., et al. (2011). Tephra stratigraphy and eruptive volume of the May, 2008, Chaitén eruption, Chile. Bull. Volcanol. 73, 613–630. doi:10.1007/s00445-010-0428-x
Allen, S. R., and McPhie, J. (2003). Phenocryst fragments in rhyolitic lavas and lava domes. J. Volcanol. Geotherm. Res. 126, 263–283. doi:10.1016/S0377-0273(03)00151-3
Aramaki, S., and Fujii, T. (1988). Petrological and geological model of the 1986-1987 eruption of Izu-Oshima Volcano (in Japanese with English abstract). Bull. Volcanol. Soc. Jpn. 33, S297–S306. doi:10.18940/kazanc.33.SPCL_S297
Arzilli, F., La Spina, G., Burton, M. R., Polacci, M., Le Gall, N., Hartley, M. E., et al. (2019). Magma fragmentation in highly explosive basaltic eruptions induced by rapid crystallization. Nat. Geosci. 12, 1023–1028. doi:10.1038/s41561-019-0468-6
Bamber, E. C., Arzilli, F., Polacci, M., Hartley, M. E., Fellowes, J., Di Genova, D., et al. (2020). Pre- and syn-eruptive conditions of a basaltic plinian eruption at Masaya volcano, Nicaragua: the Masaya triple layer (2.1 ka). J. Volcanol. Geotherm. Res. 392, 106761. doi:10.1016/j.jvolgeores.2019.106761
Bonadonna, C., and Costa, A. (2012). Estimating the volume of tephra deposits: A new simple strategy. Geology 40, 415–418. doi:10.1130/G32769.1
Bonadonna, C., and Houghton, B. F. (2005). Total grain-size distribution and volume of tephra-fall deposits. Bull. Volcanol. 67, 441–456. doi:10.1007/s00445-004-0386-2
Bonadonna, C., Cioni, R., Pistolesi, M., Connor, C., Scollo, S., Pioli, L., et al. (2013). Determination of the largest clast sizes of tephra deposits for the characterization of explosive eruptions: A study of the IAVCEI commission on tephra hazard modelling. Bull. Volcanol. 75, 680. doi:10.1007/s00445-012-0680-3
Carey, S., and Sparks, R. S. J. (1986). Quantitative models of the fallout and dispersal of tephra from volcanic eruption columns. Bull. Volcanol. 48, 109–125. doi:10.1007/BF01046546
Cashman, K. V., and Giordano, G. (2014). Calderas and magma reservoirs. J. Volcanol. Geotherm. Res. 288, 28–45. doi:10.1016/j.jvolgeores.2014.09.007
Cashman, K. V., and Marsh, B. D. (1988). Crystal size distribution (CSD) in rocks and the kinetics and dynamics of crystallization II: makaopuhi lava lake. Contrib. Mineral. Petrol. 99, 292–305. doi:10.1007/BF00375363
Coltelli, M., Del Carlo, P., and Vezzoli, L. (1998). Discovery of a Plinian basaltic eruption of Roman age at Etna volcano, Italy. Geology 26, 1095–1098. doi:10.1130/0091-7613(1998)026<1095:DOAPBE>2.3.CO;2
Costantini, L., Houghton, B. F., and Bonadonna, C. (2010). Constraints on eruption dynamics of basaltic explosive activity derived from chemical and microtextural study: the example of the fontana lapilli plinian eruption, Nicaragua. J. Volcanol. Geotherm. Res. 189, 207–224. doi:10.1016/j.jvolgeores.2009.11.008
Degruyter, W., and Bonadonna, C. (2012). Improving on mass flow rate estimates of volcanic eruptions. Geophys. Res. Lett. 39, 1–14. doi:10.1029/2012GL052566
Endo, K., Shinkawa, K., Mitsugi, F., Miyano, Y., Yamaguchi, M., Tada, A., et al. (1994). Sequence of the 1777-1792 An’ei eruption of Izu-Oshima volcano based on pollen analysis (in Japanese). Abstr. Jpn. Earth Planet. Sci. Jt. Meet. 358.
Fierstein, J., and Nathenson, M. (1992). Another look at the calculation of fallout tephra volumes. Bull. Volcanol. 54, 156–167. doi:10.1007/BF00278005
Foshag, W. F., and González-Reyna, J. (1956). Birth and development of Parícutin volcano Mexico. U.S. Geol. Surv. Bull. 965, 355–489. Available at: https://pubs.usgs.gov/bul/0965d/report.pdf.
Fujii, T., Aramaki, S., Kaneko, T., Ozawa, K., Kawanabe, Y., and Fukuoka, T. (1988). Petrology of the lavas and ejecta of the november, 1986 eruption of Izu-Oshima Volcano (in Japanese with English abstract). Bull. Volcanol. Soc. Jpn. 33, S234–S254. doi:10.18940/kazanc.33.SPCL_S234
Gansecki, C., Lopaka Lee, R., Shea, T., Lundblad, S. P., Hon, K., and Parcheta, C. (2019). The tangled tale of Kīlauea's 2018 eruption as told by geochemical monitoring. Science 366, eaaz0147. doi:10.1126/science.aaz0147
García, O., Bonadonna, C., Martí, J., and Pioli, L. (2012). The 5,660 yBP Boquerón explosive eruption, Teide-Pico Viejo complex, Tenerife. Bull. Volcanol. 74, 2037–2050. doi:10.1007/s00445-012-0646-5
Hamada, M., Kawamoto, T., Takahashi, E., and Fujii, T. (2011). Polybaric degassing of island arc low-K tholeiitic basalt magma recorded by OH concentrations in Ca-rich plagioclase. Earth Planet. Sci. Lett. 308, 259–266. doi:10.1016/j.epsl.2011.06.005
Hamada, M., Okayama, Y., Kaneko, T., Yasuda, A., and Fujii, T. (2014). Polybaric crystallization differentiation of H 2 O-saturated island arc low-K tholeiite magmas: A case study of the Izu-Oshima volcano in the Izu arc. Earth, Planets Sp. 66, 15–10. doi:10.1186/1880-5981-66-15
Hayakawa, Y. (1985). Pyroclastic geology of towada volcano. Bull. Earthq. Res. Inst. Univ. Tokyo 60, 507–592.
Hayakawa, Y. (1993). A proposal of eruption magnitude scale (in Japanese). Bull. Volcanol. Soc. Jpn. 38, 223–226. doi:10.18940/kazan.38.6_223
Hokanishi, N., Yasuda, A., and Nakada, S. (2015). Major and trace element analysis of silicate rocks using fused glass beads with an X-ray fluorescence spectrometer (in Japanese with English abstract). Bull.Earthq.Res.Inst. Univ.Tokyo 90, 1–14. Available at: http://www.eri.u-tokyo.ac.jp/BERI/index_e.html.
Houghton, B. F., Wilson, C. J. N., Del Carlo, P., Coltelli, M., Sable, J. E., and Carey, R. (2004). The influence of conduit processes on changes in style of basaltic plinian eruptions: tarawera 1886 and Etna 122 BC. J. Volcanol. Geotherm. Res. 137, 1–14. doi:10.1016/j.jvolgeores.2004.05.009
Ishizuka, O., Geshi, N., Kawanabe, Y., Ogitsu, I., Taylor, R. N., Tuzino, T., et al. (2014). Long-distance magma transport from arc volcanoes inferred from the submarine eruptive fissures offshore Izu-Oshima volcano, Izu-Bonin arc. J. Volcanol. Geotherm. Res. 285, 1–17. doi:10.1016/j.jvolgeores.2014.08.006
Ishizuka, O., Taylor, R. N., Geshi, N., Oikawa, T., Kawanabe, Y., and Ogitsu, I. (2015). Progressive mixed-magma recharging of Izu-Oshima volcano, Japan: A guide to magma chamber volume. Earth Planet. Sci. Lett. 430, 19–29. doi:10.1016/j.epsl.2015.08.004
Isshiki, N. (1984a). “Geology of the Oshima district (in Japanese with English abstract),” in Quadrang. Ser. scale 150,000 (Geol. Surv. Japan), 133p.
Isshiki, N. (1984b). Records of activity of Oshima Volcano in historic times (in Japanese). Bull. Geol. Surv. Jpn. 35, 477–499.
Iwahashi, K., Ishibashi, H., Yasuda, A., and Hokanishi, N. (2020). Evidence for a ‘third’ endmember of the Unzen 1991–1995 eruption from amphibole thermometry and crystal clots. J. Volcanol. Geotherm. Res. 396, 106833. doi:10.1016/j.jvolgeores.2020.106833
Kawanabe, Y. (1991). Petrological evolution of Izu Oshima Volcano (in Japanese with English abstract). Bull. Volcanol. Soc. Jpn. 36, 297–310. doi:10.18940/kazan.36.2_297
Kawanabe, Y. (1998). “Geological map of Izu-Oshima Volcano (in Japanese),” in Geol. Map volcanoes, scale 125,000 (Geol. Surv. Japan).
Koyama, M., and Hayakawa, Y. (1996). Syn- and post-caldera eruptive history of Izu Oshima Volcano based on tephra and loess stratigraphy. J. Geogr. (Chigaku Zasshi) 105, 133–162. doi:10.5026/jgeography.105.2_133
Kuritani, T., Yamaguchi, A., Fukumitsu, S., Nakagawa, M., Matsumoto, A., and Yokoyama, T. (2018). Magma plumbing system at Izu-Oshima Volcano, Japan: constraints from petrological and geochemical analyses. Front. Earth Sci. 6, 1–14. doi:10.3389/feart.2018.00178
Maeno, F., Nagai, M., Nakada, S., Burden, R. E., Engwell, S., Suzuki, Y., et al. (2014). Constraining tephra dispersion and deposition from three subplinian explosions in 2011 at Shinmoedake volcano, Kyushu, Japan. Bull. Volcanol. 76, 823. doi:10.1007/s00445-014-0823-9
Mikada, H., Watanabe, H., and Sakashita, S. (1997). Evidence for subsurface magma bodies beneath Izu-Oshima volcano inferred from a seismic scattering analysis and possible interpretation of the magma plumbing system of the 1986 eruptive activity. Phys. Earth Planet. Inter. 104, 257–269. doi:10.1016/S0031-9201(97)00060-5
Misonou, Y., Takahashi, M., Yasui, M., and Hayashida, K. (2005). Whole-rock chemical composition of lava and ejecta of the an-ei eruption, Izu-Oshima Volcano (in Japanese). Volcanol. Soc. Jpn. Fall Meet. 2005, 42. doi:10.18940/vsj.2005.0_42
Misonou, Y., Takahashi, M., and Yasui, M. (2007). Surface morphology of the an-ei basaltic lava flow in the Izu-Oshima Volcano (in Japanese with English abstract). Proc. Inst. Nat. Sci. Nihon Univ., 97–116.
Miyabuchi, Y., Hanada, D., Niimi, H., and Kobayashi, T. (2013). Stratigraphy, grain-size and component characteristics of the 2011 Shinmoedake eruption deposits, Kirishima Volcano, Japan. J. Volcanol. Geotherm. Res. 258, 31–46. doi:10.1016/j.jvolgeores.2013.03.027
Miyaji, N., Kan’no, A., Kanamaru, T., and Mannen, K. (2011). High-resolution reconstruction of the Hoei eruption (AD 1707) of Fuji volcano, Japan. J. Volcanol. Geotherm. Res. 207, 113–129. doi:10.1016/j.jvolgeores.2011.06.013
Nakamura, K. (1964). Volcano-stratigraphic study of ôshima Volcano, Izu. Bull. Earthq. Res. Inst. Univ. Tokyo 42, 649–728.
Nakano, S., and Yamamoto, T. (1991). Chemical variations of magmas at Izu-Oshima volcano, Japan: plagioclase-controlled and differentiated magmas. Bull. Volcanol. 53, 112–120. doi:10.1007/BF00265416
Pérez, W., and Freundt, A. (2006). “The youngest highly explosive basaltic eruptions from Masaya caldera (Nicaragua): stratigraphy and hazard assessment,” in Volcanic hazards in Central America. Editors W. I. Rose, G. J. S. Bluth, M. J. Carr, J. W. Ewert, L. C. Patino, and J. W. Vallance (Geological Society of America), 0. doi:10.1130/2006.2412(10
Pioli, L., Erlund, E., Johnson, E., Cashman, K., Wallace, P., Rosi, M., et al. (2008). Explosive dynamics of violent strombolian eruptions: the eruption of Parícutin volcano 1943-1952 (Mexico). Earth Planet. Sci. Lett. 271, 359–368. doi:10.1016/j.epsl.2008.04.026
Pyle, D. M. (1989). The thickness, volume and grainsize of tephra fall deposits. Bull. Volcanol. 51, 1–15. doi:10.1007/BF01086757
Pyle, D. M. (2015). Sizes of volcanic eruptions. Second Edi. H. Sigurdsson Elsevier Inc. doi:10.1016/b978-0-12-385938-9.00013-4
Rose, W. I., Self, S., Murrow, P. J., Bonadonna, C., Durant, A. J., and Ernst, G. G. J. (2008). Nature and significance of small volume fall deposits at composite volcanoes: insights from the october 14, 1974 Fuego eruption, Guatemala. Bull. Volcanol. 70, 1043–1067. doi:10.1007/s00445-007-0187-5
Rossi, E., Bonadonna, C., and Degruyter, W. (2019). A new strategy for the estimation of plume height from clast dispersal in various atmospheric and eruptive conditions. Earth Planet. Sci. Lett. 505, 1–12. doi:10.1016/j.epsl.2018.10.007
Sable, J. E., Houghton, B. F., Del Carlo, P., and Coltelli, M. (2006). Changing conditions of magma ascent and fragmentation during the Etna 122 BC basaltic plinian eruption: evidence from clast microtextures. J. Volcanol. Geotherm. Res. 158, 333–354. doi:10.1016/j.jvolgeores.2006.07.006
Sable, J. E., Houghton, B. F., Wilson, C., and Carey, R. (2009). “Eruption mechanisms during the climax of the Tarawera 1886 basaltic Plinian eruption inferred from microtextural characteristics of the deposits,” in Studies in Volcanology: The legacy of george walker. Editors T. Thordarson, S. Self, G. Larsen, S. K. Rowland, and Á. Höskuldsson (Publications of IAVCEI 2), 129–154.
Sarna-Wojcicki, A. M., Shipley, S., Waitt, R. B., Dzurisin, D., and Wood, S. H. (1981). Areal distribution, thickness, mass, volume and grain size of air-fall ash from the six major eruptions of 1980. U. S. Geol. Surv. Prof. Pap. 1250, 577–600.
Sides, I. R., Edmonds, M., Maclennan, J., Swanson, D. A., and Houghton, B. F. (2014). Eruption style at Kilauea Volcano in Hawai’i linked to primary melt composition. Nat. Geosci. 7, 464–469. doi:10.1038/ngeo2140
Takeuchi, S., Toshida, K., Miura, D., Ito, H., and Uesawa, S. (2021). Relationships between magmatic properties and eruption magnitude of explosive eruptions at Japanese arc volcanoes during the last one hundred thousand years. J. Volcanol. Geotherm. Res. 419, 107345. doi:10.1016/j.jvolgeores.2021.107345
Tazawa, K. (1980). Activity of Izu-Oshima Volcano during 10,000 Years prior to the caldera formation: A volcano-stratigraphic approach (in Japanese with English abstract). Bull. Volcanol. Soc. Jpn. 25, 137–170. doi:10.18940/kazanc.25.3_137
Tazawa, K. (1981). Activity of Izu-Oshima Volcano during 10,000 Years prior to the caldera formation: A volcano-stratigraphic approach Ⅱ (in Japanese with English abstract). Bull. Volcanol. Soc. Jpn. 26, 249–261. doi:10.18940/kazanc.26.4_249
Togashi, S., and Isshiki, N. (1983). 14C age of wood debris in a volcaniclastic flow deposit of the older edifice of pre-caldera stratovolcano of Oshima Volcano, the Izu islands (in Japanese). Bull. Volcanol. Soc. Jpn. 28, 409–410. doi:10.18940/kazanc.28.4_409
Tsukui, M., Dangi, K., Sato, S., and Hayashi, K. (2009). Izu-Oshima volcano: precise sequence and mitigation Program of the latest three large-scale eruptions revealed by historical documents (in Japanese with English abstract). Bull. Volcanol. Soc. Jpn. 54, 93–112. doi:10.18940/kazan.54.3_93
Valentine, G. A., Krier, D., Perry, F. V., and Heiken, G. (2005). Scoria cone construction mechanisms, Lathrop Wells volcano, southern Nevada, USA. Geology 33, 629–632. doi:10.1130/g21459ar.1
Walker, G. P. L., Self, S., and Wilson, L. (1984). Tarawera 1886, New Zealand - a basaltic plinian fissure eruption. J. Volcanol. Geotherm. Res. 21, 61–78. doi:10.1016/0377-0273(84)90016-7
Wehrmann, H., Bonadonna, C., Freundt, A., and Houghton, B. F. (2006). “Fontana tephra: A basaltic plinian eruption in Nicaragua,” in Volcanic hazards in Central America. Editors W. I. Rose, G. J. S. Bluth, M. J. Carr, J. W. Ewert, L. C. Patino, and J. W. Vallance (Geol. Soc. Am. Spec. Publ.), 209–223.
Williams, S. N. (1983). Comment and Reply on ‘Plinian airfall deposits of basaltic composition. Geology 11, 617. doi:10.1130/0091-7613(1983)11<617a:CAROPA>2.0.CO;2
Woodhouse, M. J., Hogg, A. J., Phillips, J. C., and Sparks, R. S. J. (2013). Interaction between volcanic plumes and wind during the 2010 Eyjafjallajökull eruption, Iceland. J. Geophys. Res. Solid Earth 118, 92–109. doi:10.1029/2012JB009592
Yamamoto, T. (2006). Pyroclastic density current from the caldera-forming eruption of Izu-Oshima Volcano, Japan: restudy of the Sashikiji 2 member based on stratigraphy, lithofacies, and eruption age (in Japanese with English abstract). Bull. Volcanol. Soc. Jpn. 51, 257–271. doi:10.18940/kazan.51.4_257
Keywords: basaltic explosive eruption, sub-Plinian, lava flow, tephra stratigraphy, Izu-Oshima volcano
Citation: Ikenaga Y, Maeno F and Yasuda A (2023) Temporal change in eruption style during the basaltic explosive An’ei eruption of the Izu-Oshima volcano, Japan: insights from stratigraphy and chemical composition analyses. Front. Earth Sci. 11:1172615. doi: 10.3389/feart.2023.1172615
Received: 23 February 2023; Accepted: 05 September 2023;
Published: 15 September 2023.
Edited by:
Heather Michelle Wright, United States Geological Survey (USGS), United StatesReviewed by:
Hannah Maeve Buckland, Swansea University, United KingdomCopyright © 2023 Ikenaga, Maeno and Yasuda. This is an open-access article distributed under the terms of the Creative Commons Attribution License (CC BY). The use, distribution or reproduction in other forums is permitted, provided the original author(s) and the copyright owner(s) are credited and that the original publication in this journal is cited, in accordance with accepted academic practice. No use, distribution or reproduction is permitted which does not comply with these terms.
*Correspondence: Yuya Ikenaga, aWtlbmFnYUBlcmkudS10b2t5by5hYy5qcA==
Disclaimer: All claims expressed in this article are solely those of the authors and do not necessarily represent those of their affiliated organizations, or those of the publisher, the editors and the reviewers. Any product that may be evaluated in this article or claim that may be made by its manufacturer is not guaranteed or endorsed by the publisher.
Research integrity at Frontiers
Learn more about the work of our research integrity team to safeguard the quality of each article we publish.