 Viktor Bertrandsson Erlandsson1
 Phillip Gopon1*
 Helene Waldl2
 David Misch1
 Rainer Ellmies3Frank Melcher1
- 1Department of Applied Geosciences and Geophysics, Montanuniversität Leoben, Leoben, Austria
- 2Christian Doppler Laboratory for Advanced Coated Cutting Tools, Montanuniversität Leoben, Leoben, Austria
- 3Gecko Namibia, Swakopmund, Namibia
Sphalerite from the sediment-hosted Dolostone Ore Formation (DOF) Cu-Co-Zn deposit, in northwestern Namibia, has previously been shown to contain extremely high concentrations of the critical metal Co (up to 1 wt%). These concentrations are the highest reported in sphalerite to date, and the how and why of sphalerite being able to incorporate such high concentrations of Co are poorly understood. We use correlative electron probe microanalysis, electron backscattered diffraction, and atom probe to reconstruct the likely incorporation mechanisms and modes of occurrence of such high Co concentrations in natural sphalerite. While over twenty samples were studied, the comprehensive analytical workflow was executed on one representative sample to gain a detailed understanding of Co enrichment. The sulfides of the studied sample are Co-rich pyrite, chalcopyrite, Co-rich sphalerite, linnaeite, cobaltpentlandite, and cobaltite, mentioned in order of abundance. Detailed petrography of these sulfides indicates that they formed through three stages during the main Cu-Co-Zn ore stage of the DOF. Cobalt was initially contained in pyrite that grew during Ore Stage 1 and was later affected by oxidizing fluids (Ore Stage two). This led to remobilization and growth of linnaeite (Co2+Co3+2S4). A later change in fO2 (Ore Stage three) led to the breakdown of linnaeite and the further growth of accessory cobaltite along with the Co-rich sphalerite and chalcopyrite. The hyper-enriched Co-sphalerite then is the last major sink for Co in the DOF deposit. A low Fe and Co and high Zn sub-grain boundary network within the Co-rich sphalerite was identified by EPMA and EBSD. This sub-grain network is believed to have formed during a later, secondary metamorphic stage (Cu-Zn (-Pb) Ore Stage 4), which developed during ductile deformational mineralization styles such as pressure shadows and veins. Our APT data reconstructions show no evidence for Co-inclusions within the Co-sphalerite, and spatial ion correlation analyses of the data suggest that Co occurs in the sphalerite through simple substitution of Zn. This study demonstrates that sphalerite may contain significant concentrations of the Co through simple substitution, potentially representing an important non-traditional Co source in future critical metal exploration.
1 Introduction
The increasing complexity of technologies related to communication, mobility, renewable energy, etc., poses a great demand for an increasingly complex set of raw materials (for our society). Cobalt is one of those increasingly sought-after critical metals due to its crucial role in large storage capacity batteries. Approximately 49% of the world’s Co goes into the production of electric-car batteries (Alves Dias et al., 2018), while, as of 2019, the Central African Copperbelt (CACB) is responsible for approximately 68% of the global Co production (European Commission, 2020; USGS, 2020). This combination of importance and source limitation led to Co being identified as a critical raw material by the EU and US authorities (European Commission, 2020; USGS, 2022). Sphalerite has been shown to have the potential to host a wide range of minor and trace elements, including several critical elements such as Co, Ge, Ga, In, and Sb (e.g., Cook et al., 2009; Lockington et al., 2014; Frenzel et al., 2016). Analyses of sphalerite from different ore deposit types have demonstrated that deposit-specific enrichment of certain critical elements occurs. For example, Ga and Ge has been detected in carbonate-hosted Pb-Zn deposits (Bonnet et al., 2016; Frenzel et al., 2016; Marsh et al., 2016; Liu et al., 2022), while In is commonly enriched in polymetallic vein deposits (Murakami and Ishihara, 2013; Frenzel et al., 2016; Foltyn et al., 2020). Sphalerites from sediment-hosted Cu-Co deposits have not yet been well studied in regards to trace elements, with the DOF sphalerite being one of the first examples of hyper-enrichment in such styles of mineralizations (Bertrandsson Erlandsson et al., 2022).
While Fe2+ has been shown to readily substitute for Zn2+ in sphalerite (1–10 wt%; Cook et al., 2009; Lockington et al., 2014; Frenzel et al., 2016), Co2+ has only been recognized to occur in comparably minor concentrations of hundreds to just above thousands of µg/g in sphalerite despite their similar ionic radii (e.g., Intiomale and Oosterbosch, 1974; Cook et al., 2009). The highest Co concentrations in sphalerite have been reported in the sediment-hosted Dolostone Ore Formation (DOF) Cu-Co mineralization in northwestern Namibia (up to 1.5 wt%; Bertrandsson Erlandsson et al., 2022). These findings spark questions as to why and how such abnormally high Co concentrations may be incorporated. While the laser ablation inductively coupled mass spectrometry technique (LA-ICP-MS) that was used in the original study is able to quickly and precisely measure trace elements, the large analytical spot size (typically 20–100 µm) does not allow for a detailed understanding of the incorporation mechanisms.
A combination of electron microprobe microanalysis (EPMA), electron backscattered diffraction (EBSD), and atom probe tomography (APT) was applied to achieve a better understanding of how Co occurs within the deposit, is distributed within the individual crystals, and is distributed at the atomic scale specifically in sphalerite. EPMA enables higher resolution mapping of major and minor elements in the sphalerite to see if Co is homogenously distributed throughout the Co-rich sphalerite crystals, whilst APT allows to investigate if Co occurs as nano-inclusions or homogenously distributed within the lattice. The application of APT has recently shown to be a powerful tool to determine the distribution of e.g., Cu and Ge in sphalerite (Fougerouse et al., 2023). The techniques established by Gopon et al. (2019a) may be used to visualize the atomic scale associations between the major, minor, and trace elements and use these to elucidate if a coupled or simple substitution mechanism is responsible for the high Co concentrations in the DOF sphalerite crystals.
2 Geological setting
2.1 Regional geology
The Dolostone Ore Formation (DOF) mineralization is hosted in the Ombombo Subgroup of the Neoproterozoic Damara Supergroup (Allen, 2016). The Damara Supergroup sediments represent a succession from a rift basin to carbonate platform, starting with fluvial siliciclastics, grading into marine shales, siltstones, and carbonates. The basal Nosib Group sediments were deposited in grabens formed during the break-up of Rodinia and are comprised of arkosic and felspathic sandstones with some interbedded conglomerates that uncomfortably overly the Paleoproterozoic basement (Guj, 1970; Porada, 1989; Miller, 2008; Allen, 2016). Overlying the Nosib Group is the Ombombo Subgroup, the basal member of the Otavi Group, composed of cyclical marine fine-grained siliciclastics and carbonates. Within the DOF area, the Ombombo Subgroup sediments are predominantly composed of calcareous shales and siltstones, interbedded with minor sandstones and carbonates (Hoffman and Halverson, 2008; Miller, 2008; Allen, 2016). The Ombombo Subgroup is overlain by the Abenab Subgroup, which in the DOF area is present as the Chuos Formation diamictite and Rasthof Formation cap-carbonates (Hoffmann and Prave, 1996; Hoffman, 2011; Allen, 2016).
The DOF mineralization is tectonostratigraphically situated within the Eastern Foreland Zone within the Kaoko Belt, which is the NE-SW trending branch of the metamorphic belts formed during the Damara orogeny (Goscombe et al., 2005). The Kaoko Belt formed through two main orogenic phases: the 590–535 Ma Kaoko Phase and the 555–505 Ma Damara Phase (Goscombe et al., 2003; Goscombe et al., 2017). The Eastern Foreland Zone represents the lowest grade metamorphic rocks within the Kaoko Belt, with temperature estimates ranging from 300°C–400°C (Guj, 1970; Foster et al., 2009).
2.2 Geology of the dolostone ore formation mineralization
The sediment-hosted DOF is a Cu-Co-Zn mineralization horizon within a siltstone-shale-carbonate succession of the Ombombo Subgroup in the NW-SE trending Ombazu Trough (Figure 1). The mineralized DOF horizon is traced for at least 43 km along strike and dips 35°–70° to the north with a thickness of <1–15 m. The variation in dip is due to folding caused by the Damaran orogeny (Bertrandsson Erlandsson et al., 2022). The main sulfides of the DOF mineralization are, in order of abundance, pyrite, chalcopyrite, sphalerite, pyrrhotite, and linnaeite with minor cobaltpentlandite and accessory galena and cobaltite (Bertrandsson Erlandsson et al., 2022). The main Co (-Cu-Zn) mineralization is hosted in altered siltstones that are predominately comprised of stilpnomelane, ankerite to Fe-dolomite, siderite, and quartz, with lesser amounts of white mica and chlorite. Ore Stage one mineralization resulted in more classical sediment-hosted mineralization styles, with disseminated sulfides, pyrite nodules, and polysulfide clusters (see Bertrandsson Erlandsson et al., 2022 for full description of the mineralization stages). There is a fourth mineralization style which is attributed to Ore Stage one, referred to as “DOF events”; these are vein-like features that show both brittle and ductile textures and are believed to have been affected by both main mineralization stages (Bertrandsson Erlandsson et al., 2022). Stage one was initially divided into two sub-stages (metamorphic stage I and II) by Bertrandsson Erlandsson et al. (2022), where pyrite was proposed to pre-date the Cu and Zn mineralization of Ore Stage one. Ore Stage one is responsible for the main Co-mineralization but can be texturally subdivided into three separate stages (Figure 3), which will be further discussed herein.
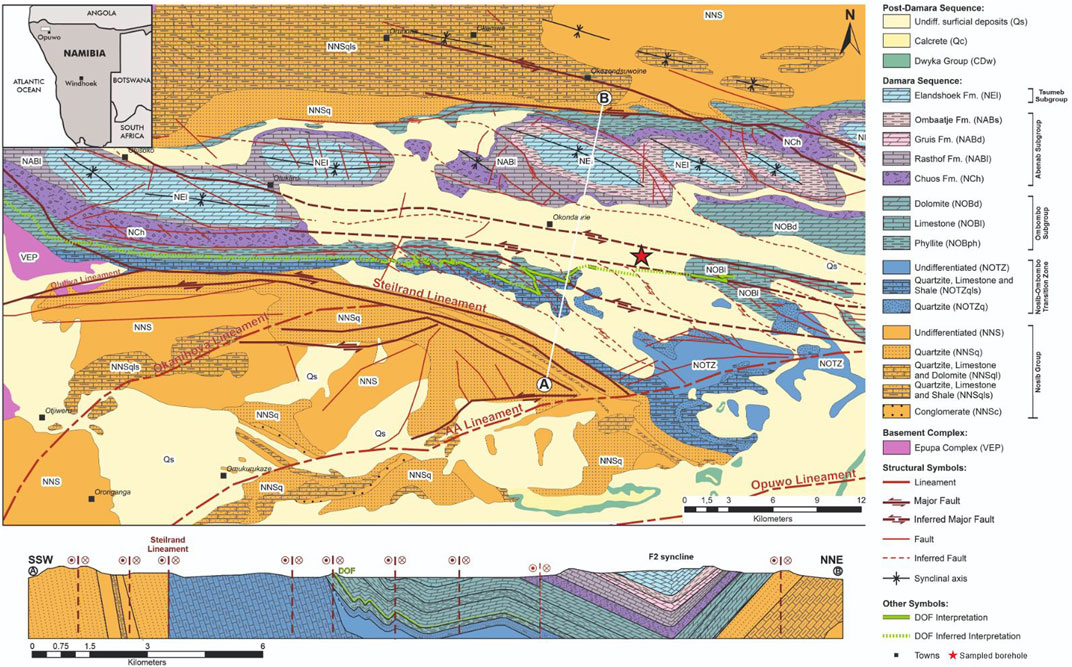
FIGURE 1. Local geological map and schematic geological cross-section (from the A and B symbols on the map) of the Dolostone Ore Formation (DOF) Co-Cu-Zn mineralization (modified after Bertrandsson Erlandsson et al., 2022; and references therein). The borehole from which the investigated sample is from is marked out with a red star.
Ore Stage two is dominated by vein-type mineralization and sulfide mineralization within pressure-shadows and lacks substantial Co-phases (see Bertrandsson Erlandsson et al., 2022 for full description of the mineralization stages). Not only are discrete Co-phases predominantly attributed to the Ore Stage one mineralization, but Ore Stage one pyrite, chalcopyrite, and sphalerite also show elevated Co concentrations compared to the Co-poor Ore Stage two sulfides. Sphalerite from Ore Stage one contains between 5,186–10,568 μg/g Co, compared to 38–1,258 μg/g Co in Ore Stage two sphalerite (Bertrandsson Erlandsson et al., 2022). Sulfides from both stages commonly occur intergrown, with sphalerite frequently containing chalcopyrite inclusions (Figure 3B). The sphalerite geothermometer by Frenzel et al. (2016) yielded sphalerite formation temperatures above the closing temperature of the geothermometer (i.e. 310 ± 50°C), suggesting that ore-formation was linked to the regional Damaran metamorphism (Bertrandsson Erlandsson et al., 2022). The Co-rich sphalerite investigated in this study is from the Ore Stage one cluster mineralization style (Figure 3). Organic matter is widely present within the DOF Ombombo Formation (Allen, 2016) and framboidal pyrite is omnipresent in the DOF stratigraphy, with the exception of the main Co (-Cu-Zn) DOF mineralization (Bertrandsson Erlandsson et al., 2022).
3 Materials and methods
3.1 Sample selection
Over twenty samples were looked at to obtain a general understanding of the sphalerite occurrences in the different mineralization styles and to find sphalerite samples with the highest Co concentration for our study. The polished mount selected for further EPMA and APT characterization was chosen as it contained 1) the sphalerite with the highest Co concentrations (Bertrandsson Erlandsson et al., 2022), 2) relatively large sphalerite crystal sizes (for EPMA), and 3) sphalerite that appears to be a significant source of Co from this ore stage (see Section 5.1). The selected sphalerite comes from the ‘polysulfide cluster’ mineralization style but, as discussed in the introduction, all mineralization styles are part of the same overarching ore-forming stage (Bertrandsson Erlandsson et al., 2022).
3.2 EPMA
A JEOL Superprobe JXA 8200 EPMA at the Department of Applied Geosciences and Geophysics (Montanuniversität Leoben, Austria) was utilized for element mapping. The instrument is equipped with five wavelength-dispersive (WDS) and one energy-dispersive (EDS) spectrometers. The WDS spectrometers were used to measure Cu, Cd, Fe, Co, and Zn whilst the EDS detector measured S, Ni, and As. The crystals used for each WDS element were Cu on TAP, Cd on PETJ, Fe on LIF, and Co and Zn on LIFH. All elements were measured with a 50 ms dwell time per pixel. Mapping was conducted using the stage scan mode with a 15.0 keV and 100 nA electron-beam.
3.3 EBSD
EBSD measurements were carried out using a FEI Versa 3D Dual Focused Ion Beam FE-SEM with a Kamera: Symmetry S3 detector at the Department of Materials Science (Montanuniversität Leoben, Austria). The EBSD measurements were conducted with a 20 keV electron-beam. Scan parameters used a phase cubic standard and 500 nm step size in beam scanning mode. Grain dilatation clean-up was applied on the data, an iterative method which considers neighboring grains to reassign unidentified points (Edax, 2022).
3.4 Atom probe tomography
3.4.1 FIB-SEM
Sample preparation for APT analyses was done using the general procedures set out in Thompson et al. (2007), as well as the procedures for site specific preparation of geologic materials set out in Gopon et al. (2019a). One 3 × 30 µm wedge-shaped lift-out was taken from a Co-rich sphalerite from a sample from the cluster mineralization style. Sample preparation was done with a FEI Versa 3D Dual Focused Ion Beam FE-SEM equipped with a focused ion beam (FIB) and micromanipulator at the Department of Materials Science, Montanuniversität Leoben. The position of the lift-out location was chosen with great care, due to the intricate “network” feature that was identified during EPMA mapping (Supplementary Materials SA). The lift-out was targeted to include a portion of the low Fe/Co network as well as the ‘bulk’ high Co sphalerite. Ten needle-shaped samples were prepared from slices from this one lift-out bar. Successful APT data was only attained from sample section M9 and M11 of the lift-out.
3.4.2 APT
APT analyses were carried out using a CAMECA LEAP 5000 XR at the Department of Materials Science (Montanuniversität Leoben, Austria). Measurements were performed in laser-assisted mode with a 355 nm UV laser. This instrument has a ∼52% ion detection efficiency and analysis conditions were as follows: stage temperature 50 K; 125 Hz pulse frequency, 40–80 pJ laser pulse energy, and detection rate of 0.005 average ions per pulse. Initial run conditions were taken from the successful analysis of iron sulfide in Gopon et al. (2022a), and were further modified and improved based on how the previous needle-shaped specimen ran/fractured. Two out of four samples fractured prior to the acquisition of a statistically meaningful number of ions. This fracture yield is comparable to the fracture yields reported in Fougerouse et al. (2016); Gopon et al. (2022a); Gopon et al. (2019b), for similar sulfide minerals. Reconstruction of the APT datasets was conducted using the specimen-profile mode in the IVAS software (v3.8.12). Ranging the data was also done using the IVAS software, but the AtomProbeLab Matlab script (London, 2019) was used to calculate concentrations due to its improved complex peak overlap solver (compared to the IVAS software; see Gopon et al., 2022b for further details).
Spatial correlation graphs of the elements were generated using the ‘Local Chemistry’ function in the 3 Depict software (Haley, 2018) by using the “.pos” and range files generated in IVAS (see Gopon et al., 2019b for further details). The local correlation plots show the concentration of a specific element within a defined volume surrounding every ion of a pre-defined target element, e.g., the concentration of Zn surrounding each Co ion. We plot both as relative numbers, as this function does not allow the more rigorous overlap correction of London (2019). The relative, rather than the absolute, difference is the important point (showing whether there is a shift in the peaks or not). In our case, we defined the ‘Local Chemistry’ as a 3 nm sphere surrounding each target ion. This analysis is conducted for both the actual dataset as well as the same dataset with the ion IDs randomly reassigned, in order to approximate that matrix composition, i.e., what the data should look like if the ions were completely randomly distributed. These plots show relative comparisons and are meant for investigating trends rather than absolute concentrations.
As the laser incident side of insulating materials tends to have higher count rates, the incident side appears to have a higher concentration of major elements (Gault et al., 2012). This had the effect of creating a double peak in our spatial correlation graphs for the major elements, one from each half of the data. This was most clear in the Zn and S APT data (Figure 2), which should not vary this drastically in a pure sphalerite sample. Because of this single laser-induced data artifact, the data was split into two regions of interests (ROIs), to be able to carry out spatial correlation analyses properly. Spatial correlation plots of these two ROIs showed the same trends, and thus using the ROIs was deemed more suitable than the complete APT dataset with the laser-induced artifacts (Supplementary Materials SB). It should be noted that the ‘double peak’ shown in Figure 2 was only present when comparing the spatial correlation between minor and major elements, and no artifacts were observed when comparing minor to minor or minor to trace elements. However, for consistency’s sake, the opposite-laser incident side ROI of all datasets were used for all spatial correlation plots.
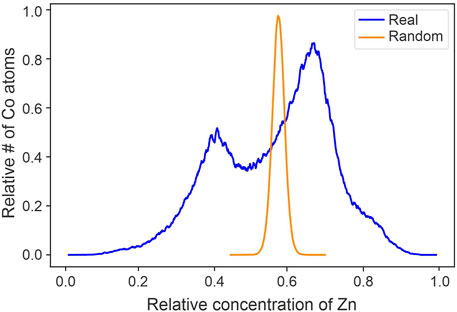
FIGURE 2. Spatial correlation plot of Zn ions surrounding Co ions from the full APT dataset. Two distinct peaks are visible, which is due to the difference in signal on the laser incident side and the off-laser side of the APT needle.
4 Results
4.1 Petrographic observations
Point counting confirmed the relative abundance of the sulfides with 9.1% pyrite, 5.3% chalcopyrite, 1.0% sphalerite, and 0.7% linnaeite in the investigated polished section. Euhedral to subhedral linnaeite is predominantly found enveloped by Ore Stage 1 pyrite (Figure 3) and commonly rimmed by chalcopyrite within the host pyrite. Sphalerite contains abundant chalcopyrite inclusions. Sphalerite was noted to overgrow linnaeite in some areas (Figure 3). Both sphalerite and chalcopyrite can be seen overgrowing the host pyrite, but also occur disseminated within the stilpnomelane-ankerite-siderite host rock. There are rare occurrences where linnaeite occurs independently of pyrite within the host rock. The linnaeite in the cluster and nodule mineralization styles exhibits a crisscross-like texture, reminiscent of exsolution textures (Figure 3). This texture is not present in all of the DOF linnaeite, e.g., from the vein-like “DOF event” mineralization style (Bertrandsson Erlandsson et al., 2022). Accessory cobaltite can be seen in the vicinity and overgrowing some of the linnaeite crystals. The entire polysulfide cluster appears “fractured” with sulfide aggregates and pieces being dispersed into the host rock matrix. Sphalerite and chalcopyrite within the larger clusters seem to be aligned with the host rock schistosity, i.e., in the direction in which the cluster minerals are fractured. Disseminated chalcopyrite can be seen following and wrapping around the ripped-apart pyrite aggregates. Euhedral siderite within the host pyrite cluster was previously described by Bertrandsson Erlandsson et al. (2022), but more detailed petrography shows sphalerite and chalcopyrite overgrowing and around euhedral siderite crystals.
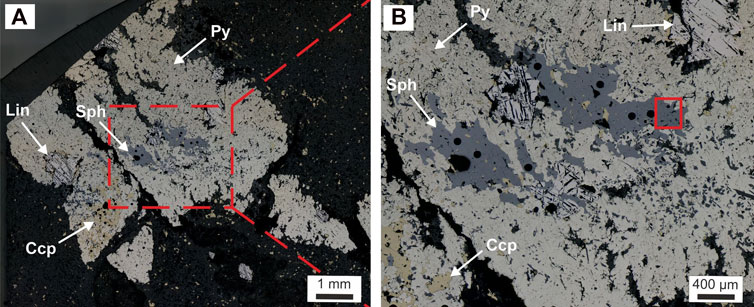
FIGURE 3. Reflective light micrographs of the cluster mineralization style of the DOF containing the Co-rich sphalerite investigated in this study. (A) Overview micrograph of the cluster mineralization. (B) Close-up micrograph with a solid red square indicating the targeted area investigated within this study. Shown here is also the sphalerite clearly replacing pyrite and linnaeite. Round black holes in the sphalerite are laser ablation pits.
4.2 Micron-scaled element distribution in DOF sphalerite
Element maps by EPMA of Co-rich sphalerite show homogeneously distributed elements (S, Fe, Co, Ni, Cu, Zn, and Cd) within individual sphalerite crystals, however a network enriched in Zn and deficient in Fe and Co was observed between the crystals (Figure 4). To save space, Figure 4 shows only the Fe, Zn, and Co signals; all other elements (S, Ni, Cu, and Cd) are shown in Supplementary Materials SC. Higher concentrations of Fe can be seen dotting the high Zn network (Figure 4); these Fe spots correlate with Cu (Supplementary Materials SC) and represent chalcopyrite inclusions in the sphalerite. The sample lift-out area is free from visible chalcopyrite inclusions. The other measured elements show no obvious compositional difference between the sphalerite crystals and the high Zn network (Supplementary Materials SC). EBSD mapping reveals several sub-grains and sub-grain boundaries within the sphalerite crystal (Figure 4) that correlate well with the high Zn network identified in the EPMA element maps. These sub-grains show moderate misorientation angles to each other with the bulk of the sphalerite crystals having similar orientation angles, with a low degree of misorientation between them.
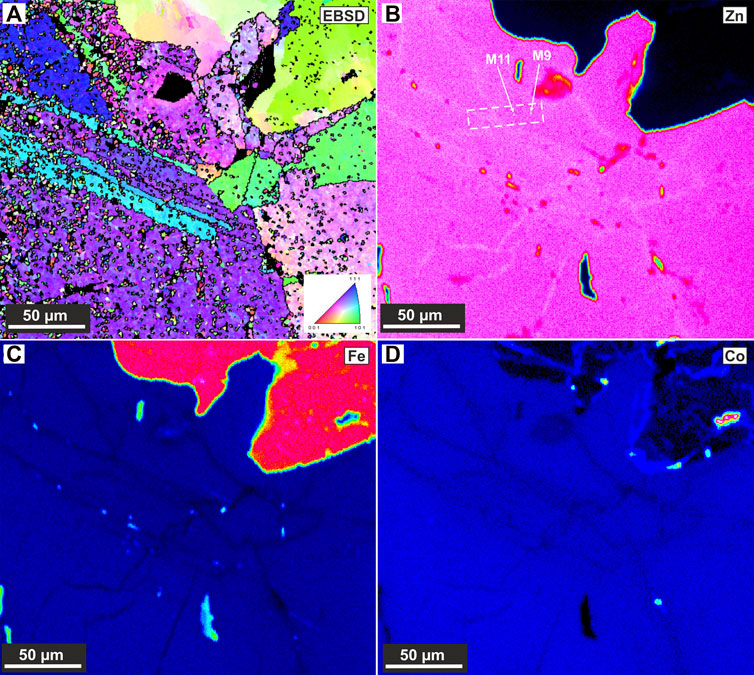
FIGURE 4. SEM-EBSD grain misorientation map over the investigated area (A). EPMA element maps of the same area as (A), showing Zn, Fe, and Co distributions [(B–D) respectively]. Positions of the two successful APT samples are marked out in (B), within dashed lines making the lift-out bar.
4.3 Atom-scale element distribution in DOF sphalerite
Four needle-shaped specimens were prepared from the Co-rich sphalerite, of which two APT data sets were successfully obtained (see Supplementary Materials SD for a mass spectra example). The APT needle-shaped sample reconstruction obtained from the Co-rich sphalerite shows homogenously distributed S, Zn, Mn, Fe, Co, and Cd, with no visible evidence for nano-inclusions (Figure 5). AtomProbeLab Matlab script calculations yielded a sphalerite trace element composition of 4.3 at% Fe, 0.70 at% Co, 179 ppm Mn, 103 ppm Cd, 44 ppm Se, and 35 ppm In (Supplementary Materials SE).
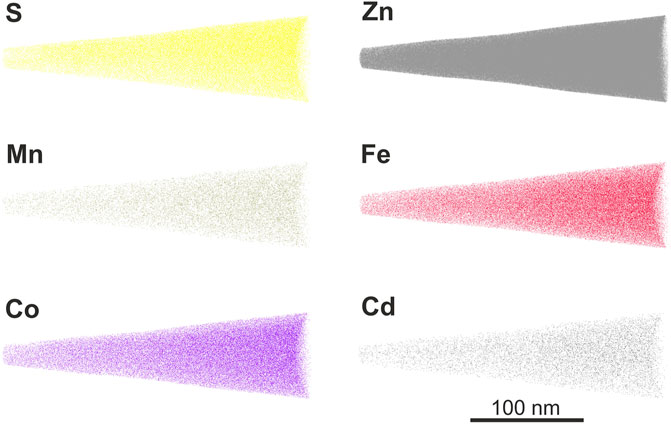
FIGURE 5. APT data reconstruction of Co-rich sphalerite needle-shaped specimens, showing S, Zn, Mn, Fe, Co, and Cd ions.
The spatial ion correlation analyses of local concentrations of Zn ions around Co, Fe, Mn, and Cd ions show that the real data curves have a shift to the left of the randomized data showing an anticorrelation between the minor and trace elements and Zn (Figure 6). As a reminder, these spatial correlation plots show the relative concentrations of a specific element in a predefined volume (here 3 nm sphere) surrounding a target element. These are plotted as normalized and smoothed lines where each point on the line is the relative number of target ions that occurs at a specific concentration of the specified element. This analysis is then repeated for a randomized version of the same data to approximate the matrix compositions/distribution if the target and specified element were randomly distributed (see Methods Section 3.4.2 for further details). An anticorrelation between the target and specified element can then be inferred when the real data curve is shifted to the left of the randomized data curve. The shift to the left of the real vs. randomized data with Zn as the target ion implies that there is less Zn surrounding the other ion than if all ions were randomly distributed. If ions were randomly distributed, there would be no link between the compared ions in regard to element incorporation and substitution (e.g., for Co and In. Figure 7D). A positive correlation (real data curve shifted to the right of the randomized curve) would imply that, in this example, there is an increased amount of Zn surrounding another ion. Hence, there is more Zn where there is more e.g., Co, compared to randomly distributed elements. Spatial ion correlation plots of Fe, Mn, Cd, and In surrounded by Co were also made to look at the relationship between Co and the other minor and trace elements (Figure 7). The real data curves of Fe, Mn, and Cd show a shift to the left compared to the randomized data, indicating an anticorrelation between these elements and Co. The real data curve of In does not show a notable shift compared to the randomized data curve, indicating that In is distributed randomly in relation to Co.
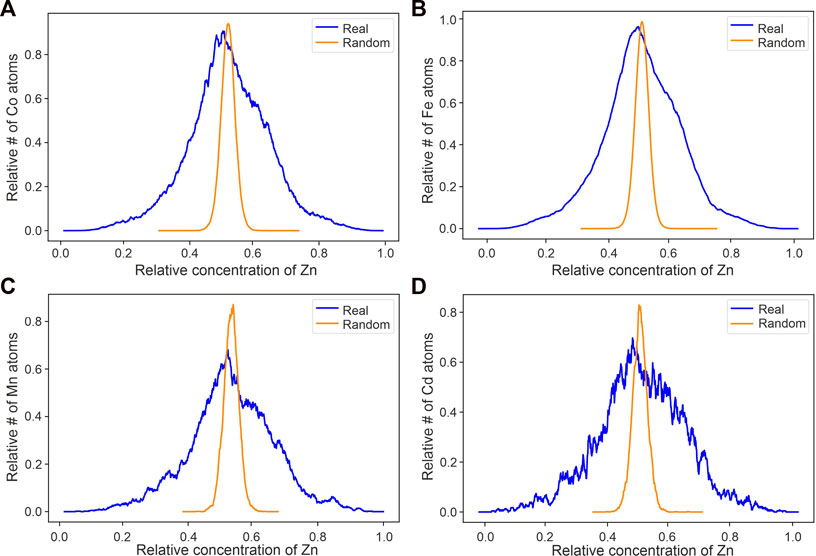
FIGURE 6. Local concentration of Zn surrounding Co, Fe, Mn, and Cd ions [(A–D) respectively], the most abundant minor and trace elements. Y-axis shows the relative number of Co, Fe, Mn, and Cd ions that are surrounded by a relative concentration of Zn.
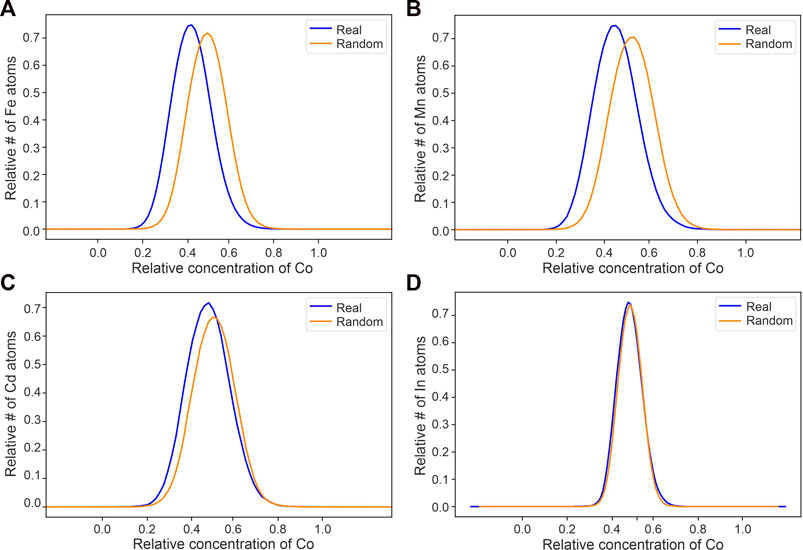
FIGURE 7. Local concentration of Co surrounding each Fe, Mn, Cd, and In ions [(A–D) respectively]. Y-axis shows the relative number of Fe, Mn, Cd, and In ions that are surrounded by a relative concentration of Co.
5 Discussion
5.1 Local mobilization and redistribution of cobalt in the DOF mineralization
In the DOF mineralization, linnaeite is present as a stoichiometric Co-phase; in addition, associated sulfides also contain elevated concentrations of Co (Bertrandsson Erlandsson et al., 2022). It is considered crucial to understand the reason for the widespread Co-enrichment in sphalerite, and why Co is not just hosted in the linnaeite. Detailed petrographic observations and interpretations reveal a refined paragenetic sequence of the Co-bearing sulfides in the DOF deposit. Multiple hydrothermal stages lead to a complex Co mobilization and redistribution from earlier sulfides to newly formed sulfides through a range of physicochemical changes.
5.1.1 Oxidizing conditions as prerequisites for linnaeite formation in the sediment-hosted DOF deposit
Based on petrographic and mineral-chemical investigation, the Cu and Zn that is associated with the main Co stage postdates the linnaeite in Ore Stage one, as sphalerite is seen overgrowing the linnaeite (Figure 3). As chalcopyrite partly occurs as rims around euhedral linnaeite, and intergrown with sphalerite, it is reasonable to conclude that the main Co stage Cu and Zn mineralization occurred later than the formation of linnaeite. This main Co stage was previously subdivided into two sub-stages (Co stage and Cu-Zn stage) by Bertrandsson Erlandsson et al. (2022) based on the crosscutting relationship of the sphalerite/chalcopyrite and linnaeite. However, further petrographic investigation shows three stages (Co-bearing pyrite, linnaeite growth, and formation of Co-bearing sphalerite/chalcopyrite). The timing of linnaeite formation was still unclear but is addressed in this study with better petrographic evidence. Hydrothermal alteration of other magmatic sulfides such as pyrrhotite-pentlandite-chalcopyrite by lower temperature fluids (e.g., 150°C–200°C) has been shown to result in replacement and formation of a pyrite-millerite-chalcopyrite assemblage (Holwell et al., 2017). Cobalt and nickel have been shown to act similarly during hydrothermal alteration of magmatic minerals (Tuba et al., 2014), and thus it can be assumed that replacement processes could form Co-phases (e.g., linnaeite) in much the same way that Ni-phases (pentlandite) can form from the breakdown of pyrite and millerite (Holwell et al. (2017). Furthermore, it has been shown that linnaeite can form at low temperatures (<150°C) through replacement of preexisting cobaltpentlandite (Co,Ni)9S8, (Xia et al., 2008).
Our petrographic observations combined with the experimental evidence suggest that the original DOF Co mineralization formed Co-rich pyrite (Ore Stage one). This pyrite is seen enveloping most of the linnaeite crystals (Figure 3), and it appears that the linnaeite grew at the expense of the Co-rich pyrite. The remobilizing of Co from Co-rich pyrite into linnaeite most likely happened during the greenschist facies overprinting that affected the DOF mineralization (Ore Stage two; Bertrandsson Erlandsson et al., 2022). As 66% of the Co occurs as Co3+ in linnaeite (Co2+Co3+2S4), the physiochemical conditions of Ore Stage two must have been more oxidizing than in Ore Stage one where Co is most likely present as Co2+ in pyrite. The presence of euhedral siderite within and around the host pyrite cluster, and associated nodule mineralization style (Bertrandsson Erlandsson et al., 2022), points towards an additional decrease in fS2, as fS2 has been shown to be the major reason for pyrite → siderite transformation (Qiu et al., 2021). Diagenetic siderite formation after sedimentary framboidal pyrite has also been described by McKay et al. (1995) due to either the influx of oxidized meteoric water or bicarbonate formation as a result of sulfate reduction related to the framboidal pyrite formation on the expense of organic carbon. The carbonate production may also have formed during methanogenesis of organic matter during continued burial to the methanogenic zone (McKay et al., 1995), which is an oxidizing process that would tie in with the formation of the DOF linnaeite. Hence, the hydrothermal fluid responsible for the linnaeite and siderite formation of Ore Stage two must have been oxidizing. Figure 8.
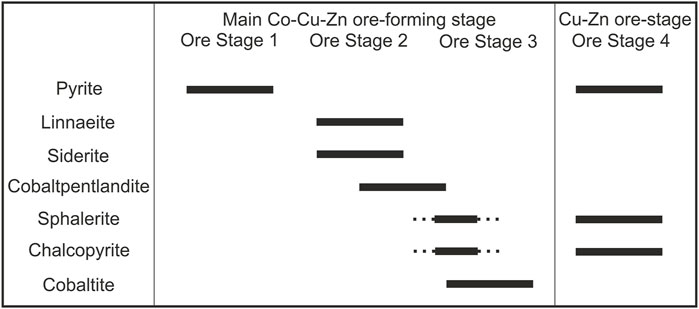
FIGURE 8. Revised paragenetic sequence of the main Co (-Cu-Zn) ore-forming stage of the DOF deposit, along with the later, secondary Cu-Zn stage (modified after Bertrandsson Erlandsson et al., 2022). See text for a more detailed description of the physiochemical conditions of each stage.
5.1.2 Formation of cobalt-rich sphalerite and associated accessory cobalt-phases
The linnaeite often appears “eaten up” and in the vicinity of linnaeite sphalerite (and chalcopyrite), suggesting that linnaeite was no longer stable and started breaking down. During breakdown, the Co moved into sphalerite that was growing by the partial replacement of pyrite and linnaeite and influx of Cu and Zn (Ore Stage three). The decomposition of linnaeite is also supported by the presence of cobaltpentlandite inclusions within the host pyrite and accessory subhedral cobaltite overgrowing linnaeite (Results 4.1 and Bertrandsson Erlandsson et al., 2022). Thermodynamic stability modeling of Co-S-O and Co-S-O-As has demonstrated that decreasing fS2 and/or fO2 conditions will result in the transformation of linnaeite → cobaltpentlandite → cobaltite (Vasyukova and Williams-Jones, 2022; Williams-Jones and Vasyukova, 2022). As sphalerite and chalcopyrite formed during the decomposition of linnaeite, i.e., elevated rather than decreased fS2, it is more likely that a decrease in fO2 is responsible for breakdown of linnaeite and the subsequent formation of sphalerite, chalcopyrite, cobaltpentlandite, and cobaltite.
In our interpretation, the pyrite was the original host of Co, and the sphalerite (along with accessory cobaltite) was the ultimate Co sink. Linnaeite and cobaltpentlandite was a transitional ore stage that was only stable during a brief portion of the deposits’ P/T/t history (Figure 9), due to their decomposition. It is worth noting that pre-Co (-Cu-Zn) mineralization sedimentary-diagenetic pyrite has been reported to contain median 698 μg/g Co (Bertrandsson Erlandsson et al., 2022), showing that Co was relatively abundant in all stages of sulfide-growth of the DOF deposit.
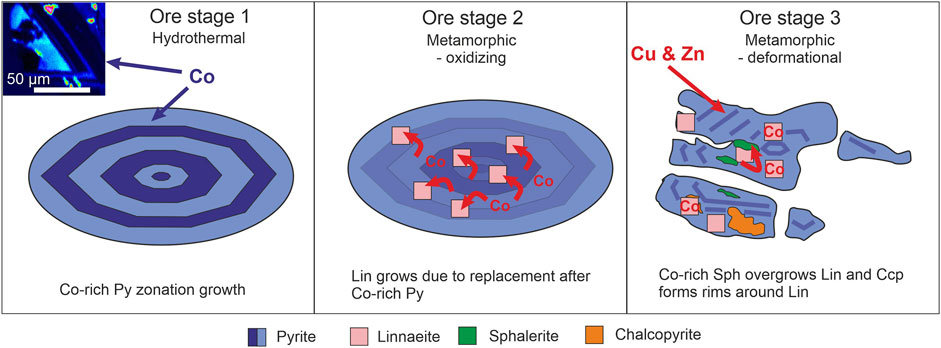
FIGURE 9. Schematic reconstruction of Co mobilization and redistribution between sulfides during the main Co (-Cu-Zn) DOF mineralization (Ore Stages 1–3), based on the polysulfide cluster mineralization of this study. The hydrothermal Ore Stage one introduced the majority of the Co in pyrite (indicated by blue shades in the figure), as seen in the inset EPMA Co map. Ore Stage two is defined by a change in redox state of the mineralizing system to more oxidized conditions, resulting in pyrite-hosted Co2+ to oxidize to Co3+, and leading to the formation of linnaeite. The brittle deformational Ore Stage 3 saw redox states returning to Co2+, which enabled the incorporation of Co in newly formed sphalerite. Schematic is based on the DOF cluster mineralization style seen in Figure 3. Abbreviations: Py = pyrite, Lin = linnaeite, Sph = sphalerite, Ccp = chalcopyrite.
In summary, our proposed paragenetic sequence for the DOF mineralization is as follows:
1) Hydrothermal Co-bearing pyrite formed first (Ore Stage one).
2) The Co-bearing pyrite was later oxidized with Co remobilized to form linnaeite (and siderite; Ore Stage two).
3) A decrease in fO2 led to the growth of cobaltpentlandite within the pyrite and eventually resulted in the formation of cobaltite, with sphalerite and chalcopyrite forming sometime during this last stage (Ore Stage three).
5.2 Incorporation and substitution of cobalt, and other trace elements, in cobalt-rich sphalerite
As the Zn-rich network-feature revealed by the EPMA mapping correlates well with the sub-grains of the EBSD map (Figure 4), we interpreted this to be Zn-enriched and Co/Fe-deficient sub-grain boundaries. Due to the smooth count-time resolving LA-ICP-MS signals in sphalerite, it is believed that the Co does not occur as large micro-inclusions of Co-bearing phases within the sphalerite, but either through substitution in the sphalerite crystal matrix or as nano-inclusions (Bertrandsson Erlandsson et al., 2022). To differentiate between micro-/nano-inclusions or lattice bound Co, we need to look at the atomic-scale elemental distribution with the aid of an atom probe.
In order to elucidate the incorporation mechanism of Co into sphalerite (nano-inclusion or lattice bound), we applied atomic scale spatial correlation analyses of the elements in our APT datasets. The shift of the “real” curves in Figure 7 to lower concentrations compared to the randomized data, for Co, Fe, Mn, and Cd (Figure 6) to Zn, indicate that these elements have an anti-correlation with Zn. This is evidence for simple substitution of Zn by Co, Fe, Mn, and Cd in the DOF sphalerite. The anti-correlation between Fe, Mn, and Cd to Co (Figure 7) further supports that coupled substitution of Co with Fe, Mn, or Cd is not responsible for the elevated Co concentrations in the DOF sphalerite. Instead, all correlation plots indicate simple Co-Zn substitution as a viable mechanism to incorporate the high Co concentrations observed in the DOF sphalerite. Indium and Co show no shift and are therefore interpreted to occur independent of each other within the DOF sphalerite (Figure 7).
Our atomic scale observations of the incorporation of Co into sphalerite is in keeping with the expected incorporation mechanism based off the Goldschmidt Rules (Goldschmidt, 1954). Ionic radius and charge of Zn2+ (0.60 Å) means that several similar sized 2+ ions would be expected to substitute for Zn in sphalerite (ZnS). Manganese2+ (0.66 Å), Fe2+ (0.63 Å), Co2+ (0.58 Å), and Cu2+ (0.57 Å) (Shannon, 1976) all fall within the ±15% atomic radius “window” that support simple element substitution (Goldschmidt, 1954). As Fe may commonly occur in wt% concentrations in sphalerite (e.g., Cook et al., 2009; Frenzel et al., 2016), where Zn2+ ↔ Fe2+, it might be expected that Co concentrations in sphalerite might be similarly high, if not higher. Experimental work by Becker and Lutz (1978); Niu et al. (1990) showed that sphalerite-structured crystals can contain up to 40 mol% and 36.4 at% Co respectively at high temperatures. That the DOF sphalerite have the highest Co concentrations ever measured in natural samples (1.06 wt%) is therefore puzzling, as both the theory and the direct observation indicate that the incorporation of Co into sphalerite is not special, and that based on experiments and comparison with high Fe sphalerite, we should therefore expect to see Co concentrations in natural sphalerite regularly above the measured maximum. Possible explanations might be that in the experimentally grown sphalerite with >30 wt% Co, a different incorporation mechanism might be at play (possibly nano-inclusions), or that the concentration of Co is seldom high enough to warrant any phase to have higher than ∼1% Co.
5.2.1 Sub-grain boundary formation and element remobilization
The majority of the sub-grain boundaries in the Co-rich sphalerite (Figure 4) broadly align with the foliation within the host rock as well the sense of fracture direction of the sulfide clusters. This suggests that these sub-grain boundaries formed during a later deformation event. The Co-poor sphalerite from DOF Ore Stage 4 is believed to have formed during this later deformational stage and aligns with the Co-poor sub-grain boundaries (Figure 4). It is interesting that the major element (Zn), rather than the trace/minor elements, is preferentially segregated to the sub-grain boundaries. This retention of trace elements and expulsion of the stoichiometric element is in contrast to the generally observed pattern of trace elements being segregated on grain boundaries that is commonly observed in silicates and sulfides (Gopon et al., 2018; Marquardt and Faul, 2018; Dubosq et al., 2019; Fougerouse et al., 2019; Cugerone et al., 2020; Fougerouse et al., 2021; Gopon et al., 2022b; etc.) and warrants further investigation. Cobalt in pyrite (incorporated through simple substitution) has been shown to be preferentially retained during metamorphic overprints compared to trace elements incorporated through coupled substitution (e.g., Large et al., 2007; Huston et al., 2016; Conn et al., 2019). While this might explain the retention of Co in sphalerite, it still does not explain the expulsion of the stoichiometric element (Zn).
6 Conclusion
Detailed petrographic observations have led to an updated paragenesis of the main Co (-Cu-Zn) ore stage of the DOF deposit, where three discrete stages are proposed (Ore Stage 1–3). Initial Co-rich pyrite clusters and nodules are formed during Ore Stage one, forming the host for much of the later sulfides. The oxidizing properties of the hydrothermal fluid responsible for Ore Stage two resulted in the formation of linnaeite (Co2+Co3+2S4) by neocrystallization within the host pyrite. Lower fO2 conditions later resulted in the transformation of linnaeite and pyrite into cobaltpentlandite → cobaltite along with the formation of the Co-rich sphalerite and chalcopyrite. This portrays the local mobilization and redistribution of Co from initial pyrite into the hyper-enriched Co-sphalerite that is unique to the DOF deposit.
EPMA and EBSD analyses revealed a sub-grain boundary network within the Co-rich sphalerite of Ore Stage three, which is depleted in both Fe and Co and elevated in Zn compared to the bulk sphalerite sub-gains. These sub-grain boundaries are suggested to have formed during later deformation (Ore Stage four). This ore stage is responsible for the formation of a secondary Cu-Zn (-Pb) mineralization, barren of Co, expressed as pressure shadow and vein mineralization within the DOF deposit. The sphalerite from Ore Stage four is likewise poor in both Fe and Co, compared to the sphalerite of Ore Stage three.
The APT reconstructions of the needle-shaped specimens revealed Co to be homogenously distributed within the Co-rich sphalerite sample, with no visually or statistically detectable micro- nor nano-scaled Co-inclusions or clusters. Atomic scale spatial correlation analyses of the individual ions showed a negative correlation between Zn to both Fe and Co, suggesting that both elements occur in the sphalerite through substitution of Zn. Additional atomic spatial correlation analyses indicated a negative correlation between Fe and Co, indicating that these two elements occur independent of each other and thus represent simple substitution in the sphalerite crystal lattice. This study demonstrates the potential of natural sphalerite to easily incorporate significant quantities of Co, making it a potentially important unconventional source for Co and other critical metals.
Data availability statement
The original contributions presented in the study are included in the article/Supplementary Material, further inquiries can be directed to the corresponding author.
Author contributions
All authors listed have made a substantial, direct, and intellectual contribution to the work and approved it for publication.
Acknowledgments
The authors would like to thank Maik Zimmermann, for allowing the use of the electron microprobe laboratory of the Chair of Resource Mineralogy at the Montanuniversität Leoben and for his time and effort in attaining the EPMA maps; Florian Altenberger, for constructive discussions on writing and article publication; and Gerhard Hawranek, for help with the EBSD measurements. Thank you as well to Denis Fougerouse and Nigel John Cook for their helpful and constructive comments, which greatly improved the manuscript.
Conflict of interest
Author RE was employed by the company Gecko Namibia.
The remaining authors declare that the research was conducted in the absence of any commercial or financial relationships that could be construed as a potential conflict of interest.
Publisher’s note
All claims expressed in this article are solely those of the authors and do not necessarily represent those of their affiliated organizations, or those of the publisher, the editors and the reviewers. Any product that may be evaluated in this article, or claim that may be made by its manufacturer, is not guaranteed or endorsed by the publisher.
Supplementary material
The Supplementary Material for this article can be found online at: https://www.frontiersin.org/articles/10.3389/feart.2023.1171859/full#supplementary-material
References
Allen, N. K. (2016). Structurally controlled Cu-Zn-(Co-Pb) mineralization in the neoproterozoic Ombombo Subgroup. Master Thesis. Kaokoland, Namibia: Colorado School of MInes.
Alves Dias, P., Blagoeva, D., Pavel, C., and Arvanitidis, N. (2018). Cobalt: Demand-supply balances in the transition to electric mobility. Publ. Office Eur. Union 10, 97710.
Becker, W., and Lutz, H. D. (1978). Phase studies in the systems CoS1bMnS, CoS1bZnS, and CoS1bCdS. Mater. Res. Bull. 13 (9), 907–911. doi:10.1016/0025-5408(78)90102-2
Bertrandsson Erlandsson, V., Viktor Wallner, D., Ellmies, R., Raith, J. G., Melcher, F., and 107105, (2022). Trace element composition of base metal sulfides from the sediment-hosted Dolostone Ore Formation (DOF) Cu-Co deposit in northwestern Namibia: Implications for ore Genesis. J. Geochem. Explor. 243. doi:10.1016/j.gexplo.2022.107105
Bonnet, J., Mosser-Ruck, R., Caumon, M. C., Rouer, O., Sylvie, A., Cauzid, J., et al. (2016). Trace element distribution (Cu, Ga, Ge, Cd, and Fe) in sphalerite from the Tennessee MVT deposits, USA, by combined EMPA, LA-ICP-MS, Raman Spectroscopy, and crystallography. Can. Mineralogist 54 (5), 1261–1284. doi:10.3749/canmin.1500104
Conn, C. D., Spry, P. G., Layton-Matthews, D., Voinot, A., and Koenig, A. (2019). The effects of amphibolite facies metamorphism on the trace element composition of pyrite and pyrrhotite in the Cambrian Nairne Pyrite Member, Kanmantoo Group, South Australia. Ore Geol. Rev. 114, 103128. doi:10.1016/j.oregeorev.2019.103128
Cook, N. J., Ciobanu, C. L., Pring, A., Skinner, W., Shimizu, M., Danyushevsky, L. V., et al. (2009). Trace and minor elements in sphalerite: A LA-ICPMS study. Geochimica Cosmochimica Acta 73 (16), 4761–4791. doi:10.1016/j.gca.2009.05.045)
Cugerone, A., Cenki-Tok, B., Oliot, E., Muñoz, M., Barou, F., Motto-Ros, V., et al. (2020). Redistribution of germanium during dynamic recrystallization of sphalerite. Geology 48 (3), 236–241. doi:10.1130/g46791.1
Dubosq, R., Rogowitz, A., Schweinar, K., Gault, B., and Schneider, D. A. (2019). A 2D and 3D nanostructural study of naturally deformed pyrite: Assessing the links between trace element mobility and defect structures. Contributions Mineralogy Petrology 174 (9), 72. doi:10.1007/s00410-019-1611-5
European Commission (2020). “Communication from the commission to the European parliament, the council, the economic and social committee and the committee of the regions,” in Critical raw materials resilience: Charting a path towards greater security and sustainability (Brussels, Belgium: European Commission).
Foltyn, K., Erlandsson, V. B., Kozub-Budzyń, G. A., Melcher, F., and Piestrzyński, A. (2020). Indium in polymetallic mineralisation at the gierczyn mine, karkonosze-izera massif, Poland: Results of EPMA and LA-ICP-MS investigations. Geol. Q. 64, 000. doi:10.7306/gq.1516
Foster, D. A., Goscombe, B. D., and Gray, D. R. (2009). Rapid exhumation of deep crust in an obliquely convergent orogen: The Kaoko Belt of the Damara Orogen. Tectonics 28, 1–24. doi:10.1029/2008tc002317
Fougerouse, D., Cugerone, A., Reddy, S. M., Luo, K., and Motto-Ros, V. (2023). Nanoscale distribution of Ge in Cu-rich sphalerite. Geochimica Cosmochimica Acta 346, 223–230. doi:10.1016/j.gca.2023.02.011
Fougerouse, D., Reddy, S. M., Aylmore, M., Yang, L., Guagliardo, P., Saxey, D. W., et al. (2021). A new kind of invisible gold in pyrite hosted in deformation-related dislocations. Geology 49 (10), 1225–1229. doi:10.1130/g49028.1
Fougerouse, D., Reddy, S. M., Kirkland, C. L., Saxey, D. W., Rickard, W. D., and Hough, R. M. (2019). Time-resolved, defect-hosted, trace element mobility in deformed Witwatersrand pyrite. Geosci. Front. 10 (1), 55–63. doi:10.1016/j.gsf.2018.03.010
Fougerouse, D., Reddy, S. M., Saxey, D. W., Rickard, W. D. A., van Riessen, A., and Micklethwaite, S. (2016). Nanoscale gold clusters in arsenopyrite controlled by growth rate not concentration: Evidence from atom probe microscopy. Am. Mineralogist 101 (8), 1916–1919. doi:10.2138/am-2016-5781ccbyncnd
Frenzel, M., Hirsch, T., and Gutzmer, J. (2016). Gallium, germanium, indium, and other trace and minor elements in sphalerite as a function of deposit type—a meta-analysis. Ore Geol. Rev. 76, 52–78. doi:10.1016/j.oregeorev.2015.12.017
Gault, B., Moody, M. P., Cairney, J. M., and Ringer, S. P. (2012). Atom probe microscopy. Springer Science and Business Media.
Gopon, P., Douglas, J. O., Auger, M. A., Hansen, L., Wade, J., Cline, J. S., et al. (2019b). A nanoscale investigation of Carlin-type gold deposits: An atom-scale elemental and isotopic perspective. Econ. Geol. 114 (6), 1123–1133. doi:10.5382/econgeo.4676
Gopon, P., Douglas, J. O., Meisenkothen, F., Singh, J., London, A. J., and Moody, M. P. (2022a). Atom probe tomography for isotopic analysis: Development of the 34S/32S system in sulfides. Microsc. Microanal. 28 (4), 1127–1140. doi:10.1017/s1431927621013568
Gopon, P., Douglas, J. O., Wade, J., and Moody, M. P. (2019a). Complementary SEM-EDS/FIB-SEM sample preparation techniques for atom probe tomography of nanophase-Fe0 in apollo 16 regolith sample 61501, 22. Microsc. Microanal. 25 (2), 2544–2545. doi:10.1017/s143192761901345x
Gopon, P., Forshaw, J. B., Wade, J., Waters, D. J., and Gopon, C. (2022b). Seeing through metamorphic overprints in Archean granulites: Combined high-resolution thermometry and phase equilibrium modeling of the Lewisian Complex, Scotland. Am. Mineralogist 107 (8), 1487–1500. doi:10.2138/am-2022-8214ccby
Gopon, P., Forshaw, J., Waters, D., and Wade, J. (2018). Pyroxene thermometry on single crystals of the Lewisian Complex. Scotland: EGU General Assembly Conference Abstracts.
Goscombe, B. D., Hand, M., and Gray, D. R. (2003). Structure of the Kaoko belt, Namibia: Progressive evolution of a classic transpressional orogen. J. Struct. Geol. 25, 1049–1081. doi:10.1016/s0191-8141(02)00150-5
Goscombe, B. D., Foster, D. A., Gray, D. R., and Wade, B. (2017). Metamorphic response and crustal architecture in a classic collisional orogen: The Damara Belt, Namibia. Gondwana Res. 52, 80–124. doi:10.1016/j.gr.2017.07.006
Goscombe, B. D., Gray, D. R., and Hand, M. (2005). Extrusional tectonics in the core of a transpressional orogen; the Kaoko belt, Namibia. J. Petrology 46 (6), 1203–1241. doi:10.1093/petrology/egi014
Guj, P. (1970). The Damara mobile belt in the south-Western kaokoveld south west africa. PhD Thesis. Cape Town, South Africa: University of Cape Town/Precambrian Research Unit.
Haley, D. (2018). 3Depict: Valued point cloud visualisation and analysis software. Available At: http://threedepict.sourceforge.net/.
Hoffman, P. F. (2011). “Glaciogenic and associated strata of the Otavi carbonate platform and foreslope, northern Namibia: Evidence for large base-level and glacioeustatic changes,” in The geological record of neoproterozoic glaciations. Editors G. Shields-Zhou, G. P. Halverson, and E. Arnaud (London: Geological Society of London).
Hoffman, P. F., and Halverson, G. P. (2008): Otavi Group of the Western northern platform, the eastern Kaoko zone and the Western northern margin zone,” in The Geology of Namibia: Neoproterozoic to lower palaeozoic. Editor R. M. G. Miller (Windhoek, Namibia: Geological Survey), 13–136.
Hoffmann, K. H., and Prave, A. R. (1996). A preliminary note on a revised subdivision and regional correlation of the Otavi Group based on glaciogenic diamictites and associated cap dolostones. Commun. Geol. Surv. Namib. 11, 77–82.
Holwell, D. A., Adeyemi, Z., Ward, L. A., Smith, D. J., Graham, S. D., McDonald, I., et al. (2017). Low temperature alteration of magmatic Ni-Cu-pge sulfides as a source for hydrothermal Ni and pge ores: A quantitative approach using automated mineralogy. Ore Geol. Rev. 91, 718–740. doi:10.1016/j.oregeorev.2017.08.025
Huston, D. L., Mernagh, T. P., Hagemann, S. G., Doublier, M. P., Fiorentini, M., Champion, D. C., et al. (2016). Tectono-metallogenic systems - the place of mineral systems within tectonic evolution, with an emphasis on Australian examples. Ore Geol. Rev. 76, 168–210. doi:10.1016/j.oregeorev.2015.09.005
Intiomale, M. M., and Oosterbosch, R. (1974). “Géologie et géochimie du gisement de Kipushi, Zaïre,” in Annales de la Société géologique de Belgique (Liège: Gisements stratiformes et provinces cuprifères). Available at: https://popups.uliege.be/0037-9395/index.php?id=3472.
Large, R. R., Maslennikov, V. V., Robert, F., Danyushevsky, L. V., and Chang, Z. (2007). Multistage sedimentary and metamorphic origin of pyrite and gold in the giant Sukhoi Log deposit, Lena gold province, Russia. Econ. Geol. 102 (7), 1233–1267. doi:10.2113/gsecongeo.102.7.1233
Liu, K., Cugerone, A., Zhou, M. F., Zhou, J. X., Sun, G. T., Xu, J., et al. (2022). Germanium enrichment in sphalerite with acicular and euhedral textures: An example from the zhulingou carbonate-hosted Zn (-Ge) deposit, south China. Miner. Deposita 57, 1–23. doi:10.1007/s00126-022-01112-4
Lockington, J. A., Cook, N. J., and Ciobanu, C. L. (2014). Trace and minor elements in sphalerite from metamorphosed sulphide deposits. Mineralogy Petrology 108 (6), 873–890. doi:10.1007/s00710-014-0346-2
London, A. J. (2019). Quantifying uncertainty from mass-peak overlaps in atom probe microscopy. Microsc. Microanal. 25 (2), 378–388. doi:10.1017/s1431927618016276
Marquardt, K., and Faul, U. H. (2018). The structure and composition of olivine grain boundaries: 40 years of studies, status and current developments. Phys. Chem. Minerals 45 (2), 139–172. doi:10.1007/s00269-017-0935-9
Marsh, E. E., Hitzman, M. W., and Leach, D. L. (2016). “Critical elements in sediment-hosted deposits (clastic-dominated Zn-Pb-Ag, Mississippi valley-type Zn-Pb, sedimentary rock-hosted stratiform Cu, and carbonate-hosted polymetallic deposits): A review,” in Rare Earth and critical elements in ore deposits (Philip Verplank, Murray Hitzman: Society of Economic Geologists).
McKay, J. L., Longstaffe, F. J., and Plint, A. G. (1995). Early diagenesis and its relationship to depositional environment and relative sea-level fluctuations (Upper Cretaceous Marshybank Formation, Alberta and British Columbia). Sedimentology 42 (1), 161–190. doi:10.1111/j.1365-3091.1995.tb01276.x
Miller, R. (2008). The Geology of Namibia: Neoproterozoic to lower palaeozoic. Windhoek, Namibia: Geological Survey.
Murakami, H., and Ishihara, S. (2013). Trace elements of indium-bearing sphalerite from tin-polymetallic deposits in Bolivia, China and Japan: A femto-second LA-ICPMS study. Ore Geol. Rev. 53, 223–243. doi:10.1016/j.oregeorev.2013.01.010
Niu, C. M., Kershaw, R., Dwight, K., and Wold, A. (1990). The preparation and properties of cobalt-doped II–VI chalcogenides. J. Solid State Chem. 85 (2), 262–269. doi:10.1016/s0022-4596(05)80082-9
Porada, H. (1989). Pan-African rifting and orogenesis in southern to equatorial Africa and eastern Brazil. Precambrian Res. 44 (2), 103–136. doi:10.1016/0301-9268(89)90078-8
Qiu, Z. J., Fan, H. R., Goldfarb, R., Tomkins, A. G., Yang, K. F., Li, X. C., et al. (2021). Cobalt concentration in a sulfidic sea and mobilization during orogenesis: Implications for targeting epigenetic sediment-hosted Cu-Co deposits. Geochimica Cosmochimica Acta 305, 1–18. doi:10.1016/j.gca.2021.05.001
Shannon, R. D. (1976). Revised effective ionic radii and systematic studies of interatomic distances in halides and chalcogenides. Acta Crystallogr. Sect. A Cryst. Phys. Diffr. Theor. general Crystallogr. 32 (5), 751–767. doi:10.1107/s0567739476001551
Thompson, K., Lawrence, D., Larson, D. J., Olson, J. D., Kelly, T. F., and Gorman, B. (2007). In situ site-specific specimen preparation for atom probe tomography. Ultramicroscopy 107 (2-3), 131–139. doi:10.1016/j.ultramic.2006.06.008
Tuba, G., Molnár, F., Ames, D. E., Péntek, A., Watkinson, D. H., and Jones, P. C. (2014). Multi-stage hydrothermal processes involved in “low-sulfide” Cu (–Ni)–PGE mineralization in the footwall of the sudbury igneous complex (Canada): Amy lake PGE zone, east range. Miner. Deposita 49 (1), 7–47. doi:10.1007/s00126-013-0468-1
USGS (2022). 2022 Final List of Critical Minerals. Notices. Geological Survey, Department of the Interior 87, 37. Available at: https://www.usgs.gov/news/national-news-release/us-geological-survey-releases-2022-list-critical-minerals.
Vasyukova, O. V., and Williams-Jones, A. E. (2022). Constraints on the genesis of cobalt deposits: Part II. Applications to natural systems. Econ. Geol. 117 (3), 529–544. doi:10.5382/econgeo.4888
Williams-Jones, A. E., and Vasyukova, O. V. (2022). Constraints on the genesis of cobalt deposits: Part I. Theoretical considerations. Econ. Geol. 117 (3), 513–528. doi:10.5382/econgeo.4895
Keywords: cobalt, sphalerite, dolostone ore formation, substitution mechanisms, EBSD, EPMA, atom probe tomography-APT, correlative microscopy
Citation: Bertrandsson Erlandsson V, Gopon P, Waldl H, Misch D, Ellmies R and Melcher F (2023) Sphalerite as a non-traditional critical metal source: Correlative microscopy (EPMA, EBSD, and APT) of cobalt-enriched sulfides from the sediment-hosted copper-cobalt Dolostone Ore Formation deposit, Namibia. Front. Earth Sci. 11:1171859. doi: 10.3389/feart.2023.1171859
Received: 22 February 2023; Accepted: 10 April 2023;
Published: 28 April 2023.
Edited by:
Malte Junge, Ludwig Maximilian University of Munich, GermanyReviewed by:
Nigel John Cook, University of Adelaide, AustraliaDenis Fougerouse, Curtin University, Australia
Copyright © 2023 Bertrandsson Erlandsson, Gopon, Waldl, Misch, Ellmies and Melcher. This is an open-access article distributed under the terms of the Creative Commons Attribution License (CC BY). The use, distribution or reproduction in other forums is permitted, provided the original author(s) and the copyright owner(s) are credited and that the original publication in this journal is cited, in accordance with accepted academic practice. No use, distribution or reproduction is permitted which does not comply with these terms.
*Correspondence: Phillip Gopon, cGhpbGxpcC5nb3BvbkB1bmlsZW9iZW4uYWMuYXQ=