
95% of researchers rate our articles as excellent or good
Learn more about the work of our research integrity team to safeguard the quality of each article we publish.
Find out more
ORIGINAL RESEARCH article
Front. Earth Sci. , 07 July 2023
Sec. Quaternary Science, Geomorphology and Paleoenvironment
Volume 11 - 2023 | https://doi.org/10.3389/feart.2023.1170661
This article is part of the Research Topic Human Upright Walking From Past to Present View all 11 articles
 Ken Van Alsenoy1,2*†
 Marietta L. van der Linden2†
 Joong Hyun Ryu3†
 Olivier Girard4†
 Lubna Al Raisi1†
 Derek Santos2†
Introduction: We investigated the isolated and combined (HYB) effects of ethylene-vinyl acetate (EVA) and expanded thermoplastic polyurethane (TPU) custom foot orthoses (CFOs), compared to a control condition (CON; shoes only), on constant speed, treadmill running kinematics.
Methods: Twenty (10 male and 10 female subjects) well-trained runners performed four 6-min bouts at the same individualized speed for each bout on a treadmill under four footwear conditions (EVA, TPU, HYB, and CON). Twenty markers and four clusters (four markers each) were placed on lower limbs and the pelvis. Lower limb and pelvis movements were tracked using a three-dimensional motion capture system with 11 cameras (Vicon MX System, Oxford, United Kingdom). Lower limb joint angles and angular velocity were normalized to 100% of the stance phase.
Results: Peak ankle eversion (p < 0.001, η2 = 0.72), peak ankle eversion angular velocity (AV) (p < 0.001, η2 = 0.64), peak ankle inversion AV (p < 0.001, η2 = 0.60), and peak ankle internal rotation AV (p < 0.001, η2 = 0.49) demonstrated the largest differences between conditions. Statistical non-parametric mapping analysis revealed that HYB exhibited the largest proportions of change during the total stance phase compared to the CON.
Discussion: All CFO materials caused significant reductions in peak angles and peak AVs at the ankle in the frontal plane, with more pronounced effects for harder (EVA) than softer (TPU) materials. These significant reductions occurred during large portions of the total stance phase for the angles and for the AVs. Although some effects could be found in more proximal joints such as the knee and hip, most significant effects were found at the ankle joint. Overall, combining hard EVA material in the heel and soft TPU in the forefoot (HYB) resulted in significant, more favorable changes compared to the CON that lasted for the largest proportion of stance phase when compared to wearing shoes only.
Custom foot orthoses (CFOs) can help runners in the prevention and treatment of foot and lower limb injuries such as tibialis posterior tendon dysfunction or achilles tendinopathy (Munteanu et al., 2009; Bowring and Chockalingam, 2010; Franklyn-Miller et al., 2011; Bonanno et al., 2018). Wearing CFO is believed to mitigate excessive plantar and joint loads imposed by ground reaction forces (Kirby, 2017). Although their clinical effect is shape- and material-dependent, CFOs with a customized geometric shape based on the individual’s foot seem more effective than the prefabricated CFOs in controlling foot mechanics (Cheung et al., 2011; McCormick et al., 2013).
Previous research investigating the clinical effects of CFO design has mainly focused on shape alterations (Desmyttere et al., 2018). When CFOs varus posting were systematically increased with increments of two degrees, significant linear reductions were found for peak and mean rearfoot eversion angles and moments (Telfer et al., 2013). A significant reduction in rearfoot eversion with medial corrections and vice versa were reported when compared to without wearing CFOs during walking and running (Martinez-Rico et al., 2022; Zhang et al., 2022). Although most research has been focusing on comparing orthotic posting geometry and its effect on lower limb mechanics, few studies have investigated the effect of CFO material alterations on stride mechanics (Healy et al., 2012; Desmyttere et al., 2020). Healy et al. (2012) attributed small significant increases in sagittal knee flexion for medium density EVA in reference to shoe only (CON) to possible marker placement error or skin movement. Desmyttere et al. (2020) found that increased CFO material stiffness decreases both rearfoot eversion in the frontal plane and forefoot abduction in the transverse plane during walking. To date, it is unclear if CFOs constructed from different materials but with identical shape alter lower limb mechanics.
Orthotic materials can influence the foot, ankle, and to a lesser degree knee and hip mechanics during walking and running. The magnitude of this effect likely depends on specific CFO material properties such as hardness, density, thickness, and resilience (Nicolopoulos et al., 2000; Kermen and Mohammadi, 2021). Studies investigating the effects of orthotic materials have mainly focused on established materials such as PU (e.g., PORON®), polyethylene (PE) (e.g., Plastazote®), EVA, and carbon graphite (Gerrard et al., 2020). Recently, improvement in running mechanics has been reported from using highly resilient expanded thermoplastic polyurethanes (TPUs) (e.g., Infinergy®) and lightweight polymers (e.g., PEBAX®) (Hoogkamer et al., 2019). Only recently, high-resilient TPU material (Infinergy®) was introduced to manufacture two identical CFOs (TPU and EVA) for uninjured recreational male runners (Van Alsenoy et al., 2019a). Running kinetics were captured using an instrumented treadmill at ∼12 and ∼14 km/h. Interestingly, CFOs made from EVA significantly reduced the initial impact forces by ∼4%, while the identical TPU version significantly increased both the duration of propulsion by ∼2% and the propulsive loading rate by ∼18%. These distinctive kinematic effects related to the first and second halves of the stance phase might induce further kinematic changes warranting further investigation of an orthosis combining EVA and TPU in the heel and forefoot, respectively.
The vast majority of studies investigating the effect of different orthotic shapes or materials on the kinematics of the lower extremities have used walking conditions (Healy et al., 2012; Telfer et al., 2013; Desmyttere et al., 2020; Martinez-Rico et al., 2022). Since most field-based sports involve some form of running, further kinematics studies at a faster speed (running) are needed. Comparing CFOs with the same shape, each constructed from materials with different hardness and resilience properties, may increase our understanding of the effect of EVA and TPU materials used to manufacture CFOs on lower limb kinematics during steady-state running. Therefore, the aim of this study was to determine the effects of CFOs manufactured from EVA, TPU, and a combination (HYB) of both materials (all compared with a control) on lower limb kinematics during the stance phase of steady-state running. We hypothesized that, compared to the control condition, wearing CFOs will significantly reduce the angle and angular velocity at the ankle in frontal, sagittal, and transverse planes. We further hypothesized the three CFO conditions will have similar kinematic adjustments compared to CON but that this effect will be more pronounced with HYB than the other two materials.
Twenty recreational runners (10 male and 10 female individuals; aged 40.8 ± 9.0 years; mass 70.5 ± 13.1 kg; height 167.9 ± 10.6 cm) were recruited through a local advertisement of the study. Participants had no known history of cardiovascular, neurological, or orthopedic problems, were injury-free, and ran a minimum of 25 km weekly for the 3 months leading up to data collection. Recruited participants were trained on average 8.8 ± 3.3 h per week with an average weekly running distance of 42.3 ± 16.2 km. Two participants dropped out of the study for personal reasons before the first session. A foot strike pattern was identified by a visual inspection of the center of pressure trajectories of ∼20 steps on an instrumented treadmill, with an embedded pressure plate at 0° grade inclination and running at 10 km/h (Zebris Medical GmbH, Germany) while wearing a standardized running shoe with its original liner (Pearl Izumi N2v2, Colorado, United States) (Van Alsenoy et al., 2019b). Fifteen participants were rearfoot strikers, one was a forefoot striker, and two participants had a discrepancy between the left and right feet where one foot was clearly rearfoot striking and the other foot was a mix of midfoot and rearfoot striking. Their foot structures were determined using the Foot Posture Index FPI-6 (Redmond et al., 2006). The participants had a foot structure of median (min and max) 5 (−3, +10) for the left and right feet. Each participant received an information sheet at least 24 h prior to providing written informed consent.
The control condition (CON) involved using an original shoe liner, which was compared with the three CFO conditions. The first two orthoses were exclusively made of expanded TPU and ethylene-vinyl acetate (EVA) with a shore density of ∼35⁰ and ∼70⁰, respectively. The third orthosis (HYB)-combined EVA at the heel and TPU at the front part of the CFO was tested (Figure 1). The bespoke hybrid block (400 × 300 × 35 mm) had a 25⁰, ∼8-cm-long transition where the EVA and TPU overlapped in the middle of the CAD–CAM block. The CAD orthotic was placed on the bottom/middle of the block using predefined CAM software anker, allowing the heel to sit in the EVA and the forefoot in the TPU. The arch area consisted of both EVA and TPU materials. This design was inspired by a previous research study by Van Alsenoy et al. (2019a), where EVA and TPU materials triggered distinctive effects related to the first vs. second half of the stance phase, respectively. All orthoses were fitted in the standardized neutral running shoe (Pearl Izumi N2v2, Colorado, United States) after removing the original liner. The foot scanning and orthosis manufacturing procedure was the same as reported in Van Alsenoy et al. (2019a) using FitFoot360 CAD software (Fit360 Ltd., Bromsgrove, United Kingdom).
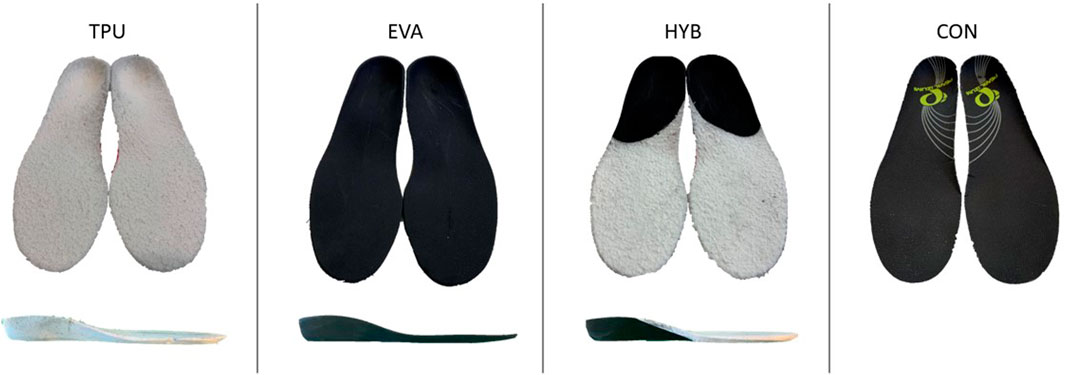
FIGURE 1. Example of the four footwear conditions. Note: TPU, thermoplastic polyurethane orthosis; EVA, ethylene-vinyl acetate orthosis; HYB, hybrid orthosis (combination of EVA and TPU); CON, control (original liner of the shoe).
Participants attended the laboratory on two occasions. The first visit was used to scan, design, and manufacture three pairs of CFOs and to determine individual submaximal running speed for the main session (Van Alsenoy et al., 2019a). Briefly, each participant underwent an incremental test to identify the individual ventilatory threshold and corresponding running speed. Running started at 7 km/h, and every 30 s, the speed increased with +0.5 km/h until voluntary exhaustion. The ventilatory threshold was determined using the criteria of an increase in minute ventilation (VE)/oxygen uptake (VO2) with no increase in VE/carbon dioxide (VCO2) and the departure from linearity of VE (Davis, 1985). Foot orthoses were fitted in the own shoes of participants who were asked to slowly introduce them to running activity over the next 7–10 days, as feeling comfortable. The wear-in time between the first and second sessions was on average 15.7 ± 3.7 days.
On the second visit, after a 10-min warm-up using a treadmill on a 0° incline (ADAL3D-WR, Medical Development—HEF Tecmachine, France), the participants ran four 6-min bouts at a speed that was kept the same between bouts for each participant (average: 9.9 ± 1.3 km/h). Between each bout, a 5-min break was taken to change the footwear condition. The participants did not manually handle the shoes and looked away during fitting after which they were allowed to tie their laces. The lead investigator (KVA) was blinded to the shoe condition from the point of data collection until further statistical analysis.
Before data collection, each participant was equipped with motion capture markers. Briefly, lower limb and pelvis movements were tracked using a three-dimensional motion capture system with 11 cameras at 250 Hz (Vicon MX System, Oxford, United Kingdom) to determine joint angles and angular velocity using a validated six degrees of freedom (DOF) model (Collins et al., 2009). Twenty markers and four clusters were placed on the participant’s legs and shoes. Using pre-tape adherent, double-sided tape, and extra fixation tape, Ø14.0-mm light retroreflecting markers were adhered bilaterally to the skin over the anterior superior iliac spine and posterior superior iliac spine to identify the pelvis, the medial and lateral femoral condyle, and the medial and lateral malleolus. Markers were also fixed to both shoes at the first and fifth metatarsal head, one on top of the second metatarsal head and one at the posterior side of the heel at the same height as the second metatarsal head. To track the movement of both thighs and shank, which were regarded as rigid bodies, we attached custom carbon fiber cluster plates, each with four markers in non-collinear patterns, held in place with elastic bands and Velcro® straps. With the participant standing on the treadmill, we recorded a calibration trial including a static pose and dynamic movement of the hip, knee, and ankle, after which we removed the markers on the medial femoral condyle and medial malleolus as they were likely to be knocked off during running.
A lower body biomechanical model with six DOF and seven rigid segments was constructed and included the pelvis, thighs, shanks, and feet. For the hip, knee, and ankle joint kinematic data, we labeled all markers and filled trajectory gaps using a Woltring spline fill for small gaps of a maximum of five frames, and further pelvis and cluster trajectory gaps were filled based on other marker trajectories in a rigid body using Nexus (v2.12.1, Vicon Motion Systems, Oxford, United Kingdom). Using Visual3D Professional (v2021.11.3, C-Motion, Germantown, MD, United States), a 7-Hz lowpass Butterworth filter was applied, and joint angles and angular velocities were calculated during the stance phase based on a custom lower limb model with three DOF joints. A MATLAB script (MathWorks Inc., Natick, MA, United States) integrating a validated and accurate algorithm to identify the initial contact, based on the vertical acceleration peaks of the heel and metatarsal marker, and the vertical jerk peak to identify toe-off was used (Handsaker et al., 2016). All data curves were normalized from 0% to 100% of the stance phase duration. Peak angles (⁰), peak angular velocities (AV) (⁰/s), and their corresponding timing (%) relative to the duration of the stance phase for the hip, knee, and ankle in the frontal, sagittal, and transverse planes were calculated. For further distinct peak values, we analyzed the full angle and AV curves in relation to the duration of the stance phase of each joint in each body plane. This allowed us to identify exactly when, during the stance phase, significant differences between the conditions occurred.
Angles and angular velocities collected during running in the four footwear conditions (CON, TPU, EVA, and HYB) were compared using a one-way ANOVA for repeated measures after confirming a normal distribution (Shapiro–Wilk) and sphericity (Mauchley’s). A Greenhouse–Geisser correction was performed to adjust the DOF if sphericity assumption was violated, while post hoc pairwise comparisons with Bonferroni-adjusted p-values were performed if a significant main effect was observed. In case the normality assumption was violated, the non-parametric test (Friedman) was performed. Partial eta-squared (η2) effect sizes were calculated as a measure of the main effect size, with values of ≥0.01, ≥0.06, and ≥0.14 considered as small, moderate, and large effects, respectively. (Cohen, 2013). The level of significance was set at p ≤ 0.05. All statistical analyses were performed in IBM SPSS Statistics for Windows v.28 (IBM Corp., Armonk, NY, United States).
A time-continuous, one-dimensional statistical non-parametric mapping analysis (SnPM) of the angles and angular velocity curves was performed using an open-source MATLAB script (www.spm1d.org) (Pataky et al., 2015). Non-parametric tests were used when the d’Agostino-Pearson K2 test revealed that the data were not normally distributed. SnPM one-way ANOVAs, with a significance level set at α = 0.05, were performed to test the effect of CFO materials on lower limb kinematics. If significant differences were found, further post hoc t-tests with Bonferroni correction were used for multiple comparisons between conditions. Partial eta-squared effect sizes were calculated for each post hoc comparison. Statistical differences with an effect size exceeding 0.4 for at least 10% of the stance phase were graphed (Desmyttere et al., 2021).
Descriptive statistics are presented as the mean ±SD values in Table 1, and all data were normally distributed except for the peak ankle DF angle, peak knee adduction angle, peak knee adduction AV, and peak hip flexion AV. Overall, there was a significant main footwear condition effect for 10 out of 25 variables reported.
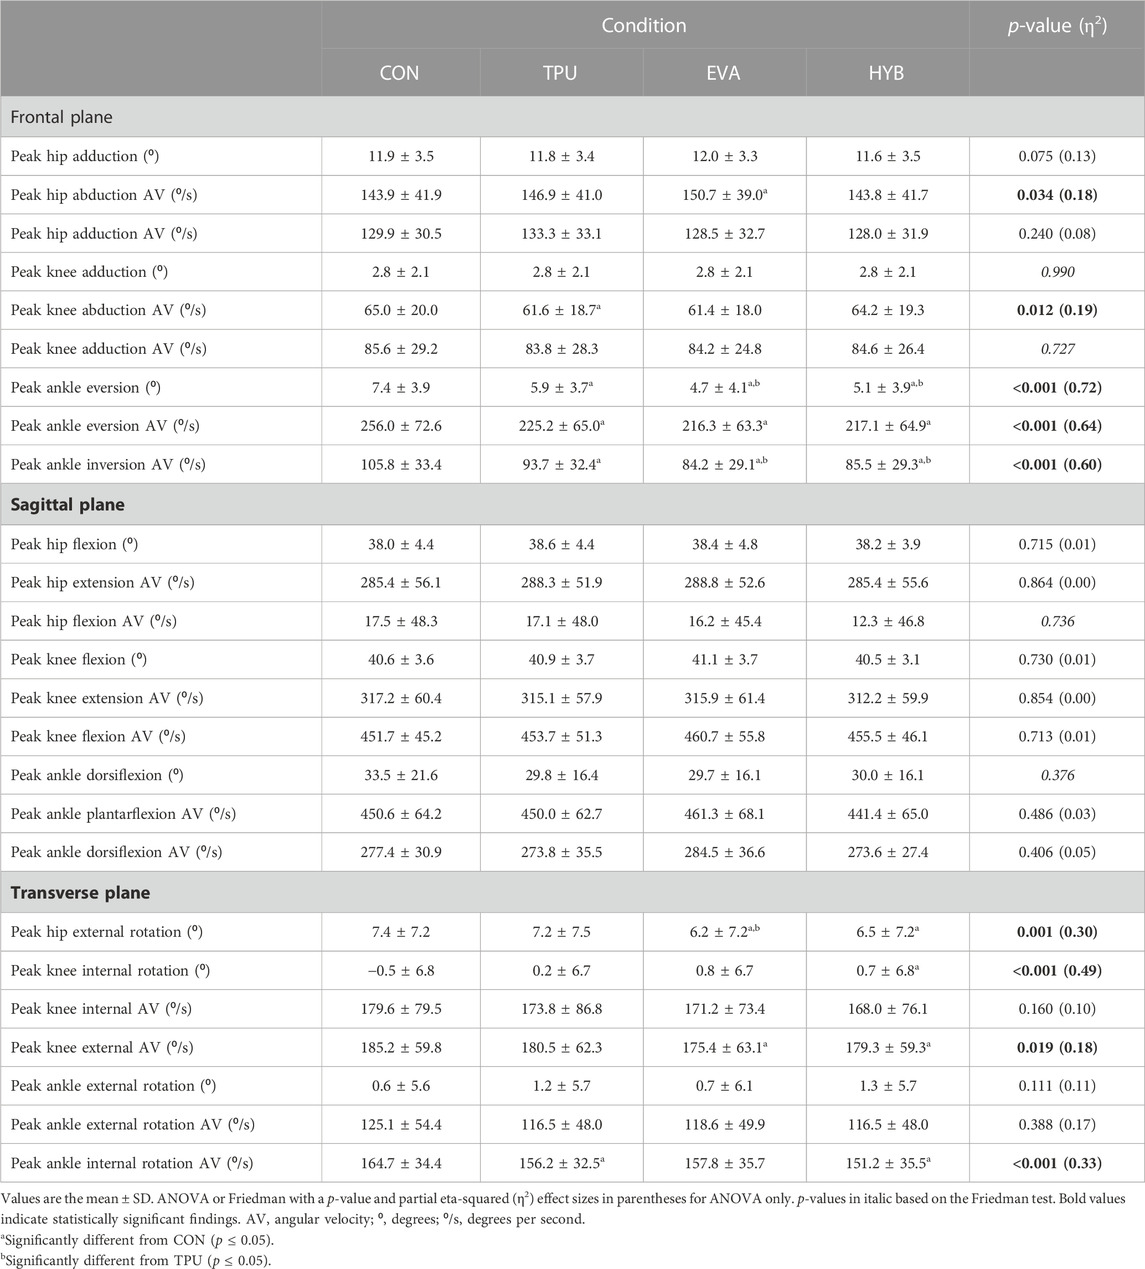
TABLE 1. Hip, knee, and ankle joint angles and joint angle velocity parameters for shoe only (CON), shoe with thermoplastic polyurethane orthosis (TPU), shoe with ethylene-vinyl acetate orthosis (EVA), and shoe with hybrid orthosis (HYB) conditions.
Significant reductions in the hip angle were found in the transverse plane only. A post hoc test showed that peak hip external rotation was significantly lower for EVA (−14.5%, p = 0.002) and TPU (−11.4%, p = 0.032) vs. CON. Peak hip external rotation was −13.8% (p = 0.044) lower for EVA than TPU.
Considering the knee, the lower peak abduction AV (−5.2%, p = 0.026) was found for TPU vs. CON. When compared to CON, all orthotic conditions had lower peak knee internal rotation (TPU: −133.6%, p < 0.029; EVA: −257.7%, p = 0.001; and HYB: −241.7%, p < 0.001). Peak knee external AV was 5.3% (p = 0.004) lower for EVA vs. CON.
For ankle kinematics in the frontal plane, peak eversion, peak eversion AV, and peak inversion AV were significantly lower for all orthotic conditions compared to CON. Compared to CON, peak eversion (−20.4%, p < 0.001; −37.0%, p < 0.001; and −31.8%, p < 0.001), peak eversion AV (−12.0%, p < 0.001; −15.5%, p < 0.001; and −15.2%, p < 0.001), and peak inversion AV (−11.5, p < 0.001; −20.4, p < 0.001; and −19.2%, p < 0.001) were lower for TPU, EVA, and HYB, respectively. Furthermore, peak ankle internal rotation AV in the transverse plane was lower in both TPU (−5.2% and p = 0.044) and HYB (−8.2% and p = 0.002) than in CON.
Eight angle–time and angular velocity–time profiles exceeded the SnPM statistical significance (α = 0.05) over the course of the stance phase (Figures 2, 3). All significant periods for which the SnPM exceeded the threshold (p ≤ 0.05; η2 ≥ 0.4; duration ≥10% of the stance phase) are presented.
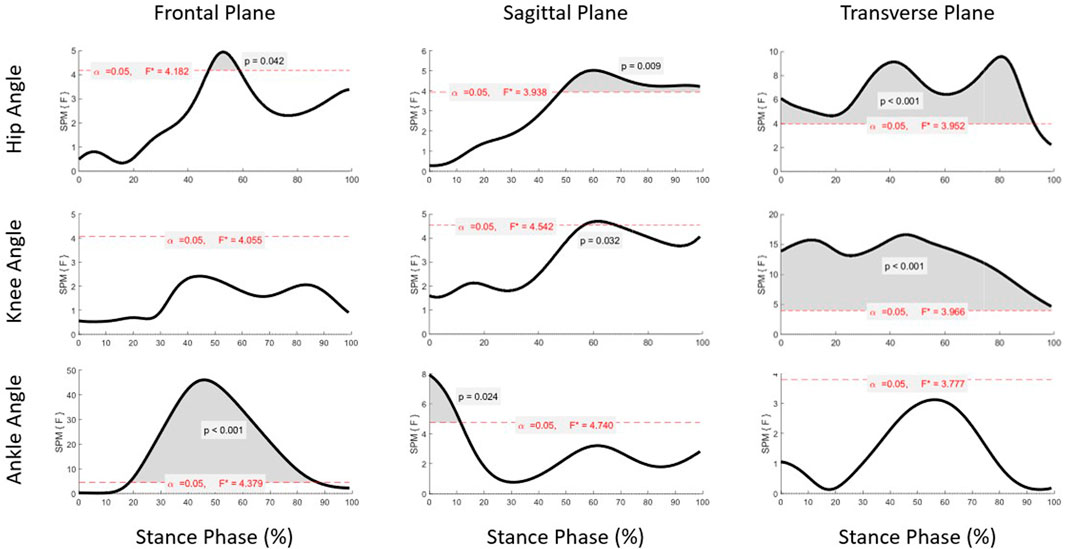
FIGURE 2. One-dimensional statistical non-parametric mapping analysis (SnPM) of the hip, knee, and ankle angles. Note: Graphs indicate SnPM statistic which exceeded statistical significance (α = 0.05) with the CFO materials affecting lower limb angles relative to the stance phase. Ranges (gray zone), where the curve is above the dotted line, indicate regions of statistically significant differences between curves.
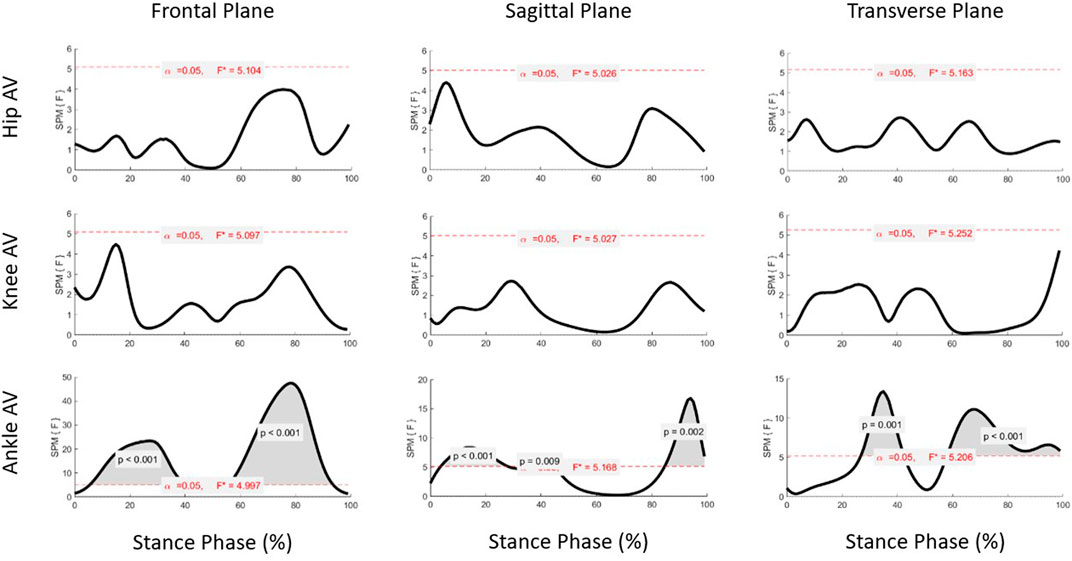
FIGURE 3. One-dimensional statistical non-parametric mapping analysis (SnPM) of the hip, knee, and ankle angular velocities. Note: Graphs indicate the SnPM statistic which exceeded statistical significance (α = 0.05) with the CFO materials affecting lower limb angular velocities relative to the stance phase. Ranges (gray zone), where the curve is above the dotted line, indicate regions of statistically significant differences between curves.
At the hip joint (Figure 4; Table 2), both abduction and external rotation angles were lower while wearing orthoses. A lower abduction angle during propulsion occurred with TPU (MD: −0.6⁰ and η2 = 0.47) and HYB (MD: −0.6⁰ and η2 = 0.46). In the transverse plane, all orthotic conditions elicited significantly lower external rotation vs. CON. Although the effect duration for EVA (MD: −1.0⁰, η2 = 0.54) lasted for 91% of the stance phase, the timing of this effect was different for TPU and HYB. TPU (MD: −0.6⁰, η2 = 0.52) only displayed significant effect during a short portion (10%) of propulsion, while HYB (MD: −1.0⁰, η2 = 0.55) was effective during most of the braking phase.
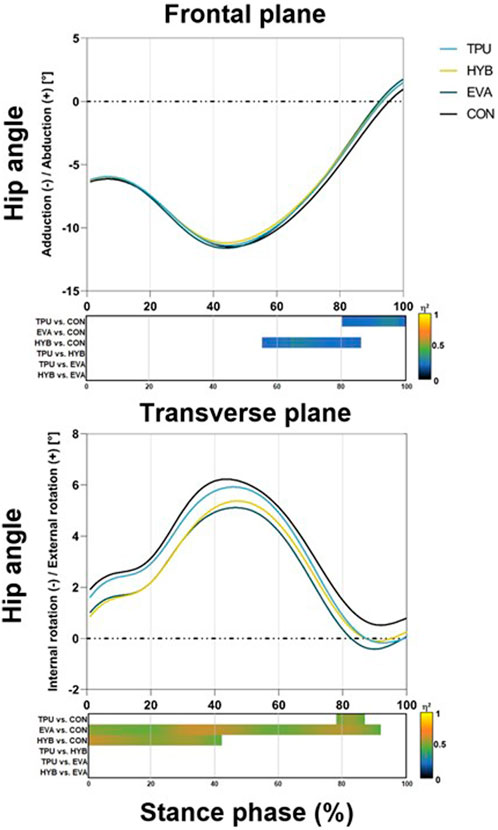
FIGURE 4. Hip angles during the stance phase. Note: The line graph shows the mean kinematics for each condition. In the bottom bar graph, bars indicate significant periods for which the statistical non-parametric mapping analysis exceeded the threshold (p ≤ 0.05; η2 ≥ 0.4; duration ≥10%). Colormap represents the effect size. CON, shoe only; TPU, shoe with thermoplastic polyurethane orthosis; EVA, shoe with ethylene-vinyl acetate orthosis; HYB, shoe with hybrid orthosis.
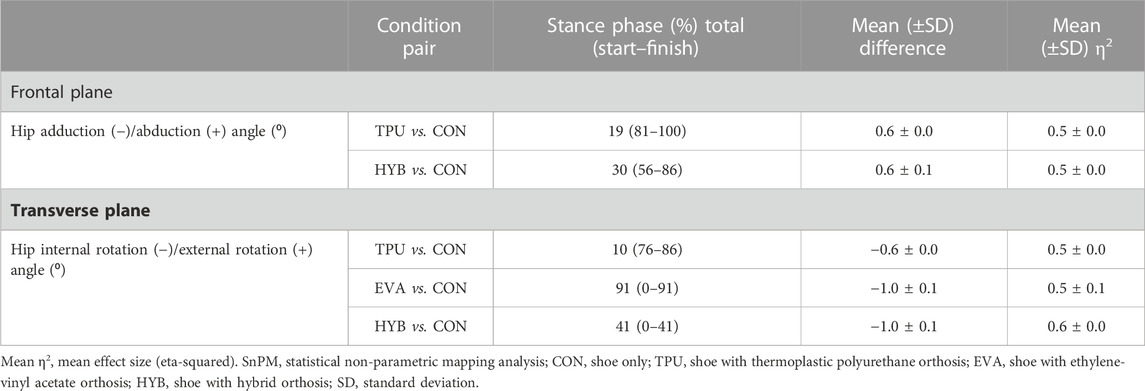
TABLE 2. Results of the SnPM analysis: statistically significant differences in the hip time–angle and time–angular velocity profiles (post hoc comparisons between the conditions).
At the knee joint (Figure 5; Table 3), all orthotic conditions caused significantly lower internal rotation vs. CON. Although the statistical different angle–time profiles for all orthotic conditions lie around 30%–50% of the stance phase, the combination of the duration and size of effect was the largest with HYB (100% of stance phase; MD: −1.2⁰, η2 = 0.60).
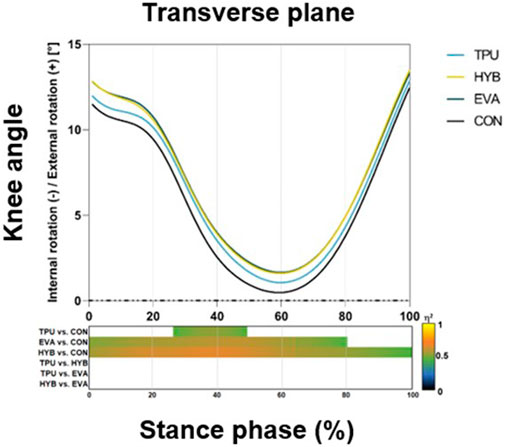
FIGURE 5. Knee angles during the stance phase. Note: The line graph shows the mean kinematics for each condition. In the bottom bar graph, bars indicate significant periods for which the statistical non-parametric mapping analysis exceeded the threshold (p ≤ 0.05; η2 ≥ 0.4; duration ≥10%). Colormap represents the effect size. CON, shoe only; TPU, shoe with thermoplastic polyurethane orthosis; EVA, shoe with ethylene-vinyl acetate orthosis; HYB, shoe with hybrid orthosis.
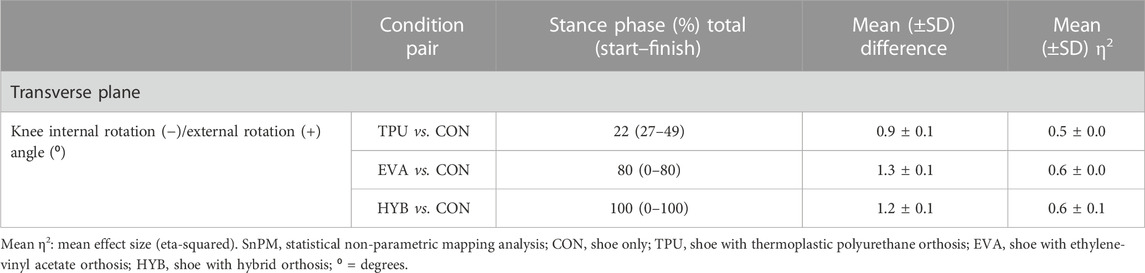
TABLE 3. Results of the SnPM analysis: statistically significant differences in the knee time–angle and time–angular velocity profiles (post hoc comparisons between the conditions).
At the ankle joint (Figure 6; Table 4), when compared to CON, all orthotic conditions induced significantly lower peak eversion angles around midstance. Furthermore, the peak eversion AV during the first 50% of the stance and the peak inversion AV during the second 50% of the stance were also significantly lower than CON. In the sagittal plane, compared to CON, TPU (MD: 1.1⁰, η2 = 0.55) and HYB (MD: 1.1⁰, η2 = 0.55) showed a significant increase in the dorsiflexion angle at the initial ground contact. Furthermore, HYB lowered dorsiflexion AV (MD: −16.6⁰/s, η2 = 0.55) and plantarflexion AV (MD: −13.3⁰/s, η2 = 0.63) during the first and second halves of the stance phase, respectively. Moreover, EVA reduced plantarflexion AV (MD: −16.7⁰/s, η2 = 0.67) during the late propulsion phase. Finally, all orthotic conditions lowered the ankle internal rotation. Although statistically different angle–time profiles for all orthotic conditions were situated around 70% of the stance phase, we could note an additional profile around 35% of stance with HYB.
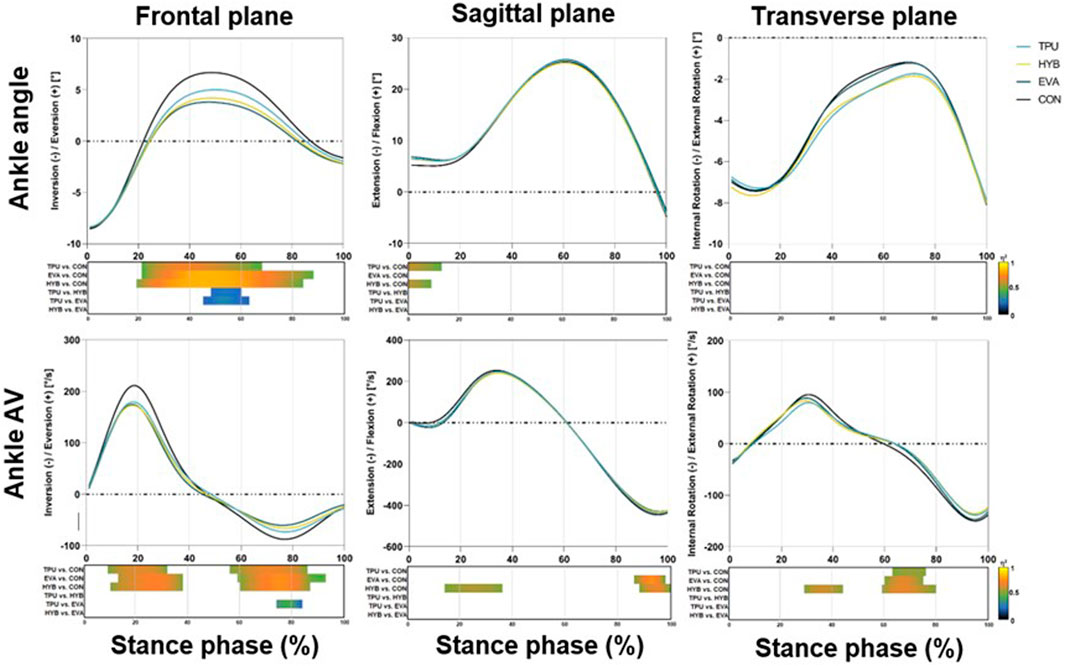
FIGURE 6. Ankle angles and angular velocities during the stance phase. Note: The line graph shows the mean kinematics for each condition. In the bottom bar graph, bars indicate significant periods for which the statistical non-parametric mapping analysis exceeded the threshold (p ≤ 0.05; η2 ≥ 0.4; duration ≥10%). Colormap represents the effect size. CON, shoe only; TPU, shoe with thermoplastic polyurethane orthosis; EVA, shoe with ethylene-vinyl acetate orthosis; HYB, shoe with hybrid orthosis; AV, angular velocity.
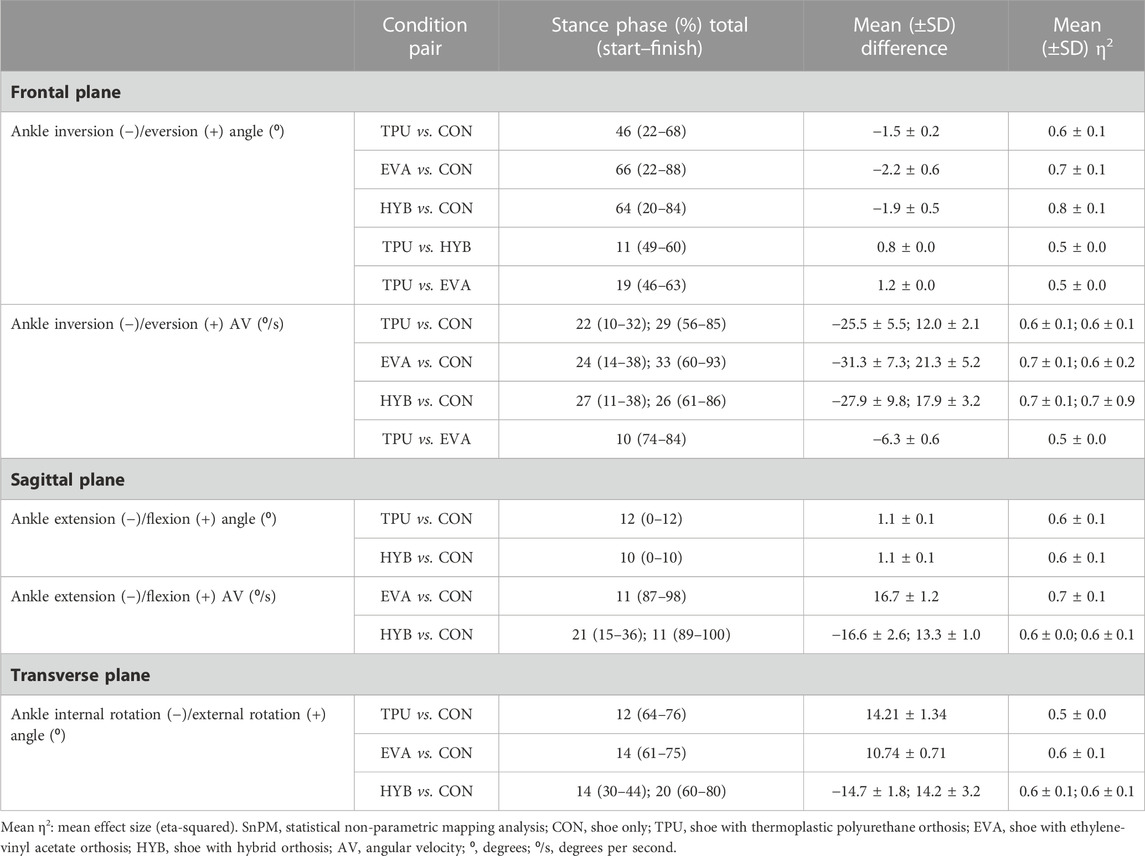
TABLE 4. Results of the SnPM analysis: statistically significant differences in the ankle time–angle and time–angular velocity profiles (post hoc comparisons between the conditions).
The main finding, confirming our hypothesis, was that compared to CON, all CFOs caused significant reductions in peak angles (∼-30%) and peak AVs (∼-14%) at the ankle in the frontal plane during steady-state running. Furthermore, harder materials were more effective in controlling peak angles and peak AVs compared to softer materials. These reductions were present during significant portions of the stance phase for the angles (∼60% of the stance phase) and for AVs (∼56% of the stance phase). In agreement with the previous research, reductions in the peak ankle eversion angle and AV were considered important contributors to the clinical effect of CFOs in the treatment of foot and lower limb injuries (Eng and Pierrynowski, 1994; Mündermann et al., 2003; Fong et al., 2008; Özmanevra et al., 2018). In our study, no significant changes were found either for peak angles or AV values in the sagittal plane. However, wearing TPU and HYB increased ankle dorsiflexion in the first 10% of the stance, compared to CON. These observations are in line with the findings of Desmyttere et al. (2021) who tested CFOs which differed in material stiffness. They reported an increase in ankle dorsiflexion (MD = 1.3°–1.6°) with CFOs during walking, compared to wearing shoes only. All CFOs tested in this study, irrespective of the materials used, had a significant effect on ankle kinematics during running.
Ankle angle, as a well-established proxy measurement for foot pronation and supination, has shown to be effectively controlled by CFOs (Chevalier and Chockalingam, 2011). A key finding in our study is that the material used to make an orthosis can control the maximal eversion angle, even when the surface geometry of the orthosis is kept the same. A maximal eversion angle reduction of −2.7°, −2.5°, and −1.5° were found for EVA, HYB, and TPU, respectively, when compared to CON. These findings may be explained by material properties where EVA was the hardest and stiffest material in the heel and arch, followed by HYB, which had the same material in the heel but was softer in the arch. TPU was the softest material with the same soft material in the heel and arch regions. The link between harder, stiffer materials and peak ankle angle reduction is in contrast with that of Butler et al. (2003), who tested CFOs that differed in material hardness and stiffness. There was no difference found in eversion excursion between the harder, stiffer CFO subortholene orthoses, softer 60 shore, flexible EVA orthoses, and the control condition without orthoses. The fact that different materials (i.e., EVA and expanded TPU used in isolation or in combination) in our study reduced the peak angles and AV values is of clinical importance as it provides clinicians with an extra factor to manipulate the effect of CFOs. Ankle frontal plane control can be enhanced either by increasing the varus shape or by the materials used to optimize the biomechanical outcome. The ankle eversion angle and AV can be controlled by harder, stiffer materials without posting or by increasing the varus geometry of the CFO.
HYB was different from other conditions for a significantly larger proportion of the stance phase than CON. These profile differences with CON were consistent with the largest effect size among the three CFOs for angles and AVs. This effect could be attributed to the material combination used in the HYB condition. Harder, stiffer materials are believed to control foot and ankle mechanics better than softer, flexible materials. However, harder materials are often perceived as more uncomfortable (Anderson et al., 2020). It is known that subjective perceptions can reflect differences in biomechanical variables (Mundermann et al., 2003). Our HYB condition was a combination of the EVA material in the heel region and TPU in the forefoot region. The midfoot combined EVA tapering down to the forefoot topped with TPU over ∼7 cm resulted in a hard heel region, medium midfoot region, and soft forefoot region. Although large changes in peak angles could be perceived as being clinically more meaningful, lower (but statistically significant) effects on angles and AVs, which are present over a longer duration of the stance phase, may be considered as having a larger clinical impact.
First, despite significant differences in the ankle joint kinematics noted between the four conditions, the foot was assumed to be one rigid body as the multi-segment foot model (e.g., Ghent foot model (De Mits et al., 2012)) could not be used. Therefore, it cannot be excluded that subtle intersegment angle changes between the heel, midfoot, and forefoot influenced by the footwear condition have gone undetected. However, a multi-segment foot model would require modifying the footwear, notably by creating holes, to enable the placement of additional markers directly affixed on the skin. This modification would likely affect the structural integrity of the shoe, which could, in turn, modify CFO effects. Second, only the immediate effects of wearing CFOs on lower limb kinematics were reported in this study, given the wear-in time was restricted to about 2 weeks and participants only ran for a couple of minutes in each condition before data were captured. However, previous research has shown that lower limb mechanics can immediately be adjusted to match CFO characteristics (Mündermann et al., 2004). Investigating CFOs consistently worn for longer periods of time, for example, during 3 or 6 months, is needed to provide valuable clinical information related to the longevity of these materials (Jafarnezhadgero et al., 2018). Finally, this study recruited healthy runners without a recent history of lower limb injury so that caution is required when generalizing our findings to load-compromised participants in rehabilitation settings.
The effect of CFOs manufactured from EVA and TPU materials, used in isolation or in combination, was tested on ankle and lower limb mechanics during steady-state running on a treadmill. Compared to the control (shoe only), CFO materials caused significant reductions in peak angles and peak AVs at the ankle in the frontal plane, with more pronounced effects for harder than softer materials. Such significant reductions were evident during large portions of the total stance phase for the angles and for AVs. Overall, combining hard EVA material in the heel and soft TPU in the forefoot (HYB) resulted in significant changes that lasted for the largest proportion of the stance phase when compared to wearing shoes only.
The raw data supporting the conclusion of this article will be made available by the authors, without undue reservation.
The studies involving human participants were reviewed and approved by the Queen Margaret University Research ethics, Musselburgh, United Kingdom—approval: REP0258 AZF Institutional Review Board, Doha, Qatar—approval: F2017000201. The patients/participants provided their written informed consent to participate in this study.
KA, OG, MV, and DS contributed to the conception and design of the study. KA and LA collected all data. JR analyzed, processed, and organized the kinematic database. JR performed the SnPM calculations. KA statistically analyzed and wrote the first draft of the manuscript. All authors contributed to the article and approved the submitted version.
This project was conducted using an instrumented treadmill that was funded by the QNRF (NPRP 4-760-3-217).
The authors thank Dr. Pieter D’Hooghe, Chief Medical Officer, for his continuing support; Dr. Marco Cardinale, Director of Research and Scientific Support Department, for performing the incremental tests during the first session; Dr. Phil-Graham Smith, head of biomechanics and innovation in Aspire Academy, for the use of the VICON system; Dr. Dino Palazzi, Senior Engineer of Biomechanics and innovation lab in Aspire Academy, for the brainstorm sessions and technical support; Dr. Mohamed Farooq, Epidemiologist and statistical wizard, for his statistical advice; and all participants for their enthusiasm and collaboration.
The authors declare that the research was conducted in the absence of any commercial or financial relationships that could be construed as a potential conflict of interest.
All claims expressed in this article are solely those of the authors and do not necessarily represent those of their affiliated organizations, or those of the publisher, the editors, and the reviewers. Any product that may be evaluated in this article, or claim that may be made by its manufacturer, is not guaranteed or endorsed by the publisher.
Anderson, J., Williams, A. E., and Nester, C. (2020). Development and evaluation of a dual density insole for people standing for long periods of time at work. J. Foot Ankle Res. 13, 42. doi:10.1186/s13047-020-00402-2
Bonanno, D. R., Murley, G. S., Munteanu, S. E., Landorf, K. B., and Menz, H. B. (2018). Effectiveness of foot orthoses for the prevention of lower limb overuse injuries in naval recruits: A randomised controlled trial. BJSM 52, 298–302. doi:10.1136/bjsports-2017-098273
Bowring, B., and Chockalingam, N. (2010). Conservative treatment of tibialis posterior tendon dysfunction—a review. Foot 20, 18–26. doi:10.1016/j.foot.2009.11.001
Butler, R. J., Davis, I. M., Laughton, C. M., and Hughes, M. (2003). Dual-function foot orthosis: Effect on shock and control of rearfoot motion. Foot Ankle Int. 24, 410–414. doi:10.1177/107110070302400506
Cheung, R. T. H., Chung, R. C. K., and Ng, G. Y. F. (2011). Efficacies of different external controls for excessive foot pronation: A meta-analysis. Br. J. Sports Med. 45, 743–751. doi:10.1136/bjsm.2010.079780
Chevalier, T. L., and Chockalingam, N. (2011). Foot orthoses: A review focusing on kinematics. J. Am. Podiatr. Med. Assoc. 101, 341–348. doi:10.7547/1010341
Collins, T. D., Ghoussayni, S. N., Ewins, D. J., and Kent, J. A. (2009). A six degrees-of-freedom marker set for gait analysis: Repeatability and comparison with a modified helen hayes set. Gait Posture 30, 173–180. doi:10.1016/j.gaitpost.2009.04.004
Davis, J. A. (1985). Anaerobic threshold: Review of the concept and directions for future research. MSSE 17, 6–18. doi:10.1249/00005768-198502000-00003
De Mits, S., Segers, V., Woodburn, J., Elewaut, D., De Clercq, D., and Roosen, P. (2012). A clinically applicable six-segmented foot model. J. Orthop. Res. 30, 655–661. doi:10.1002/jor.21570
Desmyttere, G., Hajizadeh, M., Bleau, J., and Begon, M. (2018). Effect of foot orthosis design on lower limb joint kinematics and kinetics during walking in flexible pes planovalgus: A systematic review and meta-analysis. Clin. Biomech. (Bristol, Avon) 59, 117–129. doi:10.1016/j.clinbiomech.2018.09.018
Desmyttere, G., Leteneur, S., Hajizadeh, M., Bleau, J., and Begon, M. (2020). Effect of 3D printed foot orthoses stiffness and design on foot kinematics and plantar pressures in healthy people. Gait Posture 81, 247–253. doi:10.1016/j.gaitpost.2020.07.146
Desmyttere, G., Hajizadeh, M., Bleau, J., Leteneur, S., and Begon, M. (2021). Anti-pronator components are essential to effectively alter lower-limb kinematics and kinetics in individuals with flexible flatfeet. Clin. Biomech. (Bristol, Avon) 86, 105390. doi:10.1016/j.clinbiomech.2021.105390
Eng, J. J., and Pierrynowski, M. R. (1994). The effect of soft foot orthotics on three-dimensional lower-limb kinematics during walking and running. Phys. Ther. 74, 836–844. doi:10.1093/ptj/74.9.836
Fong, D. T. P., Lam, M.-H., Lao, M. L. M., Chan, C. W. N., Yung, P. S. H., Fung, K.-Y., et al. (2008). Effect of medial arch-heel support in inserts on reducing ankle eversion: A biomechanics study. J. Orthop. Surg. Res. 3, 7. doi:10.1186/1749-799x-3-7
Franklyn-Miller, A., Wilson, C., Bilzon, J., and Mccrory, P. (2011). Foot orthoses in the prevention of injury in initial military training: A randomized controlled trial. Am. J. Sports Med. 39, 30–37. doi:10.1177/0363546510382852
Gerrard, J. M., Bonanno, D. R., Whittaker, G. A., and Landorf, K. B. (2020). Effect of different orthotic materials on plantar pressures: A systematic review. J. Foot Ankle Res. 13, 35. doi:10.1186/s13047-020-00401-3
Handsaker, J. C., Forrester, S. E., Folland, J. P., Black, M. I., and Allen, S. J. (2016). A kinematic algorithm to identify gait events during running at different speeds and with different footstrike types. J. Biomech. 49, 4128–4133. doi:10.1016/j.jbiomech.2016.10.013
Healy, A., Dunning, D. N., and Chockalingam, N. (2012). Effect of insole material on lower limb kinematics and plantar pressures during treadmill walking. Prosthetics Orthot. Int. 36, 53–62. doi:10.1177/0309364611429986
Hoogkamer, W., Kipp, S., and Kram, R. (2019). The biomechanics of competitive male runners in three marathon racing shoes: A randomized crossover study. Sports Med. 49, 133–143. doi:10.1007/s40279-018-1024-z
Jafarnezhadgero, A., Madadi-Shad, M., Alavi-Mehr, S. M., and Granacher, U. (2018). The long-term use of foot orthoses affects walking kinematics and kinetics of children with flexible flat feet: A randomized controlled trial. PLoS One 13, e0205187. doi:10.1371/journal.pone.0205187
Kermen, E., and Mohammadi, H. (2021). Mechanics of foot orthotics: Material properties. J. Med. Eng. Technol. 45, 627–641. doi:10.1080/03091902.2021.1940332
Kirby, K. A. (2017). “Evolution of foot orthoses in sports,” in Athletic footwear and orthoses in sports medicine (Springer).
Martinez-Rico, M., Deschamps, K., Gijon-Nogueron, G., and Ortega-Avila, A. B. (2022). Impact of in shoe and barefoot placed frontal wedges on plantar loading: A systematic review. Gait Posture 97, 62–72. doi:10.1016/j.gaitpost.2022.07.233
Mccormick, C. J., Bonanno, D. R., and Landorf, K. B. (2013). The effect of customised and sham foot orthoses on plantar pressures. J. Foot Ankle Res. 6, 19. doi:10.1186/1757-1146-6-19
Mündermann, A., Nigg, B. M., Humble, R. N., and Stefanyshyn, D. J. (2003). Foot orthotics affect lower extremity kinematics and kinetics during running. Clin. Biomech. (Bristol, Avon) 18, 254–262. doi:10.1016/s0268-0033(02)00186-9
Mundermann, A., Nigg, B. M., Neil Humble, R., and Stefanyshyn, D. J. (2003). Orthotic comfort is related to kinematics, kinetics, and EMG in recreational runners. MSSE 35, 1710–1719. doi:10.1249/01.mss.0000089352.47259.ca
Mündermann, A., Nigg, B. M., Humble, R. N., and Stefanyshyn, D. J. (2004). Consistent immediate effects of foot orthoses on comfort and lower extremity kinematics, kinetics, and muscle activity. J. Appl. Biomech. 20, 71–84. doi:10.1123/jab.20.1.71
Munteanu, S. E., Landorf, K. B., Menz, H. B., Cook, J. L., Pizzari, T., and Scott, L. A. (2009). Efficacy of customised foot orthoses in the treatment of Achilles tendinopathy: Study protocol for a randomised trial. J. Foot Ankle Res. 2, 27. doi:10.1186/1757-1146-2-27
Nicolopoulos, C. S., Black, J., and Anderson, E. G. (2000). Foot orthoses materials. Foot 10, 1–3. doi:10.1054/foot.1999.0531
Özmanevra, R., Angin, S., Günal, İ. H., and Elvan, A. (2018). Effect of different insole materials on kinetic and kinematic variables of the walking gait in healthy people. J. Am. Podiatric Med. Assoc. 108, 390–396. doi:10.7547/16-175
Pataky, T. C., Vanrenterghem, J., and Robinson, M. A. (2015). Zero-vs. one-dimensional, parametric vs. non-parametric, and confidence interval vs. hypothesis testing procedures in one-dimensional biomechanical trajectory analysis. J. Biomech. 48, 1277–1285. doi:10.1016/j.jbiomech.2015.02.051
Redmond, A. C., Crosbie, J., and Ouvrier, R. A. (2006). Development and validation of a novel rating system for scoring standing foot posture: The foot posture Index. Clin. Biomech. (Bristol, Avon) 21, 89–98. doi:10.1016/j.clinbiomech.2005.08.002
Telfer, S., Abbott, M., Steultjens, M. P., and Woodburn, J. (2013). Dose-response effects of customised foot orthoses on lower limb kinematics and kinetics in pronated foot type. J. Biomech. 46, 1489–1495. doi:10.1016/j.jbiomech.2013.03.036
Van Alsenoy, K., Ryu, J. H., and Girard, O. (2019a). The effect of EVA and TPU custom foot orthoses on running economy, running mechanics, and comfort. Front. Sports Act. Living 1, 34. doi:10.3389/fspor.2019.00034
Van Alsenoy, K., Thomson, A., and Burnett, A. (2019b). Reliability and validity of the Zebris FDM-THQ instrumented treadmill during running trials. Sports Biomech. 18, 501–514. doi:10.1080/14763141.2018.1452966
Keywords: insoles, steady state running, kinematics, orthotic materials, motion capture
Citation: Van Alsenoy K, van der Linden ML, Ryu JH, Girard O, Al Raisi L and Santos D (2023) Isolated and combined effects of EVA and TPU custom foot orthoses on constant speed, treadmill running kinematics. Front. Earth Sci. 11:1170661. doi: 10.3389/feart.2023.1170661
Received: 21 February 2023; Accepted: 26 June 2023;
Published: 07 July 2023.
Edited by:
Shuyuan Li, Steps2walk, Inc., United StatesReviewed by:
Teresa Alpert, University of Colorado, United StatesCopyright © 2023 Van Alsenoy, van der Linden, Ryu, Girard, Al Raisi and Santos. This is an open-access article distributed under the terms of the Creative Commons Attribution License (CC BY). The use, distribution or reproduction in other forums is permitted, provided the original author(s) and the copyright owner(s) are credited and that the original publication in this journal is cited, in accordance with accepted academic practice. No use, distribution or reproduction is permitted which does not comply with these terms.
*Correspondence: Ken Van Alsenoy, a2VudmFuYWxzZW5veUBnbWFpbC5jb20=
†ORCID: Ken Van Alsenoy, orcid.org/0000-0002-0430-965X; Marietta L. van der Linden, orcid.org/0000-0003-2256-6673; Joong Hyun Ryu, orcid.org/0000-0002-9424-190X; Olivier Girard, orcid.org/0000-0002-4797-182X; Lubna Al Raisi, orcid.org/0000-0002-1711-5539; Derek Santos, orcid.org/0000-0001-9936-715X
Disclaimer: All claims expressed in this article are solely those of the authors and do not necessarily represent those of their affiliated organizations, or those of the publisher, the editors and the reviewers. Any product that may be evaluated in this article or claim that may be made by its manufacturer is not guaranteed or endorsed by the publisher.
Research integrity at Frontiers
Learn more about the work of our research integrity team to safeguard the quality of each article we publish.