 Qiule He
 Xingxing Kuang
 Enze Ma2
 Chunmiao Zheng
- 1School of Environment, Harbin Institute of Technology, Harbin, China
- 2Guangdong Provincial Key Laboratory of Soil and Groundwater Pollution Control, School of Environmental Science and Engineering, Southern University of Science and Technology, Shenzhen, China
- 3State Environmental Protection Key Laboratory of Integrated Surface Water-Groundwater Pollution Control, School of Environmental Science and Engineering, Southern University of Science and Technology, Shenzhen, China
- 4Hebei Center for Ecological and Environmental Geology Research, Hebei GEO University, Shijiazhuang, China
The southeastern part of the Tibetan Plateau (TP), one of the regions with the largest glacier distribution on the plateau, has been experiencing a significant loss in glacier mass balance (GMB) in recent decades due to climate warming. In this study, we used the Spatial Processes in Hydrology (SPHY) model and satellite data from LANDSAT to reconstruct the runoff components and glacier mass balance in the Niyang River basin (NRB). The measured river discharge data in the basin during 2000–2008 were used for model calibration and validation. Then, the validated model was applied to reconstruct the runoff components and GMB in the Niyang River basin for the period 1969–2013. Results showed that rainfall runoff (67%) was the dominant contributor to total runoff, followed by snowmelt runoff (14%), glacier melt runoff (10%), and baseflow (9%). The NRB experienced a severe loss in GMB, with a mean value of −1.26 m w. e./a (corresponding to a cumulative glacier mass loss of −56.72 m w. e.) during 1969–2013. During periods Ⅰ (1969–1983), Ⅱ (1984–1998), and Ⅲ (1999–2013) glacier mass loss was simulated at rates of −1.27 m w. e./a, −1.18 m w. e./a, and −1.33 m w. e./a, respectively. The annual loss of glacier mass in the northern region of the NRB (−1.43 m w. e./a) was significantly greater than that of the southern region (−0.53 m w. e./a) from 1969 to 2013, largely due to temperature variations, especially in summer months. These findings enhance our understanding of how different hydrological processes respond to climate change and provide a potential method to study runoff components and GMB in other glacierized catchments worldwide.
1 Introduction
The Tibetan Plateau (TP), also known as the Third Pole (Qiu, 2008), is a vital source region for the major rivers in Asia, such as the Yangtze River, the Yellow River, the Mekong River, and the Yarlung Zangbo River (Immerzeel et al., 2010). The TP has the largest distribution of glaciers outside the polar regions and Greenland (Yao et al., 2012). The southeastern TP, which includes the Eastern Nyainqentanglha Ranges, Eastern Himalayas, and Western Hengduan Mountains, is notable for the largest maritime glaciers (∼74,000 km2) over the TP (Shi et al., 2008).
The TP has experienced significant climate warming over the past few decades, with a warming rate that is about twice the global average rate (Chen et al., 2015; Kuang and Jiao, 2016; Yao et al., 2019; You et al., 2021). As a result of climate warming, glaciers in the southeastern TP have been undergoing serious mass loss, which is about three times higher than the average across the entire TP (Gardner et al., 2013; Kääb et al., 2015; Brun et al., 2017; Shean et al., 2020). The southeastern TP is also known for experiencing the highest rate of terrestrial water storage depletion in the world due to the melting of long-term perennial snow and glacier caused by climate warming (Yao et al., 2012; Meng et al., 2019; Yi et al., 2020; Qiao et al., 2021). There is growing concern about the impact of the warming of the southeastern TP on various runoff components (e.g., rainfall runoff, glacier melt runoff, snowmelt runoff, and baseflow) of the rivers in this area (Immerzeel et al., 2013; Lutz et al., 2014).
Currently, glacio-hydrological models are the most commonly used method for quantifying and predicting various runoff components of rivers in the southeastern TP (Prasch et al., 2013; Lutz et al., 2014; Chen et al., 2017; Wijngaard et al., 2017; 2018; Zhang et al., 2020; Khanal et al., 2021). Using the PROMET watershed model (Mauser and Bach, 2009), Prasch et al. (2013) found that total runoff in the Lhasa River basin is dominated by monsoon precipitation and snowmelt, with glacier melt runoff being a minor runoff component and expected to continue being a minor component in the future. Chen et al. (2017) used a distributed hydrological model and found that snowmelt runoff and glacier melt runoff contributed 10.6% and 9.9%, respectively, to the total runoff of the Yarlung Zangbo basin during 2003–2015. Based on the VIC model (Liang et al., 1994), Zhang et al. (2020) found that glacier melt runoff showed a significant rising trend and it accounted for up to 41% of the increase of total runoff in the upstream of the Niyang River basin (NRB) during 1963–2012. Compared with the various methods (Prasch et al., 2013; Chen et al., 2017; Zhang et al., 2020), the Spatial Processes in Hydrology model (SPHY), a physics-based fully-distributed hydrological model involving cryosphere processes, is well-suited for quantifying runoff components at high-resolution spatial-temporal scales (Lutz et al., 2014; Wijngaard et al., 2017; Wijngaard et al., 2018; Khanal et al., 2021). Lutz et al. (2014) used the SPHY model to project total runoff in the Yarlung Zangbo basin and found that the total runoff will increase at least until the mid-21st century, mainly due to an increase in precipitation. Using the SPHY model, Wijngaard et al. (2018) found that although the total runoff in the Yarlung Zangbo basin is expected to increase due to the increase of monsoon precipitation, the associated increase in water demand by the economic development will likely lead to a crisis in water resources during the 21st century. The SPHY model has been widely used to investigate the evolution of cryosphere hydrologic processes (Lutz et al., 2014; Wijngaard et al., 2018) and GMB (Wijngaard et al., 2017; Khanal et al., 2021) in the southeastern TP in response to climate change.
GMB is one of the key glaciological parameters characterizing the accumulation and ablation of glaciers, which is sensitive to climate change (Yao et al., 2012). GMB is an important link between glaciers, climate, and water resources (Huss and Hock, 2018; Zemp et al., 2019). Several methods have been applied to estimate GMB in the southeastern TP at different spatiotemporal scales: in situ observations (−1.54 ± 0.30 m w. e./a to −1.1 m w. e./a, 1951–2020) (Yao et al., 2012; Yan et al., 2021), remote sensing technology including DEM difference (−0.30 ± 0.12 m w. e./a to −0.11 ± 0.14 m w. e./a, mid-1970s to 2000) (Zhou et al., 2018), satellite altimetry (−0.66 ± 0.02 m w. e./a, 2003–2020) (Zhao et al., 2022), satellite gravity (−0.67 ± 0.08 m w. e./a, 2002–2017) (Yi et al., 2020), and glaciation model (−0.90 m w. e./a to −0.76 m w. e./a, 2003–2010) (Yang et al., 2013; Yang et al., 2016).
Due to the complex topography of the southeastern TP, it is difficult to widely use field measurements, particularly the regional GMB (Zhao et al., 2022). Remote sensing technology has a high degree of uncertainty and low spatial resolution, and cannot explain the processes and mechanisms behind the response of glaciers to climate change (Paul et al., 2017; Li et al., 2021; Zhao et al., 2022). Glaciation models are a useful tool for reconstructing and predicting the GMB in regions where long-term field measurements are lacking (Gao et al., 2012; Yang et al., 2016; Azam et al., 2019; Shi et al., 2020). Yang et al. (2016) used an energy balance model to reconstruct the GMB history (1980–2010) of Parlung No.94 Glacier in the southeastern TP and explained it using macroscale atmospheric variables. Using a temperature index-based model, Shi et al. (2020) reconstructed and projected the GMB of the Dongkemadi Ice Field under different climate scenarios. However, there is a lack of research on changes in GMB and runoff components in response to climate change in the southeastern TP at a basin scale.
To address this research gap, this study chooses the glacierized NRB as the study area, which is a major tributary of the Yarlung Zangbo River located in the southeastern TP. The measured river discharge data in the Gengzhang station during 2000–2008 were used for SPHY model calibration and validation. Then the validated SPHY model was applied to reconstruct the runoff components and GMB in the NRB for the period 1969–2013. The objectives of this study are: 1) to quantify the contribution of different runoff components to total runoff and their evolution in response to climate change, 2) to reconstruct the temporal-spatial variations in GMB, and 3) to explore the driving factors of runoff and GMB changes and their internal relationships.
2 Study site and data
2.1 Study site
The NRB (92°10′-94°35′E, 29°28′-30°31′N) is located in the southeastern TP and it originates from the west of the Mila Mountains (Figure 1). The Niyang River, the fourth largest tributary of the Yarlung Zangbo River, flows 307.5 km before joining the Yarlung Zangbo River in Linzhi City (Xuan et al., 2018). The NRB covers an area of 17,801 km2, with an altitude range from 2,924 to 6,857 m (Figure 1).
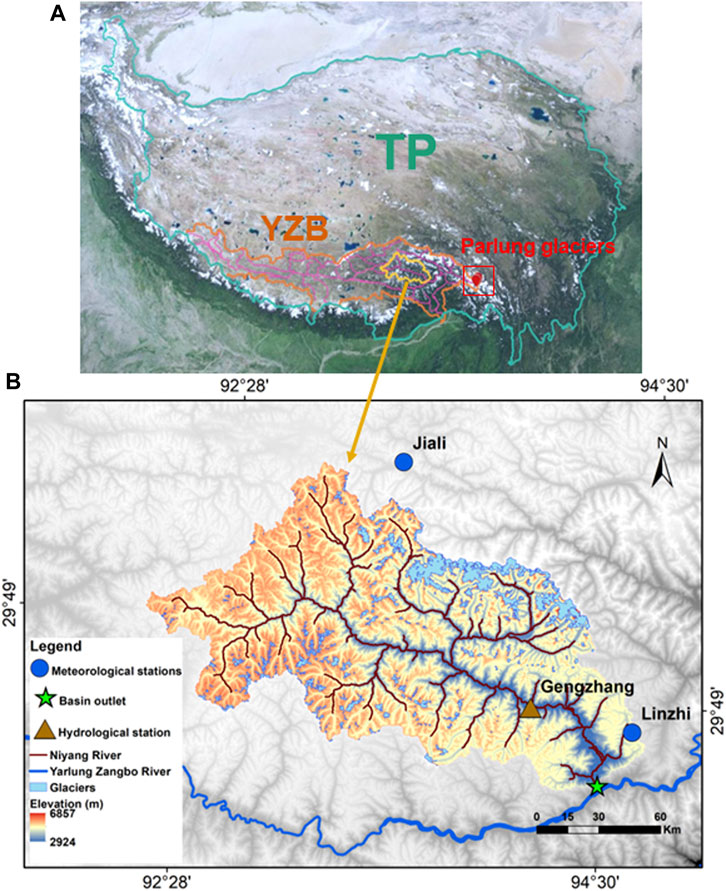
FIGURE 1. Study area description. (A) The location of Niyang River basin (NRB) in the TP; (B) Overview of the NRB and locations of the hydrological and meteorological stations. TP: Tibetan Plateau; YZB: Yarlung Zangbo basin.
The NRB is located in a humid temperate climate zone, with the highest and lowest temperatures occurring in July and January, respectively (Zhang et al., 2011; Xuan et al., 2018). The summer climate of the NRB is influenced by the Indian monsoon, leading to a rainy season from May to October (Zhang et al., 2011). The mean annual precipitation of the NRB ranges from 600 to 900 mm, with 90% occurring from May to October (Zhang et al., 2011; Xuan et al., 2018). During 1969–2013, the annual mean temperature was found to be 5.39°C with a warming rate of 0.029°C/a (Figure 2). From 1969 to 2013, the annual mean precipitation in the NRB was recorded to be 705 mm with an increasing rate of 1.01 mm/a (Figure 2).
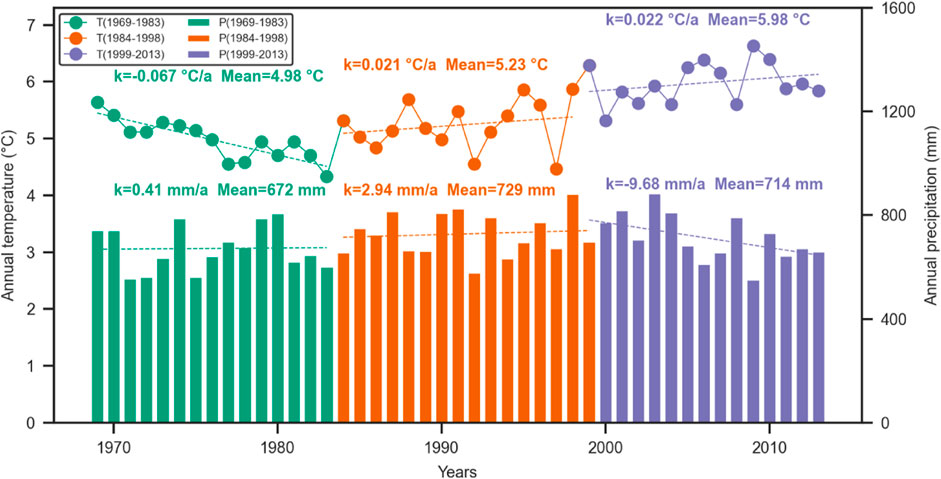
FIGURE 2. Interannual variations of annual mean temperature and annual precipitation in the NRB from 1969 to 2013.
The NRB is a typical glacierized basin, with an area of 953 km2 covered by glaciers (Zhang et al., 2011), representing approximately 5.3% of the basin’s total area, according to the Second Chinese Glacier Inventory (https://data.tpdc.ac.cn/en/data/f92a4346-a33f-497d-9470-2b357ccb4246/). According to a satellite sensors-based dataset, the glacier area shrunk by 30% between 1987 and 2013, with a decreasing rate of −0.8%/a during this period from 923 km2 in 1987 to 650 km2 in 2013 (Figure 3). Due to the high altitude and cold climate, the vegetation cover in the NRB is primarily composed of forest, shrub grass, and alpine meadow (Jin et al., 2019).
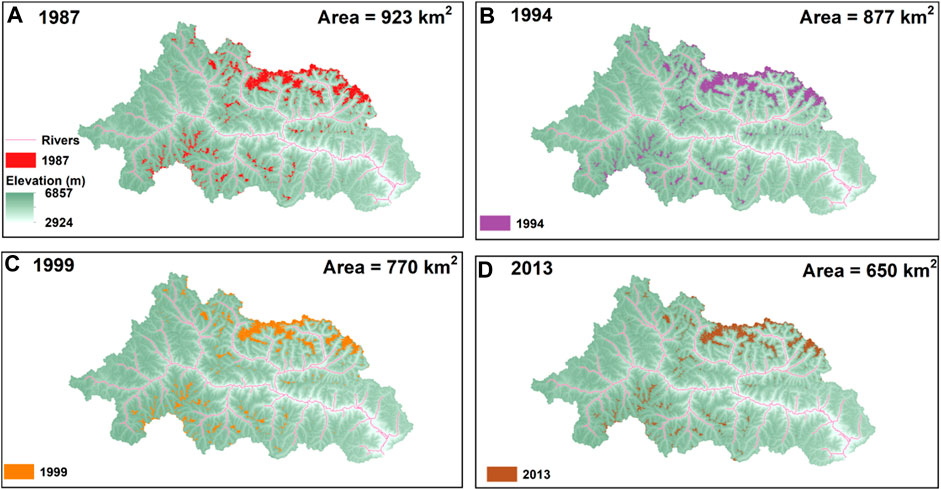
FIGURE 3. Temporal variations in the NRB highlight the reduction in glacier area from 1987 to 2013. (A) 1987; (B) 1994; (C) 1999; and (D) 2013.
2.2 Data
Annual mean temperature, monthly mean temperature, annual mean precipitation, and monthly mean precipitation were used to analyze the interannual and intra-annual variations of temperature and precipitation in the NRB during 1969–2013. Daily average, maximum, minimum temperature, and daily precipitation were the main forcing data for the SPHY model. Daily runoff was used to calibrate and validate the model’s performance. Daily temperature and precipitation during 1969–2013 were obtained from two national meteorological stations (Jiali and Linzhi, Figure 1) in the China Meteorological Information Center (http://data.cma.cn/). Daily runoff data at Gengzhang hydrological station (Figure 1) during 2000–2008 was obtained from Jin et al. (2019). Annual GMB data during 2006–2010 at the Parlung Glaciers (Table 1), located in the headwaters of the Palung Zangpo River (Figure 1), came from Yao et al. (2012).
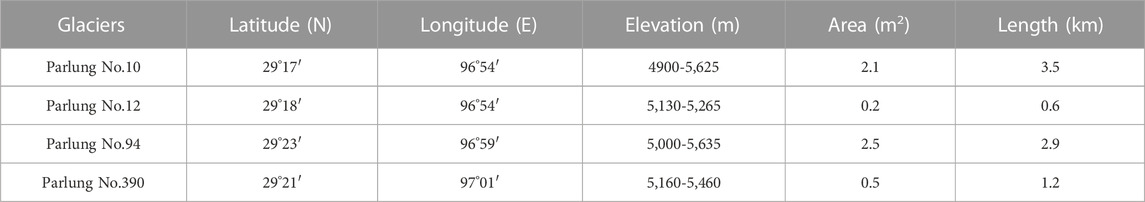
TABLE 1. Detailed information on the Parlung Glaciers (Yao et al., 2012).
Other model input data include topographic data from the digital elevation model (DEM), soil physical parameters, land use data, and glacier contour data. The topographic data of the NRB was obtained from the SRTM DEM of the United States Geological Survey (USGS) with a spatial resolution of 30 m (https://earthexplorer.usgs.gov/). The Chinese soil dataset of the World Soil Database version 1.1 (HWSD V1.1) was used to obtain soil physical parameter maps at a spatial resolution of 500 m (http://soilgrids1km.isric.org/), which is provided by the National Cryospheric Desert Data Center. The land use data came from the Globcover dataset with different crop coefficients with a spatial resolution of 300 m (Ouellet Dallaire et al., 2019).
To explore changes in glacier area and obtain the input glacier maps for the SPHY model in different periods, Landsat 8-9 OLI/TIRS, Landsat 4-5 TM, and Landsat 8 satellite sensors-based dataset from Geospatial Data Cloud (http://www.gscloud.cn/) were used. Fortunately, in the years 1987, 1994, 1999, and 2013 (Figure 3), the selected study area was at the center of the ETM+ scenario and was hardly affected by scan line errors (Mir et al., 2017). Details of these satellite datasets are shown in Table 2. To analyze changes in different runoff components, the entire period (1969–2013) was divided into three time periods: (i) period Ⅰ, 1969–1983; (ii) period Ⅱ, 1984–1998; and (iii) period Ⅲ, 1999–2013. During 1969–2013, the climate of the studied basin (including temperature and precipitation) had undergone significantly different change patterns during the three stages: 1969–1983, 1984–1998, and 1999–2013 (Figure 2). During period Ⅰ (1969–1983), the temperature notably decreased at a rate of −0.067°C/a (Figure 2). During period Ⅱ (1984–1998), there was little change in both the temperature and precipitation (Figure 2). During period Ⅲ (1999–2013), the precipitation remarkably decreased with a rate of −9.68 mm/a (Figure 2). Therefore, we chose 1983 and 1998 as the dividing times for the three modeling periods. The main objective of dividing into three periods was to analyze the influences of varying climate conditions, such as temperature and precipitation variations, on glacier area, runoff components, and GMB in the NRB over the past decades. The glacier maps from 1987, 1994, and 1999 were used in the three simulation periods of the SPHY model for 1969–1983 (Ⅰ), 1984–1998 (Ⅱ), and 1999–2013 (Ⅲ), respectively (Figure 3).
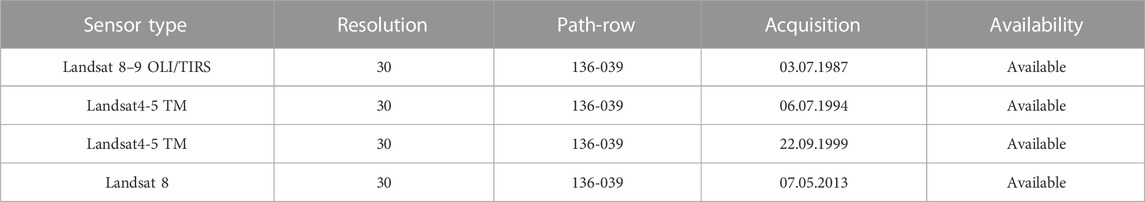
TABLE 2. Satellite dataset available for the study area.
3 Methods
3.1 Glacio-hydrological model
The SPHY v2.2 model (Terink et al., 2015), a spatially distributed water balance model, was adopted to simulate four runoff components: rainfall runoff, glacier melt runoff, snowmelt runoff, and baseflow. The model is applicable on a grid-by-grid basis and is suitable for conceptually studying cryosphere-hydrological processes, allowing for the evaluation of spatial and temporal variations in fluxes (Terink et al., 2015). The SPHY model was simulated at a daily time step at 1.2 km × 1.2 km spatial resolution during 1969–2013. At any given time step in the model, the total runoff for each grid cell is the sum of the four runoff components (Terink et al., 2015):
where
3.1.1 Rainfall and snowfall
In the SPHY model, precipitation is treated as either snowfall (solid form) or rainfall (liquid form) based on a temperature threshold (Terink et al., 2015):
where
3.1.2 Snowmelt and glacier melt runoff
The degree-day factor (
where
Snowmelt runoff (
The daily glacier melt (
where
Only a fraction of glacier melt becomes runoff (
where
3.1.3 GMB calculation
Based on the water balance principle, the daily GMB (mm w. e./d/°C) can be obtained by
where
3.2 Model calibration and validation
The performance of the NRB model is evaluated with observed runoff and field GMB. The observed daily runoff comes from the Gengzhang hydrological station (Figure 1), which controls 90% of the NRB area (Zhang et al., 2011). The calibration period was set to be from 2000 to 2006 to obtain the sensitivity parameters for the model (Table 3). These parameters were then used for the runoff simulation during the validation period from 2007 to 2008. The field annual GMB data at the Parlung Glaciers during 2006–2010 (Yao et al., 2012) were used as the observed mass balance data to validate the sensitivity parameters in the model (Table 4). The model’s sensitivity parameters were calibrated through a stepwise approximation method (Tiel et al., 2020). We set the parameters’ maximum and minimum values before gradually narrowing the range until optimal
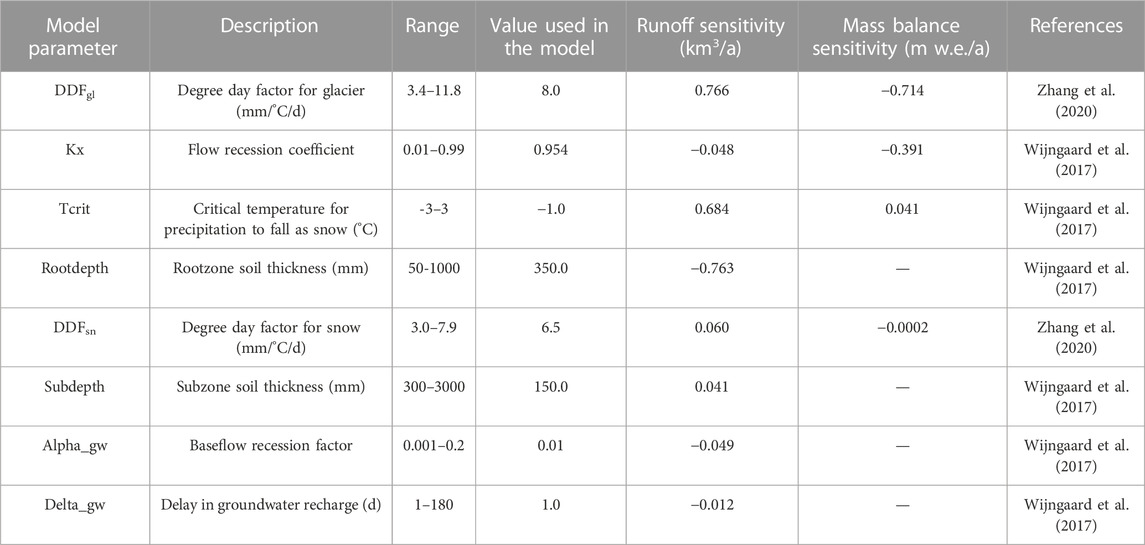
TABLE 3. List of model parameters and sensitivity of total runoff and GMB to each parameter.
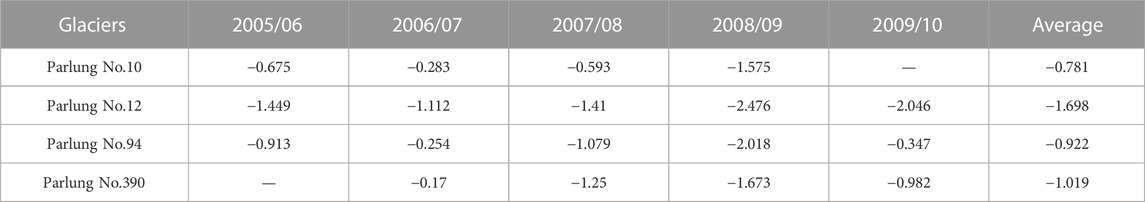
TABLE 4. Field GMB (m w.e./a) for the Parlung Glaciers (Yao et al., 2012).
The Nash-Sutcliffe Efficiency (
where
The Root Mean Square Error (
where
3.3 Model sensitivity analysis
The relative sensitivity of the main sensitive parameters was evaluated by re-running the model, changing each parameter according to the corresponding reasonable range (maximum parameter value,
Where
4 Results
4.1 Performance of the SPHY model
The performance of the SPHY model in simulating the daily runoff of the NRB is shown in Figure 4. The model exhibits reasonably simulated runoff, with an
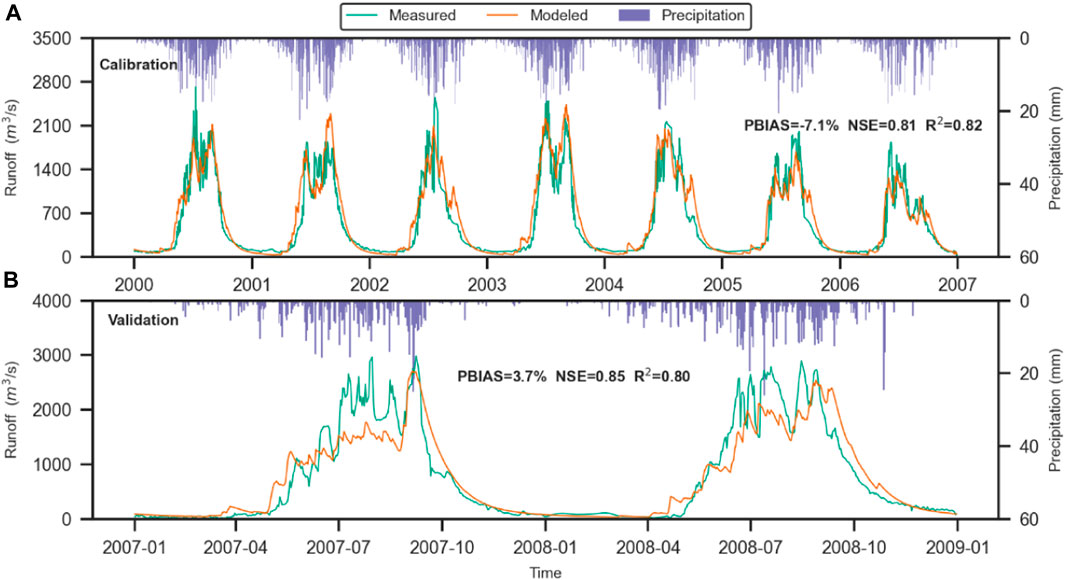
FIGURE 4. Comparison of simulated and observed daily runoff. (A) Calibration period from 2000 to 2007; (B) validation period from 2007 to 2009.
Figure 5 shows a comparison between field GMB at the Parlung Glaciers (Table 4) and modeled annual GMB during 2006–2100. The comparison shows good agreement between the modeled and measured annual GMB, with a
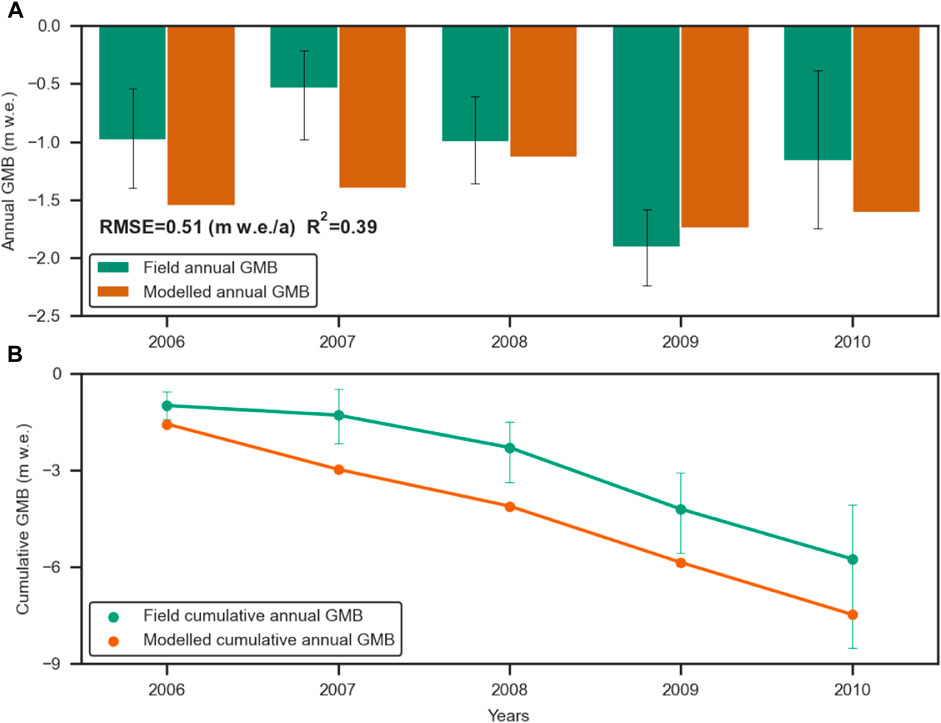
FIGURE 5. Comparison of modeled GMB with field GMB from 2006 to 2010. (A) Comparison of annual GMB; (B) Comparison of cumulative GMB. Black error bars represent the standard deviations of the mean.
The simulated model sensitivities of parameters for runoff and GMB are given in Table 3. For runoff
4.2 Reconstructing temporal and spatial variations of runoff components
Each runoff component, reconstructed in Figure 6, had a large interannual variation in response to climate change (Figure 2). During 1969–2013, annual total runoff showed a slightly increasing trend with a rate of 0.086 km3/a (Figure 6A). However, due to the decrease in precipitation since 1999 (Figure 2), annual total runoff showed an obvious decreasing trend (−0.42 km3/a) during 1999–2013 (Figure 6A). Rainfall runoff (Figure 6B) fluctuated similarly to precipitation variation (Figure 2). The changing rates of rainfall runoff were 0.32 km3/a, 0.12 km3/a, and −0.45 km3/a during 1969–1983, 1984–1998, and 1999–2013, respectively (Figure 6B). In general, the total runoff was largely influenced by the changing pattern of rainfall runoff (Figure 6B). Glacier melt runoff showed a decreasing trend (−0.02 km3/a, Figure 6C) during 1969–1983 due to a decrease in temperature (Figure 2). Whereas glacier melt runoff increased from 1.64 km3 in 1984 to 2.54 km3 in 2013, with an increasing rate of 0.037 km3/a and 0.048 km3/a over the two periods of 1984–1998 and 1999–2013 (Figure 6C). Although the warming climate (Figure 2) produced more glacier melt runoff, the overall glacier melt runoff slightly decreased from 1969 to 2013 (−0.006 km3/a, Figure 6C) due to the sharp reduction of glacier area (Figure 3). The warming climate (Figure 2) led to a decrease in snowfall, and snowmelt runoff showed a weak decreasing trend (−0.005 km3/a, Figure 6D) during 1969–2013. During 1969–1983 and 1984–1998, increasing precipitation (Figure 2) also led to an increase in snowmelt runoff (Figure 6D). Baseflow, which is mainly produced by groundwater recharged from precipitation and a fraction of glacier melt (Wu et al., 2021), is strongly correlated with precipitation (Figure 2). The baseflow showed a slightly increasing trend (0.003 km3/a, Figure 6E) during 1969–2013. Among the four runoff components, baseflow is the most stable component with relatively small interannual fluctuations (Figure 6E).
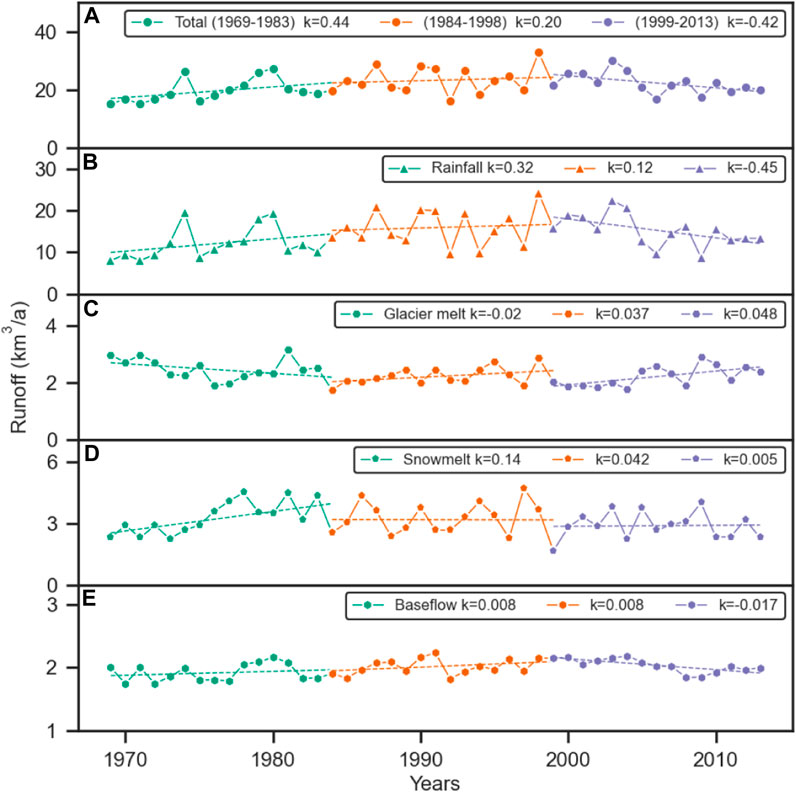
FIGURE 6. Interannual variation of simulated runoff components from 1969 to 2013. (A) Total runoff; (B) rainfall runoff; (C) glacier melt runoff; (D) snowmelt runoff; (E) baseflow.
The spatial distribution of different runoff components and their contribution to the average annual total runoff from 1969 to 2013 is reconstructed in Figure 7. Rainfall runoff was the most important component, accounting for 67% of the total runoff in the entire basin. The contribution increased to 85% at the outlet of the basin (Figure 7A). Glacier melt runoff had a generally small contribution (10%), especially in the upper and lower reaches of rivers. However, in the northeast of the basin, a region with more glaciers, glacier melt runoff accounted for more than 70% of the total runoff (Figure 7B). Snowmelt runoff contributed more than 20% of total runoff in the upper reaches and gradually decreased in the lower reaches, with an average value of 14% (Figure 7C). The contribution of baseflow to the total runoff changed similarly to that of snowmelt runoff, which was higher in the upper reaches and gradually decreased in the lower reaches, with an average value of 9% (Figure 7D).
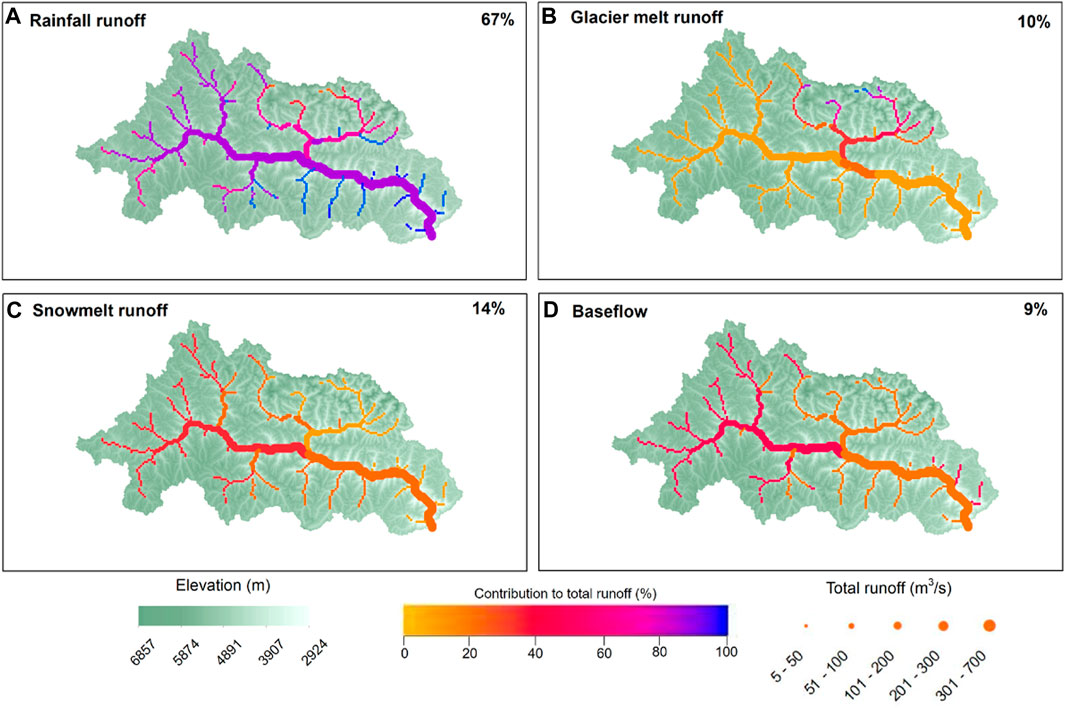
FIGURE 7. Runoff components of the average annual total runoff during 1969–2013. (A) Rainfall runoff; (B) glacier melt runoff; (C) snowmelt runoff; (D) baseflow. The size of the points represents the magnitude of the total annual runoff, and the color indicates the relative contribution to the total annual runoff.
Temperature and precipitation in the NRB exhibited significant seasonal characteristics, and the four runoff components responded differently to changes in temperature and precipitation. Figure 8 shows the seasonal changes in rainfall runoff, glacier melt runoff, snowmelt runoff, and baseflow, along with the mean monthly precipitation (rain and snow) and temperature for different periods in the NRB.
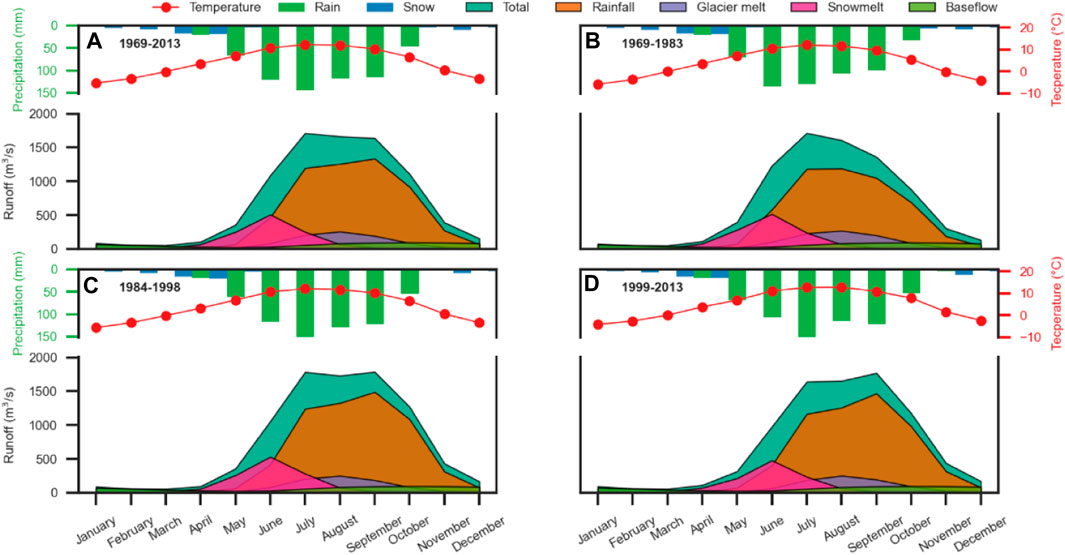
FIGURE 8. Monthly precipitation (snow and rain), monthly temperature, and different monthly runoff components for different periods. (A) 1969–2013; (B) 1969–1983; (C) 1984–1998; (D) 1999–2013.
During 1969–2013, 91% of the annual precipitation was in the form of rain, with the majority (70%) falling between June and September (Figure 8A). The seasonal characteristics of total runoff clearly corresponded to that of precipitation and rainfall runoff, with the months of highest precipitation also experiencing the highest rainfall runoff and total runoff (Figure 8A). The early total runoff was primarily generated by rainfall runoff, which started in April and peaked in July (1,196 m3/s) and September (1,335 m3/s) during 1969–2013 (Figure 8A). Monthly glacier melt runoff mainly occurred from May to October when the monthly mean temperature was over 0°C, with peaks in July (207 m3/s) and August (257 m3/s) corresponding to the highest temperature in July (12.3°C) and August (12.1°C) during 1969–2013 (Figure 8A). During 1969–2013, 9% of the annual precipitation was in the form of snowfall, with the majority (73%) falling between January and April (Figure 8A). Snowmelt runoff mainly occurred from April to August when the monthly mean temperature was above 0°C, with June (508 m3/s) being the largest month for snowmelt runoff during 1969–2013 (Figure 8A). The variation of monthly baseflow was relatively smooth, reaching the maximum value in October (98 m3/s), which shows a three months delay during 1969–2013 as the maximum rainfall appeared in July (Figure 8A).
The monthly total runoff increased slightly during 1984–1998, mainly due to an increase in rainfall runoff (Figures 8A, C). The monthly rainfall runoff increased significantly during 1984–1998 and 1999–2013, particularly after July (Figures 8C, D). The peak of monthly rainfall runoff increased from 1,189 m3/s (1969–1983) in August to 1,489 m3/s (1984–1998) and 1,466 m3/s (1999–2013) in September with more precipitation in the last two periods (Figures 8B–D). The monthly glacier melt runoff in the latter two periods decreased slightly compared with the period of 1969–1983 due to rapid glacier retreats (Figures 8B–D). The variations in monthly snowmelt runoff and baseflow were not obvious.
4.3 Reconstructing temporal and spatial variations of GMB
The annual GMB as well as cumulative GMB over the period 1969–2013 are reconstructed in Figure 9. The mean GMB was −1.26 m w. e./a with a cumulative GMB of −56.72 m w. e. during 1969–2013, which is close to the observed GMB (−1.12 m w. e./a, Figure 5A). The severe mass wastage over the 45 years (Figure 9) was mainly due to the temperature continuing to rise during 1969–2013 (Figure 2). The annual mean GMB was −1.27 m w. e./a during 1969–1983, with a slightly increasing trend (0.005 m w. e./a) during this period (Figure 9). However, since 1984, the annual GMB showed a significant decreasing trend, reaching −0.021 m w. e./a and −0.030 m w. e./a in the periods 1984–1998 and 1999–2013, respectively (Figure 9). Climate warming (Figure 2) exacerbated the loss of glacier mass in the NRB over the 45-years period.
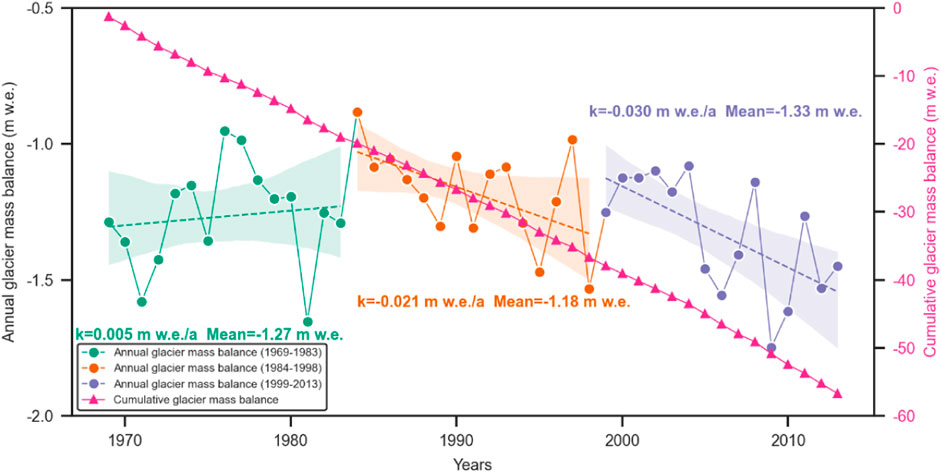
FIGURE 9. Simulated GMB and accumulative GMB in the NRB during 1969–2013.
Taking the main channel of the Niyang River as the boundary, the NRB was divided into two regions: the northern region and the southern region (Figure 10). The spatial GMB was reconstructed in Figure 10. Results showed that the GMB was mainly negative during 1969–2013 (Figure 10A). The annual GMB was as high as −1.43 w. e./a and −0.53 w. e./a in the northern and southern regions, respectively (Figure 10A). The averaged mass balance was analyzed for different periods to determine the spatial distribution of the GMB. The annual GMB showed a slight increase during 1984–1998, mainly due to the increase in precipitation (Figure 2) during this period, which contributed to the accumulation of glacier mass (Figure 10C). During 1999–2013, the GMB decreased sharply (Figure 10D) due to the increase in temperature and the decrease in precipitation (Figure 2).
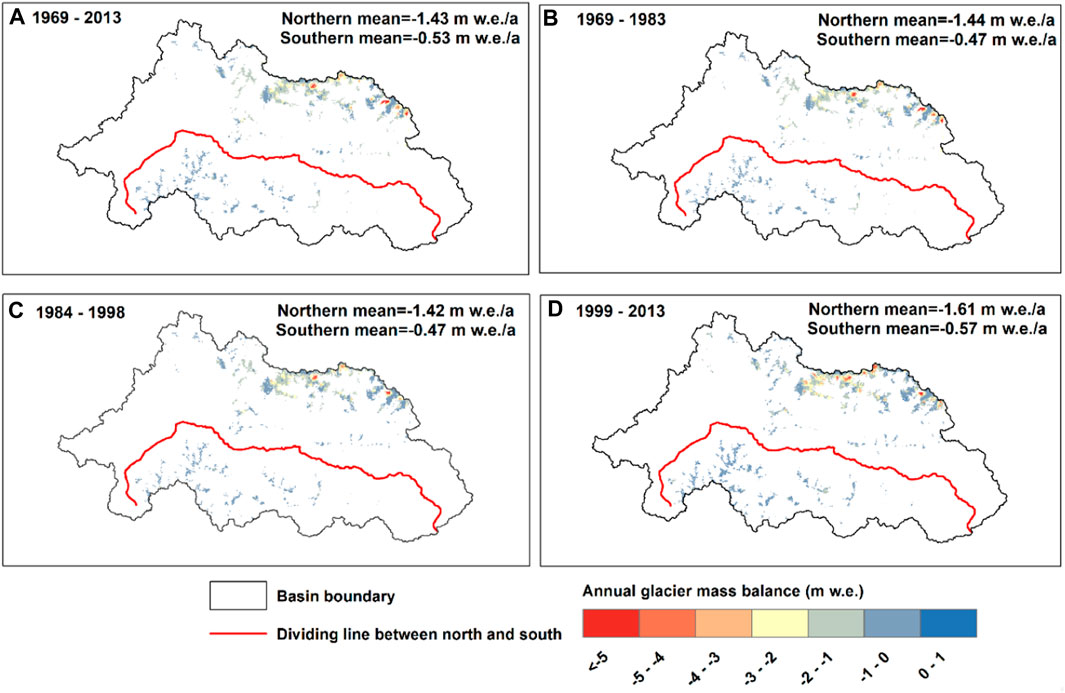
FIGURE 10. Spatial distribution of annual GMB in the NRB during different periods. (A) 1969–2013; (B) 1969–1983; (C) 1984–1998; (D) 1999–2013.
Aspects affect light, wind, and precipitation that a glacier can receive, which has significant impacts on GMB (Luo et al., 2022). Therefore, studying GMB in different aspects can help investigate the impact of climate change on glaciers. The proportion of glacier area in different aspects of the northern and southern regions during 1969–2013 was reconstructed in Figure 11. On the whole, the glacier mass loss in all aspects in the northern region was much higher than that in the southern region.
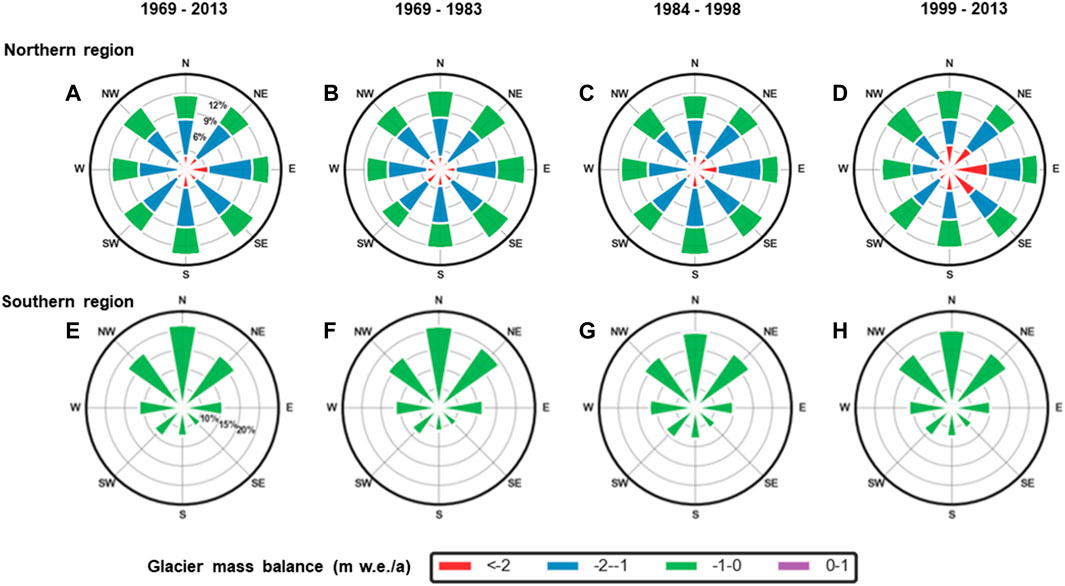
FIGURE 11. Glacier area proportion in different aspects for the northern (A–D) and southern regions (E–H) of the NRB in different periods (The length represents the area proportion and colors represent GMB). Northern region: (A) 1969–2013, (B) 1969–1983, (C) 1984–1998, (D) 1999–2013; Southern region: (E) 1969–2013, (F) 1969–1983, (G) 1984–1998, (H) 1999–2013.
In the northern region, the glacier area proportion in each aspect was similar, at around 12% (Figure 11A). The GMB in all aspects in the northern region was mainly negative during 1969–2013 (Figure 11A). In the northern region, compared with the 1969–1983 period, the proportion of glacier area in the −1 to 0 m w. e/a range increased in some aspects between 1984 and 1998, such as in the southwest (SW), west (W) and northwest (NW) aspects, increasing by 0.45%, 0.86%, and 0.59% during 1984–1998, respectively (Figures 11B, C). Compared with the 1969–1983 period, the proportion of glacier area in the less than −2 m w. e./a range increased significantly during 1999–2013 due to higher temperature in the period, with an average increase of 1.32% across all aspects (Figures 11B, D).
In the southern region, the distribution of glacier area in each aspect was highly uneven, and the glacier area was mainly concentrated in the northwest (NW), north (N), and northeast (NE) aspects. In particular, the proportion of glacier area in the N aspect reached 21.4% during 1969–2013 (Figure 11E). In the southern region, the GMB was mainly concentrated at -1-0 m w. e./a in all aspects (Figure 11E). In the southern region, compared with the 1969–1983 period, the glacier retreated significantly in the NE and east (E) aspects during 1984–1998 (Figures 11F, G).
5 Discussion
5.1 Influence of climatic factors on runoff
The NRB relies heavily on climate factors such as precipitation and temperature (Lutz et al., 2014; Xuan et al., 2018; Zhang et al., 2020). Rainfall plays a major role in maintaining rivers in the NRB, with an annual average contribution of 67% to total runoff (Figure 7A). The interannual variations of total runoff and rainfall runoff are highly consistent (Figures 6A, B), indicating that future variation of total runoff will largely depend on the variation of rainfall. In addition, due to climate warming, the recharge and regulation effects of meltwater (glacier/snow) on runoff are continuously weakened, and the influence of rainfall on runoff is gradually strengthened in the NRB. Since regional rainfall is characterized by significant fluctuations, uncertainty about future runoff changes is increasing and there is an increased risk of disasters such as floods and droughts caused by rainfall changes (Wu et al., 2021).
Meltwater (glacier/snow) and evapotranspiration are extremely sensitive to changes in temperature (Kraaijenbrink et al., 2021). The annual average contribution of melt (glacier/snow) runoff to total runoff in the NRB is about 24%, which demonstrates the importance of melt runoff in the study area (Figures 8B, C). While rising temperatures may increase glacier melt runoff in the short term, glacier melt runoff may rapidly decrease due to glacier retreat in the long term (Lutz et al., 2014). Glacier melt runoff plays a crucial role in maintaining total runoff, especially during the warm season (Zhao et al., 2019). The earlier arrival of snowmelt runoff peak and reduction of snowmelt runoff due to warming temperatures may negatively impact the sustainability of spring irrigation and threaten overall local food security in the entire NRB (Elias et al., 2015; Qin et al., 2020). Extreme warming can also lead to increased evapotranspiration, which reduces rainfall runoff to some extent in the NRB (Meng et al., 2016; Qin et al., 2017). In addition, topographic factors also affect total runoff to some extent. Total runoff generated at high elevations strongly depends on snowmelt runoff and glacier melt runoff, while total runoff generated at low elevations is dominated by rainfall runoff and baseflow processes (Figure 7) (Khanal et al., 2021; Yao et al., 2021).
5.2 Possible drivers for GMB changes
GMB is considered a fundamental climate variable and is regarded as one of the most direct indicators of climate change (Zemp et al., 2013). Summer (May-September) temperature and precipitation have been found to be the main contributors to GMB fluctuation in the glacierized region of the southeastern TP (Wu et al., 2019; Zhao et al., 2022). Using summer temperature and precipitation data from Linzhi and Jiali meteorological stations, we analyzed potential drivers of GMB changes in the northern and southern regions of the NRB during 1969–2013 (Figure 12). Results show that summer average temperature increased at rates of 0.203°C/10a and 0.184°C/10a in the northern and southern regions, respectively, which are nearly twice the average global warming rate for the same period (0.12°C/10a, 1951–2012) (IPCC et al., 2013). Figure 12 shows that the summer average temperature in the southern region (12.0°C) was higher than that of the northern region (11.49°C), indicating that the glacier ablation in the southern region was more intense during summer from 1969 to 2013. Summer precipitation showed a weak increasing trend in both the northern and southern regions (0.32 mm/a and 0.25 mm/a), which contributed little to the accumulation of glacier mass (Figure 12). Previous studies suggest that GMB for glaciers in the southeastern TP is more sensitive to temperature than precipitation (Wu et al., 2019; Zhao et al., 2022). Therefore, it can be concluded that temperature rise may be an important factor in glacier mass loss in the NRB.
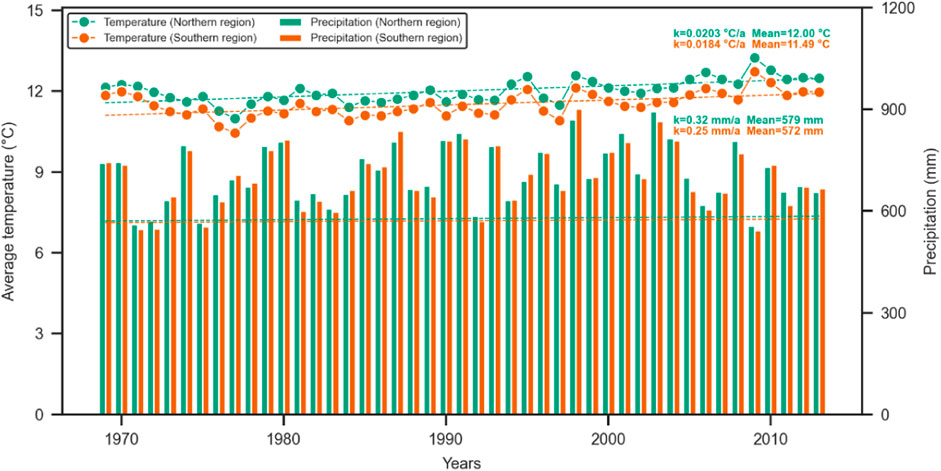
FIGURE 12. Annual variations of average temperature and precipitation (from May to September) for the northern and southern regions of the NRB during 1969–2013.
There are other factors that may affect the difference in GMB between the northern and southern regions. Snowfall is very limited (9% of total precipitation, Figure 8A) in the high-elevation areas of the NRB (Zhang et al., 2022). Besides, most of the snowfall is direct melting and litter snowfall becomes a glacial accumulation. Snowfall in the ablation and accumulation zones plays a limited role in the difference in GMB between the northern and southern regions. Yang et al. (2013) found that the annual mean sublimation of the Parlung No.94 Glacier in the southeast TP was only −0.07 m/a, which is negligible for the GMB loss. Compared with the north aspect, the south aspect could get more solar radiation, which may cause higher snow melting and sublimation rates in the south aspect (Zhang et al., 2004; Guo et al., 2017). As a result, aspect is an important factor that affects the spatial variations of GMB in the NRB (Figure 11). Wind speed and solar radiation will change with elevation, which will lead to higher snow sublimation rate in the high elevation areas (Pomeroy et al., 2003). The mean elevation of the glacierized area in the southern region (5,441 m) is higher than that of the northern region (5,326 m), which is another important factor contributing to the spatial difference in the GMB in the NRB. King et al. (2019) found that whether there was debris cover on the glacier’s surface has no significant influence on the change of GMB based on GMB in the Himalayas.
5.3 Comparison with other studies
Previous studies have found that the composition of runoff in the Yarlung Zangbo basin varies significantly due to the use of different models and data (Bookhagen and Burbank, 2010; Immerzeel et al., 2010; Bookhagen, 2012; Zhang et al., 2013; Lutz et al., 2014; Chen et al., 2017; Tian et al., 2020; Khanal et al., 2021; Yao et al., 2021). The annual average rainfall runoff, melt (glacier and snow) runoff, and baseflow contributed 62%–78% (Zhang et al., 2013; Tian et al., 2020; Khanal et al., 2021), 15%–35% (Bookhagen and Burbank, 2010; Immerzeel et al., 2010; Zhang et al., 2013; Lutz et al., 2014; Chen et al., 2017; Tian et al., 2020; Khanal et al., 2021), and 11%–27% (Lutz et al., 2014; Zhang et al., 2020; Khanal et al., 2021; Yao et al., 2021), respectively, to total runoff in the Yarlung Zangbo basin. The relatively low contribution of baseflow (9%) may be due to the steeper topography in the NRB than that of the Yarlung Zangbo basin (Zhang et al., 2020). Other runoff components (Figure 7) have been found to be consistent with previous studies (Bookhagen and Burbank, 2010; Immerzeel et al., 2010; Zhang et al., 2013; Lutz et al., 2014; Chen et al., 2017; Tian et al., 2020; Khanal et al., 2021).
Studies on GMB of the NRB mainly focused on the central Nyainqentanglha Range (eastern of the NRB) (Yao et al., 2012; Brun et al., 2017; Wu et al., 2019; Yi et al., 2020; Jakob et al., 2021) and southeastern TP (including northern of the NRB) (Hugonnet et al., 2021; Zhao et al., 2022). Using DEM difference or satellite data, the mean glacier mass loss rates of −0.60 ±0.20 m w. e./a (2000–2013) (Wu et al., 2019), −0.62 ± 0.23 m w. e./a (2000–2016) (Brun et al., 2017), −0.66 ± 0.02 m w. e./a (2000–2019) (Zhao et al., 2022), −0.67 ± 0.08 m w. e./a (2002–2017) (Yi et al., 2020), and −0.98 ± 0.22 m w. e./a (2010–2019) (Jakob et al., 2021) in the Nyainqentanglha Range or southeastern TP were estimated. Yao et al. (2012) studied the GMB of four glaciers in the Palong Zangbo River basin by glaciological measurements and obtained the GMB as −1.1 m w. e/a during 2006–2010 (southeast of the NRB, Table 4). The simulated GMB in this study was slightly more negative for the periods 1969–1983 (−1.27 m w. e/a), 1984–1998 (−1.18 m w. e/a), and 1999–2013 (−1.33 m w. e./a), compared with the previous studies (Wu et al., 2019; Yi et al., 2020; Zhao et al., 2022). We attribute the difference to the use of calibrated GMB data by Yao et al. (2012), which were significantly higher than those from other studies (Wu et al., 2019; Yi et al., 2020; Zhao et al., 2022).
Regional climate variations play a decisive role in the change of GMB in the TP (Yang et al., 2013; Wu et al., 2019; Liu et al., 2021; Xu et al., 2022; Zhao et al., 2022). Based on an energy-mass balance model, Yang et al. (2013) found that Parlung No. 94 Glacier in the southern TP was more sensitive to changes in air temperature than to changes in annual precipitation over the past 40 years. Liu et al. (2021) showed that GMB changes in the western TP heavily relied on changes in precipitation, whereas GMB changes in the eastern TP were strongly linked to changes in air temperature. The GMB changes within the central Nyainqentanglha Range exhibited spatial and temporal variability and displayed a significant correlation with climate warming and decreased precipitation (Wu et al., 2019). Xu et al. (2022) cautiously inferred that anomalous rise of temperature may be an important factor contributing to GMB loss of the Haxilegen Glacier No. 51 in the eastern Tien Shan over the past several decades. Zhao et al. (2022) found that glaciers in the southeastern TP encountered a significant loss of mass in 2009 due to the simultaneous occurrence of high air temperature and low precipitation.
5.4 Uncertainties and limitations
The simulated runoff components and GMB in the NRB have several uncertainties along with limitations, thus the results of this study should be carefully treated. The uncertainties and limitations are mainly caused by the accuracy of meteorological data, lack of measured data, as well as the setting of the glacier boundary and sensitivity parameters of the SPHY model.
Temperature and precipitation observation data that are interpolated were used to force the hydrological model. The NRB region has a complex topography, but there are only two meteorological stations available, which are unevenly distributed in the study area. Measured meteorological data are lacking in many parts of the study area, especially in high-altitude areas. In addition, the interpolation method is based on the altitude gradient of temperature and precipitation, which inevitably leads to uncertainty of model outcome (Wu et al., 2021). The SPHY model simulates the absolute amount of glacier melt, which is sensitive to the initial glacier area and volume (Khanal et al., 2021). This study corrected the glacier boundaries based on remote sensing images with the snow effect, which will have led to some uncertainties for the simulated results (Paul and Andereassen, 2009).
The parameters of the SPHY model contribute to uncertainties in this study. The calibration of the SPHY model resulted in a uniform parameter set for the NRB, which actually varies greatly with space and time. For example, the critical temperature separating rain and snow fluctuates widely in the TP, so setting it to be a fixed value will have caused great uncertainties (Wu et al., 2021). Although the DDF method is relatively simple and has been widely used, it does not consider the radiation effect that has a large spatial variation (Hock, 2003; Pellicciotti et al., 2005; Heynen et al., 2013).
Furthermore, uncertainties can also be caused by the simplified physical process of the SPHY model. For instance, the model adopts a simple elevation-dependent sublimation function to simulate snow sublimation (Lutz et al., 2014; Terink et al., 2015; Wijngaard et al., 2017). It does not account for the effects of wind speed and dry air, which also have impacts on sublimation. Another disadvantage is that the glacier module in the model was set as a fixed boundary based on the glacier map, which prevents it from accurately quantifying the retreat or advance of glaciers in response to climate change (Terink et al., 2015). Previous studies (Niu et al., 2010; Liu et al., 2011; Zhao et al., 2019) found that accelerated future permafrost thawing under a warming climate will lead to increased baseflow to total runoff (Zhao et al., 2019; Zhang Y. et al., 2022). The groundwater modules in the current model do not adequately represent the permafrost processes, which may result in an underestimation of baseflow contributions, particularly in spring (Zhang T. et al., 2022). There are also uncertainties associated with the field GMB data used in the model calibration. The field GMB data points are far away from the study area with a short time and a small number. The lake of filed GMB in the NRB will lead to some uncertainties in the results.
6 Conclusion
Using the observed hydrometeorological data and multi-period glacier remote sensing data, the SPHY model was used to reconstruct the contributions of runoff components to total runoff, along with the variation of the GMB in the NRB during 1969–2013. Comparisons of simulated daily runoff with measured daily runoff (Figure 4), as well as the simulated annual GMB and field annual GMB (Figure 5), indicated that the results of the SPHY model are credible.
Increased precipitation led to an increase in both rainfall runoff and baseflow from 1969 to 2013. In contrast, the trend for snowmelt runoff and glacier melt runoff was not significant, implying that the steady rise in total runoff between 1969 and 2013 was due to increased rainfall. The reconstructing results demonstrate that rainfall runoff was the primary contributor to total runoff in the NRB, with an average annual contribution of 67%, followed by 14%, 10%, and 9% from snowmelt runoff, glacier melt runoff, and baseflow, respectively, during 1969–2013. As the glacier area decreased and the temperature rose, glacier melt runoff and snowmelt runoff showed a decreasing trend during 1969–2013. Compared with 1969–1983, the peak monthly rainfall runoff increased significantly in 1984–1998 and 1999–2013 due to the continuous precipitation increase.
The reconstructing annual GMB showed a severe loss, with an average value of −1.26 m w. e./a (corresponding to a cumulative glacier mass loss of −56.72 m w. e.) during 1969–2013. Compared with the 1969–1983 period, the annual glacier mass loss was relatively small due to more snow and glacier mass accumulation in 1984–1998, but glacier retreat accelerated during 1999–2013 due to sharply rising temperatures. The annual glacier mass loss in the northern region of the NRB (−1.43 m w. e./a) was much higher than that in the southern region (−0.53 m w. e./a) during 1963–2013. This significant difference in GMB between the northern and southern regions was mainly affected by the temperature variation, especially in summer.
The results of this study provide a deeper understanding of variations in the hydrological regime in the NRB under a changing climate, including the contributions of different runoff components and the changes in GMB. This study can serve as a reference for hydrological simulation in cryosphere areas, such as in the TP and other similar regions. The spatial and temporal characteristics of GMB in this study can also be used to calibrate and validate glaciological and hydrological models.
Data availability statement
The original contributions presented in the study are included in the article/supplementary material, further inquiries can be directed to the corresponding author.
Author contributions
QH: Conceptualization, Model, Formal Analysis, Writing—Original Draft. XK: Conceptualization, Funding acquisition, Writing—review and editing. JC: Data analysis, Writing—review and editing. EM: Data analysis, Writing—review and editing. YF: Data analysis, Writing—review and editing. CZ: Writing—review and editing, Funding acquisition. All authors contributed to the article and approved the submitted version.
Funding
This study was supported by the National Natural Science Foundation of China (Grant No. 92047202).
Acknowledgments
The authors thank the two reviewers for their helpful comments.
Conflict of interest
The authors declare that the research was conducted in the absence of any commercial or financial relationships that could be construed as a potential conflict of interest.
Publisher’s note
All claims expressed in this article are solely those of the authors and do not necessarily represent those of their affiliated organizations, or those of the publisher, the editors and the reviewers. Any product that may be evaluated in this article, or claim that may be made by its manufacturer, is not guaranteed or endorsed by the publisher.
References
Azam, M. F., Wagnon, P., Vincent, C., Ramanathan, A. L., Kumar, N., Srivastava, S., et al. (2019). Snow and ice melt contributions in a highly glacierized catchment of Chhota Shigri Glacier (India) over the last five decades. J. Hydrol. 574, 760–773. doi:10.1016/j.jhydrol.2019.04.075
Bookhagen, B., and Burbank, D. W. (2010). Toward a complete Himalayan hydrological budget: Spatiotemporal distribution of snowmelt and rainfall and their impact on river discharge. J. Geophys. Res. 115 (F3), F03019. doi:10.1029/2009jf001426
Brun, F., Berthier, E., Wagnon, P., Kaab, A., and Treichler, D. (2017). A spatially resolved estimate of High Mountain Asia glacier mass balances from 2000 to 2016. Nat. Geosci. 10 (9), 668–673. doi:10.1038/NGEO2999
Chen, D. L., Xu, B. Q., Yao, T. D., Guo, Z. T., Chui, P., Chen, F. H., et al. (2015). Assessment of past, present and future environmental changes on the Tibetan Plateau. (in Chinese in Chinese with English abstract). Chin. Sci. Bull. 60 (32), 3025–3035. doi:10.1360/N972014-01370
Chen, X., Long, D., Hong, Y., Zeng, C., and Yan, D. (2017). Improved modelling of snow and glacier melting by a progressive two-stage calibration strategy with GRACE and multisource data: How snow and glacier meltwater contributes to the runoff of the Upper Brahmaputra River basin. Water Resour. Res. 53, 2431–2466. doi:10.1002/2016WR019656
Elias, E. H., Rango, A., Steele, C. M., Mejia, J. F., and Smith, R. (2015). Assessing climate change impacts on water availability of snowmelt-dominated basins of the Upper Rio Grande basin. J. Hydrol. Reg. Stud. 3, 525–546. doi:10.1016/j.ejrh.2015.04.004
Gao, H., He, X., Ye, B., and Pu, J. (2012). Modeling the runoff and glacier mass balance in a small watershed on the Central Tibetan Plateau, China, from 1955 to 2008. Hydrol. Process. 26 (11), 1593–1603. doi:10.1002/hyp.8256
Gardner, A. S., Moholdt, G., Cogley, J. G., Wouters, B., Arendt, A. A., Wahr, J., et al. (2013). A reconciled estimate of glacier contributions to sea level rise: 2003 to 2009. Science 340 (6134), 852–857. doi:10.1126/science.1234532
Guo, S., Chen, R., Han, C., Liu, G., Song, Y., Yang, Y., et al. (2017). Advances in the measurement and calculation results and influencing factors of the sublimation of ice and snow (in Chinese with English abstract). Adv. Earth Sci. 32 (11), 1204–1217. doi:10.11867/j.issn.10018166.2017.11.1204
Heynen, M., Pellicciotti, F., and Carenzo, M. (2013). Parameter sensitivity of a distributed enhanced temperature-index melt model. Ann. Glacio. 54 (63), 311–321. doi:10.3189/2013AoG63A537
Hock, R. (2003). Temperature index melt modelling in mountain areas. J. Hydrol. 282 (1-4), 104–115. doi:10.1016/s0022-1694(03)00257-9
Hugonnet, R., McNabb, R., Berthier, E., Menounos, B., Nuth, C., Girod, L., et al. (2021). Accelerated global glacier mass loss in the early twenty-first century. Nature 592 (7856), 726–731. doi:10.1038/s41586-021-03436-z
Huss, M., and Hock, R. (2018). Global-scale hydrological response to future glacier mass loss. Nat. Clim. Chang. 8 (2), 135–140. doi:10.1038/s41558-017-0049-x
Immerzeel, W. W., Pellicciotti, F., and Bierkens, M. F. P. (2013). Rising river flows throughout the twenty-first century in two Himalayan glacierized watersheds. Nat. Geosci. 6 (9), 742–745. doi:10.1038/ngeo1896
Immerzeel, W. W., van Beek, L. P., and Bierkens, M. F. (2010). Climate change will affect the Asian water towers. Science 328 (5984), 1382–1385. doi:10.1126/science.1183188
Jakob, L., Gourmelen, N., Ewart, M., and Plummer, S. (2021). Spatially and temporally resolved ice loss in High Mountain Asia and the Gulf of Alaska observed by CryoSat-2 swath altimetry between 2010 and 2019. Cryosphere 15 (4), 1845–1862. doi:10.5194/tc-15-1845-2021
Jin, H., Ju, Q., and Xie, J. (2019). The application of HBV model in the Niyang River basin. China Rural Water Hydropower 6, 23–28+34. (in Chinese with English abstract).
Kääb, A., Treichler, D., Nuth, C., and Berthier, E. (2015). Brief Communication: Contending estimates of 2003-2008 glacier mass balance over the Pamir-Karakoram-Himalaya. Cryosphere 9 (2), 557–564. doi:10.5194/tc-9-557-2015
Khanal, S., Lutz, A. F., Kraaijenbrink, P. D. A., van den Hurk, B., Yao, T., and Immerzeel, W. W. (2021). Variable 21st century climate change response for rivers in high mountain Asia at seasonal to decadal time scales. Water Resour. Res. 57 (5), e2020WR029266. doi:10.1029/2020wr029266
King, O., Bhattacharya, A., Bhambri, R., and Bolch, T. (2019). Glacial lakes exacerbate Himalayan glacier mass loss. Sci. Rep. 9 (1), 18145. doi:10.1038/s41598-019-53733-x
Kraaijenbrink, P. D. A., Stigter, E. E., Yao, T., and Immerzeel, W. W. (2021). Climate change decisive for Asia’s snow meltwater supply. Nat. Clim. Chang. 11 (7), 591–597. doi:10.1038/s41558-021-01074-x
Kuang, X. X., and Jiao, J. J. (2016). Review on climate change on the Tibetan Plateau during the last half century. J. Geophys. Res. Atmos. 121, 3979–4007. doi:10.1002/2015jd02472
Li, H., Wang, P., Li, Z., Jin, S., Xu, C., Liang, P., et al. (2021). Study on the energy-mass balance simulation of the east branch of the Urumqi Glacier No. 1, Tianshan Mountains. (in Chinese with English abstract). J. Glaciol. Geocryol. 43 (1), 24–35. doi:10.7522/j.issn.1000-0240.2019.1002
Liang, X., Lettenmaier, D. P., Wood, E. F., and Burges, S. (1994). A simple hydrologically based model of land surface water and energy fluxes for general circulation models. J. Geophys. Res. 99 (7), 14415–14428. doi:10.1029/94JD00483
Liu, L., Liu, Z., Ren, X., Fischer, T., and Xu, Y. (2011). Hydrological impacts of climate change in the Yellow River Basin for the 21st century using hydrological model and statistical downscaling model. Quatern. Int. 244 (2), 211–220. doi:10.1016/j.quaint.2010.12.001
Liu, X., Xu, Z., Yang, H., and Vaghefi, S. A. (2021). Responses of the glacier mass balance to climate change in the Tibetan Plateau during 1975–2013. J. Geophys. Res-Atmos. 126 (7), e2019JD032132. doi:10.1029/2019jd032132
Luo, J. W., Ke, C. Q., and Yu, X. N. (2022). Variations of glacier mass balance in the eastern Hindu Kush from 2000 to 2020 and its influencing factors. (in Chinese with English abstract). J. Glaciol. Geocryol. 44 (1), 159–170. doi:10.7522/j.issn.1000-0240.2022.0027
Lutz, A. F., Immerzeel, W. W., Shrestha, A. B., and Bierkens, M. F. P. (2014). Consistent increase in High Asia's runoff due to increasing glacier melt and precipitation. Nat. Clim. Chang. 4 (7), 587–592. doi:10.1038/nclimate2237
Mauser, W., and Bach, H. (2009). Promet – large scale distributed hydrological modelling to study the impact of climate change on the water flows of mountain watersheds. J. Hydrol. 376 (3-4), 362–377. doi:10.1016/j.jhydrol.2009.07.046
Meng, F., Su, F., Li, Y., and Tong, K. (2019). Changes in terrestrial water storage during 2003-2014 and possible causes in Tibetan Plateau. J. Geophys. Res-Atmos. 124 (6), 2909–2931. doi:10.1029/2018jd029552
Meng, F., Su, F., Yang, D., Tong, K., and Hao, Z. (2016). Impacts of recent climate change on the hydrology in the source region of the Yellow River basin. J. Hydrol. Reg. Stud. 6, 66–81. doi:10.1016/j.ejrh.2016.03.003
Mir, R. A., Jain, S. K., Jain, S. K., Thayyen, R. J., and Saraf, A. K. (2017). Assessment of recent glacier changes and its controlling factors from 1976 to 2011 in baspa basin, western himalaya. Arct. Antarct. Alp. Res. 49 (4), 621–647. doi:10.1657/aaar0015-070
Nash, J. E., and Sutcliffe, J. V. (1970). River flow forecasting through conceptual models part I-A discussion of principles. J. Hydrol. 10 (3), 282–290. doi:10.1016/0022-1694(70)90255-6
Niu, L., Ye, B., Li, J., and Sheng, Y. (2010). Effect of permafrost degradation on hydrological processes in typical basins with various permafrost coverage in Western China. Earth. Sci. 54 (4), 615–624. doi:10.1007/s11430-010-4073-1
Oerlemans, J., Anderson, B., Hubbard, A., Huybrechts, P., Johannesson, T., Knap, W. H., et al. (1998). Modelling the response of glaciers to climate warming. Climate Dyn. 14, 267–274. doi:10.1007/s003820050222
Ouellet Dallaire, C., Lehner, B., Sayre, R., and Thieme, M. (2019). A multidisciplinary framework to derive global river reach classifications at high spatial resolution. Environ. Res. Lett. 14 (2), 024003. doi:10.1088/1748-9326/aad8e9
Paul, F., Bolch, T., Briggs, K., Kääb, A., McMillan, M., McNabb, R., et al. (2017). Error sources and guidelines for quality assessment of glacier area, elevation change, and velocity products derived from satellite data in the Glaciers_cci project. Remote Sens. Environ. 203, 256–275. doi:10.1016/j.rse.2017.08.038
Paul, F., and Andereassen, L. M. (2009). A new Glacier Inventory for the svartisen region, Norway, from Landsat ETM+ data: Challenges and change assessment. J. Glaciol. 55 (192), 607–618. doi:10.3189/002214309789471003
Pellicciotti, F., Brock, B., Strasser, U., Burlando, P., Fuck, M., and Corripio, J. (2005). An enhanced temperature-index glacier melt model including the shortwave radiation balance: Development and testing for haut glacier d’Arolla, Switzerland. J. Glaciol. 51 (175), 573–587. doi:10.3189/172756505781829124
Pomeroy, J. W., Toth, B., Granger, R. J., Hedstrom, N. R., and Essery, R. L. H. (2003). Variation in surface energetics during snowmelt in a subarctic mountain catchment. J. Hydrometeorol. 4 (4), 702–719. doi:10.1175/1525-7541(2003)004<0702:VISEDS>2.0.CO;2
Prasch, M., Mauser, W., and Weber, M. (2013). Quantifying present and future glacier melt-water contribution to runoff in a central Himalayan river basin. Cryosphere 7 (3), 889–904. doi:10.5194/tc-7-889-2013
Qiao, B., Nie, B., Liang, C., Xiang, L., and Zhu, L. (2021). Spatial difference of terrestrial water storage change and lake water storage change in the Inner Tibetan Plateau. Remote Sens. 13 (10), 1984. doi:10.3390/rs13101984
Qin, Y., Abatzoglou, J. T., Siebert, S., Huning, L. S., AghaKouchak, A., Mankin, J. S., et al. (2020). Agricultural risks from changing snowmelt. Nat. Clim. Chang. 10 (5), 459–465. doi:10.1038/s41558-020-0746-8
Qin, Y., Yang, D., Gao, B., Wang, T., Chen, J., Chen, Y., et al. (2017). Impacts of climate warming on the frozen ground and eco-hydrology in the Yellow River source region, China. Sci. Total Environ. 605-606, 830–841. doi:10.1016/j.scitotenv.2017.06.188
Santhi, C., Arnold, J. G., Williams, J. R., Dugas, W. A., Srinivasan, R., and Hauck, L. M. (2001). Validation of the swat model on a large rwer basin with point and nonpoint sources. J. Am. Water. Resour. As. 37 (5), 1169–1188. doi:10.1111/j.1752-1688.2001.tb03630.x
Shean, D. E., Bhushan, S., Montesano, P., Rounce, D. R., Arendt, A., and Osmanoglu, B. (2020). A systematic, regional assessment of high mountain Asia glacier mass balance. Front. Earth. Sc-Switz. 7. doi:10.3389/feart.2019.00363
Shi, P., Duan, K., Nicholson, K. N., Han, B., Klaus, N., and Yang, J. (2020). Modeling past and future variation of glaciers in the Dongkemadi Ice Field on central Tibetan Plateau from 1989 to 2050. Arct. Antarct. Alp. Res. 52 (1), 191–209. doi:10.1080/15230430.2020.1743157
Shi, Y., Huang, M., Yao, Y., and He, Y. (2008). Glaciers and related environments in China. Beijing, China: Science Press.
Somers, L. D., McKenzie, J. M., Mark, B. G., Lagos, P., Ng, G.-H. C., Wickert, A. D., et al. (2019). Groundwater buffers decreasing glacier melt in an Andean Watershed-but not forever. Geophys. Res. Lett. 46 (22), 13016–13026. doi:10.1029/2019GL084730
IPCC Stocker, T. F., Qin, D., Plattner, G.-k., Tignor, M., Allen, S. k., Boschung, J., et al. (2013). Climate change 2013: The physical science basis. Contribution of working group I to the fifth assessment report of the intergovernmental panel on climate change. Cambridge, UK: Cambridge University Press.
Terink, W., Lutz, A. F., Simons, G. W. H., Immerzeel, W. W., and Droogers, P. (2015). SPHY v2.0: Spatial processes in hydrology. Geosci. Model. Dev. 8 (7), 2009–2034. doi:10.5194/gmd-8-2009-2015
Tian, F., Xu, R., Nan, Y., Li, K., and He, Z. (2020). Quantification of runoff components in the Yarlung Tsangpo River using a distributed hydrological model (in Chinese with English abstract). Adv. Water Sci. 31 (3), 324–336. doi:10.14042/j.cnki.32.1309.2020.03.002
Tiel, M., Stahl, K., Freudiger, D., and Seibert, J. (2020). Glacio-hydrological model calibration and evaluation. WIREs. Water. 7 (6). doi:10.1002/wat2.1483
Wijngaard, R. R., Biemans, H., Lutz, A. F., Shrestha, A. B., Wester, P., and Immerzeel, W. W. (2018). Climate change vs. socio-economic development: Understanding the future south asian water gap. Hydrol. Earth. Syst. Sc. 22 (12), 6297–6321. doi:10.5194/hess-22-6297-2018
Wijngaard, R. R., Lutz, A. F., Nepal, S., Khanal, S., Pradhananga, S., Shrestha, A. B., et al. (2017). Future changes in hydro-climatic extremes in the upper indus, ganges, and brahmaputra river basins. Plos. One 12 (12), e0190224. doi:10.1371/journal.pone.0190224
Wu, J., Li, H., Zhou, J., Tai, S., and Wang, X. (2021). Variation of runoff and runoff components of the upper shule River in the northeastern qinghai-tibet plateau under climate change. Water 13 (23), 3357. doi:10.3390/w13233357
Wu, K., Liu, S., Jiang, Z., Xu, J., and Wei, J. (2019). Glacier mass balance over the central Nyainqentanglha Range during recent decades derived from remote-sensing data. J. Glaciol. 65 (251), 422–439. doi:10.1017/jog.2019.20
Xu, C., Li, Z., Wang, F., Mu, J., and Zhang, X. (2022). Geodetic mass balance of Haxilegen Glacier No. 51, eastern tien Shan, from 1964 to 2018. Remote. Sens-Basel. 14 (2), 272. doi:10.3390/rs14020272
Xuan, W., Fu, Q., Qin, G., Zhu, C., Pan, S., and Xu, Y.-P. (2018). Hydrological simulation and runoff component analysis over a cold mountainous River basin in southwest China. Water 10 (11), 1705. doi:10.3390/w10111705
Yan, X., Ma, J., Ma, X., Wang, S., Chen, P., and He, Y. (2021). Accelerated glacier mass loss with atmospheric changes on Mt. Yulong, Southeastern Tibetan Plateau. J. Hydrol. 603, 126931. doi:10.1016/j.jhydrol.2021.126931
Yang, W., Guo, X., Yao, T., Zhu, M., and Wang, Y. (2016). Recent accelerating mass loss of southeast Tibetan glaciers and the relationship with changes in macroscale atmospheric circulations. Clim. Dynam. 47 (3-4), 805–815. doi:10.1007/s00382-015-2872-y
Yang, W., Yao, T., Guo, X., Zhu, M., Li, S., and Kattel, D. B. (2013). Mass balance of a maritime glacier on the southeast Tibetan Plateau and its climatic sensitivity. J. Geophys. Res-Atmos. 118 (17), 9579–9594. doi:10.1002/jgrd.50760
Yao, T., Thompson, L., Yang, W., Yu, W., Gao, Y., Guo, X., et al. (2012). Different glacier status with atmospheric circulations in Tibetan Plateau and surroundings. Nat. Clim. Chang. 2 (9), 663–667. doi:10.1038/nclimate1580
Yao, T., Xue, Y., Chen, D., Chen, F., Thompson, L., Cui, P., et al. (2019). Recent Third Pole’s rapid warming accompanies cryospheric melt and water cycle intensification and interactions between monsoon and environment: Multidisciplinary approach with observations, modeling, and analysis. Bull. Am. Meteorol. Soc. 100 (3), 423–444. doi:10.1175/bams-d-17-0057.1
Yao, Y., Zheng, C., Andrews, C. B., Scanlon, B. R., Kuang, X., Zeng, Z., et al. (2021). Role of groundwater in sustaining northern Himalayan rivers. Geophys. Res. Lett. 48, e2020GL092354. doi:10.1029/2020GL092354
Yi, S., Song, C., Heki, K., Kang, S., Wang, Q., and Chang, L. (2020). Satellite-observed monthly glacier and snow mass changes in southeast Tibet: Implication for substantial meltwater contribution to the brahmaputra. Cryosphere 14 (7), 2267–2281. doi:10.5194/tc-14-2267-2020
You, Q., Cai, Z., Pepin, N., Chen, D., Ahrens, B., Jiang, Z., et al. (2021). Warming amplification over the arctic Pole and third Pole: Trends, mechanisms and consequences. Earth-Sci. Rev. 217, 103625. doi:10.1016/j.earscirev.2021.103625
Zemp, M., Huss, M., Thibert, E., Eckert, N., McNabb, R., Huber, J., et al. (2019). Global glacier mass changes and their contributions to sea-level rise from 1961 to 2016. Nature 568 (7752), 382–386. doi:10.1038/s41586-019-1071-0
Zemp, M., Thibert, E., Huss, M., Stumm, D., Rolstad Denby, C., Nuth, C., et al. (2013). Reanalysing glacier mass balance measurement series. Cryosphere 7 (4), 1227–1245. doi:10.5194/tc-7-1227-2013
Zhang, L., Su, F., Yang, D., Hao, Z., and Tong, K. (2013). Discharge regime and simulation for the upstream of major rivers over Tibetan Plateau. J. Geophys. Res-Atmos. 118 (15), 8500–8518. doi:10.1002/jgrd.50665
Zhang, M., Ren, Q., Wei, X., Wang, J., Yang, X., and Jiang, Z. (2011). Climate change, glacier melting and streamflow in the Niyang River basin, southeast Tibet, China. Ecohydrology 4 (2), 288–298. doi:10.1002/eco.206
Zhang, T., Li, D., and Lu, X. (2022). Response of runoff components to climate change in the source-region of the Yellow River on the Tibetan plateau. Hydrol. Process. 36 (6), 14633. doi:10.1002/hyp.14633
Zhang, Y., Liang, K., Liu, C., Lyu, J., and Bai, P. (2022). Spatio-temporal distribution characteristics and possible causes of extreme climate in the Niyang River Basin. (in Chinese with English abstract). Geogr. Res. 41 (10), 2808–2820. doi:10.11821/dlyj020211104
Zhang, Y., Suzuki, K., Kadota, T., and Ohata, T. (2004). Sublimation from snow surface in southern mountain taiga of eastern Siberia. J. Geophys. Res-Atmos. 109 (21), D21103. doi:10.1029/2003jd003779
Zhang, Y., Xu, C.-Y., Hao, Z., Zhang, L., Ju, Q., and Lai, X. (2020). Variation of melt water and rainfall runoff and their impacts on streamflow changes during recent decades in two Tibetan plateau basins. Water 12 (11), 3112. doi:10.3390/w12113112
Zhao, F., Long, D., Li, X., Huang, Q., and Han, P. (2022). Rapid glacier mass loss in the Southeastern Tibetan Plateau since the year 2000 from satellite observations. Remote Sens. Environ. 270, 112853. doi:10.1016/j.rse.2021.112853
Zhao, Q., Ding, Y., Wang, J., Gao, H., Zhang, S., Zhao, C., et al. (2019). Projecting climate change impacts on hydrological processes on the Tibetan Plateau with model calibration against the glacier inventory data and observed streamflow. J. Hydrol. 573, 60–81. doi:10.1016/j.jhydrol.2019.03.043
Keywords: climate change, glacier retreat, runoff components, glacier mass balance, SPHY
Citation: He Q, Kuang X, Ma E, Chen J, Feng Y and Zheng C (2023) Reconstructing runoff components and glacier mass balance with climate change: Niyang river basin, southeastern Tibetan plateau. Front. Earth Sci. 11:1165390. doi: 10.3389/feart.2023.1165390
Received: 14 February 2023; Accepted: 10 July 2023;
Published: 26 July 2023.
Edited by:
Martin Siegert, University of Exeter, United KingdomReviewed by:
Ramanathan Alagappan, Jawaharlal Nehru University, IndiaTirtha Raj Adhikari, Tribhuvan University, Nepal
Copyright © 2023 He, Kuang, Ma, Chen, Feng and Zheng. This is an open-access article distributed under the terms of the Creative Commons Attribution License (CC BY). The use, distribution or reproduction in other forums is permitted, provided the original author(s) and the copyright owner(s) are credited and that the original publication in this journal is cited, in accordance with accepted academic practice. No use, distribution or reproduction is permitted which does not comply with these terms.
*Correspondence: Xingxing Kuang, a3Vhbmd4eEBzdXN0ZWNoLmVkdS5jbg==