 Yongtao Zhang1,2
 Ruiyuan Zhang
95% of researchers rate our articles as excellent or good
Learn more about the work of our research integrity team to safeguard the quality of each article we publish.
Find out more
ORIGINAL RESEARCH article
Front. Earth Sci. , 23 March 2023
Sec. Environmental Informatics and Remote Sensing
Volume 11 - 2023 | https://doi.org/10.3389/feart.2023.1163930
This article is part of the Research Topic Coal and Rock Dynamic Disasters: Advances of Physical and Numerical Simulation in Monitoring, Early Warning, and Prevention View all 15 articles
For the island and reef project formed by filling calcareous sand, the problems of wide particle size distribution (PSD) and complex mechanical properties have to be faced. Therefore, in order to provide basic mechanical parameters for the construction of the island and reef project, triaxial shear tests were carried out on calcareous sands with five different typical PSDs. The results showed that as particle gradation became narrower, the axial strain corresponding to the strain-softening point all showed a decreasing trend and their differences gradually decreased; the confining pressure has a significant impact on the volumetric deformation modulus of calcareous sand with a wide PSD. The cohesion of calcareous sand showed a positive correlation with non-uniformity and curvature coefficients, while the variation of an internal friction angle showed a parabolic law; the internal friction angle also changes in the parabola with the change of fine particle contents. Furthermore, by establishing the PFC3D discrete element model, it was found that the numerical simulation results were in good agreement with the test results, which verifies the feasibility of the numerical simulation and the rationality of the mesoscopic parameter calibration. It was discovered that the wider the particle gradation range, the greater the axial strain corresponding to the critical coordination number; the sample with a narrow gradation interval was more likely to present a rotating displacement field to form a penetrating shear band. This study can provide design parameters for stability analysis of high and steep slopes in calcareous sand sites.
Calcareous sand (Hongbing et al., 2006) is widely distributed in the Maldives and other islands, which is a kind of carbonate sediment obtained after experiencing long-term immersion in calcium carbonate solution; it has the characteristics of irregular shape (Liu and Wang, 1998; Smith and Cheung, 2003), numerous pores (Xu et al., 2022), easy cementation (Meng et al., 2014), and breakage (Hu, 2008; Donohue et al., 2009). In terms of the particularity of calcareous sand, a series of studies have been carried out, including physical and mechanical properties (Lade et al., 2010; Lv et al., 2017; Giretti et al., 2020; Xu et al., 2020), dynamic properties (Morsy et al., 2019; Zhou et al., 2019; Liu et al., 2020), engineering properties (Yue et al., 2017; Rui et al., 2021), calcareous sand concrete (Ma et al., 2019; Wang et al., 2020), and microbial cementation (Liu et al., 2019; Xiao et al., 2019). The research results showed that the engineering mechanical properties of calcareous sand are very different from those of common continental sediments (Jiang et al., 2015; Wang et al., 2017a). Because of the “Belt and Road Initiative” policy, numerous island and reef projects are being planned, where the construction sites are often formed by blowing and filling calcareous sand (Wang et al., 2011; Wang et al., 2021). When the island and reef underground engineering is excavated, it will face the problem of slope stability analysis, especially some high and steep slopes. At the same time, due to the wide distribution of particles in the calcareous sand site formed by hydraulic reclamation, the shear strength of different graded calcareous sand slopes is different (Coop, 1990; Ma et al., 2022), which brings difficulties to the slope stability analysis. Therefore, it is necessary to conduct an in-depth research on the shear characteristics of calcareous sand (Ding et al., 2021).
The shear characteristics of calcareous sand have been extensively studied; it has been observed that particle gradation (Hassanlourad et al., 2014; Rezvani et al., 2021), confining pressure (Fahey, 2021), and particle breakage (Jingping et al., 1997; Zhang and Luo, 2020) have an impact on the shear strength of calcareous sand. For particle gradation, significant attention has been paid to the influence of particle size (Bagherzadeh-Khalkhali and Mirghasemi, 2009; Cao et al., 2020; Kuang et al., 2021), uniformity coefficient (Liang et al., 2022), average particle size (Giang et al., 2017; Wang et al., 2017b), fine particle content (Shen et al., 2021), and particle group content (Ata et al., 2018; Shen et al., 2018; Yang et al., 2020; Fan et al., 2021) on the shear strength of calcareous sand. Chen et al. (2022) carried out triaxial shear tests to study the effect of gradation on the particle breakage and mechanical properties of coral sand. However, the grading range of prepared coral sand samples is very narrow, which cannot fully reflect the shear characteristics of hydraulic fill calcareous sand at the project site. It can be observed that although there are some achievements in the research on the influence of particle gradation on the shear characteristics of calcareous sand, they are partial and not comprehensive enough to reflect the shear characteristics of fully classified calcareous sand (gravel sand, coarse sand, medium sand, fine sand, and silt) under wide grading.
In this research, wide graded and fully classified calcareous sand was taken as the research object, and five kinds of typically graded calcareous sand, which can represent calcareous gravel sand, calcareous coarse sand, calcareous medium sand, calcareous fine sand, and calcareous silt, were selected to conduct the triaxial drainage shear test; thus, the change rules of strength characteristics, volumetric deformation characteristics, and the impact of grading on strength indexes were analyzed. Furthermore, the 3D discrete element model was established to conduct a mesoscopic study of the shear characteristics of calcareous sand so as to clarify the basic mechanical characteristics of the calcareous sand site, which also provides reasonable mechanical parameters for stability analysis of high and steep slopes in island and reef engineering.
According to the Code for Geotechnical Investigation of Water Transport Engineering (Partial Revision)—Geotechnical Investigation of Coral Reef (Draft) (CCCC Second Harbor Engineering Survey and Design Institute, 2022), the calcareous sandy soil is divided into calcareous gravel sand, calcareous coarse sand, calcareous medium sand, calcareous fine sand, and calcareous silty sand, as shown in Table 1. This paper considered the coral sandy soil revealed by the engineering geology of the coral reef area in the Maldives as the research object, and five kinds of typically graded calcareous sand (respectively representing calcareous gravel sand, calcareous coarse sand, calcareous medium sand, calcareous fine sand, and calcareous silty sand) were selected through field sampling, in order to avoid the particle size effect; particles with the size of more than 5 mm were removed, but the reserved particle groups are <0.075 mm, 0.075–0.1 mm, 0.1–0.25 mm, 0.25–0.5 mm, 0.5∼1 mm, 1∼2 mm, and 2∼5 mm, as shown in Figure 1. The particle analysis test results are shown in Figure 2. According to particle grading curves, the calculated controlled particle size and grading index are shown in Table 2.
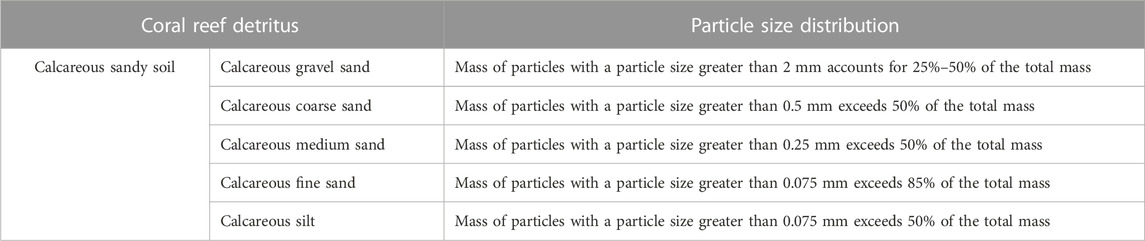
TABLE 1. Classification of coral reef debris.
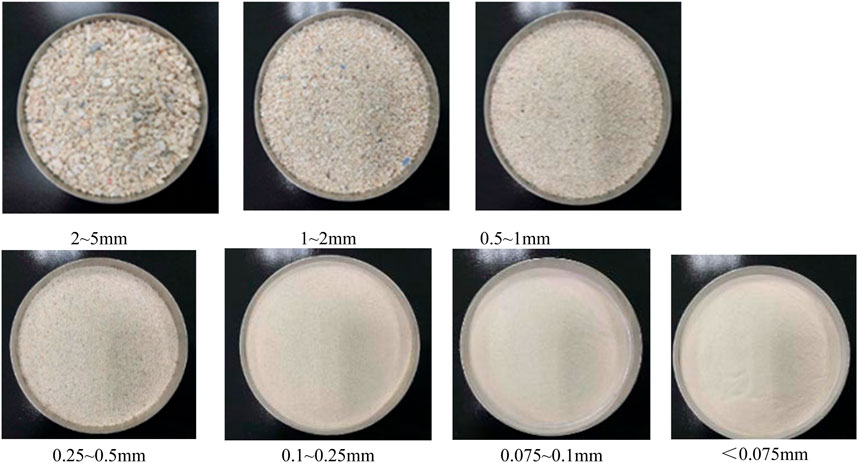
FIGURE 1. Calcareous sand of each grain group: 2∼5 mm, 1∼2 mm, 0.5∼1 mm, 0.25∼0.5 mm, 0.1∼0.25 mm, 0.075∼0.1 mm, and below 0.075 mm.
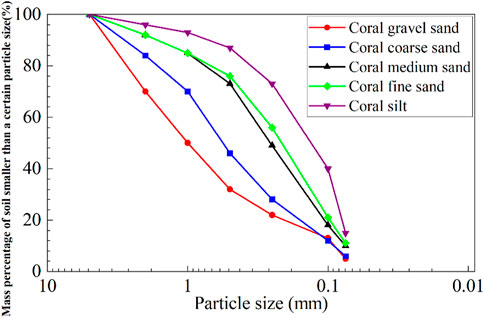
FIGURE 2. PSD curves.
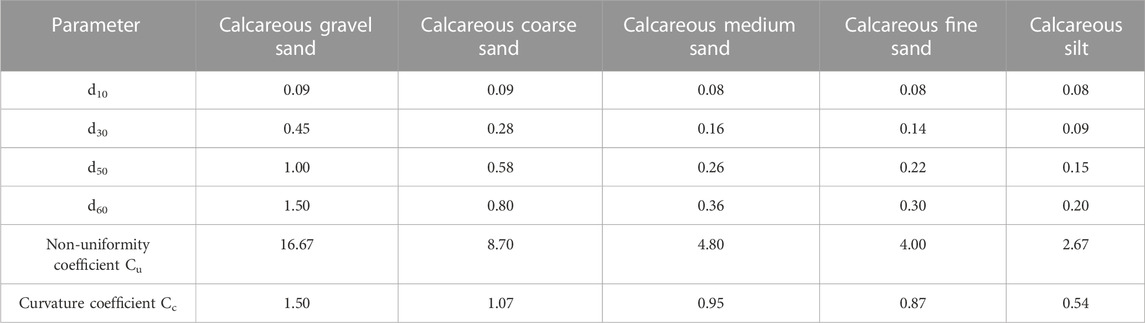
TABLE 2. Physical property index of calcareous sand.
The strain control triaxial tester was used in this test. The sample diameter is 50 mm, and the height is 100 mm. The maximum axial force is 100 kN, and the maximum axial displacement can reach 50 mm. The confining pressure is provided by the air pump, where the confining pressure range is 0–16 MPa, and the back pressure control is 0∼4 MPa. The pore water pressure, axial strain, axial displacement, and other parameters are automatically recorded by the computer.
The saturated sample is the key to this test. The main process of the test is as follows:
(1) Pour the weighed calcareous sand into the rubber membrane three times, and compact the sand sample with a slender rod to achieve the required dry density of 1.45 g/cm3.
(2) Apply a confining pressure of 10–20 kPa through a computer, pass CO2 into the sample through the small hole in the center of the sample base for about 1 h, and maintain the pressure at about 10 kPa.
(3) Open the water inlet valve to allow water to enter the sample from the bottom of the sample, and the water head saturation is completed until the water continuously flows out of the drain valve.
(4) Apply back pressure to saturate the sample and maintain the confining pressure greater than the back pressure of 30 kPa to prevent the rubber membrane from being damaged by excessive back pressure until the water no longer flows into the sample.
(5) When the saturation degree B is detected to be more than 0.95, saturation is completed; the next step is the shear test.
Under the confining pressure values of 25 kPa, 50 kPa, 100 kPa, and 200 kPa, a total of 20 groups of triaxial consolidation drainage shear tests were performed on five kinds of calcareous sand mentioned previously. When the axial strain of the sample reaches 15%, the test is terminated and the shear rate is 0.3 mm/min.
The deviatoric stress–strain curves of five calcareous sand samples are shown in Figure 3. It can be observed that under confining pressure
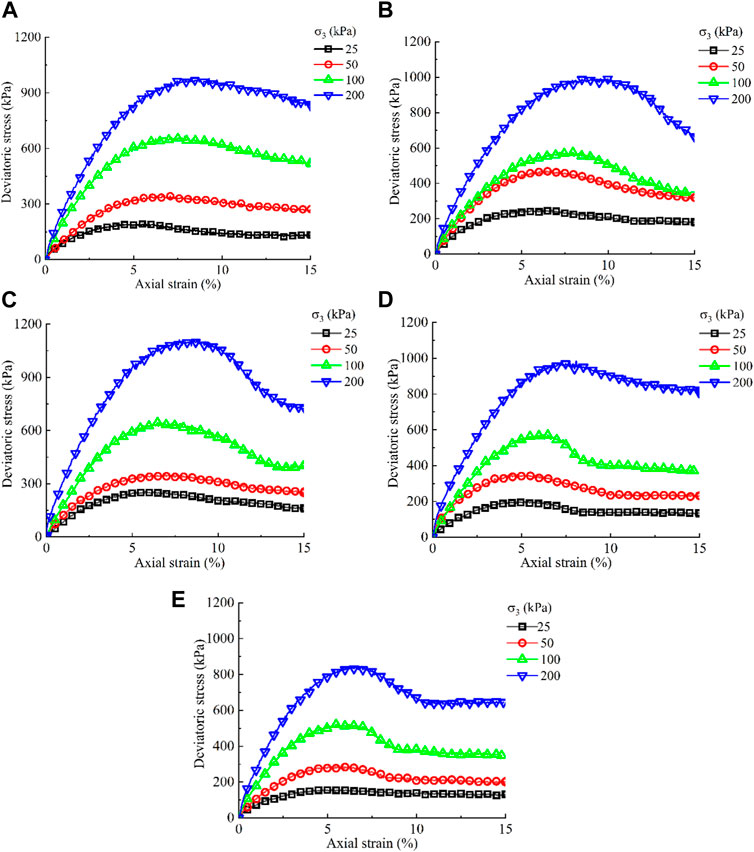
FIGURE 3. Deviatoric stress–axial strain curves. (A) Calcareous gravel sand. (B) Calcareous coarse sand. (C) Calcareous medium sand. (D) Calcareous fine sand. (E) Calcareous silt.
As the relationship between the volumetric strain and axial strain of five kinds of calcareous sand shown in Figure 4, these calcareous sand forms all showed volumetric deformation characteristics of the first shear compression and then shear dilatancy, which means that with the increase of the axial strain, the shear compression became more evident, the shear compression rate gradually decreased, and then the shear dilatancy appeared, with first increase and then decrease of shear dilatancy rates. With calcareous gravel sand changing to calcareous silt, their gradation range became narrower and the decreasing amplitude of the shear dilatancy rate was large, indicating that the shear dilatancy rate decreased and the volumetric deformation showed a stable trend. With the increase of the confining pressure from 50 kPa to 200 kPa, the volumetric strain curve changed significantly, especially for calcareous gravel sand and calcareous coarse sand, suggesting that the confining pressure has a significant impact on the volume change modulus of calcareous sand with a wide PSD. This is because the coarse particles are irregular in shape with many edges and corners, and porosity was compressed and some coarse particles were crushed as the strain increased; furthermore, the increase in the axial strain caused the particles to slip as a whole, presenting the volumetric characteristics of shear dilatancy. With the increase of confining pressure, the coarse particles in calcareous sand were partially crushed, resulting in the sample being compressed to a greater extent. Therefore, the volumetric strain curve was significantly different from that under low confining pressure. It can also be observed that with the increase in the confining pressure, the axial strain corresponding to the change point from shear compression to shear dilatancy increased continuously, which indicates that the increase in confining pressure compressed pores and crushed particles, delaying the shear dilatancy.
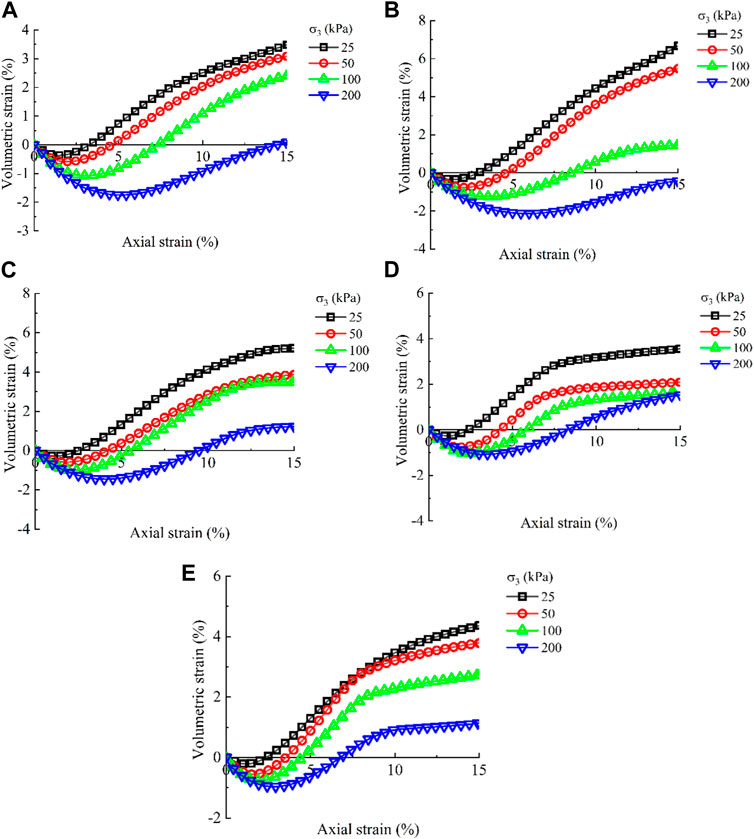
FIGURE 4. Volumetric strain–axial strain curve of calcareous sand. (A) Calcareous gravel sand. (B) Calcareous coarse sand. (C) Calcareous medium sand. (D) Calcareous fine sand. (E) Calcareous silt.
According to the Mohr–Coulomb strength criterion, the σ–τ envelope is obtained, as shown in Figure 5, based on which the shear strength parameters can be obtained. The peak internal friction angle of calcareous sand was in the range of 41°–45.3°, the bite force was in the range of 19.8 kPa–25.6 kPa, the residual internal friction angle was in the range of 36.6°–38.5°, and the residual bite force was in the range of 10.9 kPa–15.9 kPa.
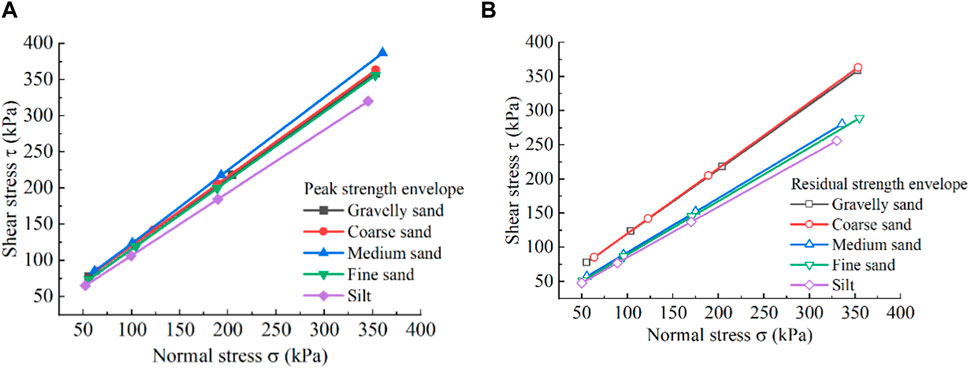
FIGURE 5. σ–τ envelope. (A) Peak σ–τ envelope. (B) Residual σ–τ envelope.
In order to further investigate the impact of the gradation index on shear strength, the curves reflecting the relationship between the non-uniformity coefficient Cu, curvature coefficient Cc and cohesion, and the internal friction angle were drawn and are shown in Figures 6, 7.
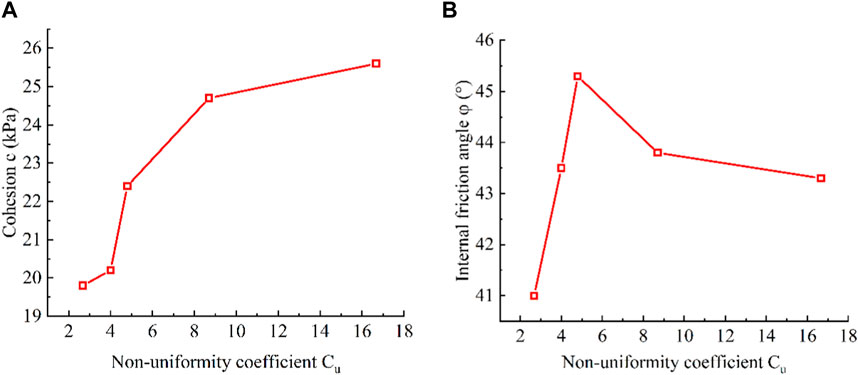
FIGURE 6. Relationship between Cu and cohesion and the internal friction angle. (A) Relationship between Cu and cohesion. (B) Relationship between Cu and the internal friction angle.
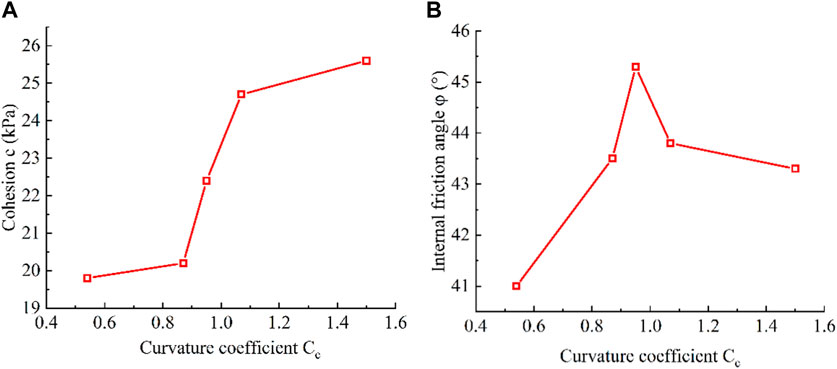
FIGURE 7. Relationship between Cc and cohesion and the internal friction angle. (A) Relationship between Cc and cohesion. (B) Relationship between Cc and the internal friction angle.
According to the test results, it can be observed that cohesion increased with the increase of Cu and Cc. Previous research shows that the basic shape of particles is similar in calcareous soil with different particle sizes, but the particle size will change with particle groups varying, and the proportion of particles with different shapes in each particle group is also different. In coarse calcareous sand, the particle shape is mostly flaky and branched and the interlocking effect between particles is easy to form. Table 1 shows that as Cu of calcareous silt increased to Cu of calcareous gravel sand, Cc also increased, so the sample gradually met the requirements of Cu ≥ 5 and Cc=1–3, suggesting a continuous good gradation, and the filling, extrusion, and occlusion of particles were enhanced. With the particle size increasing, the content of large-particle calcareous sand became higher and the occluding effect between particles was continuously strengthened, while the apparent cohesion was generated by the occluding effect of particles; so, with the increase of non-uniformity and curvature coefficients, calcareous sand showed a higher cohesion.
It can also be observed that with the decrease of Cu and Cc, the internal friction angle first increased and then decreased. This is because as calcareous gravel sand changed into calcareous silt, Cu and Cc gradually decreased and particles gradually became uniform and poorly graded, during which the content of coarse particles decreased, and the content of fine particles gradually increased; thus, more fine particles fill pores to intensify the contact between particles, making the friction angle gradually increase. However, with further increase in the content of fine particles, fine particles started to play a role in lubrication and the “ball” effect appeared in calcareous sand, reducing the internal friction angle. Therefore, corresponding to the peak internal friction angle, there is a limit value for the content of fine particles. In order to further quantify the limit value of fine particle contents and clarify the effect of fine particle contents on the internal friction angle of calcareous sand, the relationship between fine particle contents and internal friction angles is plotted and shown in Figure 8.
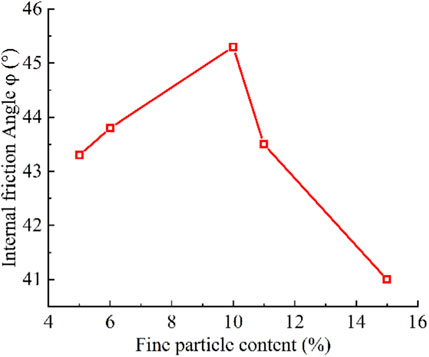
FIGURE 8. Relationship curve between the fine particle content and internal friction angle.
Figure 8 shows that there was a limit value of 10% for the fine content, which means when the fine content was 10%, the internal friction angle reached the maximum value; when the content of fine particles was less than 10%, the internal friction angle gradually increased; when the fine content was greater than 10%, the internal friction angle decreased.
Based on qualitative analysis, the test data were fitted to quantitatively reflect the impact of the particle size of calcareous sand on the strength index; the following formulas can be used to accurately calculate and evaluate the strength characteristics of calcareous sand with different PSDs. Figures 9–11 show the fitting relationships between Cu and cohesion, Cc and cohesion, and fine particle content and internal friction angle; the determination coefficients of the fitting formulas are all above 0.95, indicating a high reliability.
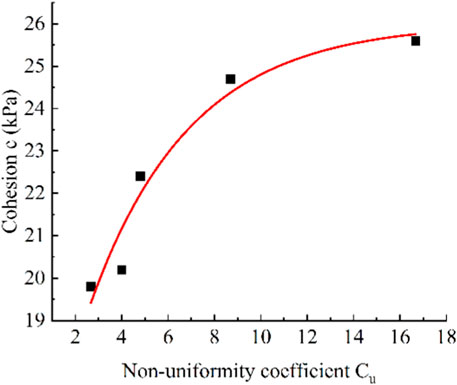
FIGURE 9. Fitted relationship curve between Cu and cohesion.
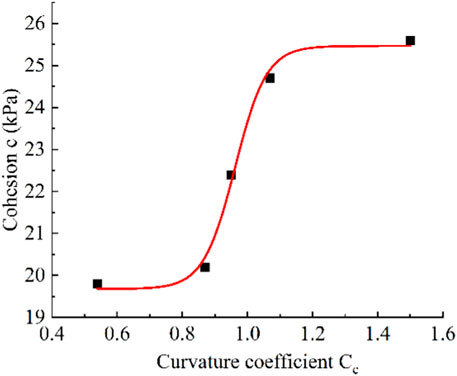
FIGURE 10. Fitted relationship curve between Cc and cohesion.
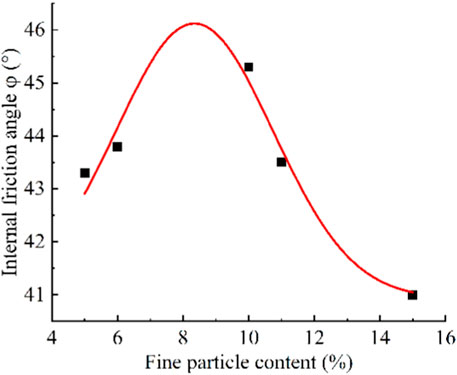
FIGURE 11. Fitted relationship curve between the fine particle content and internal friction angle.
Bardet and Proubet (1991) and Bardet and Proubet (1992) simulated the evolution law of shear bands in granular materials from a two-dimensional perspective. In order to overcome the limitation of a two-dimensional plane, PFC3D (Cundall and Strack, 1979; Cundall, 2001) was adopted to model calcareous sands with different PSDs and explore the interaction between particles from a three-dimensional perspective, which provides a powerful tool for revealing the shear behavior of calcareous sand from the mesoscopic level.
Referring to the existing numerical test results, the method of expanding particle sizes has a small impact on the mechanical behavior of the material (Belheine et al., 2009; Evans and Valdes, 2011); in this paper, the particle size was uniformly enlarged 3.5 times; the numerical sample is shown in Figure 12, and the numerical test process is as follows:
(1) According to the PSD in the laboratory test, a model of the sample in a cylinder with a diameter of 50 mm and a height of 100 mm was established, which had the same PSD. In this sample model, the generated particles are as follows: 28,013 particles for calcareous gravel sand, 39,715 particles for calcareous coarse sand, 59,915 particles for calcareous medium sand, 61,983 particles for calcareous fine sand, and 70,362 particles for calcareous silt.
(2) The particle sample was generated according to the initial porosity, and the wall was preloaded with a certain pressure to obtain a uniform and dense sample.
(3) The contact between particles was set as the parallel bonding model “linearpbond,” and relevant parameters were assigned to realize the bond between particles.
(4) The displacement of particles was reset, and then a relative velocity was applied to the upper and lower walls to realize triaxial shear numerical sample loading.
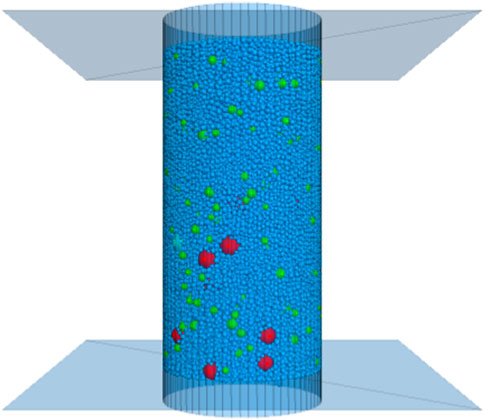
FIGURE 12. Numerical sample.
In this paper, parallel bonding was used to simulate the bonding force between calcareous sand particles. The parallel bond model can describe the constitutive characteristics between the cemented particles, where the spring group with constant normal and tangential stiffness is distributed on the contact surface. When the displacement or force between particles exceeds the critical value, the parallel bonding model will fail to induce a fracture. In the discrete element numerical simulation, mesoscopic parameters, such as contact stiffness and friction coefficient, need to be calibrated. Referring to previous numerical tests (Thompson et al., 2009; Stratton and Wensrich, 2010), the normal stiffness in this paper is 100 MN/m, and the particle stiffness ratio is 1.0, which meets the range of 1.0–1.5 recommended by Goldenberg and Goldhirsch (2005). According to the results of indoor tests, the internal friction angle of calcareous sand was 45°, and the cohesion, effective modulus, and other mesoscopic parameters were calibrated according to the stress–strain curve in the laboratory test, as shown in Table 3.
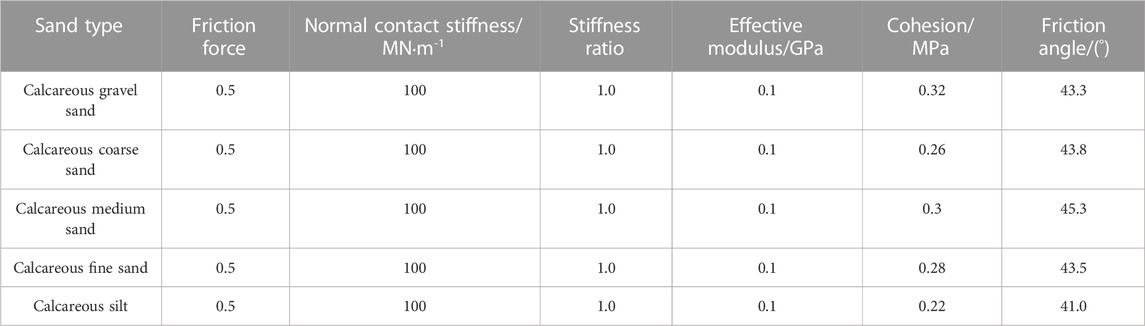
TABLE 3. Mesoscopic parameters of a numerical sample.
Figure 13 shows the comparison between the numerical simulation results and the test results of calcareous silt; it can be observed that they are in good agreement, and the feasibility of the numerical simulation and the rationality of the calibration of mesoscopic parameters are verified. On this basis, the numerical simulation results can be further analyzed. Figure 14 shows the failure pattern in the numerical calculation and the indoor test of calcareous silt; it can be observed that both were found in the inclined shear failure zone, which was in good agreement.
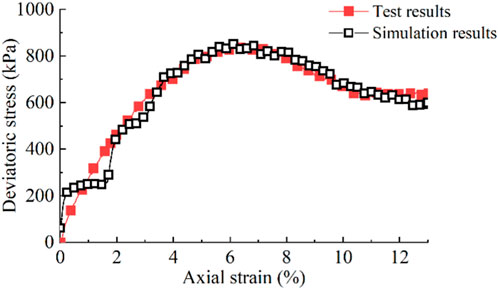
FIGURE 13. Comparison of deviatoric stress–strain between simulation and the indoor test.
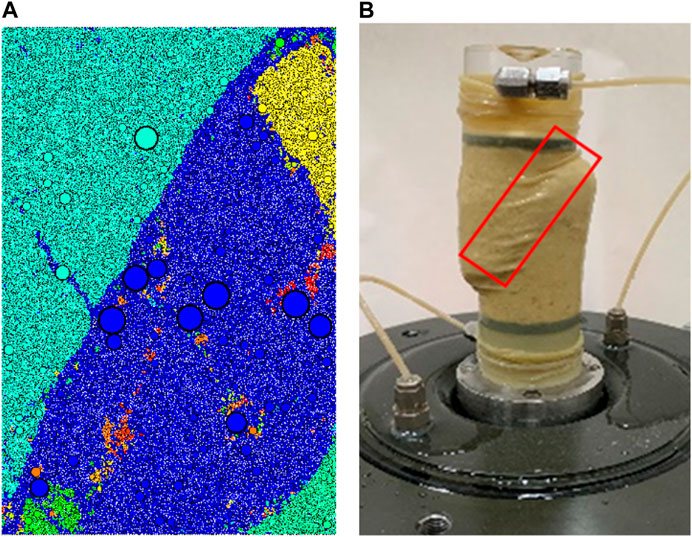
FIGURE 14. Comparison of the shear band between simulation and the indoor test. (A) Numerical simulation of the shear band. (B) Shear band for an indoor test.
The coordination number reflects the average number of contacts per ball and can be defined as follows:
Under the impact of load, the rearrangement of calcareous sand particles is the fundamental reason for the shear compression and dilatancy, and their sliding and rotation will cause the change of the coordination number. Figure 15 shows the change curve of the coordination number of five types of calcareous sand during shearing. As a whole, with the increase of the axial strain, the coordination number first increased and then decreased, existing as a critical coordination number; this is because, with the increase of the axial load, the volume of calcareous sand is compressed, resulting in an increase in the number of contact between particles and an increase in the coordination number. With the further increase of the axial strain, the sample exhibited a shear slip, the number of contact between particles decreased, and the sample showed shear dilatancy. It can be observed that with calcareous gravel sand changing into calcareous silt, the coordination number increased significantly and the axial strain corresponding to the critical coordination number decreased gradually from 5% to 3%. This is because as the PSD gradually became worse, embedding and occluding between the particles were weakened, making the shear slip more likely to occur. This is consistent with the shear law obtained from the laboratory test. The change of the coordination number also explains the volume change mechanism of the first shear compression and then shear dilatancy of calcareous sand in the mesoscale.
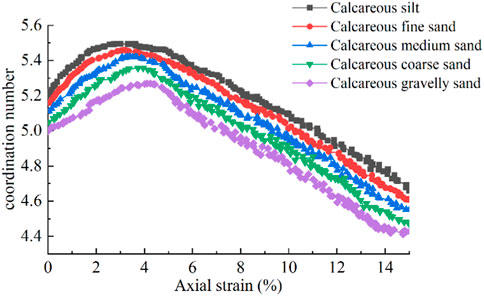
FIGURE 15. Relationship between the coordination number and axial strain.
To further analyze the formation and characteristics of the shear band in the sample, the development and change of a displacement field were revealed by slicing the cylindrical sample. Figure 16 shows the development process of the shear displacement field under a confining pressure of 200 kPa. Figures 16A,B show the particle displacement field with a small axial strain. With the increase of the axial strain, the displacement of particles at the top and bottom gradually increased and the particles in the middle of the sample began to show a trend of horizontal outward shear dilatancy; however, the displacement field corresponding to the peak strength was not reached, and there was no shear band. As the peak strength was reached with the increase of the axial strain. Figure 16C showed a more evident shear band, and the shear dilatancy of the sample was further enhanced. At the same time, an evident and concentrated shear zone is shown in Figure 16D, and the movement direction of particles in the shear zone was almost distributed between 0° and 360°, indicating that the particles in the shear zone have slipped and turned over, which explains the formation mechanism of the macroscopic shear fracture zone from a microscopic perspective.
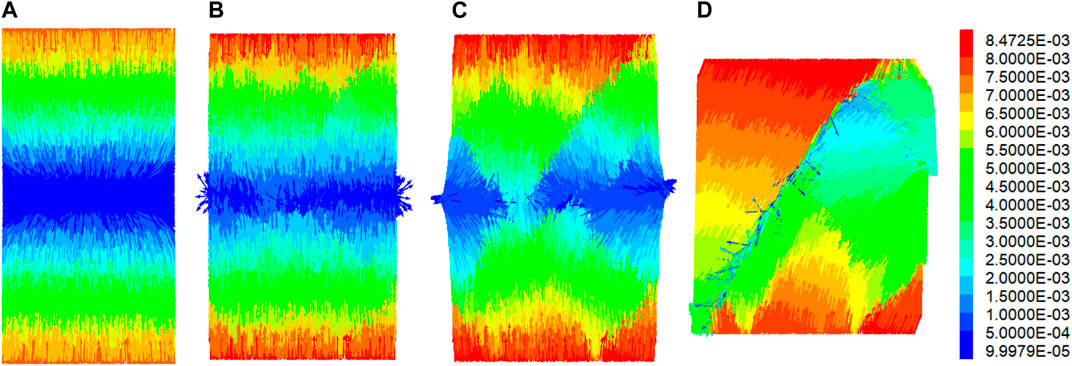
FIGURE 16. Evaluation law of the shear displacement field. (A) ε1 =1%. (B) ε1 =5%. (C) ε1 =10%. (D) ε1 =15%.
In order to further compare the shear zone evolution of these five types of calcareous sand, their shear displacement fields are observed, as shown in Figure 17. It can be observed that as grain gradation decreased (Figures 17A, B, C, D, E), the particles gradually became finer and the rotating blue displacement field gradually appeared in the sample; moreover, the displacement field in the calcareous medium sand (calcareous fine sand) was significantly larger than that of the calcareous coarse sand; this is the primary condition of forming shear bands. With the further increase of the rotational displacement field, a fully penetrating shear slip band was formed as that of calcareous silt, as shown in Figure 17E. If the rotational displacement field is not formed, the specimen may exhibit local shear failure and form a local shear band, as shown in Figure 17A. Due to small differences in sample gradation, calcareous medium sand and calcareous fine sand showed similar displacement fields.
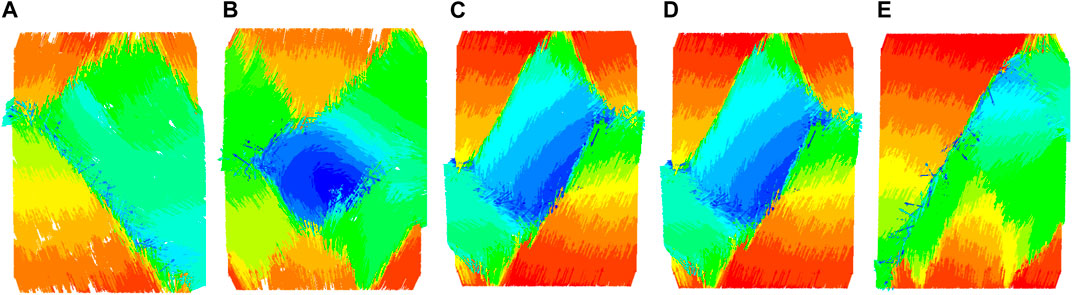
FIGURE 17. Shear displacement fields of five types of calcareous sand. (A) Shear displacement field of calcareous gravel sand. (B) Shear displacement field of calcareous coarse sand. (C) Shear displacement field of calcareous medium sand. (D) Shear displacement field of calcareous fine sand. (E) Shear displacement field of calcareous silt.
Figure 18 shows the morphological slice of microcracks in five types of calcareous sand after triaxial shear, where blue represents the microcrack formed by shear failure and green represents the microcrack formed by tensile failure. It can be observed that the obvious shear failure zone is accompanied by partial tension cracks on the shear crack zone, which indicates that the bond failure between particles is caused by both the shear and tension effects, particularly by shear failure. At the same time, it can also be observed that in the samples with wide PSDs, such as calcareous gravel sand, the content of coarse particles is high and the distribution of shear bands is relatively irregular and more scattered; this is because the particles have strong impingement and occlusion, making the penetrating shear bands difficult to form; moreover, the coarse particles may limit the extension and penetration of the shear zone.
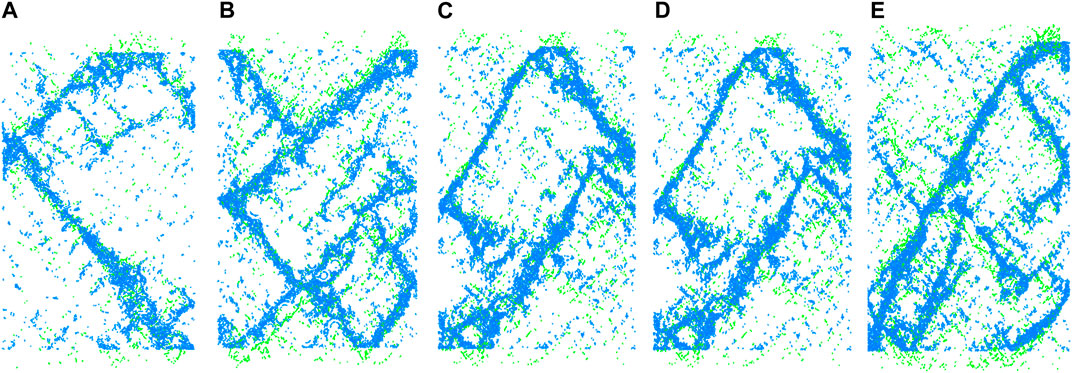
FIGURE 18. Morphological slice of microcracks. (A) Section of calcareous gravel sand. (B) Section of calcareous coarse sand. (C) Section of calcareous medium sand. (D) Section of calcareous fine sand. (E) Section of calcareous silt.
In this paper, the shear characteristics of calcareous sand with five PSDs were studied using the triaxial drainage shear test and the influence of PSD on the shear properties of calcareous sand is discussed in detail. The following conclusions can be drawn.
(1) During triaxial drained shear tests, as the PSD became narrow, this axial strain decreased and the difference between the five types of calcareous sand decreased. As the PSD became narrow, the deviator stress of the sample tended to be stable earlier and the residual strength remained stable. The peak internal friction angle of calcareous sand is in the range of 41–45.3°, and the bite force is in the range of 19.8–25.6 kPa; the residual internal friction angle is in the range of 36.6–38.5°, and the residual bite force is in the range of 10.9–15.9 kPa. With the calcareous gravel sand changing into calcareous silt, the particles gradually became finer and the volumetric deformation exhibits a stable trend. With the increase of confining pressure, the occurrence of shear dilatancy was delayed.
(2) After comparing the PSD of five types of calcareous sand, it was found that the cohesion of the sample increases with the increase of the non-uniformity coefficient Cu and curvature coefficient Cc, while the internal friction angle first increased and then decreased, showing a parabolic variation law. The internal friction angle varied with the fine particle content in a parabola and reached the maximum value when the fine particle content was 10%. The formulas fitting the relationship between the non-uniformity coefficient Cu, curvature coefficient Cc, fine particle contents, and strength parameters were obtained, and the strength index of calcareous sand can be calculated and evaluated, with high accuracy.
(3) With PSD becoming wider, the coordination number decreased, but the axial strain point corresponding to the critical coordination number continued to increase. With the decrease in particle gradation, the particles gradually became finer and the rotating blue displacement field gradually appeared in the sample. With further increase of the rotating displacement field, a complete shear slip zone was formed. With the widening of particle gradation, the content of coarse particles increased and the distribution of shear bands became relatively irregular and more dispersed.
The original contributions presented in the study are included in the article/Supplementary Material; further inquiries can be directed to the corresponding author.
Methodology, YZ and HL; validation, RZ; formal analysis, RZ and HL; writing—original draft, RZ and CY; writing—review and editing, RZ; supervision, HL and ZD; and project administration, YZ. All authors have read and agreed to the published version of the manuscript.
All authors were employed by CCCC Second Harbor Engineering Co., Ltd.
All claims expressed in this article are solely those of the authors and do not necessarily represent those of their affiliated organizations, or those of the publisher, the editors, and the reviewers. Any product that may be evaluated in this article, or claim that may be made by its manufacturer, is not guaranteed or endorsed by the publisher.
Ata, A., Salem, T. N., and Hassan, R. (2018). Geotechnical characterization of the calcareous sand in northern coast of Egypt. Ain Shams Eng. J. 9, 3381–3390. doi:10.1016/j.asej.2018.03.008
Bagherzadeh-Khalkhali, A., and Mirghasemi, A. A. (2009). Numerical and experimental direct shear tests for coarse-grained soils. Particuology 7, 83–91. doi:10.1016/j.partic.2008.11.006
Bardet, J., and Proubet, J. (1991). A numerical investigation of the structure of persistent shear bands in granular media. Geotechnique 41, 599–613. doi:10.1680/geot.1991.41.4.599
Bardet, J., and Proubet, J. (1992). Shear-band analysis in idealized granular material. J. Eng. Mech. 118, 397–415. doi:10.1061/(asce)0733-9399(1992)118:2(397)
Belheine, N., Plassiard, J.-P., Donzé, F.-V., Darve, F., and Seridi, A. (2009). Numerical simulation of drained triaxial test using 3D discrete element modeling. Comput. Geotechnics 36, 320–331. doi:10.1016/j.compgeo.2008.02.003
Cao, P., Jiang, M.-j., and Ding, Z.-j. (2020). Effects of particle size on mechanical behaviors of calcareous sand under triaxial conditions. Jpn. Geotech. Soc. Spec. Publ. 8, 182–187. doi:10.3208/jgssp.v08.c54
CCCC Second Harbor Engineering Survey and Design Institute (2022). JTS133. Code for geotechnical investigation of water transport engineering (partially revised) - coral reef geotechnical investigation [S]. Beijing: Beijing People's Communications Press.
Chen, Y. Y., Tang, Y., Guan, Y. F., Liu, R. M., Han, X., and Zhao, X. Q. (2022). Study on the mechanical properties of coral sands with different particle gradations. Mar. Georesources Geotechnol., 1–12. doi:10.1080/1064119x.2022.2037112
Coop, M. (1990). The mechanics of uncemented carbonate sands. Géotechnique 40, 607–626. doi:10.1680/geot.1990.40.4.607
Cundall, P. A. (2001). A discontinuous future for numerical modelling in geomechanics? Proc. institution Civ. engineers-geotechnical Eng. 149, 41–47. doi:10.1680/geng.2001.149.1.41
Cundall, P. A., and Strack, O. D. (1979). A discrete numerical model for granular assemblies. geotechnique 29, 47–65. doi:10.1680/geot.1979.29.1.47
Desrosiers, R., and Silva, A. J. (2002). Strength behavior of marine sands at elevated confining stresses. Mar. Georesources Geotechnol. 20, 1–19. doi:10.1080/106411902753556834
Ding, Z., He, S.-H., Sun, Y., Xia, T.-D., and Zhang, Q.-F. (2021). Comparative study on cyclic behavior of marine calcareous sand and terrigenous siliceous sand for transportation infrastructure applications. Constr. Build. Mater. 283, 122740. doi:10.1016/j.conbuildmat.2021.122740
Donohue, S., O'sullivan, C., and Long, M. (2009). Particle breakage during cyclic triaxial loading of a carbonate sand. Géotechnique 59, 477–482. doi:10.1680/geot.2008.t.003
Evans, T. M., and Valdes, J. R. (2011). The microstructure of particulate mixtures in one-dimensional compression: Numerical studies. Granul. Matter 13, 657–669. doi:10.1007/s10035-011-0278-z
Fahey, M. (2021). “The response of calcareous soil in static and cyclic triaxial tests,” in Engineering for calcareous sediments (Boca Raton: CRC Press), 61–68.
Fan, K., Zheng, Y., Baudet, B. A., and Cheng, Y. P. H. (2021). Investigation of the ultimate particle size distribution of a carbonate sand. Soils Found. 61 (6), 1708–1717. doi:10.1016/j.sandf.2021.10.002
Giang, P. H. H., Van Impe, P., Van Impe, W., Menge, P., Cnudde, V., and Haegeman, W. (2017). Effects of particle characteristics on the shear strength of calcareous sand. Acta Geotech. Slov. 14, 77–89.
Giretti, D., Fioravante, V., Been, K., Dickenson, S., Mesri, G., and Kane, T. (2020). Mechanical properties of a carbonate sand from a dredged hydraulic fill. Geotechnique 70 (10), 937–942. doi:10.1680/jgeot.18.d.014
Goldenberg, C., and Goldhirsch, I. (2005). Friction enhances elasticity in granular solids. Nature 435, 188–191. doi:10.1038/nature03497
Hassanlourad, M., Salehzadeh, H., and Shahnazari, H. (2014). Drained shear strength of carbonate sands based on energy approach. Int. J. Geotechnical Eng. 8, 1–9. doi:10.1179/1938636213z.00000000050
Hongbing, Y., Zongxun, S., and Cheng, T. (2006). Physical and mechanical properties of coral sand in the Nansha Islands.
Hu, B. (2008). Research on the particle breakage mechanical characteristics and constitutive model of calcareous sand under triaxial conditions. Wuhan, China: Institute of Rock and Soil Mechanics, Chinese Academy of Sciences.
Huodong, C., Houzhen, W., Qingshan, M., Zhibing, W., and Zheng, F. (2018). The study on stress-strain-strength behavior of calcareous sand with particle breakage. 工程地质学报 26, 1490–1498.
Jiang, L., Fan, J., Wang, Z., and Huo, Z. (2015). Mechanical property of calcareous sand under action of compaction. Glob. Geol. 18, 183–187.
Jingping, W., Yao, C., and Zhigang, L. (1997). Influence of particle breakage on the deformation and strength properties of calcareous sands. Chin. J. Geotechnical Eng. 19.
Kuang, D., Long, Z., Guo, R., and Yu, P. (2021). Experimental and numerical investigation on size effect on crushing behaviors of single calcareous sand particles. Mar. Georesources Geotechnol. 39 (5), 543–553. doi:10.1080/1064119x.2020.1725194
Lade, P. V., Nam, J., and Liggio, C. D. (2010). Effects of particle crushing in stress drop-relaxation experiments on crushed coral sand. J. Geotechnical Geoenvironmental Eng. 136 (3), 500–509. doi:10.1061/(asce)gt.1943-5606.0000212
Lade, P. V., Yamamuro, J. A., and Bopp, P. A. (1996). Significance of particle crushing in granular materials. J. Geotechnical Eng. 122, 309–316. doi:10.1061/(asce)0733-9410(1996)122:4(309)
Liang, K., Chen, G., and Dong, Q. (2022). “Small-strain shear modulus of coral sand with various particle size distribution curves,” in Proceedings of the 4th international conference on performance based Design in earthquake geotechnical engineering (beijing 2022). Editors L. Wang, J-M. Zhang, and R. Wang (Cham: Springer International Publishing), 2054–2072.
Liu, C., and Wang, R. (1998). Preliminary research on physical and mechanical properties of calcareous sand. Rock Soil Mech. 19, 32–37.
Liu, H., Zeng, K., and Zou, Y. (2020). Particle breakage of calcareous sand and its correlation with input energy. Int. J. Geomechanics 20 (2), 04019151. doi:10.1061/(asce)gm.1943-5622.0001541
Liu, L., Liu, H., Stuedlein, A. W., Evans, T. M., and Xiao, Y. (2019). Strength, stiffness, and microstructure characteristics of biocemented calcareous sand. Can. Geotechnical J. 56 (10), 1502–1513. doi:10.1139/cgj-2018-0007
Lv, Y., Li, F., Liu, Y., Fan, P., and Wang, M. (2017). Comparative study of coral sand and silica sand in creep under general stress states. Can. Geotechnical J. 54 (11), 1601–1611. doi:10.1139/cgj-2016-0295
Ma, L., Li, Z., Liu, J., Duan, L., and Wu, J. (2019). Mechanical properties of coral concrete subjected to uniaxial dynamic compression. Constr. Build. Mater. 199, 244–255. doi:10.1016/j.conbuildmat.2018.12.032
Ma, W., Qin, Y., Zhao, K., and Chen, G. (2022). Comparisons on liquefaction behavior of saturated coral sand and quartz sand under principal stress rotation. Mar. Georesources Geotechnol. 40, 235–247.
Meng, Q.-S., Yu, K.-F., Wang, R., Qin, Y., Wei, H.-Z., and Wang, X.-Z. (2014). Characteristics of rocky basin structure of yongshu reef in the southern south China sea. Mar. Georesources Geotechnol. 32, 307–315. doi:10.1080/1064119x.2013.764553
Morsy, A. M., Salem, M. A., and Elmamlouk, H. H. (2019). Evaluation of dynamic properties of calcareous sands in Egypt at small and medium shear strain ranges. Soil Dyn. Earthq. Eng. 116, 692–708. doi:10.1016/j.soildyn.2018.09.030
Rezvani, R., Nabizadeh, A., and Amin Tutunchian, M. (2021). The effect of particle size distribution on shearing response and particle breakage of two different calcareous soils. Eur. Phys. J. Plus 136, 1008–1016. doi:10.1140/epjp/s13360-021-01871-5
Rui, S., Wang, L., Guo, Z., Zhou, W., and Li, Y. (2021). Cyclic behavior of interface shear between carbonate sand and steel. Acta Geotech. 16, 189–209. doi:10.1007/s11440-020-01002-x
Shen, J., Wang, X., Wang, X., Yao, T., Wei, H., and Zhu, C. (2021). Effect and mechanism of fines content on the shear strength of calcareous sand. Bull. Eng. Geol. Environ. 80, 7899–7919. doi:10.1007/s10064-021-02398-w
Shen, Y., Zhu, Y., Liu, H., Li, A., and Ge, H. (2018). Macro-meso effects of gradation and particle morphology on the compressibility characteristics of calcareous sand. Bull. Eng. Geol. Environ. 77, 1047–1055. doi:10.1007/s10064-017-1157-6
Smith, D. A., and Cheung, K. F. (2003). Settling characteristics of calcareous sand. J. Hydraulic Eng. 129, 479–483. doi:10.1061/(asce)0733-9429(2003)129:6(479)
Stratton, R., and Wensrich, C. (2010). Modelling of multiple intra-time step collisions in the hard-sphere discrete element method. Powder Technol. 199, 120–130. doi:10.1016/j.powtec.2009.12.008
Thompson, N., Bennett, M. R., and Petford, N. (2009). Analyses on granular mass movement mechanics and deformation with distinct element numerical modeling: Implications for large-scale rock and debris avalanches. Acta Geotech. 4, 233–247. doi:10.1007/s11440-009-0093-4
Wang, L., Jiang, X., Liu, H., Zhang, Z., and Xiao, Y. (2018). “DEM investigation of fracture characteristic of calcareous sand particles under dynamic compression,” in Proceedings of China-europe conference on geotechnical engineering: Volume 1 (Springer), 247–251.
Wang, X.-Z., Jiao, Y.-Y., Wang, R., Hu, M.-J., Meng, Q.-S., and Tan, F.-Y. (2011). Engineering characteristics of the calcareous sand in nansha islands, south China sea. Eng. Geol. 120, 40–47. doi:10.1016/j.enggeo.2011.03.011
Wang, X.-Z., Wang, X., Jin, Z.-C., Meng, Q.-S., Zhu, C.-Q., and Wang, R. (2017). Shear characteristics of calcareous gravelly soil. Bull. Eng. Geol. Environ. 76, 561–573. doi:10.1007/s10064-016-0978-z
Wang, X.-Z., Wang, X., Jin, Z.-C., Zhu, C.-Q., Wang, R., and Meng, Q.-s. (2017). Investigation of engineering characteristics of calcareous soils from fringing reef. Ocean. Eng. 134, 77–86. doi:10.1016/j.oceaneng.2017.02.019
Wang, X., Ding, H., Meng, Q., Wei, H., Wu, Y., and Zhang, Y. (2021). Engineering characteristics of coral reef and site assessment of hydraulic reclamation in the South China Sea. Constr. Build. Mater. 300, 124263. doi:10.1016/j.conbuildmat.2021.124263
Wang, Y., Huang, J., Wang, D., Liu, Y., Zhao, Z., and Liu, J. (2020). Experimental study on hygrothermal characteristics of coral sand aggregate concrete and aerated concrete under different humidity and temperature conditions. Constr. Build. Mater. 230, 117034. doi:10.1016/j.conbuildmat.2019.117034
Xiao, P., Liu, H., Stuedlein, A. W., Evans, T. M., and Xiao, Y. (2019). Effect of relative density and biocementation on cyclic response of calcareous sand. Can. Geotechnical J. 56 (12), 1849–1862. doi:10.1139/cgj-2018-0573
Xu, D. S., Huang, M., and Zhou, Y. (2020). One-dimensional compression behavior of calcareous sand and marine clay mixtures. Int. J. Geomechanics 20 (9), 04020137. doi:10.1061/(asce)gm.1943-5622.0001763
Xu, L.-J., Wang, X.-z., Wang, R., Zhu, C.-q., and Liu, X.-p. (2022). Physical and mechanical properties of calcareous soils: A review. Mar. Georesources Geotechnol. 40, 751–766. doi:10.1080/1064119x.2021.1927270
Yamamuro, J. A., and Lade, P. V. (1996). Drained sand behavior in axisymmetric tests at high pressures. J. Geotechnical Eng. 122, 109–119. doi:10.1061/(asce)0733-9410(1996)122:2(109)
Yang, S., Shen, X., Liu, H., Ge, H., and Rui, X. (2020). Gradation affects basic mechanical characteristics of Chinese calcareous sand as airport subgrade of reefs. Mar. Georesources Geotechnol. 38 (6), 706–715. doi:10.1080/1064119x.2019.1614122
Yu, F. (2018). Particle breakage in triaxial shear of a coral sand. Soils Found. 58, 866–880. doi:10.1016/j.sandf.2018.04.001
Yue, Q., Qingshan, M., Ren, W., Siqian, H., and Yuting, Z. (2017). Model experimental research on uplift single pile in calcareous sand of South China Sea. Mar. Georesources Geotechnol. 35 (5), 653–660. doi:10.1080/1064119x.2016.1215362
Zhang, J., and Luo, M. (2020). Dilatancy and critical state of calcareous sand incorporating particle breakage. Int. J. Geomechanics 20, 04020030. doi:10.1061/(asce)gm.1943-5622.0001637
Keywords: calcareous sand, particle size distribution, triaxial test, shear strength, discrete element
Citation: Zhang Y, Zhang R, Yu C, Luo H and Deng Z (2023) Study on shear characteristics of calcareous sand with different particle size distribution. Front. Earth Sci. 11:1163930. doi: 10.3389/feart.2023.1163930
Received: 11 February 2023; Accepted: 10 March 2023;
Published: 23 March 2023.
Edited by:
Xuelong Li, Shandong University of Science and Technology, ChinaReviewed by:
Lei Shi, China University of Mining and Technology, ChinaCopyright © 2023 Zhang, Zhang, Yu, Luo and Deng. This is an open-access article distributed under the terms of the Creative Commons Attribution License (CC BY). The use, distribution or reproduction in other forums is permitted, provided the original author(s) and the copyright owner(s) are credited and that the original publication in this journal is cited, in accordance with accepted academic practice. No use, distribution or reproduction is permitted which does not comply with these terms.
*Correspondence: Ruiyuan Zhang, MTUzMjI3MjU1N0BxcS5jb20=
Disclaimer: All claims expressed in this article are solely those of the authors and do not necessarily represent those of their affiliated organizations, or those of the publisher, the editors and the reviewers. Any product that may be evaluated in this article or claim that may be made by its manufacturer is not guaranteed or endorsed by the publisher.
Research integrity at Frontiers
Learn more about the work of our research integrity team to safeguard the quality of each article we publish.