 Jing Yang
 Ya Huang1,2*
95% of researchers rate our articles as excellent or good
Learn more about the work of our research integrity team to safeguard the quality of each article we publish.
Find out more
ORIGINAL RESEARCH article
Front. Earth Sci. , 15 March 2023
Sec. Atmospheric Science
Volume 11 - 2023 | https://doi.org/10.3389/feart.2023.1162220
This article is part of the Research Topic Observation Characteristics and Formation Mechanisms of Severe Weather Events View all 13 articles
Under the backdrop of climate change, the rising frequency and intensity of extreme precipitation events in the middle and lower Yangtze River (MLYR) region are causing serious consequences and economic losses. To assess regional risk and understand the impact of atmospheric circulation on extreme precipitation, it's crucial to analyze the spatial and temporal fluctuations of these events, focusing on the time-frequency phase relationship. Using the observed precipitation data from 1979 to 2015, nine extreme precipitation indices were calculated and a trend analysis and wavelet coherence analysis were performed to evaluate their variation. The results show that: 1) an overall increase in the frequency, intensity, and duration of precipitation in the MLYR, with significant rises in the wet daily precipitation and highest precipitation amount in 1-day period; 2) a higher likelihood of extreme precipitation events in the southeast of the MLYR, and an uneven spatial distribution; 3) the Western Pacific Subtropical High (WPSH), the South China Sea high (SCSH), and the East Asian westerly jet (EAJ) all play a role in precipitation changes in the MLYR, with the WPSH having the most significant impact, followed by the SCSH, and the EAJ being weaker. The results deepen our understanding of the various characteristics and causes of extreme precipitation in the MLYR.
The occurrence of extreme precipitation events has become more frequent with global climate change, leading to significant human, economic, and societal losses (Liang, 2022). The study of extreme precipitation events has gained worldwide attention with a recent rise in frequency and intensity reported in various regions, including the United States (Gizaw et al., 2021), Japan (Hatsuzuka et al., 2021), Australia (Liu et al., 2020), India (Saha and Sateesh, 2022) and others. Several studies have shown that while extreme precipitation in China follows the global trend, it also exhibits regional and local differences (Li Y et al., 2021). For instance, the indices of precipitation intensity and frequency in Guangdong-Hong Kong-Macao Greater Bay and the middle and lower reaches of the Yangtze River (MLYR) have been increasing due to urbanization (Zhou et al., 2022). Meanwhile, the contribution rate of extreme precipitation in northwest China has risen due to afforestation (Zhang et al., 2007). Extreme precipitation can lead to disastrous floods and mudslides that impact agriculture, industry, transportation and cause huge economic losses (Chou et al., 2018). Hence, research into the spatial and temporal variations of extreme precipitation and its driving forces is crucial for effective water resource management, rational disaster prevention, and mitigation policy enactment.
Influenced by monsoon activities (Jin and Zhao, 2012), the MLYR exhibits unique climatic characteristics and is subject to complex precipitation mechanisms, resulting in frequent flood disasters (Gill et al., 2020). Research indicates that precipitation in the MLYR is closely linked to the Western Pacific Subtropical High (WPSH) and the South China Sea high (SCSH). The South China Sea serves as one of the sources of water vapor for MLYR, transporting it to eastern China through the summer monsoon (Que et al., 2016; Chu et al., 2021). Additionally, the location of WPSH highly affects precipitation in the MLYR by controlling the position of the precipitation belt and transporting water vapor along the edge of the subtropical high (Tian et al., 2000). The East Asian westerly jet (EAJ) is another key system that affects precipitation in the MLYR, with divergent updrafts occurring on either side of the upper-level jet inlet and outlet area (Wang and Zuo, 2016; Wang et al., 2018), which are conducive to the formation and maintenance of precipitation in the MLYR. In conclusion, the SCSH and WPSH can affect regional precipitation by transporting water vapor, while the EAJ affects it through favorable dynamic conditions. Although various researchers have studied the impact of atmospheric circulation from different perspectives, the phase relationship and periodic characteristics between precipitation and atmospheric circulation remain underexplored. Additionally, most studies focused on the time-frequency phase relationship have neglected the effect of the SCSH and the EAJ at high latitudes on extreme precipitation in the MLYR.
This study aims to thoroughly examine the spatial-temporal distribution and time-frequency phase relationship of extreme precipitation in the MLYR and its relationship with large-scale atmospheric circulation factors, including the WPSH, SCSH, and EAJ. The study will analyze the spatial-temporal variations of extreme precipitation indices using observation data from stations and conduct a Mann-Kendall test (MK test) to determine the trend of extreme precipitation in the MLYR. Finally, wavelet coherence analysis will be applied to examine the time-frequency phase correlation between extreme precipitation indices and atmospheric circulation indices such as the WPSH intensity index, the WPSH area index, the South China Sea Subtropical High Intensity index (SCSHI), and the East Asian Westerly Jet Intensity index (EASJI). This research will deepen our understanding of the various characteristics and causes of extreme precipitation in the MLYR.
The MLYR, which is located in the Yangtze River basin east of Yichang, Hubei province (as shown in Figure 1), has a typical subtropical monsoon climate (Ye et al., 2017). The MLYR experiences convergence of the summer monsoon and cold air from high latitudes, leading to the formation of Meiyu in June and July each year and resulting in a rainy summer season (Niu et al., 2021; Wang et al., 2021). The MLYR is known for its frequent drought and flood disasters, which are primarily caused by the uneven distribution of precipitation (Qi et al., 2021). Thus, it is of great significance to further study the spatial-temporal variation characteristics and the driving forces of extreme precipitation, which is possible to worsen the uneven temporal and spatial distribution of precipitation in the MLYR.
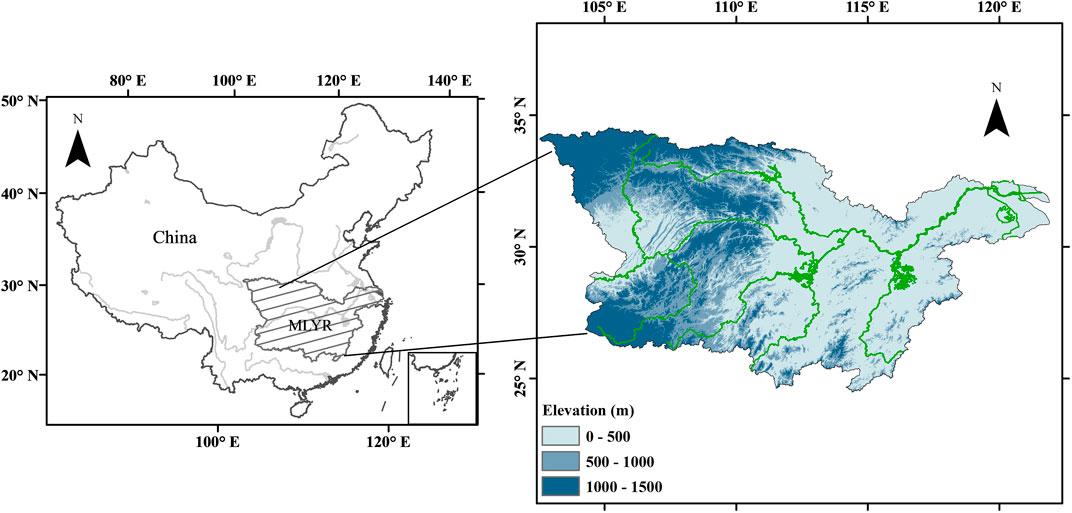
FIGURE 1. The MLYR domain and topography (m).
In this study, the daily precipitation indices were derived from the CN05 dataset, which spans from 1979 to 2015 and was provided by the National Climate Center of China with a horizontal resolution of 0.25°×0.25° (Shang et al., 2020). The dataset is generated by applying the thin-disk spline function method (ANUSPLIN) and the angular distance weight method (ADW) and has been widely used for climate assessments in China (Hu and Wang, 2021; Li et al., 2022).
The WPSH area index, WPSH intensity index, and SCSHI were obtained from the China Meteorological Administration’s website to analyze their correlations with extreme precipitation indices. To quantify the meandering of the westerly jet, the standardized value of the sum of the latitudinal winds at 200 hPa in the region of 27.5°–60°N, 70°–120°E, where the East Asian Westerly Jet (EAJ) is typically located (Chen et al., 2020), was defined as the East Asian Westerly Jet Intensity index (EASJI).
This study analyzes the duration, intensity, and frequency of extreme precipitation events in the MLYR based on various indices defined by the Expert Team on Climate Change Detection and Indices (ETCCDI) (Thomas and David, 1999). These indices include Consecutive dry days (CDD), Consecutive wet days (CWD), Extremely heavy precipitation days (R25 mm), Simple daily intensity index (SDII), Highest precipitation amount in 1-day period (RX1day), Highest precipitation amount in 5 consecutive days (RX5day), Precipitation on very wet days (R95), Precipitation on extremely wet days (R99) and wet daily precipitation (PRCPTOT). The definition of these precipitation indices are shown in Table 1.
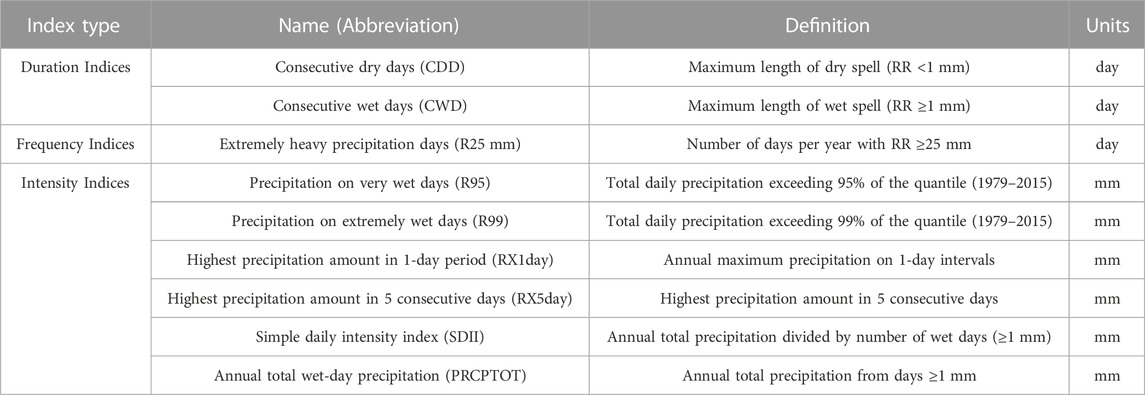
TABLE 1. Definition of the precipitation indices used in this study.
Wavelet coherence refers to the similarity of two synchronized time series in the time-frequency domain, in the region of common variation (not necessarily with high energy). The wavelet coherence spectrum can reveal not only the common high-energy region and phase relationship of the two-time series, but also measure the proximity of local correlation between them in the time-frequency domain (Juthasirorat et al., 2021; Zhao and Luo, 2021).
For time series of two simultaneous records
where s is the circular standard deviation;
where
where c1, c2 is a dimensionless constant, determined by the value of the specific time series and
The MK test is used to test the significance of the change trend of extreme precipitation indices in the time series (Bhatti et al., 2020). One advantage of this method is that it is suitable for sequences that do not follow a normal distribution. Let a stationary sequence be
where xi and xj are the data at moment i and j, respectively; n is the data length of the time series.
The variance of the statistic S is:
The expression for the standardized test statistic Z is as follows:
When Z>0 and |Z|≤1.96 mean that the series is a significant upward trend, when Z<0 and |Z|≤1.96, the series is a significant downward trend.
During 1979–2015, the frequency, intensity, and duration of precipitation in the MLYR presented an overall rising trend. Among the duration indices, CWD fluctuated between 9 and 20 days with a significant rising trend of 0. 99 days/10 years (Figure 2A), while CDD, ranging from 16 days to 35 days, showed a decreasing trend of −0.79 days/10 years (Figure 2B), indicating that the persistence of precipitation had intensified significantly and the continuous drought had weakened since 1979. Meanwhile, R25 mm showed a slightly increasing trend of 0.07 days/10 years (Figure 2C), suggesting that extreme precipitation had become more frequent. For indices of percentile intensity, R95 and R99 showed a downward trend and an upward trend, respectively, with slopes of −0.11 mm/10 years and 0.86 mm/10 years (Figures 2D,E). In intensity indices, PRCPTOT, RX1day, and RX5 day all presented an increasing trend, with climate tendency rates of 3.12 mm/10 years, 1.35 mm/10 years, and 2.04 mm/10 years, respectively, among which RX1day passed the 90% significance test (Figures 2F–I). In general, a consistently increasing trend of precipitation indices was observed in the MLYR from 1979 to 2015, expect for CDD, indicating that the annual mean precipitation, continuous heavy precipitation, and extreme precipitation in the MLYR tend to ascent from 1979.
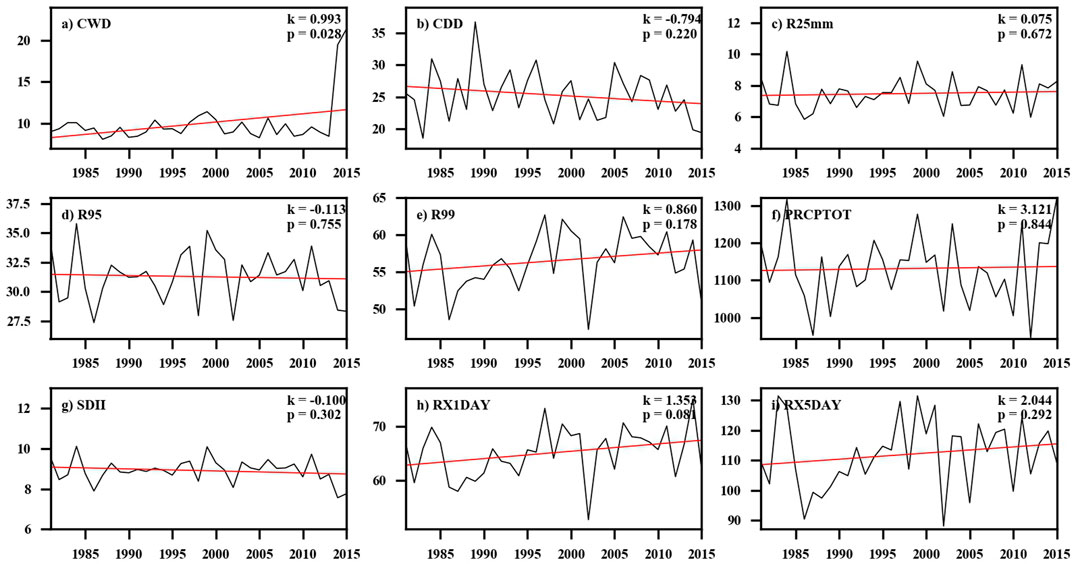
FIGURE 2. Time series of precipitation indices over the MLYR from 1979 to 2015. The red line indicates a linear trend. (A) CWD; (B) CDD; (C) R25mm; (D) R95; (E) R99; (F) PRCPTOT; (G) SDII; (H) RX1DAY; (I) RX5DAY.
Continuous heavy precipitation tended to occur in the southeast of MLYR, while the longest durations of drought events occurred in the northwest of MLYR. The spatial distributions of different precipitation indices in the MLYR from 1979 to 2015 are shown in Figure 3. Among duration indices, the minimum value of CWD was 7 days, while the maximum value was 17 days. The high values mainly concentrated in the southeast of the MLYR, while the low values were distributed in the Han River basin, located northwest of MLYR, and the lower reaches of the Yangtze River (LRYR), located in the northeast of MLYR (Figure 3A). The spatial distribution of CWD presented a downward trend from the southeast to the northwest of the MLYR. Meanwhile, CDD varied from seventeen to 29 days and presented an opposite spatial distribution of CWD, with the high values mainly distributed in the Han River basin and the low-value areas concentrated in the Dongting Lake basin in the southwest of MLYR (Figure 3B). The duration is a critical factor in the occurrence of catastrophic rainstorms and drought events, so more attention should be paid to flood prevention in the southeast of MLYR and the supply of water resources in the northwest of MLYR.
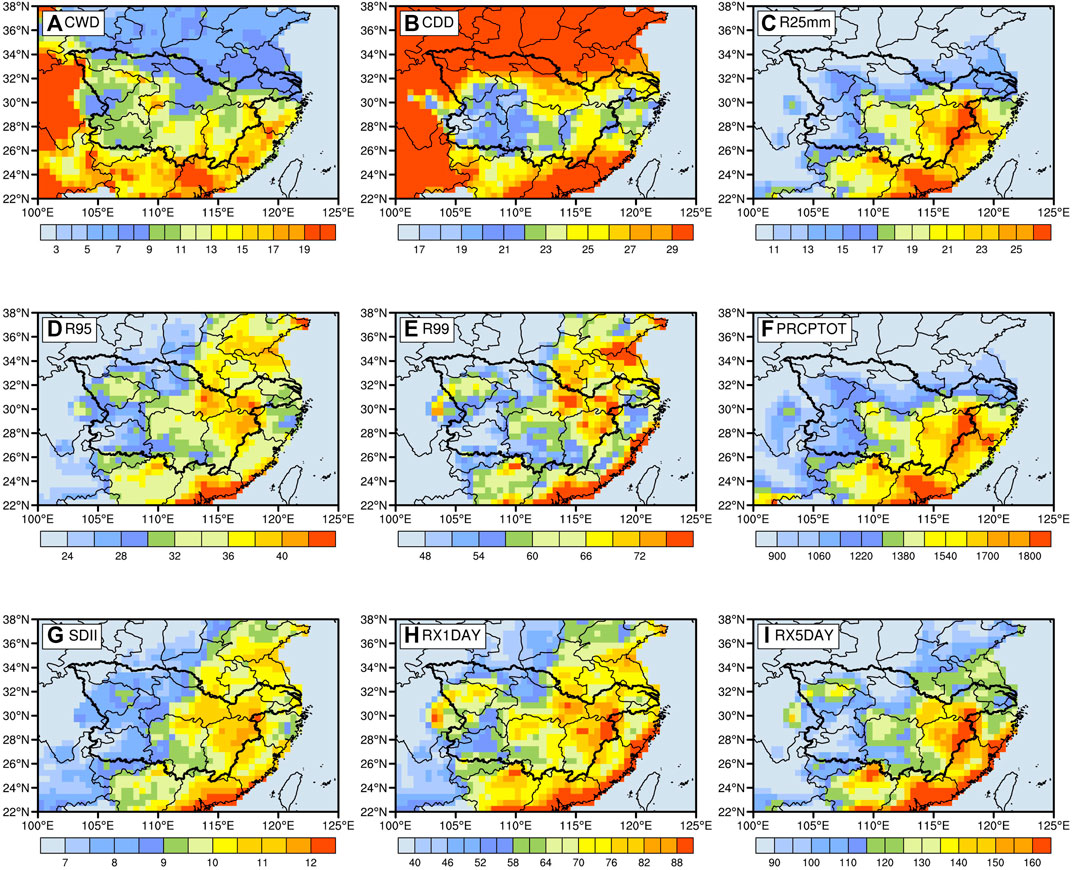
FIGURE 3. Spatial distributions of annual mean precipitation indices over the MLYR from 1979 to 2015. The area surrounded by the thick black line is the MLYR. (A) CWD; (B) CDD; (C) R25mm; (D) R95; (E) R99; (F) PRCPTOT; (G) SDII; (H) RX1DAY; (I) RX5DAY.
The frequency and intensity of precipitation in the MLYR present similar spatial distribution characteristics, which decrease from the southeast coast to the northwest inland. Among indices regarding the frequency of extreme precipitation, the high values of R25 mm are centered around the Poyang Lake basin in the southeast of MLYR, while the low value is concentrated in the Han River basin and LRYR, with only single-digit magnitudes in some regions (Figure 3C). For indices of precipitation intensity, the high-value areas of R95 and R99 are concentrated in the Poyang Lake basin, while the low-value regions are located in the Han River basin and the Dongting Lake basin (Figures 3D,E). The spatial distribution characteristics of PRCPTOT are more similar to that of R25 mm, with high values concentrated in the southeast of MLYR (Figure 3F). Meanwhile, SDII, RX1day, and RX5day have similar spatial distributions with a descending trend from the southeast to the northwest of the MLYR (Figures 3G–I). The areas with large extreme precipitation indices are mainly concentrated in the Poyang Lake basin, while the areas with low values were mainly concentrated in the Han River Basin.
The overall trends of the extreme precipitation indices in the MLYR from 1979 to 2015 are upward except for CDD, which is conducive to aggravating the uneven distribution of precipitation. Figure 4 illustrates the spatial distribution of the variation tendency of extreme precipitation indices in the MLYR. Among duration indices, the variation trend of CWD decreased from the southeast to the northwest of the MLYR and the growth trend of CWD was centered over the Poyang Lake Basin, while the downward trend was mainly distributed in the Han River Basin and the lower reaches of the Dongting Lake Basin (Figure 4A). CDD diminished in most regions, but no region passed the significance test (Figure 4B). For the extreme precipitation frequency index, R25 mm showed a consistent upward trend in most regions of the MLYR, and the dramatic growth trend was mainly centered over the Poyang Lake Basin and the Taihu Lake Basin, indicating that the extreme heavy precipitation days in these regions tend to increase continuously from 1979 to 2015. The Han River Basin and some parts of the Dongting Lake Basin showed an insignificant moderating trend with a rate of −0.6%/10a (Figure 4C). Among extreme precipitation intensity indices, R95 and R99 have a similar spatial distribution which shows a continuous upward trend in most areas (Figures 4D,E). Meanwhile, PRCPTOT tended to increase in the eastern coast of MLYR (Figure 4F), which was also the region with the highest annual average precipitation (Figure 3F). With the exception of Yichang province, SDII presented a slight upward trend in most regions (Figure 4G), and the spatial distribution of the trends of RX1day and RX5day was relatively complex, showing a declining trend in the lower reaches of Dongting Lake and the Han River, and an insignificant upward trend in most regions of Poyang Lake, Taihu, and lower reaches of the Yangtze River (Figures 4H,I).
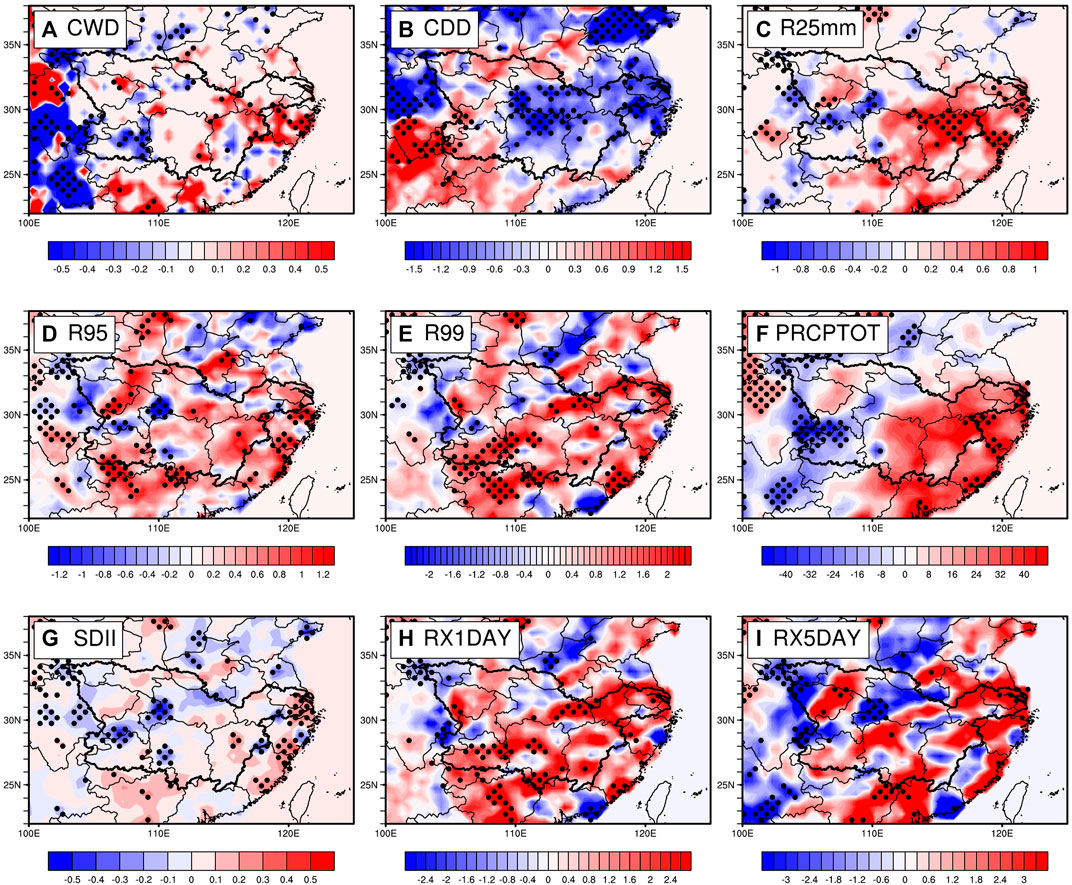
FIGURE 4. Spatial distributions of the variation tendency of annual mean precipitation indices over the MLYR from 1979 to 2015. The area surrounded by the thick black line is the MLYR. The dotted areas are indicated to pass the 95% confidence test. (A) CWD; (B) CDD; (C) R25mm; (D) R95; (E) R99; (F) PRCPTOT; (G) SDII; (H) RX1DAY; (I) RX5DAY.
The precipitation indices regarding extreme precipitation are positively correlated with WPSH and SCSH, while there is a difference in the correlation with EAJ (Table 2). R25 mm is significantly affected by the area (r = 0.6, p < 0.05) and the intensity (r = 0.57, p < 0.01) of the WPSH, indicating that the extreme precipitation in the MLYR is significantly affected by the activity of the WPSH. Meanwhile, a high level of correlation exists between PRCPTOT and WPSH area (r = 0.49, p < 0.01), WPSH intensity (r = 0.47, p < 0.01), indicating that there is a significant positive correlation between total precipitation and the activity of the WPSH. In terms of SCSHI, which lacks research in previous studies, it is significantly correlated with R25 mm (r = 0.69, p < 0.01) and PRCPTOT (r = 0.59, p < 0.01). Moreover, there is a significant positive correlation between the EASJI and R25 mm, as well as EASJI and PRCPTOT, while a negative correlation exists between the EASJI and CDD, R99, RX1day. However, none of the negative correlations pass the significance test and the correlation coefficients are quite small.
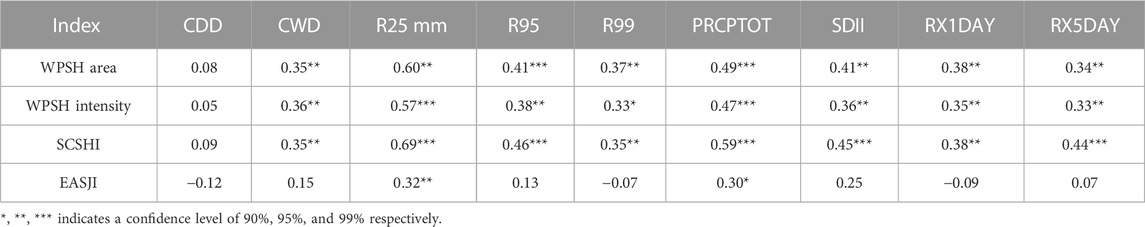
TABLE 2. The correlation coefficient of atmospheric circulation indices with annual mean precipitation indices in the MLYR from 1979 to 2015.
Based on the wavelet coherence analysis, the relationship between large-scale climatic factors and extreme precipitation indices in the time-frequency domain is studied. All climate indices are calculated from annual averages. The area surrounded by the tapered thin arc represents the effective spectral value, while the rest areas represent the invalid spectral value. Regions surrounded by a thick line indicate that they pass the test of the red noise standard spectrum at the 0.05 significance level. The arrows indicate the phase relationship between the two signal sequences, with the arrows to the right (left) indicating that the extreme precipitation indices and the atmospheric circulation factors are in the same (anti) phase. The downward (upward) arrow indicates that the phase difference between the extreme precipitation indices and the atmospheric circulation factor is 90°, meaning that the precipitation is 1/4 cycle ahead (later) than the circulation in the time series. Warm colors indicate a strong correlation, while cold colors indicate a weak correlation. Two signal sequences with significant correlation and large correlation coefficient in Table 2 are selected for wavelet coherence analysis to study the phase relationship between extreme precipitation and atmospheric circulation.
The precipitation in the MLYR is prone to trigger and intensify when the area of WPSH expands. Figure 5 illustrates the wavelet power spectrum of WPSH and precipitation indices. During 1987–1993, PRCPTOT and the WPSH area index have a significant resonance period of 8–10 years, and the phase difference is 90°, indicating that the variation of the area of WPSH precedes that of PRCPTOT. From 1998 to 2008, there exists a significant positive correlation resonance period with a time scale of 4–6 years, and the correlation coefficient is as high as 0.9. The arrow pointing to the right indicates that the area of the WPSH changed simultaneously with PRCPTOT (Figure 5A). Meanwhile, there is a significant resonance period between R25 mm and the area of the WPSH on a time scale of 4–10a from 1985 to 2009, and the correlation coefficient reaches 0.9, indicating a continuous influence of WPSH activity on the frequency of extreme precipitation (Figure 5B).
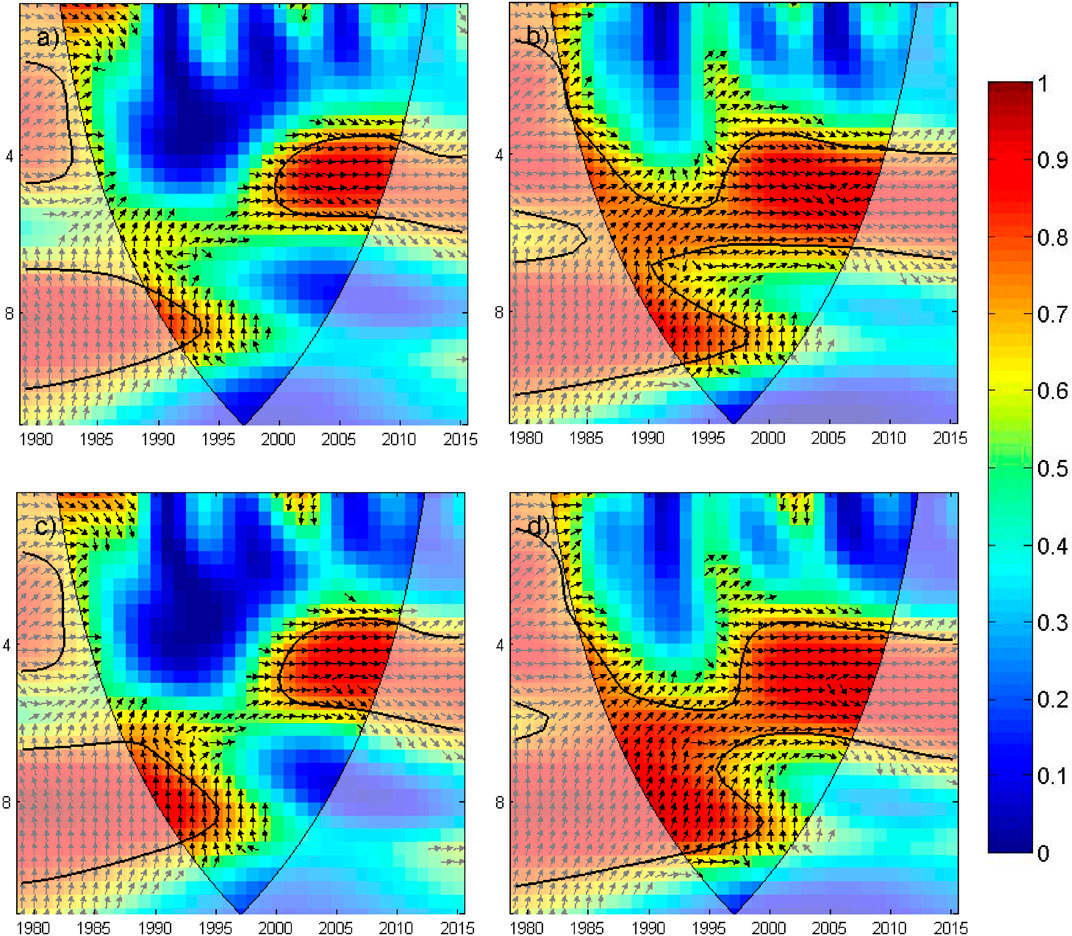
FIGURE 5. Wavelet coherent spectra of annual mean precipitation indices and WPSH over the MLYR from 1979 to 2015: (A) PRCPTOT and WPSH area, (B) R25 mm and WPSH area, (C) PRCPTOT and WPSH intensity, (D) R25 mm and WPSH intensity.
The intensification of WPSH leads to an increase in total precipitation and the frequency of extreme precipitation. From 1987 to 1996, there was a significant resonance period of 6–10 years between PRCPTOT and the WPSH intensity index, with the variation of PRCPTOT being delayed by 1/4 cycle from WPSH. From 2000 to 2008, the two signals have a resonance period of 3–6 years and a correlation coefficient greater than 0.8. There is a significant in-phase variation between PRCPTOT and WPSH intensity, with most arrows pointing to the right (Figure 5C). During 1985–1998, R25 mm and WPSH intensity have a significant resonance period of 4–11 years, with the arrows mostly pointing to the upper right, indicating that the intensity of WPSH is ahead of the changes in R25 mm. From 2000 to 2010, the phase difference is 90°, indicating that the change of WPSH is 1/4 cycle ahead of the change of R25 mm (Figure 5D). There is also a significant positive correlation between WPSH intensity and other extreme precipitation indices. The results from time-frequency phase analysis show that changes in large-scale circulation during the expansion or contraction and intensification or weakening of WPSH have a positive or negative effect on monsoon rainfall.
The intensification of the SCSH has a favorable impact on summer precipitation in the MLYR. During the period of 4–6 years, there is a significant resonance period between PRCPTOT and SCSHI from 2000 to 2008, and the two signals vary simultaneously (Figure 6A). In the 7–9 years period, the two signals show a significant positive correlation resonance period from 1986 to 1995, with a 90° phase difference, indicating that the variation of PRCPTOT lags behind that of SCSHI by 1/4 period in the time series (Figure 6A). The same pattern is observed between R25 mm and SCSHI, the two signals have a resonance period of 4–8 years and a correlation coefficient greater than 0.9. Most arrows point to the upper right, indicating that the frequency of extreme precipitation is positively correlated with the SCSH, and the variation of SCSH precedes that of R25 mm (Figure 6B).
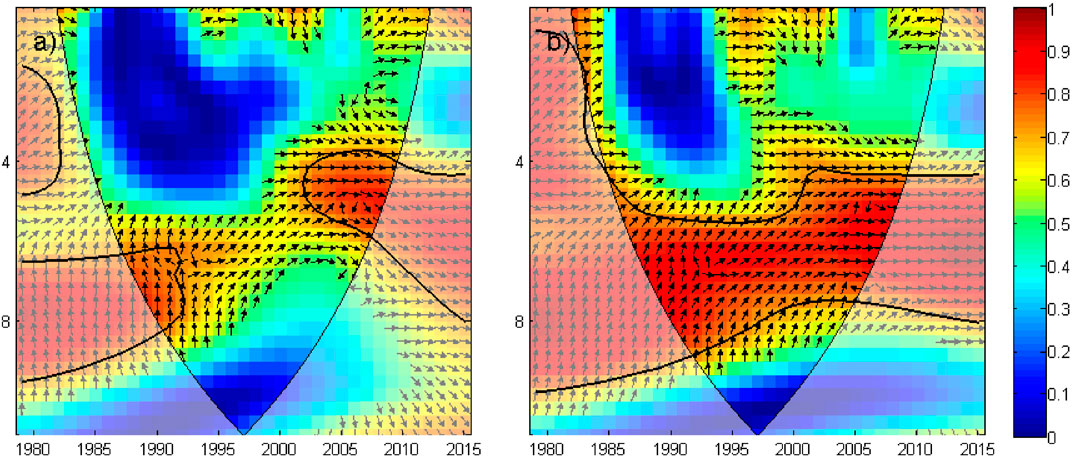
FIGURE 6. Wavelet coherent spectra of annual mean precipitation indices and SCSH over the MLYR from 1979 to 2015: (A) PRCPTOT and SCSHI, (B) R25 mm and SCSHI.
The relationship between the EAJ and precipitation indices as shown by the time-frequency phase analysis indicates a significant positive correlation between the two sequences. The correlation coefficient between PRCPTOT and EASJI reaches 0.9 and most of the arrows point to the right or upper right, indicating that the total precipitation in the MLYR and EAJI are in phase (Figure 7A). The same relationship exists between R25 mm and EASJI, with the arrows mostly pointing to the upper right, indicating that the variation of EAJ is ahead of the changes in R25 mm. There is a significant resonance period between R25 mm and EASJI on a time scale of 1–5a from 1985 to 1994, and the correlation coefficient reaches 0.9, indicating a continuous positive influence of EAJ on the frequency of extreme precipitation (Figure 7B).
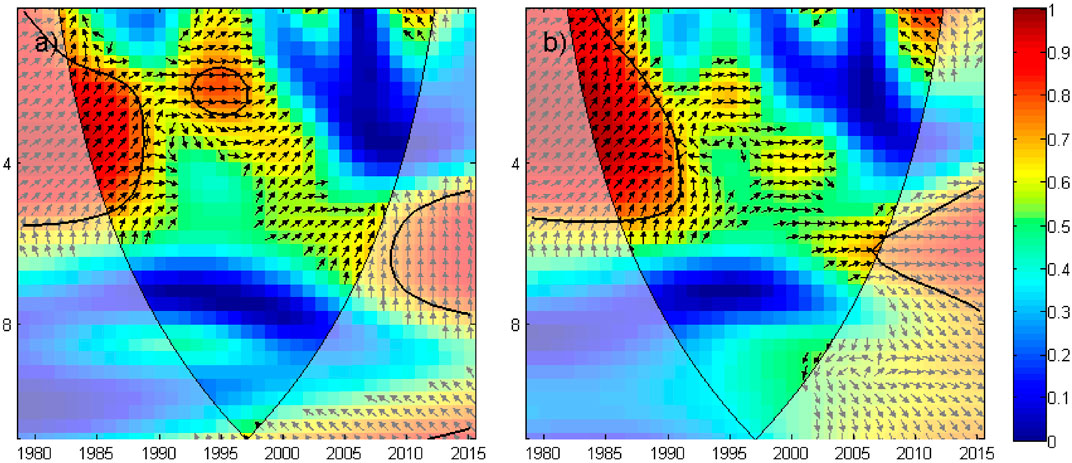
FIGURE 7. Wavelet coherent spectra of annual mean precipitation indices and EASJI over the MLYR from 1979 to 2015: (A) PRCPTOT and EASJI, (B) R25 mm and EASJI.
The MLYR, located in one of the world’s most well-known monsoon regions, is a central area of subtropical East Asia. Heavy flooding in the MLYR is often influenced by the precipitation change of summer season, which has been appreciated extensively (Huang et al., 2013). In this study, it is concluded from Figure 2 that summer precipitation displays a strong increasing trend, which agrees with previous research (Cui et al., 2012; Tian et al., 2017). Such phenomena were reported for several provinces in the MLYR such as Jiangxi, Hunan, and Hubei province (Hu and Wang, 2021; Li X et al., 2021; Yang et al., 2021). Some regions in the MLYR have a low-lying topography and belong to a highly flood-prone area. The trends of precipitation amount in summer might be enhancing the possibility of flood risk in these provinces in the MLYR (Huang et al., 2013).
Although worldwide changes in extreme climate events have been detected in the past few decades, various studies have attempted to assess climate change-related extreme events at a regional level. For China as a whole, the regional trend for mean precipitation amount on PRCPTOT, RX1day, and RX5day is 0.3, 1.37, and 1.90 mm/decade, respectively (You et al., 2011; Zhou et al., 2016). Similarly, the majority of the extreme precipitation indices for MLYR show positive changes. However, compared with the regional trend of China, the indices such as RX5day (2.04 mm/decade) and PRCPTOT (3.1 mm/decade) in the MLYR have larger variations (Figure 2). Meanwhile, R99 and RX1day in the MLYR display a positive trend, indicating that increases in total precipitation are projected to be mainly due to the increasing trends of intensity of extreme heavy precipitation. Although most of the trends are non-significant, it also suggests that there is a weak increasing tendency for precipitation in MLYR. Changes in extreme heavy precipitation are likely to have a greater immediate impact on human society than any likely small changes in mean rainfall amount, which have the potential to result in higher variability of flood risk in some regions (Cui et al., 2019; Hu and Wang, 2021).
Correlations between large-scale atmospheric indices and precipitation indices over the MLYR have been calculated. The precipitation in the MLYR is controlled mainly by the summer monsoon (Wang et al., 2021), which transports a huge amount of atmospheric moisture from the Pacific Ocean and the South China Sea to the MLYR along the periphery of the WPSH (Hui and Fang, 2016). Meanwhile, the sea surface temperature anomalies in the Pacific Ocean and the South China Sea could affect atmospheric circulation through air-sea interaction, thus precipitation changes in the MLYR lag behind the variation of large-scale atmospheric factors (Figures 5, 6). The sea surface temperature, which affects climate change and atmospheric cycle, is referred as atmospheric signals and has received a lot of attention as a precursor to precipitation (Helali et al., 2020; Xu et al., 2020). Moreover, the activity of EAJ represents the movement of extratropical cyclone or cold air masses and can cause large-scale precipitation through dynamic effects (Wang and Zuo, 2016; Wang et al., 2018).
Atmospheric circulation and the formation of precipitation are complex processes that are coordinated by various factors at various scales, including other constituents of the climate system (such as land, ocean, cryosphere, and biosphere) (Shao et al., 2016; Wu et al., 2021). This study mainly focused on the relationship between atmospheric circulation and extreme precipitation. However, the mechanism by which atmospheric circulation affects precipitation is not elaborated and the correlation coefficients do not necessarily imply causation. Meanwhile, the human activities (such as greenhouse gas emissions, urban heat islands, reclamation, artificial afforestation, and deforestation) also play a vital role in extreme precipitation variations (Cheng et al., 2013; Feng et al., 2014; Ashish et al., 2017). Especially with the current impetus on economic development, the impact of human factors on extreme precipitation must be considered. Further research should combine human activities with natural factors, to design a precipitation change model and provide a detailed understanding of the physical mechanisms that drive these relationships (Luo et al., 2013). Furthermore, it will be necessary to build models to predict future development trends in future research, since this research is limited to a specific time period (1979–2015), and it is important to consider the potential impact of long-term climate variability and change.
The MLYR region is particularly prone to flood disasters and is highly sensitive to global warming. In this study, nine annual mean precipitation indices were selected based on precipitation observation data to examine the spatial and temporal variation characteristics of extreme precipitation events in the MLYR from 1979 to 2015. The correlations between various atmospheric circulation factors and extreme precipitation were also investigated using wavelet coherence analysis. The main results of this study are summarized as follows.
(1) Except for CDD and SDII, all the precipitation indices in the MLYR show an upward trend from 1979 to 2015. Among them, CWD and RX1day have a significant upward trend, and PRCPTOT increased at the fastest rate. Despite most of the variations showing no significant change, the intensity, frequency, and duration of extreme precipitation events in the MLYR have increased over time, which is more likely to result in extreme precipitation events in the MLYR over time.
(2) The extreme precipitation indices in the MLYR show a downward trend from the southeast to the northwest, indicating that extreme precipitation is more likely to occur in the southeast part of the MLYR. Most of the increasing trends in extreme precipitation indices are located in the Poyang Lake Basin, the LRYR, and the lower reaches of Dongting Lake, indicating that the frequency of extreme precipitation events in these regions probably increases significantly in the days to come, exacerbating the uneven distribution of precipitation.
(3) Four atmospheric circulation indices (i.e., the WPSH intensity index, WPSH area index, SCSHI, and EASJI) significantly influence the frequency of extreme precipitation and total precipitation in the MLYR. The WPSH has the most significant impact, followed by the SCSH, while the EAJ has the weakest effect. The results support the conclusion that these large-scale climatic factors play a crucial role in the variation of extreme precipitation in the MLYR from a time-frequency phase relationship perspective.
The original contributions presented in the study are included in the article/Supplementary Material, further inquiries can be directed to the corresponding author.
JY designed the study, completed the original draft. YH provided some software for the study and revised the original draft. YL provided financial support for the research. GL revised the original draft. All authors commented on the manuscript and agreed to the published version of the manuscript.
This research was funded by the Open Research Fund of State Key Laboratory of Simulation and Regulation of Water Cycle in River Basin, China Institute of Water Resources and Hydropower Research (IWHR-SKL-KF202204), the Jiangsu Funding Program for Excellent Postdoctoral Talent (2022ZB147), the Key Scientific and Technological Project of the Ministry of Water Resources. P.R.C (SKS-2022001) and the Systematic Project of Guangxi Key Laboratory of Disaster Prevention and Engineering Safety (2022ZDK026).
The authors greatly appreciate the data availability and service provided by China Meteorological Administration and ERA-Interim science team. The authors also appreciate the support of Jun Wang (Researcher, Institute of Atmospheric Physics, Chinese Academy of Sciences) for providing observational data sets used in this study.
The authors declare that the research was conducted in the absence of any commercial or financial relationships that could be construed as a potential conflict of interest.
All claims expressed in this article are solely those of the authors and do not necessarily represent those of their affiliated organizations, or those of the publisher, the editors and the reviewers. Any product that may be evaluated in this article, or claim that may be made by its manufacturer, is not guaranteed or endorsed by the publisher.
Ashish, S., Harindra, J. S. F., Alan, F. H., Jessica, J. H., Michael, B., and Fei, C. (2017). Urban meteorological modeling using WRF: A sensitivity study. Int. J. Climatol. 37 (4), 1885–1900. doi:10.1002/joc.4819
Bhatti, A. S., Wang, G., Ullah, W., Ullah, S., Fiifi Tawia Hagan, D., Kwesi Nooni, I., et al. (2020). Trend in extreme precipitation indices based on long term in situ precipitation records over Pakistan. Water-Sui 12 (3), 797. doi:10.3390/w12030797
Chen, H., Liu, P., and Zhou, C. (2020). Correction to: Zonally asymmetric mode of anomalous activity in summer Asian subtropical westerly jet and its possible sources. Theor. Appl. Climatol. 140 (1-2), 805. doi:10.1007/s00704-020-03110-w
Cheng, F., Hsu, Y., Lin, P., and Lin, T. (2013). Investigation of the effects of different land use and land cover patterns on mesoscale meteorological simulations in the taiwan area. J. Appl. Meteorol. Clim. 52 (3), 570–587. doi:10.1175/JAMC-D-12-0109.1
Chou, J., Xian, T., Dong, W., and Xu, Y. (2018). Regional temporal and spatial trends in drought and flood disasters in China and assessment of economic losses in recent years. Sustainability 11 (1), 55. doi:10.3390/su11010055
Chu, Q., Wang, Q., Feng, G., Jia, Z., and Liu, G. (2021). Roles of water vapor sources and transport in the intraseasonal and interannual variation in the peak monsoon rainfall over East China. Clim. Dynam 57 (7-8), 2153–2170. doi:10.1007/S00382-021-05799-5
Cui, L., Wang, L., Qu, S., Ramesh, P. S., Lai, Z., and Yao, R. (2019). Spatiotemporal extremes of temperature and precipitation during 1960–2015 in the Yangtze River Basin (China) and impacts on vegetation dynamics. Theor. Appl. Climatol. 136 (1), 675–692. doi:10.1007/s00704-018-2519-0
Cui, Y., Jiang, Z., Chen, W., and Zhang, R. (2012). Projections of the 21st century changjiang-huaihe River Basin extreme precipitation events. Adv. Clim. Chang. Res. 3 (2), 76–83. doi:10.3724/SP.J.1248.2012.00076
Feng, C., Xuchao, Y., and Weiping, Z. (2014). WRF simulations of urban heat island under hot-weather synoptic conditions: The case study of Hangzhou City, China. Atmos. Res. 138, 364–377. doi:10.1016/j.atmosres.2013.12.005
Gill, M. M., Nick, J. D., Adam, A. S., and Philip, E. B. (2020). Predicting June mean rainfall in the middle/lower Yangtze River Basin. Adv. Atmos. Sci. 37 (01), 29–41. (in Chinese). doi:10.1007/s00376-019-9051-8
Gizaw, M. S., Gan, T. Y., Yang, Y., and Gan, K. E. (2021). Changes to the 1979–2013 summer convective available potential energy (CAPE) and extreme precipitation over north America. Phys. Chem. Earth 123, 103047. doi:10.1016/j.pce.2021.103047
Hatsuzuka, D., Sato, T., and Higuchi, Y. (2021). Sharp rises in large-scale, long-duration precipitation extremes with higher temperatures over Japan. Npj Clim. Atmos. Sci. 4 (1), 29. doi:10.1038/S41612-021-00184-9
Helali, J., Salimi, S., Lotfi, M., Hosseini, S. A., Bayat, A., Ahmadi, M., et al. (2020). Investigation of the effect of large-scale atmospheric signals at different time lags on the autumn precipitation of Iran's watersheds. Arab. J. Geosci. 13 (18), 932. doi:10.1007/s12517-020-05840-7
Hu, R., and Wang, L. (2021). Variation of high and low level circulation of Meiyu in Jiangsu province in recent 30 years. Atmosphere 12 (10), 1258. doi:10.3390/atmos12101258
Huang, J., Sun, S., and Zhang, J. (2013). Detection of trends in precipitation during 1960-2008 in Jiangxi province, southeast China. Theor. Appl. Climatol. 114 (1-2), 237–251. doi:10.1007/s00704-013-0831-2
Hui, P., and Fang, J. (2016). Comparison of the multi-scale features in two persistent heavy rainfall events in the middle and lower reaches of Yangtze River. J. Meteorol. Res-Prc 30 (4), 528–546. doi:10.1007/s13351-016-6028-8
Jin, L., and Zhao, P. (2012). Observational and modeling studies of impacts of the South China Sea monsoon on the monsoon rainfall in the middle-lower reaches of the Yangtze River during summer. Acta Meteorol. Sin. 26 (2), 176–188. doi:10.1007/s13351-012-0204-2
Juthasirorat, N., Anusasananan, P., Suwanarat, S., and Thangprasert, N. (2021). Using wavelet analysis to study floods in Bangkok. J. Phys. Conf. Ser. 1719 (1), 012037. doi:10.1088/1742-6596/1719/1/012037
Li, X., Wei, Z., Wang, H., Ma, L., and Guo, S. (2022). Variations in the precipitation extremes over the Guangdong-Hong Kong-Macao greater Bay area in China. Theor. Appl. Climatol. 147 (1-2), 381–394. doi:10.1007/s00704-021-03829-0
Li, X., Zhang, K., Gu, P., Feng, H., Yin, Y., Chen, W., et al. (2021). Changes in precipitation extremes in the Yangtze River Basin during 1960–2019 and the association with global warming, ENSO, and local effects. Sci. Total Environ. 760, 144244. doi:10.1016/j.scitotenv.2020.144244
Li, Y., Bai, J., You, Z., Hou, J., and Li, W. (2021). Future changes in the intensity and frequency of precipitation extremes over China in a warmer world: Insight from a large ensemble. Plos One 16 (5), e0252133. doi:10.1371/JOURNAL.PONE.0252133
Liang, X. Z. (2022). Extreme rainfall slows the global economy. Nature 601 (7892), 193–194. doi:10.1038/D41586-021-03783-X
Liu, D. L., Teng, J., Ji, F., Anwar, M. R., Feng, P., Wang, B., et al. (2020). Characterizing spatiotemporal rainfall changes in 1960–2019 for continental Australia. Int. J. Climatol. 41 (S1), E2420–E2444. doi:10.1002/JOC.6855
Luo, Y., Wang, H., Zhang, R., Qian, W., and Luo, Z. (2013). Comparison of rainfall characteristics and convective properties of monsoon precipitation systems over south China and the Yangtze and huai River Basin. J. Clim. 26 (1), 110–132. doi:10.1175/jcli-d-12-00100.1
Niu, R., Zhai, P., and Tan, G. (2021). Anomalous features of extreme Meiyu in 2020 over the yangtze-huai River Basin and attribution to large-scale circulations. J. Meteorol. Res-Prc 35 (5), 799–814. doi:10.1007/S13351-021-1018-X
Ostadi, E., Jahanbakhsh, S., Rostamzadeh, H., Rezaibanafsheh, M., and Khorshiddust, A. M. (2021). Spatio-temporal trend analysis of solid precipitation in Northwest Iran. Arab. J. Geosci. 14 (17), 1709. doi:10.1007/s12517-021-07812-x
Qi, H., Zhi, X., Zhi, T., Bai, Y., Lin, C., and Chen, W. (2021). Using stratified Bayesian model averaging in probabilistic forecasts of precipitation over the middle and lower Yangtze River region. Meteorol. Atmos. Phys. 133, 961–972. doi:10.1007/S00703-021-00799-W
Que, Z., Wu, F., Bi, C., Long, Y., and Li, C. (2016). Impacts of monthly anomalies of intraseasonal oscillation over south China sea and south Asia on the activity of summer monsoon and rainfall in Eastern China. J. Trop. Meteorol. 22 (2), 145–158. doi:10.16555/j.1006-8775.2016.02.005
Saha, U., and Sateesh, M. (2022). Rainfall extremes on the rise: Observations during 1951–2020 and bias-corrected CMIP6 projections for near- and late 21st century over Indian landmass. J. Hydrol. 608, 127682. doi:10.1016/J.JHYDROL.2022.127682
Shang, S., Zhu, G., Li, R., Xu, J., Gu, J., Chen, H., et al. (2020). Decadal change in summer precipitation over the east of Northwest China and its associations with atmospheric circulations and sea surface temperatures. Int. J. Climatol. 40 (8), 3731–3747. doi:10.1002/joc.6424
Shao, J., Wang, J., Lv, S., and Bing, J. (2016). Spatial and temporal variability of seasonal precipitation in Poyang Lake basin and possible links with climate indices. Hydrol. Res. 47 (S1), 51–68. doi:10.2166/nh.2016.249
Thomas, R. K., and David, R. E. (1999). Climate extremes: Selected review and future research directions. Clim. Change 42 (1), 309–325. doi:10.1023/A:1005436904097
Tian, J., Liu, J., Wang, J., Li, C., Nie, H., and Yu, F. (2017). Trend analysis of temperature and precipitation extremes in major grain producing area of China. Int. J. Climatol. 37 (2), 672–687. doi:10.1002/joc.4732
Tian, J., Xu, J., and Wei, E. (2000). The wavelet analysis of satellite sea surface temperature in the South China Sea and the Pacific Ocean. Chin. Sci. Bull. 45 (23), 2187–2192. doi:10.1007/BF02886327
Wang, S., and Zuo, H. (2016). Effect of the EastEast Asian westerly jet's intensity on summer rainfall in the Yangtze River valley and its mechanism. J. Clim. 29 (7), 2395–2406. doi:10.1175/JCLI-D-15-0259.1
Wang, S., Zuo, H., Zhao, S., Zhang, J., and Lu, S. (2018). How East Asian westerly jet's meridional position affects the summer rainfall in Yangtze-Huaihe River Valley? Clim. Dynam 51 (11-12), 4109–4121. doi:10.1007/s00382-017-3591-3
Wang, T., Wei, K., and Ma, J. (2021). Atmospheric rivers and mei-yu rainfall in China: A case study of summer 2020. Adv. Atmos. Sci. 38 (12), 2137–2152. doi:10.1007/S00376-021-1096-9
Wu, S., Hu, Z., Wang, Z., Cao, S., Yang, Y., Qu, X., et al. (2021). Spatiotemporal variations in extreme precipitation on the middle and lower reaches of the Yangtze River Basin (1970–2018). Quatern Int. 592 (10), 80–96. doi:10.1016/j.quaint.2021.04.010
Xu, K., Tam, C., Liu, B., Chen, S., Yang, X., He, Z., et al. (2020). Attenuation of central pacific el niño amplitude by north pacific sea surface temperature anomalies. J. Clim. 33 (15), 6673–6688. doi:10.1175/JCLI-D-19-0767.1
Yang, X., Wu, J., Liu, J., and Ye, X. (2021). Changes of extreme precipitation and possible influence of ENSO events in a humid basin in China. Atmosphere 12 (11), 1522. doi:10.3390/ATMOS12111522
Ye, X., Xu, C., Li, Y., Li, X., and Zhang, Q. (2017). Change of annual extreme water levels and correlation with river discharges in the middle-lower Yangtze River: Characteristics and possible affecting factors. Chin. Geogr. Sci. 27 (02), 325–336. (in Chinese). doi:10.1007/s11769-017-0866-x
You, Q., Kang, S., Aguilar, E., Pepin, N., Flügel, W., Yan, Y., et al. (2011). Changes in daily climate extremes in China and their connection to the large scale atmospheric circulation during 1961–2003. Clim. Dynam 36 (11-12), 2399–2417. doi:10.1007/s00382-009-0735-0
Zhou, B., Xu, Y., Wu, J., Dong, S., and Shi, Y. (2016). Changes in temperature and precipitation extreme indices over China: Analysis of a high-resolution grid dataset. Int. J. Climatol. 36 (3), 1051–1066. doi:10.1002/joc.4400
Zhang, Z., Zhang, Q., and Jiang, T. (2007). Changing features of extreme precipitation in the Yangtze River basin during 1961–2002. J. Geogr. Sci. 17 (1), 33–42. doi:10.1007/s11442-007-0033-x
Zhao, Y., and Luo, Y. (2021). Wavelet analysis on temperature and precipitation changes in dabie mountain of west anhui. J. Phys. Conf. Ser. 1732 (1), 012105. doi:10.1088/1742-6596/1732/1/012105
Keywords: extreme precipitation, spatial-temporal variation characteristics, atmospheric circulation, Yangtze River, climate change
Citation: Yang J, Huang Y, Li G and Li Y (2023) Changes of extreme precipitation in the middle and lower reaches of the Yangtze River and their correlation with atmospheric circulation. Front. Earth Sci. 11:1162220. doi: 10.3389/feart.2023.1162220
Received: 09 February 2023; Accepted: 03 March 2023;
Published: 15 March 2023.
Edited by:
Shenming Fu, Institute of Atmospheric Physics (CAS), ChinaReviewed by:
Danqiong Dai, Institute of Atmospheric Physics (CAS), ChinaCopyright © 2023 Yang, Huang, Li and Li. This is an open-access article distributed under the terms of the Creative Commons Attribution License (CC BY). The use, distribution or reproduction in other forums is permitted, provided the original author(s) and the copyright owner(s) are credited and that the original publication in this journal is cited, in accordance with accepted academic practice. No use, distribution or reproduction is permitted which does not comply with these terms.
*Correspondence: Ya Huang, aHlnY2N3QDE2My5jb20=
Disclaimer: All claims expressed in this article are solely those of the authors and do not necessarily represent those of their affiliated organizations, or those of the publisher, the editors and the reviewers. Any product that may be evaluated in this article or claim that may be made by its manufacturer is not guaranteed or endorsed by the publisher.
Research integrity at Frontiers
Learn more about the work of our research integrity team to safeguard the quality of each article we publish.