- 1School of Civil Engineering, Chang’an University, Xi’an, China
- 2State Key Laboratory of Geomechanics and Geotechnical Engineering, Institute of Rock and Soil Mechanics, Chinese Academy of Sciences, Wuhan, China
- 3Key Laboratory of Roads and Railway Engineering Safety Control of Ministry of Education, Shijiazhuang Tiedao University, Shijiazhuang, China
- 4School of Engineering Science, University of Chinese Academy of Sciences, Beijing, China
- 5School of Architecture and Civil Engineering, Shenyang University of Technology, Shenyang, China
The cutting hills to back ditches (CHBD) project has been widely implemented since urbanization in hilly areas is steadily rising. The stability of the high-filled slope and the problem of foundation settlement deformation has become one of the vital issues for safe construction. This paper focused on the deformation evolution law and stability assessment of the high-filled deposit slope composed of the soil-rock mixture (S-RM) in the CHBD project, in Shiyan City, Hubei Province as examples. First, large-scale direct shear tests of S-RM with different rock block proportions (RBPs) under different various normal stresses were carried out, and its mechanical properties were analyzed. Next, the finite element method was used to simulate the processes of the step-by-step filling, and the deformation evolution law was analyzed. Then, the limited equilibrium method (LEM) was used to obtain the potential sliding surfaces and the corresponding safety factors of the high-filled slope, and the safety of the construction was assessed. Finally, automated monitoring of the step-by-step settlement and deep soil deformation was computerized for the typical locations, and the long-term stability of the high-filled slope was studied. The results demonstrate that the first layer of backfill in the F area contains the largest incremental settlement displacement in the y-direction, whereas the value in the G area occurs at the site of the fill layer close to the slope surface at each filling timestep. The displacement response value steadily declines with the increasing filling depth and horizontal displacement, presenting a clear spatial influence range, with the site of maximum incremental displacement as the center. After filling, the safety factors of the potential sliding surface in the F and G areas are 2.531 and 1.118, respectively, and the slope is in a stable state. The monitoring data show that the deformation mostly takes place within 10 m of the surface. The study’s findings are thought to offer technical and practical knowledge for the slope risks.
1 Introduction
With the fast expansion of infrastructure in China, urbanization buildings and essential transportation infrastructures have moved from flat land to hilly and mountainous places with challenging geological and geomorphological conditions. A lot of ‘cutting hills to backfill ditches (CHBD) to produce land’ projects have recently emerged at a historic moment. In 2012, Yan’an New City in China spent 100 billion yuan to reduce 3s3 hills, requiring 260 million m3 of filling and 310 million m3 of excavation. In order to plan the construction of the Dongchuan Science and Technology Industrial Park, the CHBD projects were undertaken on the gentle slopes and mid-slopes within a 10 km2 radius of Dongchuan City in Kunming City, Yunnan Province; the same year, more than 700 hills in Lanzhou City, Gansu Province, were cut to create the more than 100 km2 Lanzhou New City. A CHBD project with 150 thousand acre was also started in 2013 in Shiyan City, Hubei Province, to increase the available area for urban expansion and economic growth (Zhang et al., 2023). Additionally, a number of airports are constructed in hilly regions and it is necessary to fill in the original valley terrain. For example, the Shennongjia Airport, which is known as “China’s most beautiful ecological airport” was constructed in 2013 after 5 surrounding hills were cut down and hundreds of caves were filled in. The highest fills at the Sichuan Jiuzhai Huanglong Airport and Guizhou Liupanshui Yuezhao Airports are approximately 104 and 85.14 m, respectively.
However, as a high-risk construction project, it faces serious challenges to create land by the CHBD project such as the complex engineering geological conditions, difficult construction, high technical requirements, and relative lack of safety control technology (Bai et al., 2019; Du et al., 2022). A series of engineering safety and quality problems have appeared, resulting in project delays, budget overruns and various secondary geological disaster problems such as foundation deformation and landslide, which seriously affects economic development and threatens social stability and public safety (Qian et al., 2003; Wang et al., 2013; Yang et al., 2016; Wang et al., 2018; Miao et al., 2023). For example, on 20 December 2015, a landslide occurred at the Hongao landfill in Guangming New District, Shenzhen, Guangdong Province, China, causing more than 90 casualties, destroying 33 houses, affecting the production of 90 enterprises, involving 4,630 employees, and approving a direct economic loss of 881 million yuan from the approved accident. The accumulation area of the landslide is about 0.38 km2, with a volume of about 2.75 × 10⁶ m3 and a slip distance of 1,100 m, which is one of the most serious landfill landslides in the world (Gao et al., 2016; Yin et al., 2016). Additionally, the landslide hazards of airport hill-filled slopes occur from time to time, such as the landslide of Yichang Sanxia Airport, the landslide of the west runway of Lijiang Airport in Yunnan, the landslide of Jiuzhai Huanglong Airport in Sichuan, the landslide of Panzhihua Airport and many other typical cases, all of which have caused significant property losses or serious social impacts. Therefore, in order to ensure the successful construction and normal operation of the CHBD projects to create land and maximize the protection of national and social properties from losses, it is necessary to monitor all kinds of safety risks in the construction and operation of the project to avoid the engineering accidents (Huang et al., 2020a; Huang et al., 2020b; Chang et al., 2020; Chang et al., 2022; Miao et al., 2023).
Based on the field surveys and relevant data, Liu and Li. (2014) published a review of “China’s land creation project stands firm” in Nature, which objectively analyzed the actual situations of Yan’an “land creation project” in terms of feasibility demonstration, and took the construction of Yan’an New District in Shaanxi Province as an example to demonstrate different views on the recent media debate about “geohazards caused by flat ground by levelling hills and filling valleys in China”. The review indicates that the key to the construction of Yan’an New District lies in the “three surfaces-body-water” issue: the treatment of the original surface, the soil interface between the excavated and filled areas, the prevention of landslides on the open surface, the compaction of the slopes, and drainage of ground and surface water. Usually, the common problems of the CHBD project involve the large construction area, high filling height, large excavation and filling volume, complicated construction environment, and so on. The stability of the high-filled slope is one of the most important issues for safe construction. The main factors that threaten the high-filled slope stability are the displacement and settlement of the filled slope, and its deformation can be divided into two parts: the deformation of the original foundation and the backfilled body. The deformation of the original foundation includes the deformation due to the upper load and the soft layer. The deformation of the backfilled body is related to the characteristics of the backfilled material, the compaction degree, and the specific construction method (Miao et al., 2018; Bai et al., 2021a; Fu et al., 2022; Zhou et al., 2022). At present, even though a number of the high-filled slopes have been constructed by means of the CHBD project for human habitation and industrial activities, the slope stability assessments in the existing researches are focused on the natural or excavated slopes (Jiang et al., 2018; Huang et al., 2020c). Some researchers have studied the high-filled slope stability subjected to earthquake and rainfall (Chen et al., 2004; Hyodo et al., 2012; Collins, 2008; Miao et al., 2022a; Miao et al., 2022b). Marc-André et al. (2021), Carey et al. (2021) analyzed performance of the filled slope under the strong earthquake in the Wellington region in New Zealand, and the potential sliding range of the slope was identified. Yuan et al. (2020) established a surface infiltration model of multilevel filled slope using the finite element method (FEM), and the safety factor of the potential sliding surface was calculated using the LEM. The stability of the high slopes formed by landfills have been deeply studied (Zhang et al., 2019; Zhou et al., 2019), especially for the Kettleman Hills landfill in the United States. Seed et al. (1990), Stark and Poeppel. (1994), Chang. (2005) used two-dimensional and three-dimensional LEM to analyze this study area. In general, the FEM and the LEM are the most significant methods in slope stability calculation in current research. The LEM is the most commonly used method in practical engineering because its principle is very clear and the calculation is very simple. The FEM can not only obtain the safety coefficient in slope stability, but also understand the strain force and displacement and other effective information in each place. Its superiority is very obvious and its applicability is also very wide.
In summary, the deformation evolution laws and stability assessments of the high-filled slope in the CHBD project. In this paper, taking the F and G areas of the Hejia Alleviation Industrial Park in Shiyan City, Hubei Province as an example, a typical hill-filled slope was selected based on the project construction introduction and geological survey results. The backfilled body composed of the S-RM inside the slope was collected on site, and the S-RM samples with different RBPs were produced and applied in the large-scale direct shear test to figure out the mechanical properties of the backfilled body. The mechanical parameters obtained from on the test results were used in the numerical simulations of slope deformation and stability with FEM. The whole process of the step-by-step filling was simulated and deformation evolution analysis was also performed. The stability assessment of the high-filled slope was carried out using LEM and the potential sliding surfaces and the corresponding safety factors were obtained. Finally, the monitor data of the settlement and displacement of the slope were analyzed.
2 Geological backgrounds of the site
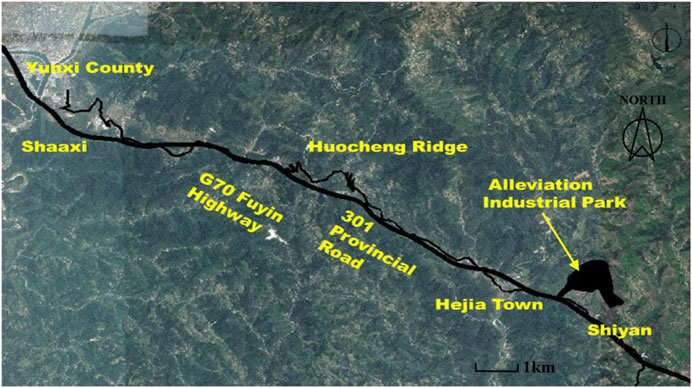
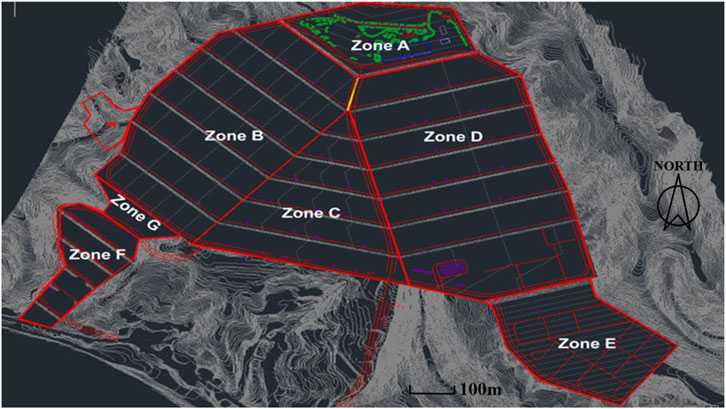
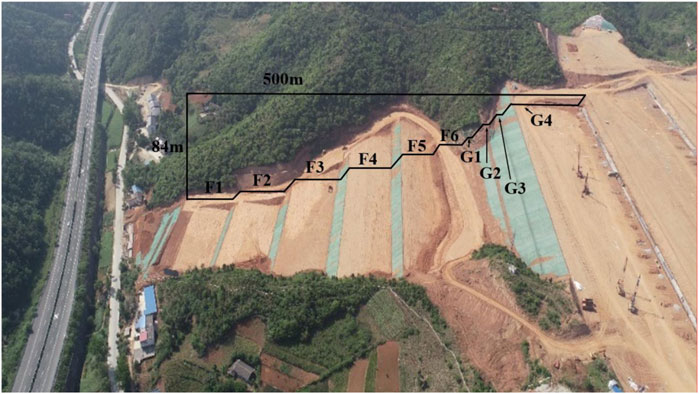
Hejia Alleviation Industrial Park in Shiyan City, Hubei Province, is located about 2 km east of Hejia Town Yunxi County, adjacent to G70 Fuyin Expressway and 301 Provincial Road (Figure 1). The proposed site of the park is a hilly valley terrain with a large topographic fluctuation and a maximum height difference of about 200 m. The park is planned to be about 1000 m long in east-west direction and 1500 m long in north-south direction, and the actual construction site is about 1300mu. The site is mainly covered with Quaternary residual soil, strongly weathered argillaceous siltstone, medium weathered argillaceous siltstone, strongly weathered glutenite, medium weathered glutenite, and so on. Each area forms an industrial terrace development pattern based on the topography of the site, and is divided into seven areas from A to G as shown in Figure 2. According to the construction design drawing, A area is located at the highest point of the whole park and can overlook the whole park site; B, C, and D areas are in the form of terraces with the width of each terrace being about 80–90 m, the height difference of adjacent terraces being about 7 m, and the lateral integrated slope of terraces being about 0.5%; E area is connected with D area, with the height difference of terraces being about 10 m and the integrated slope being about 3%; F area is located in the south of B area, connected with B area by high slopes, and the site is divided into six small terraces with height difference between adjacent terraces about 10 m. G area is a slope protection engineering area, connecting F and B areas as shown in 3.
In order to complete the industrial terracing development mode, the site leveling needs cutting hills and filling ditches to form the high-filled slopes with digging high and filling low. The total filling volume of F and G areas exceeds 850,000 m³, and the deepest filling depth exceeds 60 m. The downward grading construction method was used for the construction of the filling slopes with slope rate of 1:2 or 1:2.5 at each level and height of 8–12 m (Figure 3). Wo adjacent levels are added with 2–10 m wide platforms until they are placed to the original ground.
3 Model and parameters
3.1 Simulation model of the typical cutting hills and filling ditches project
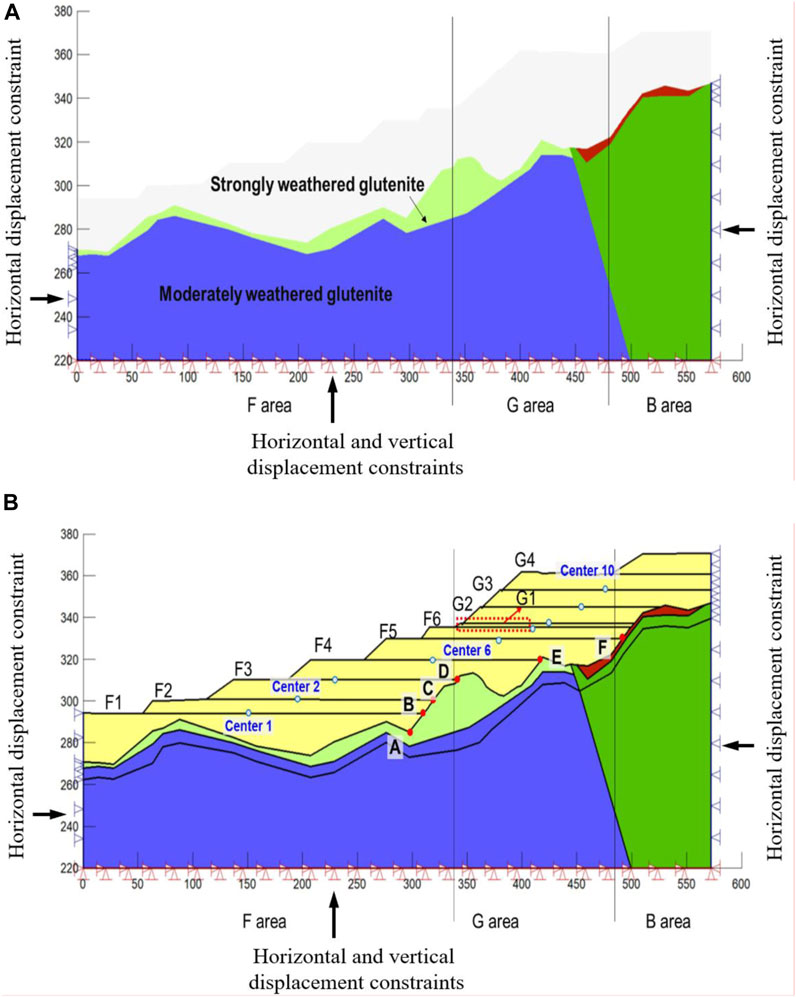
As the most representative high-filled slope of the whole park, the stability of the slope between F and G areas is focused on in this paper. In order to avoid the influence of the elevated fill above G area on the calculation results, the numerical model boundary has been extended to B area. According to the geological drilling information of the site, the original stratigraphic lithology of F, G, and B areas consists of strongly weathered and moderately weathered glutenite, and the original stratigraphic material zoning is drawn as shown in Figure 4A. According to the construction design process, the site levelling engineering were carried out by filling S-RM above F, G, and B areas. F area was filled in six layers from F-01–329.91 m, and then continued to fill in G area in four layers to 361.77 mm to form a high-filled slope, and finally entered B area. The main components of the S-RM used for filling are full-medium weathered argillaceous siltstone particles and debris, and the geotechnical properties of the backfill body are poorly uniform. The layer strong ramming was performed on the fill area to eliminate most of settlement of the backfill S-RM under self-weight. The typical high-filled slope model for the numerical simulation is shown in Figure 4B. The FEM is used to simulate the mechanical response of the slope during the layered filling process, and the safety factor of the slope during the layered filling process is obtained by using LEM. The surface of the slope is assigned as the free boundary for the mechanical analysis of excavation, whereas only vertical displacement is allowed on the left and right boundaries, and the bottom boundary is restrained from movements. In addition, there is only the ground stress field generated by the self-weight in the numerical model.
3.2 Mechanical characteristics of S-RM
As a typical multi-phase geotechnical material, S-RM is defined as the mixture of the coarse grains with different sizes and fine grain with loose structural characteristics (Xu et al., 2011; Bai et al., 2021b). The difference in the particle size and mechanical properties between the coarse and fine grains is the most typical feature of S-RM. Compared with the pure fine grain (soil) sample, the appearance of the coarse grains destroys the integrity of the material and the non-homogeneity of S-RM increases with the coarse grain content. Thus, the variation in the component content can lead to different structural characteristics and mechanical behaviors.
In order to study the mechanical properties of the backfill S-RM in the study area under different coarse grain conditions, several groups of large-scale direct shear tests were carried out. Before the test, the particle size threshold of the fine and coarse grain should be determined first for the preparation of the S-RM samples with different components. The particle grading distribution of the S-RM material collected from the study area shows that the fractal characteristics of the particle size presents the significant difference when the particle size is 5 mm. Combined with the test standard and the particle size thresholds in previous studies, the particle size threshold of the fine and coarse grain in this study is set as 5 mm. The particle larger than 5 mm in size is classified as the coarse grain (rock blocks) and the particle smaller than 5 mm in size is classified as the fine grain (soil matrix). Six groups of S-RM samples with 0% (pure soil), 20%, 40%, 60%, 80%, and 100% rock block proportions (RBPs) were designed. The normal stresses for each sample were set as 200, 400a, 600, and 800 kPa during the direct shear test, and the shear rate of the test is controlled as 2 mm/min.
Figure 5A shows the curves of shear stress versus shear displacement of S-RM samples with different RBPs under the normal stress of 400 kPa. The results show that the stress-displacement curves mainly present the strain softening feature, and the peak strength can be determined from the curves as the shear strength. The shear stress of each sample has already reached the peak strength when the shear displacement is less than 10 mm, and then decreases with the increase of the displacement. The peak strength shows a comparatively complicated variation law as RBP increases. With the increase of RBP from 0% to 40%, it can be observed that the peak strength of S-RM increases from 200 kPa to 233.2 kPa and the modulus of elasticity also shows a significant increase; when RBP increases from 40% to 80%, the peak strength of the specimen decreases and drops to 201.4 kPa at 80% RBP; and when RBP increases to 100%, the shear strength of the sample reaches the maximum of 247.6 kPa.
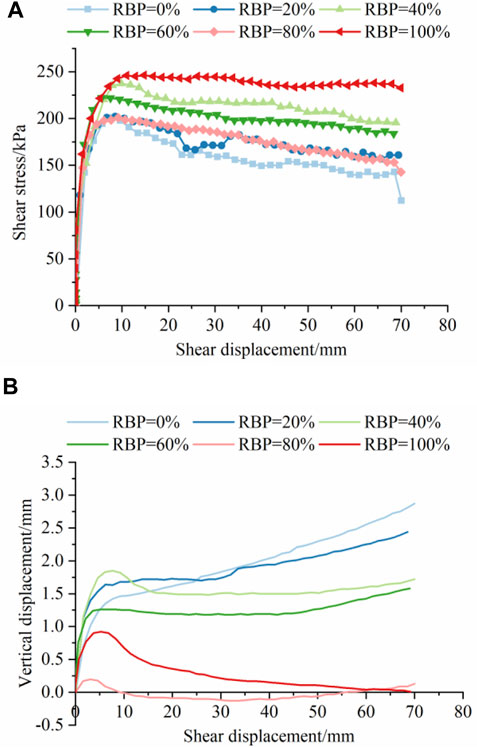
FIGURE 5. Curves of (A) shear stress; (B) vertical displacement with shear displacement of S-RM samples with various RBPs.
The variation laws of the vertical displacement with shear displacement of S-RM samples with various RBP under 400 kPa normal stress during the shear test are analyzed as shown in Figure 5B. The vertical displacement is positive when the direction of the vertical displacement is downward and negative when it is upward. When RBP is less than 20%, the vertical displacement of the sample shows a continuous increasing trend with the shear displacement; as the RBP increases, the vertical displacement remains unchanged after reaches the peak displacement, and the whole vertical displacement during the test is mainly positive, which means the displacement direction is still dominated by the vertical downward; after RBP is greater than 60%, the vertical displacement shows an increase and then a decrease trend. The shear dilatancy can be observed in the sample of 80% RBP when the shear displacement reaches 10 mm, of which the vertical displacement shows a negative value during the test. The normal force corresponding to the 400 kPa normal stress is about 98.8 kN. For the S-RM samples with the low and medium RBP, the normal stress makes the rock blocks inside more firmly embedded in the soil matrix, so the vertical displacement keeps increasing or stabilizes with the increase of the shear displacement. When RBP reaches 80%, the contact and rolling probability of the rock blocks near the shear zone of the sample increases significantly as the shear process proceeds, leading to the monitoring of the upward vertical displacement at the top of the sample. Under the RBP condition of 100%, although the contact and rolling effect between the rock blocks should be more obvious, the strength of the rock blocks in the study area is limited, and the large-size rock particles are more likely to be broken under the action of the rigid shear box. As a result, the direction of the vertical displacement during the shear process keeps downward. However, the vertical displacement decreases after the shear displacement is greater than 4.5 mm. The phenomenon demonstrates that the influence of the relative motion, contact, and rolling between the rock blocks inside the sample gradually begins to appear, offsetting the downward vertical displacement caused by the compression of the sample due to the normal stress.
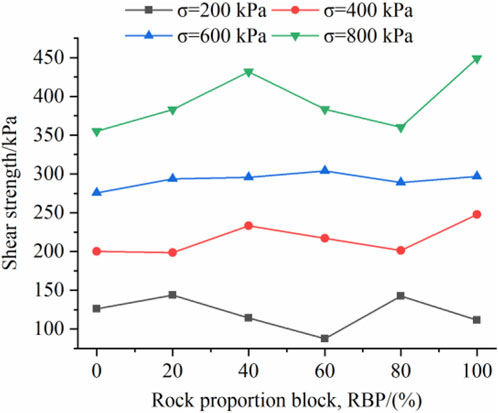
Figure 5 shows that under the same normal stress condition, the different strength and deformation characteristics are presented by the S-RM samples with various RBPs, which indicates the effect of RBP on the structural characteristics and mechanical properties of S-RM. At the same time, the complex influence of rock blocks on S-RM is connected to the normal stress. Figure 6 displays the shear strength of S-RM with various RBPs under different normal stress conditions. The results demonstrate that the shear strength of S-RM presents different degrees of fluctuation with the increase of RBP under different normal stress. Among them, the fluctuations of the shear strength under 400 kPa and 600 kPa normal stress conditions are comparatively slight, and the difference of the maximum and minimum shear strength are 49 and 287.4 kPa, which are less than 50 kPa, respectively. In contrast, the difference of the maximum and minimum shear strength of the S-RM under 800 kPa normal stress condition has reached 94.2 kPa, and the non-linear characteristics of the shear strength with RBP increases is more obvious. Taking the shear strength of the sample with RBP=0% (pure soil) as the standard value, and the relative incremental ratio of the shear strength of S-RM with various RBPs under different normal stresses are calculated. The results show that the disturbance of rock blocks on the soil matrix is much more obvious at the normal stress conditions of 200 kPa and 800 kPa, and the maximum relative incremental ratio is higher than 25%. When the normal stress is relatively low, the probability of the rock block crush is low, and it is easier for the rock block to be carried by the soil matrix and other rock blocks for the relative motion, leading to an obvious effect on the shear strength of the whole material. When the normal stress is relatively high, the rock block is prone to crush under the influence of the overburden pressure, resulting in the variation in the structure and particle grading distribution, and the change of RBP therefore has a more significant impact on the shear strength.
3.3 Material parameters of the deposit slope
The geological survey results show that in addition to the S-RM material in the backfill area, the main components inside the stratum include strongly and moderately weathered argillaceous siltstone and glutenite in this high-filled slope. In this study, the deformation and strength parameters of the geotechnical materials collected in the field were measured with the help of uniaxial compressive strength test and triaxial compression test. The specific experimental data obtained will be used as a reference for the mechanical material parameters of each stratum in the numerical model, as detailed in Table 1.
4 Deformation evolution law of the high-filled deposit slope during the The cutting hills to back ditches con-struction
4.1 Layer filling in F area
F area is filled in six stages from platform F1 to F6 as shown in Figure 4B, and the grading filling process is simulated using SIGMA model in Geostudio software. Figure 7 displays the displacement distribution contour of the high-filled deposit slope in the y-direction during the filling process step by step, and the incremental displacement in the y-direction at each filling step is analyzed, not the cumulative displacement. The displacement in the upward direction is positive and downward direction is negative. The results show that the slope incremental displacement during the filling process mainly occurs near the S-RM layer, and the direction points to the depth of the slope. The y-direction incremental displacement of the slope within the time-step is centered in the middle of the surface of the S-RM layer, and decreases outward layer by layer. It seems that the disturbance effect of the fill layer on the slope shows a certain effect range. As shown in Figure 7A, the y-direction incremental displacement mainly occurs at the left boundary of the model and the middle of the backfill layer, and the maximum incremental displacement is 0.0303 m. As the filling level increases, the settlement displacement caused by filling increases continuously, and the incremental displacement has reached 0.0405 m after the fifth filling stage as shown in Figure 7E, and the area of the blue area with the incremental displacement range of 0.028–0.032 m also reached the maximum in the grading filling process. The y-direction incremental displacement during the filling process is influenced by the mechanical properties of the backfill and overlying strata on the one hand, and connected to the weight of the filling layer itself on the other hand. Therefore, the incremental displacement in the y-direction is relatively small after the sixth filling stage (Figure 7F) due to the limited volume and weight of the filling layer F6 itself.
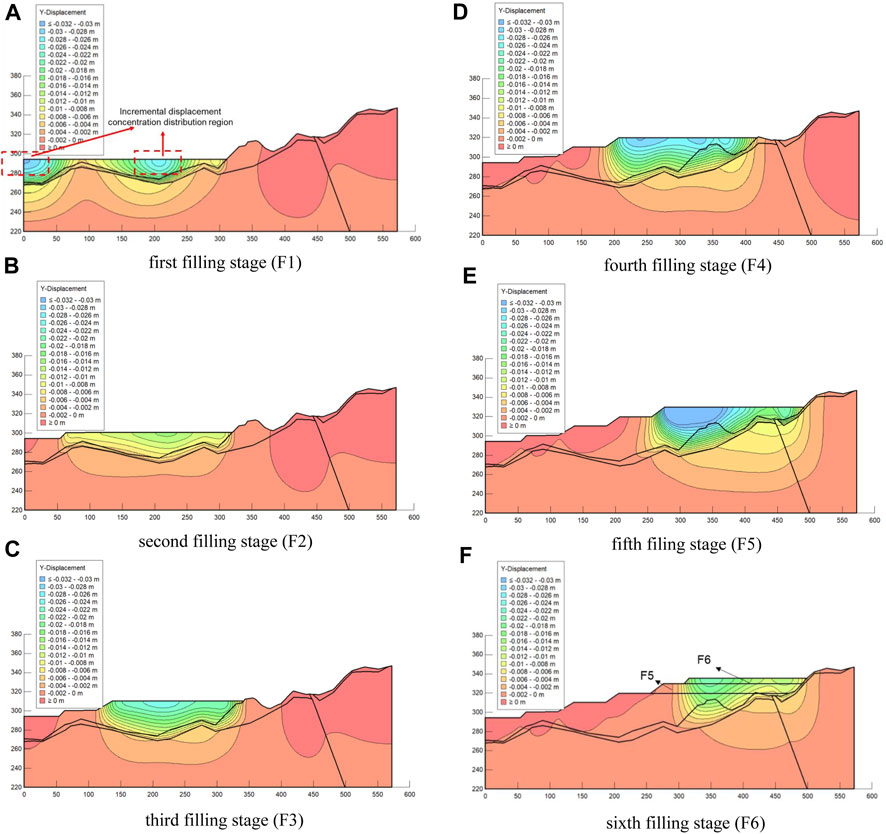
FIGURE 7. Incremental displacement distribution contour of the high-filled deposit slope in the y-direction during the F area filling process: (A) first filling stage (F1); (B) second filling stage (F2); (C) third filling stage (F3); (D) fourth filling stage (F4); (E) fifth filing stage (F5); (F) sixth filling stage (F6).
In order to analyze the variation law of the displacement of the deposit slope during the filling process quantitatively, the intersection points (points A-F) between the filling layers and the original stratum were chosen as the monitor points as shown in Figure 4B to record the incremental displacement in the y-direction, and the results are shown in Figure 8. The response of the incremental displacement of points A and B with the smaller elevations can be observed after the first filling subjected to the self-weight of the filling layer during the first stage of filling, with the incremental displacement at point A being −0.0068 m and that at point B being −0.0024 m. According to Figure 8, the influence of the filling layer on the deposit slope deformation during the step-by-step filling process has a certain spatial and temporal limitation range. Specially, the horizontal distance of the center of the filling layer relative to the monitor points A-D presents a decreasing and then increasing trend as the height of the filling layer increases, however, the corresponding incremental displacement shows a variation law of increasing and then decreasing; the incremental displacement reaches the maximum after the fifth filling stage, reaching 0.00933, 0.0192, 0.0247, 0.0306 m, respectively, and under the circumstances the horizonal distance of the of the center of the filling layer relative to the monitor points A-D is the minimum. Taking monitor point B as an example, the horizontal distance of point B relative to the center of F2 layer (point 2) is much larger than that from the center of F3-F5 layer, and the incremental displacement of monitor point B increases during the step-by-step filling under the effect of moment equilibrium. The incremental displacement in the y-direction of point B after the third, fourth, and fifth filling stage is 0.0155, 0.0174, and 0.0191 m, respectively, which is significantly higher compared with the 0.0085 m appears after the second filling stage; while the incremental displacement decreased to 0.0046 m after the filling of stage six with the increase of horizontal distance compared with that of stage five.
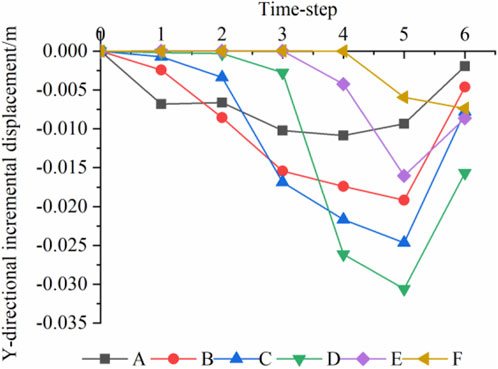
FIGURE 8. Y-directional incremental displacements of monitor points during the F area filling process.
Figure 9 shows the cumulative displacement contour in the y-direction of the high-filled slope after the filling process. Th result shows that the maximum deformation in the y-direction appears in the junction area between the backfill layer of platform F3, F4, and the strongly weathered glutenite strata, which is indicated in the red box area, and the maximum cumulative displacement exceeds 0.08 m. The phenomenon reveals that the large displacement is prone to occur due to the difference in the mechanical properties between the S-RM material and the origin strata. The incremental displacement of monitor point C and D as shown in Figure 8 presents a more obvious increase during the filling process, and the corresponding cumulative displacement in the y-direction have also been the largest, reaching −0.075 m.
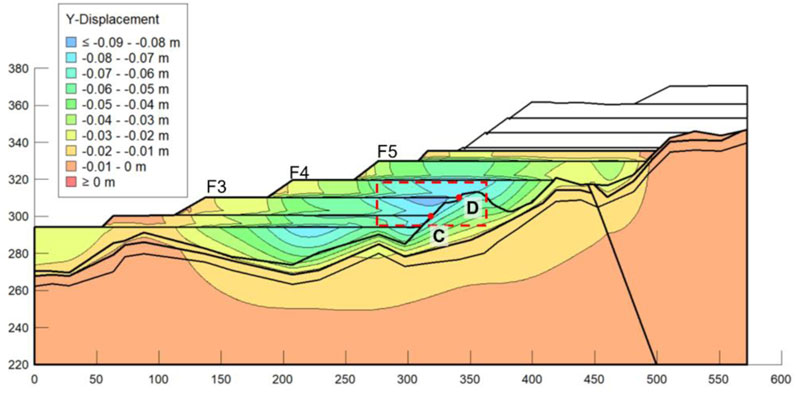
FIGURE 9. Cumulative displacement distribution contour of the high-filled deposit slope in the y-direction after the F area filling process.
4.2 Layer filling in G area
According to the construction plan, the G area is filled in four stages in layers after the filling process of F area is completed. Figure 10 displays the incremental displacement contour in the y-direction during the filling process in G area. The results show that the maximum incremental displacement in the y-direction mainly appears to the left of the top center of the filling layer, near the free face of the slope; response of the incremental displacement due to the filling process gradually decreases with the increase of the filling depth and horizontal distance taking the maximum incremental displacement as the center, which presents an obvious spatial influence range. The incremental displacement increases as the height of the filling layer increases: the maximum incremental displacement at the surface after the first filling is about 0.0064m, and the maximum incremental displacement at the surface after the fourth filling is 0.04 m.
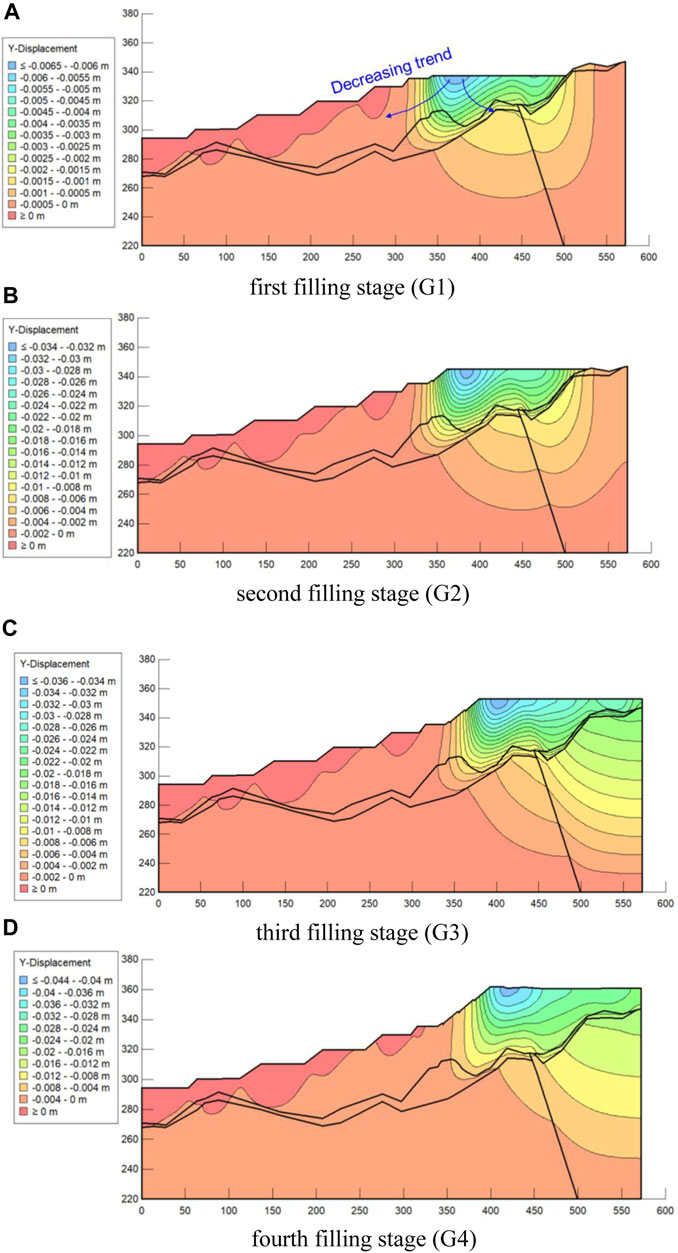
FIGURE 10. Incremental displacement distribution contour of the high-filled deposit slope in the y-direction during the G area filling process: (A) first filling stage (G1); (B) second filling stage (G2); (C) third filling stage (G3); (D) fourth filling stage (G4).
In order to analyze the response of the displacement in the y-direction of the slope during the filling process in G monitoring points 5-10 at the center of the bottom of the filling layer (as shown in Figure 4B) are set to record the change law of incremental y-directional displacement by time step during the filling process. Figure 11 shows the variation of the incremental displacement in the y-direction of monitor points 5-10 during the G1-G4 layered filling process. The results show that the displacement increment at monitoring point 5 is relatively stable during the grade-by-step filling process. Except for the incremental displacement of 0.0059 m after the second filling stage (platform G2), the incremental displacement of point 5 maintains basically at a range of 0.0015–0.0025 m during the filling process, which is significantly small compared with the displacement at other monitor points. As monitor point 5 is still within F area, it indicates that the filling process in G area has a less impact on the material in F area, which further illustrates the spatial limitation of the filling process on the slope deformation. Monitor points 6-10 show a significant increase in displacement after the second filling stage in G area, and the increase in displacement under this time step basically reaches about 0.02 m during the construction of the G2 platform; the incremental displacement of monitor points 6 and 7 decreases during the third and fourth filling stage (platform G3 and G4), for example, the incremental displacement of monitor point 6, after the second, third and fourth filling stage is 0.0253, 0.0240, 0.0185 m, respectively; on the contrary, monitor points 9 and 10 are subjected to the pressure applied by the overlying fill layers after the third and fourth levels of filling, so the incremental displacement in the y-direction continues to increase, for example, monitor point 9, the incremental displacements after second, third and fourth filling are 0.0238, 0.0283, and 0.0297 m, respectively.
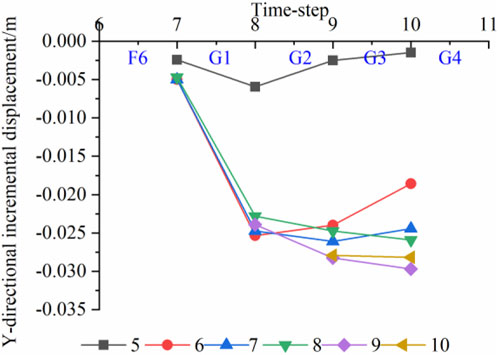
FIGURE 11. Y-directional incremental displacements of monitor points during the G area filling process.
Figure 12 shows the cumulative displacement in the y-direction contour during the filling process of G area step by step. The results show that the position of the area marked in blue with a comparatively large cumulative displacement keeps moving to the right with the filling of G area compared with Figure 9. At the end of the filling process, the blue area appears in the F4-G2 filling layers, which is about 0.11 m. It is mainly caused by the location of the filling layer in F area is basically above this area, and the self-weight of the backfill S-RM layer leads to the displacement in the y-direction. It is noted that the whole slope displacement contour is not smooth, which indicates that the phenomenon of uneven settlement is obvious. Therefore, it is recommended to monitor the high side slope settlement in real time in order to avoid the occurrence of uneven settlement leading to destabilization damage of the overlying buildings.
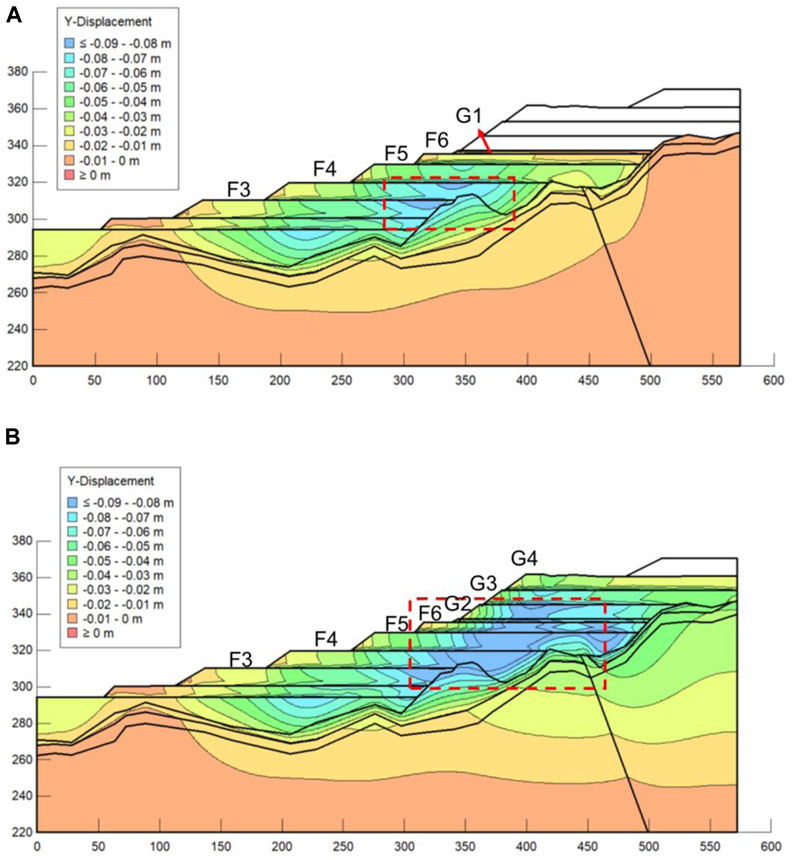
FIGURE 12. Cumulative displacement distribution contour of the high-filled deposit slope in the y-direction after the (A) G1; (B) G4 filling process.
5 Stability assessment of the high-filled deposit slope during the cutting hills to back ditches construction
The finite element limit equilibrium method is selected in this paper to analyze the stability of the high-filled slope during the CHBD construction. The stress distribution obtained from the results of SIGMA module using the finite element method is imported into SLOPE/W module. The potential sliding surfaces of the high-filled slope during the layer filling process are search with the help of Morgenstein-Price method, and the corresponding safety coefficients are calculated.
5.1 Layer filling in F area
Figure 13 shows the potential sliding surfaces of side slopes at different filling stages with the corresponding safety factors. The results indicate that the safety factor of the potential sliding surface increases and then decreases with the increase of the filling level, and the safety factor increases from 2.242 in the in-situ condition to 3.755 after the second filling stage. According to the evolution process of the potential sliding surface as shown in Figures 13A–C, the potential sliding surfaces after the first and second filling stage are mainly distributed in the middle of the slope, and the corresponding safety factor of which is mainly controlled by the strongly weathered glutenite. During the first two stages of filling, the increase in the height of the S-RM backfill layer reduces the dip angle of the potential slip surface, which leads to the increase in the corresponding safety factor. However, after the third filling stage, the location of the potential sliding surface moves to the surface of the S-RM layer, and the stability of the potential sliding surface is connected to the free face of the high-filled slope. The safety factor of the potential sliding surface decreases as the height of the filling layer increases.
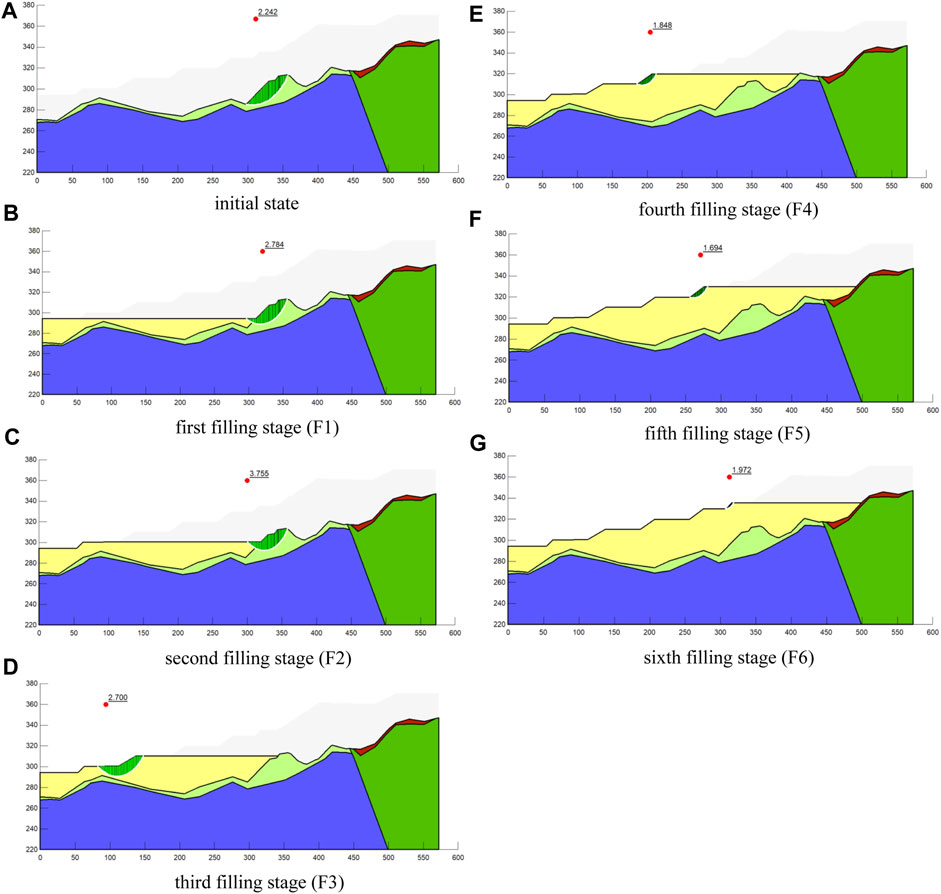
FIGURE 13. Potential sliding surfaces of the high-filled slope during the F area filling process: (A) initial state; (B) first filling stage (F1); (C) second filling stage (F2); (D) third filling stage (F3); (E) fourth filling stage (F4); (F) fifth filling stage (F5); (G) sixth filling stage (F6).
5.2 Layer filling in G area
Figure 14 presents the potential sliding surface of the high-filled deposit slope during the layer filling in G area and its corresponding safety factor. The results show that the safety factor of the potential sliding surface decreases from 1.971 to 1.188 continuously with the increase of the height of the filling layer. The locations of the potential sliding surface at different filling stage indicate that the area of the potential sliding surface increases gradually with the increase of the height of the filling layer. During the first and second filling stage in G area (Figures 14A,B), the potential sliding surface is mainly controlled by the free face of the slope, which is located within the corresponding filling layer; during the third and fourth filling stage, the number of the filling layer spanned by the potential sliding surface increases as its area increases. According to “Specifications for Design of Highway Subgrades,” under the normal conditions, the safety factor range for the highway and first-class highway in the stable state is 1.2–1.3, and the safety factor range for the second-class and under the second-class highway in the stable state is 1.15–1.25. Therefore, the stability of the high-filled deposit slope formed during the CHBD construction is still in the stable state. But the engineering protective measures should be applied in time and real-time monitoring of slope deformation should be carried out to avoid local slope surface cracking or landslide disasters considering the influence of subsequent rainfall and construction load.
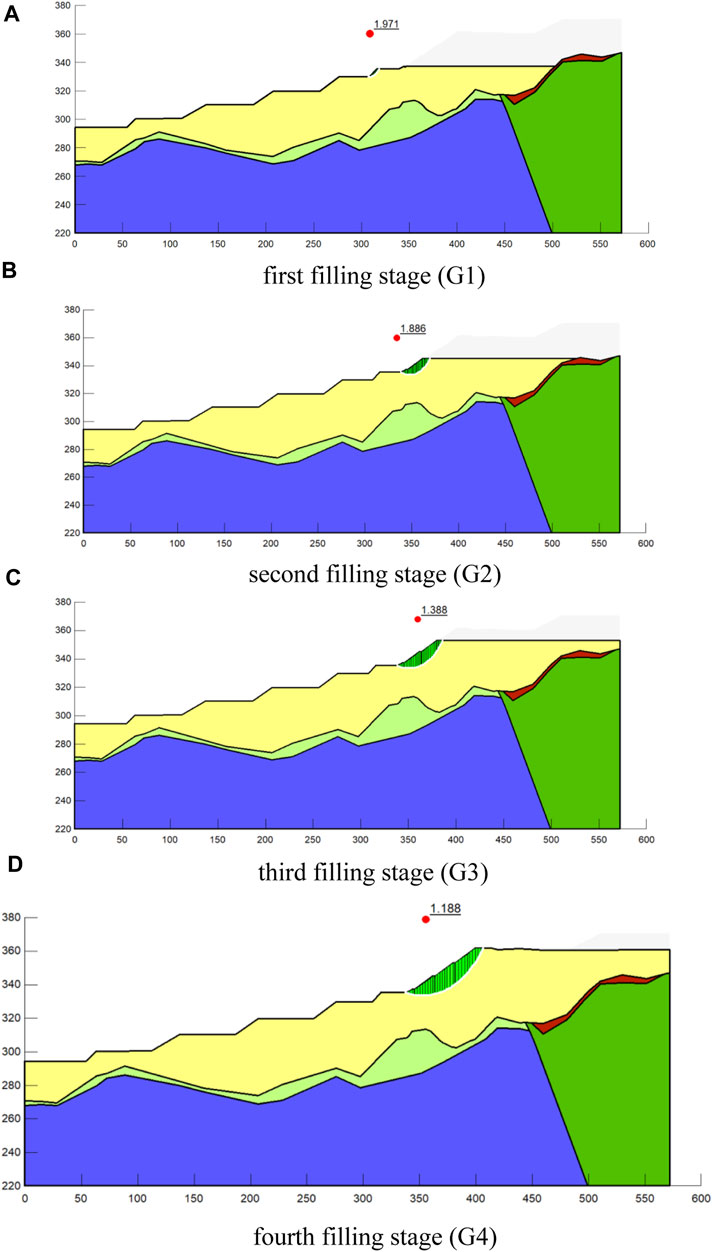
FIGURE 14. Potential sliding surfaces of the high-filled slope during the G area filling process: (A) first filling stage (G1); (B) second filling stage (G2); (C) third filling stage (G3); (D) fourth filling stage (G4).
6 Long-term stability assessment of the high-filled slope based on the monitor data
Although layered strong ramming has been applied to the S-RM material during the backfilling process to eliminate most of the settlement deformation, the long-term consolidation process will still occur. In order to monitor the long-term deformation of the high-filled slope, the physical characterization quantities of platform F4 such as stratified settlement and deep soil deformation are selected and a remote automated monitoring system is built with the help of stratified displacement meter and fixed inclinometer to collect the deformation data of the slope in real time in this paper. It is worth mentioning that the displacement monitoring results in this paper aim at the long-term deformation of the high-filled slope, which is different from the slope deformation during the filling process.
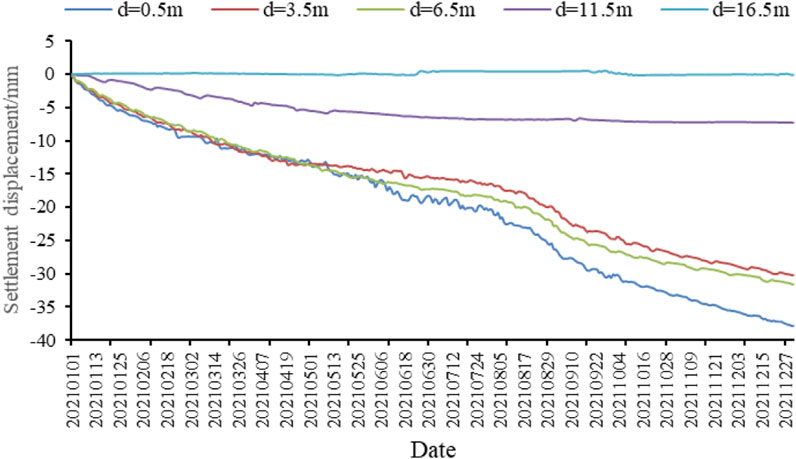
A total of five single-point settlement gauges were placed in the layered settlement holes, which were located at depths of 0.5m, 3.5, 6.5, 11.5, and 16.5 m from the ground surface. The variation curve of layered settlement data is shown in Figure 15, and the monitor period is from 1 January 2021 to 29 December 2021. The monitor data shows that the settlement displacement decreases as the depth increase; the cumulative settlement displacement at 0.5, 3.5, 6.5, 11.5, and 16.5 m depth is 37.624, 30.164, 31.333, 7.175, and 0.056 mm, respectively. The difference between the settlement displacement at the depth of 6.54 and 11.5 m is large, which indicates that the settlement due to filling mainly occurs within 7–10 m from the ground surface. From the settlement curves with date at the depth of 0.5, 3.5, and 6.5 m, the slope of the curve becomes larger from 1 August 2021. The main reason is that the frequent rainfall at the study area during this period, and the meteorological data show that the cumulative rainfall amount reached 632.40 mm, the average daily rainfall of 10.36 mm. The continuous and persistent strong rainfall increases the consolidation and settlement of S-RM, resulting in a further increase in the settlement rate.
A total of seven fixed inclinometers were placed in the inclined holes, which were located at depths of 3, 6, 9, 12, 15, 18 and 21 m from the surface. Figure 16 displays the monitor data of the fixed inclinometers from 1 January 2021 to 29 December 2021.The results show that the incremental displacement decrease as the depth increases both in the vertical and horizontal directions. The maximum cumulative deformations in the vertical and horizontal directions are 40.76 and 39.36 mm, respectively. The maximum displacement appears at the depth of 3 m, and the variation of displacement is basically slight below 15 m in depth. The difference in the displacement between the 9 and 12 m is obvious, which means the horizontal displacement mainly occurs within 12 m. Combined with the settlement monitor data, it can be concluded that the slope deformation mainly occurs within 10 m from the ground surface.
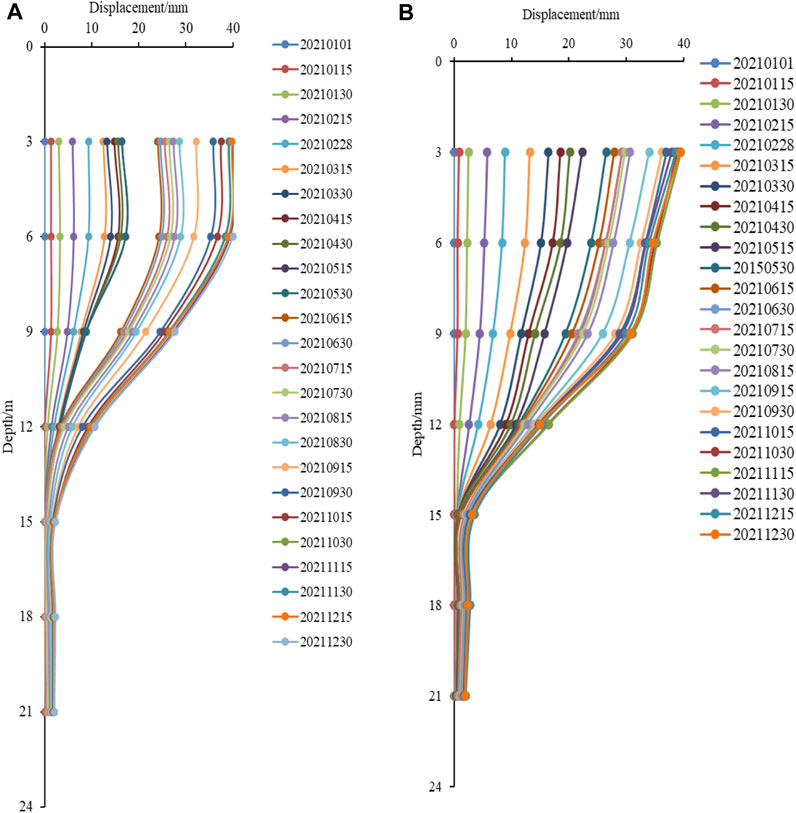
FIGURE 16. (A) X-directional; (B) Y-directional displacement variation curve of F4 fixed inclination measurement.
7 Conclusion
In this study, the high-filled deposit slope in F and G area in Hejia poverty alleviation industrial park in Shiyan City, Hubei Province is chosen as the example. Several groups of the large-scale direct shear tests were performed to determine the mechanical parameters of the backfilled S-RM. Based on the test results, the deformation evolution law of the high-filled deposit slope was analyzed using FEM and LEM, and its stability was also assessed. Finally, the stability of the high-filled slope for long-term operation was briefly discussed based on the measured monitoring data. The main conclusions are obtained as follows.
(1) During the filling process in F area, the incremental displacement in the y-direction presents a decrease trend sequentially from the center of the filling layer surface outward in each time-step, which indicates that the influence of the filling layer on the slope stability has a certain spatial and temporal limitation range. The maximum deformation in the y-direction inside the slope appears near the boundary between the S-RM filling layer and the strongly weathered glutenite strata below the F5 platform, and the maximum cumulative displacement is greater than 0.08 m. The safety factor of the potential sliding surface during the filling process shows an increasing and then decreasing trend, and the safety factor of the potential sliding surface after the sixth filling is 2.531.
(2) During the filling process in G area, the maximum incremental settlement displacement of each filling layer appears near the surface of the filling layer. With the location of the maximum incremental settlement displacement as the center, the displacement response value gradually decreases with the increase of filling depth and horizontal distance, showing an obvious spatial influence range. With the increase of the height of the filling layer, the displacement response in the step-by-step filling process also increases. The maximum settlement displacement appears in the filling layer below the G2 and G3 platforms, which is about 0.11 m. As the height of the filling layer increases, the safety factor of the potential sliding surface decreases from 1.978 to 1.188, and the high-filled slope formed in the filling process in G area is in a stable state.
(3) The monitoring target is the deformation of the high-filled slope under long-term operation conditions. The monitor results of F4 platform show that settlement decreases with increase of depth, and the difference of settlement between 6.5 and 11.5 m depth reaches 24 mm. The displacement in both vertical and horizontal directions tends to decrease with increase of depth, and displacement variation in the area below 15 m depth is not obvious. The settlement and slope monitoring results indicate that the slope deformation mainly occurs within 10 m from the slope surface, and the obvious uneven settlement appears in the whole slope during the filling process. Therefore, it is recommended to monitor the settlement at different locations of the high-filled slope in real time to avoid the occurrence of uneven settlement that can lead to destabilization damage of the overlying buildings.
Data availability statement
The raw data supporting the conclusion of this article will be made available by the authors, without undue reservation.
Author contributions
Conceptualization, XF and ZZ; Data curation, JH and WY; Formal analysis, JH, WY, and ZZ; Funding acquisition, XF and QS; Methodology, SC and QS; Supervision, WY, XF, and SC; Validation, JH and YZ; Writing—original draft, JH and YC; Writing—review and editing, ZZ.
Funding
This research was funded by the Youth Innovation Promotion Association CAS (No.2021325), the National Natural Science Foundation of China (No. 52179117), the Key Laboratory of Roads and Railway Safety Control (Shijiazhuang Tiedao University).
Acknowledgments
The Ministry of Education (STDTKF202103), and for which the authors are very thankful.
Conflict of interest
The authors declare that the research was conducted in the absence of any commercial or financial relationships that could be construed as a potential conflict of interest.
Publisher’s note
All claims expressed in this article are solely those of the authors and do not necessarily represent those of their affiliated organizations, or those of the publisher, the editors and the reviewers. Any product that may be evaluated in this article, or claim that may be made by its manufacturer, is not guaranteed or endorsed by the publisher.
References
Bai, B., Nie, Q. K., Zhang, Y. K., Wang, X. L., and Hu, W. (2021a). Cotransport of heavy metals and SiO2 particles at different temperatures by seepage. J. Hydrology 597, 125771. doi:10.1016/j.jhydrol.2020.125771
Bai, B., Yang, G. C., Tao, L., and Yang, G. S. (2019). A thermodynamic constitutive model with temperature effect based on particle rearrangement for geomaterials. Mech. Mater. 139, 103180. doi:10.1016/j.mechmat.2019.103180
Bai, B., Zhou, R., Cai, G. Q., Hu, W., and Yang, G. C. (2021b). Coupled thermo-hydro-mechanical mechanism in view of the soil particle rearrangement of granular thermodynamics. Comput. Geotechnics 137, 104272. doi:10.1016/j.compgeo.2021.104272
Carey, J. M., Cosgrove, B., Norton, K., Massey, C. I., Petley, D. N., and Lyndsell, B. (2021). Debris flow-slide initiation mechanisms in fill slopes, Wellington, New Zealand. Landslides 18, 2061–2072. doi:10.1007/s10346-021-01624-6
Chang, M. (2005). Three-dimensional stability analysis of the Kettleman Hills landfill slope failure based on observed sliding-block mechanism. Comput. Geotechnic 32, 587–599, doi:10.1016/j.compgeo.2005.11.002
Chang, Z., Du, Z., Zhang, F., Huang, F., Chen, J., Li, W., et al. (2020). Landslide susceptibility prediction based on remote sensing images and GIS: Comparisons of supervised and unsupervised machine learning models. Remote Sens. 12, 502. doi:10.3390/rs12030502
Chang, Z. L., Catani, F., Huang, F. M., Liu, G. Z., Meena, S. R., Huang, J. S., et al. (2022). Landslide susceptibility prediction using slope unit-based machine learning models considering the heterogeneity of conditioning factors. J. Rock Mech. Geotechnical Eng. doi:10.1016/j.jrmge.2022.07.009
Chen, H., Lee, C. F., and Law, K. T. (2004). Causative mechanisms of rainfall-induced fill slope failures. J. Geotechnical Geoenvironmental Eng. 130, 593–602. doi:10.1061/(asce)1090-0241(2004)130:6(593)
Collins, T. K. (2008). Debris flows caused by failure of fill slopes: Early detection, warning, and loss prevention. Landslides 5, 107–120. doi:10.1007/s10346-007-0107-y
Du, W. J., Sheng, Q., Fu, X. D., Chen, J., and Zhou, Y. Q. (2022). A TPDP-MPM-based approach to understanding the evolution mechanism of landslide-induced disaster chain. J. Rock Mech. Geotechnical Eng. 14, 1200–1209. doi:10.1016/j.jrmge.2022.03.004
Fu, X. D., Ding, H. F., Sheng, Q., Zhang, Z. P., Yin, D. W., and Chen, F. (2022). Fractal analysis of particle distribution and scale effect in a soil-rock mixture. Fractal Fract. 6, 120. doi:10.3390/fractalfract6020120
Gao, Y., Yin, Y., Li, B., Wang, W., Zhang, N., Yang, C., et al. (2016). Investigation and dynamic analysis of the long runout catastrophic landslide at the Shenzhen landfill on December 20, 2015, in Guangdong, China. Environ. Earth Sci. 76, 13. doi:10.1007/s12665-016-6332-8
Huang, F. M., Cao, Z. S., Guo, J. F., Jiang, S. H., and Guo, Z. Z. (2020b). Comparisons of heuristic, general statistical and machine learning models for landslide susceptibility prediction and mapping. CATENA 191, 104580. doi:10.1016/j.catena.2020.104580
Huang, F. M., Cao, Z. S., Jiang, S. H., Zhou, C. B., and Guo, Z. Z. (2020c). Landslide susceptibility prediction based on a semi-supervised multiple-layer perceptron model. Landslides 17, 2919–2930. doi:10.1007/s10346-020-01473-9
Huang, F. M., Zhang, J. Z., Zhou, C. B., Wang, Y. H., Huang, J. S., and Zhu, L. (2020a). A deep learning algorithm using a fully connected sparse autoencoder neural network for landslide susceptibility prediction. Landslides 17, 217–229. doi:10.1007/s10346-019-01274-9
Hyodo, M., Orense, R. P., Noda, S., Furukawa, S., and Furui, T. (2012). Slope failures in residential land on valley fills in Yamamoto town. Soils Found. 52, 975–986. doi:10.1016/j.sandf.2012.11.015
Jiang, S. H., Huang, J., Huang, F. M., Yang, J. H., Yao, C., and Zhou, C. B. (2018). Modelling of spatial variability of soil undrained shear strength by conditional random fields for slope reliability analysis. Appl. Math. Model. 63, 374–389. doi:10.1016/j.apm.2018.06.030
Liu, Y., and Li, Y. (2014). China's land creation project stands firm. Nature 511, 410. doi:10.1038/511410c
Marc-André, B., Chris, M., Jon, C., Richard, K., lizabeth, B., Fraser, M., et al. (2021). Geomechanical characterisation and dynamic numerical modelling of two anthropogenic fill slopes. Eng. Geol. 281, 105980. doi:10.1016/j.enggeo.2020.105980
Miao, F. S., Wu, Y. P., Torok, A., Li, L. W., and Xue, Y. (2022b). Centrifugal model test on a riverine landslide in the Three Gorges Reservoir induced by rainfall and water level fluctuation. Geosci. Front. 13, 101378. doi:10.1016/j.gsf.2022.101378
Miao, F. S., Wu, Y. P., Xie, Y. H., and Li, Y. N. (2018). Prediction of landslide displacement with step-like behavior based on multialgorithm optimization and a support vector regression model. Landslides 15, 475–488. doi:10.1007/s10346-017-0883-y
Miao, F. S., Zhao, F. C., Wu, Y. P., Li, L. W., Xue, Y., and Meng, J. J. (2022a). A novel seepage device and ring-shear test on slip zone soils of landslide in the Three Gorges Reservoir area. Eng. Geol. 307, 106779. doi:10.1016/j.enggeo.2022.106779
Miao, F. S., Zhao, F. C., Wu, Y. P., Li, L. W., Xue, Y., and Tӧrӧk, Á. (2023). Landslide susceptibility mapping in Three Gorges Reservoir area based on GIS and boosting decision tree model. Stoch. Environ. Res. Risk Assess. doi:10.1007/s00477-023-02394-4
Qian, X., Koerner, R. M., and Gray, D. H. (2003). Translational failure analysis of landfills. J. Geotechnical Geoenvironmental Eng. 129, 506–519. doi:10.1061/(asce)1090-0241(2003)129:6(506)
Seed, R. B., Mitchell, J. K., and Seed, H. B. (1990). Kettleman hills waste landfill slope failure. II: Stability analyses. J. geotechnical engineering-ASCE 116, 669–690. doi:10.1061/(asce)0733-9410(1990)116:4(669)
Stark, T. D., and Poeppel, A. R. (1994). Landfill liner interface strengths from torsional-ring-shear tests. J. Geotechnical Engineering-ASCE 120, 597–615. doi:10.1061/(asce)0733-9410(1994)120:3(597)
Wang, H. H., Tuo, X. G., Zhang, G. Y., and Peng, F. L. (2013). Panzhihua airport landslide (Oct. 3rd 2009) and an emergency monitoring and warning system based on the internet of things. J. Mt. Sci. 10, 873–884. doi:10.1007/s11629-013-2368-3
Wang, J., Xu, Y., Ma, Y., Qiao, S., and Feng, K. (2018). Study on the deformation and failure modes of filling slope in loess filling engineering: A case study at a loess mountain airport. Landslides 15, 2423–2435. doi:10.1007/s10346-018-1046-5
Xu, W. J., Xu, Q., and Hu, R. L. (2011). Study on the shear strength of soil–rock mixture by large scale direct shear test. Int. J. Rock Mech. Min. Sci. 48, 1235–1247. doi:10.1016/j.ijrmms.2011.09.018
Yang, X., Zhu, Y., Zhou, Y., Yang, X., and Shi, Z. (2016). Time-space monitoring and stability analysis of high fill slope slip process at a airport in mountain region. Chin. J. Rock Mech. Eng. 35, 3977–3990.
Yin, Y., Li, B., Wang, W., Zhan, L., Xue, Q., Gao, Y., et al. (2016). Mechanism of the December 2015 catastrophic landslide at the Shenzhen landfill and controlling geotechnical risks of urbanization. Engineering 2, 230–249. doi:10.1016/j.eng.2016.02.005
Yuan, B., Cai, Z., Lu, M., Lv, J., Su, Z., and Zhao, Z. (2020). Seepage analysis on the surface layer of multistage filled slope with rainfall infiltration. Adv. Civ. Eng. 2020, 1–13. doi:10.1155/2020/8879295
Zhang, S., Zhang, X., Pei, X., Wang, S., Huang, R., Xu, Q., et al. (2019). Model test study on the hydrological mechanisms and early warning thresholds for loess fill slope failure induced by rainfall. Eng. Geol. 258, 105135. doi:10.1016/j.enggeo.2019.05.012
Zhang, Z. P., Sheng, Q., Song, D. F., Fu, X. D., Zhou, Y. Q., and Huang, J. H. (2023). Stability evaluation of the high fill deposit slope subjected to rainfall considering water deterioration. Bull. Eng. Geol. Environ. 82, 68. doi:10.1007/s10064-023-03083-w
Zhou, Y. G., Meng, D., Ma, Q., Huang, B., Ling, D. S., and Chen, Y. M. (2019). Centrifuge modeling of dynamic response of high fill slope by using generalized scaling law. Eng. Geol. 260, 105213. doi:10.1016/j.enggeo.2019.105213
Keywords: cutting hills to backfill ditches, high-filled slope, soil-rock mixture, deformation, stability, monitor
Citation: Hu J, Yuan W, Fu X, Zhang Z, Zhou Y, Chai S, Cheng Y and Sheng Q (2023) The deformation evolution law and stability evaluation of the high-filled slope in the cutting hills to backfill ditches project. Front. Earth Sci. 11:1158216. doi: 10.3389/feart.2023.1158216
Received: 03 February 2023; Accepted: 27 February 2023;
Published: 08 March 2023.
Edited by:
Faming Huang, Nanchang University, ChinaReviewed by:
Xiao Wang, Southeast University, ChinaFasheng Miao, China University of Geosciences Wuhan, China
Lv Longlong, Ningxia University, China
Copyright © 2023 Hu, Yuan, Fu, Zhang, Zhou, Chai, Cheng and Sheng. This is an open-access article distributed under the terms of the Creative Commons Attribution License (CC BY). The use, distribution or reproduction in other forums is permitted, provided the original author(s) and the copyright owner(s) are credited and that the original publication in this journal is cited, in accordance with accepted academic practice. No use, distribution or reproduction is permitted which does not comply with these terms.
*Correspondence: Xiaodong Fu, eGRmdUB3aHJzbS5hYy5jbg==
 Jun Hu
 Wei Yuan
 Xiaodong Fu
 Zhenping Zhang
 Yongqiang Zhou
 Shaobo Chai
 Yongliang Cheng2,3
 Qian Sheng