 Yufeng Xiao1
 Xinmin Ge
 Chengrong Wang
 Chujuan Kang
- 1PetroChina Research Institute of Petroleum Exploration & Development, Beijing, China
- 2School of Geosciences, China University of Petroleum, Qingdao, China
- 3Laboratory for Marine Mineral Resources, Qingdao National Laboratory for Marine Science and Technology, Qingdao, China
- 4Tuha Division, China Petroleum Logging Co., Ltd., Hami, China
The nuclear magnetic resonance (NMR) response is known to deviate from the true value for the volcanic reservoirs, particularly when the pore throat size is ultralow. Consequently, the related petrophysical parameters such as porosity, permeability, and pore size distribution from NMR measurements are greatly influenced. An empirical method to correct the NMR calibrated porosity for the tight volcanic rocks is proposed after comprehensive investigations of influential factors combined with mineralogical and petrophysical analyses. The laboratory result indicates that the relative porosity deviation is negatively correlated with the geometric mean of the transversal relaxation time (T2) but positively correlated with the clay content. Moreover, both the paramagnetic materials, such as the manganese (Mn) content, and the diamagnetic materials, such as the magnesium (Mg) content, contribute to the NMR relaxation intensity reduction but with different mechanisms. The NMR calibrated porosity can be compensated through multiple regressions with these controlling factors, which can be generalized to other tight volcanic reservoirs.
1 Introduction
The low-field nuclear magnetic resonance (NMR) technique has been widely used in geological studies to characterize pore size distribution fluid transportation and rock mechanical properties in recent decades, owning to its ‘only fluid-related’ superiority (Coates et al., 1999; Dunn et al., 2002; Rezaee et al., 2012; Bauer et al., 2015; Tan et al., 2015; Xiao et al., 2015; Xu et al., 2018; Li et al., 2019). However, most models are valid for sedimentary rocks such as clean sandstone or carbonate with relatively large pore sizes and porosity. In the tight volcanic reservoir, the measured relaxation signals and the derived parameters are inadequate to characterize the porosity and the pore size distribution precisely due to the small pore size and the presence of paramagnetic substances (Kleinberg et al., 2003; Djafarov et al., 2004; Chen et al., 2011; Daigle and Dugan, 2011; Xie et al., 2013; Abouzaid et al., 2016; Fleury and Romero-Sarmiento, 2016; Mehana and El-monier 2016; Osterman et al., 2016; Testamanti and Rezaee, 2019; Yuan Rezaee, 2019).
Abundant studies have been conducted to investigate influential factors on the relaxation mechanism and NMR response of the volcanic reservoirs, attempting a better characterization of petrophysical properties (Anand and Hirasaki, 2008; Kock et al., 2018; Holthausen and Raupach, 2019; Sun et al., 2019; Tan et al., 2019). It is generally accepted that the amount of paramagnetic substance of high magnetic susceptibility is positively correlated with the transversal surface relaxivity, whereas negatively correlated with the relaxation intensity (Li et al., 2014). The internal gradient strength and the spin relaxation are greatly enhanced by the paramagnetic substance, resulting in the spectrum shift of transversal relaxation time (T2) obviously. However, a recent study revealed that there are no clear correlations between the magnetic susceptibility and the mass of paramagnetic substance (Tan et al., 2019). There are no uniform regulations to account for all influential factors due to distinctions of the geological structure and sedimentary environment, mineralogical constitution, and element composition. Moreover, some theoretical equations are physically feasible but require too much data to remove the diffusion term (Liao et al., 2009; Chen et al., 2011; Xie et al., 2013). Furthermore, some experiment-based methods can be easily implemented but may not be suitable to other regions due to large NMR porosity errors (Sun et al., 2011; Zhou et al., 2011; Li et al., 2014).
It is particularly difficult to eliminate the influences on the T2 spectrum of volcanic rocks, but it is practical to recover the relaxation intensity and the NMR calibrated porosity through experiments and empirical equations. This paper presents a case study to correct the NMR calibrated porosity of a tight volcanic reservoir based on the laboratory observations incorporating mineralogical and petrophysical measurements. The main aim of this work is to get a comprehensive knowledge on the influencing factors and main controlling factors of NMR relaxation intensity, and to put forward an empirical model to compensate the NMR porosity deviation of the tight volcanic rocks. The remainder of the paper is organized as follows. In section 2, we introduce the geological background and the experimental details of the target area. Mineralogical and petrophysical properties, as well as their influences on porosity deviation, are discussed in section 3. Furthermore, the empirical porosity correction method is also presented in this section. The conclusion and discussion part is shown in section 4.
2 Materials and methods
2.1 Geological settings
Malang–Tiaohu Sag is a typical tight reservoir located in the Santanghu Basin, northeastern Xinjiang autonomous region of China. It is a small intermountain basin sandwiched between the Dahafutike–Suhaitu and Moqin Ural Mountains, covering a total area of 2.3 × 10⁴ km2 (Ge et al., 2015). The major oil beds in this region come from the Karagang Formation and the Hargau Formation of the Upper Carboniferous series. As shown in Figure 1 (Yu, 2013), the lithology can be divided into volcanic lavas consisting basalt, basaltic andesite and andesite, and pyroclastic rocks including tuff, shale, and volcanic breccia. Figure 2 shows thin sections and scanning electron microscope (SEM) images of typical rock samples from the research area. It is observed that they are very tight, and only a small number of pores are visible.
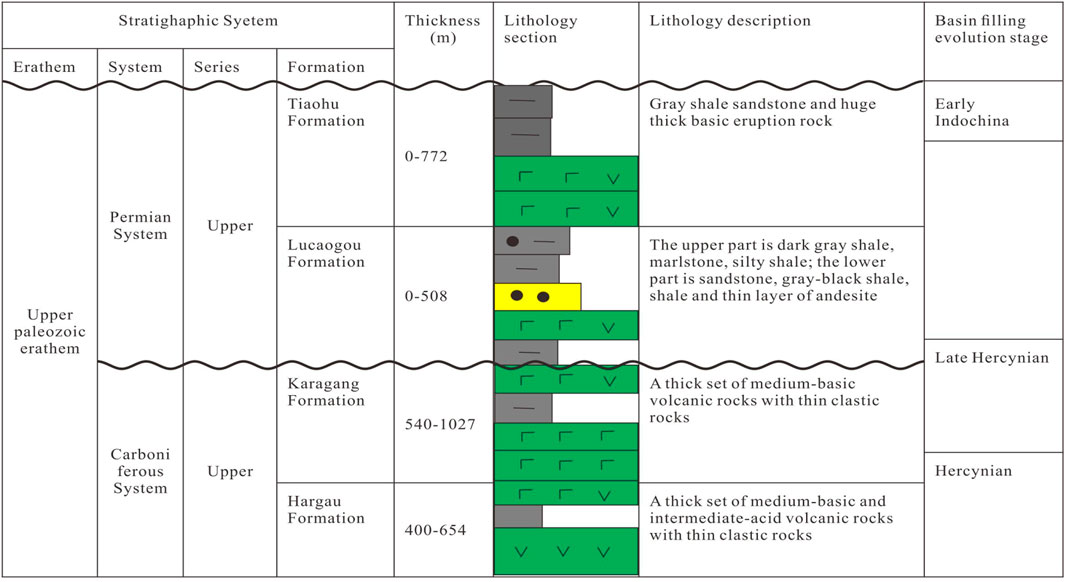
FIGURE 1. Comprehensive stratigraphic column of the Santanghu Basin.
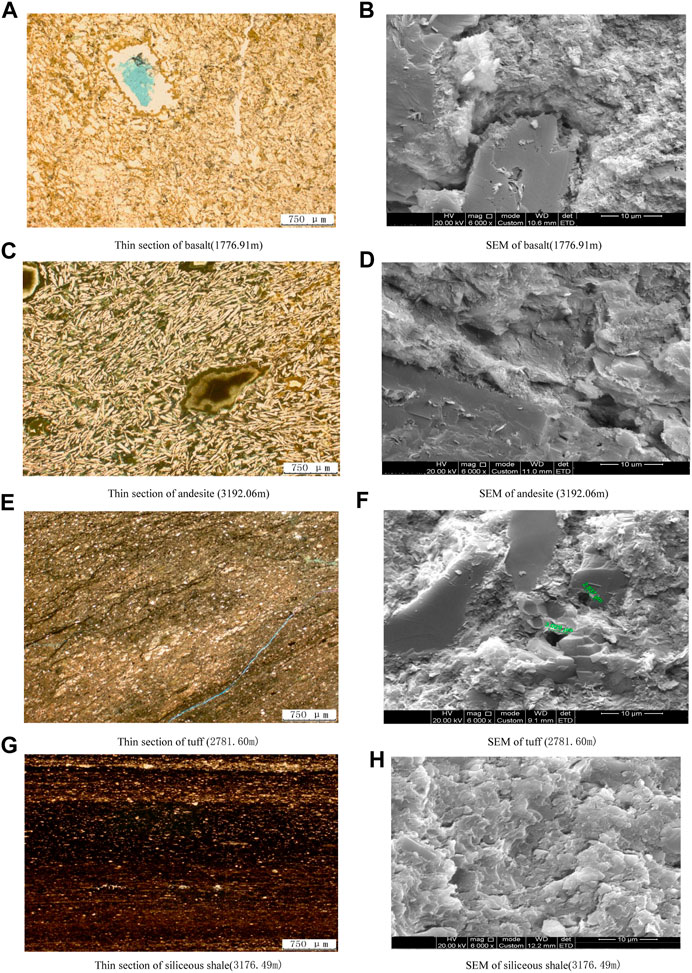
FIGURE 2. Typical thin sections and SEM images of volcanic rock samples (A–H) from the research area (these samples were collcted at the depths indicated in the subcaptions).
2.2 Experimental details
To investigate influencing factors on the NMR response, the X-ray diffraction (XRD) analysis is performed for crushed samples to collect the quantitative mineralogical information using Bruker D8 advanced XRD equipment, under the standard of ‘clay minerals in sedimentary rocks and common method X-ray diffraction analysis of clay minerals’ (Wu et al., 2015). In addition, the elemental analysis and the oxide content analysis are conducted using the Xios X-ray fluorescence (XRF) machine, produced by PANalytical B.V. Therefore, the element contents such as silicon (Si), aluminum (Al), iron (Fe), manganese (Mn), calcium (Ca), sodium (Na), magnesium (Mg), and potassium (K) can be obtained. We use the helium-filled and the brine-saturated methods to obtain the porosity before the NMR measurement. The low-field NMR measurements are carried out by the 2-MHz NMR benchtop prototype system ‘MARAN DRX2’, under the standard of ‘specification for laboratory measurement of magnetic resonance parameters for rock samples’ (Li et al., 2018; Ren et al., 2019). The waiting time (TW), echo spacing (TE), and the number of echoes (NECH) are 6000 ms, 0.2 ms, and 4096, respectively. The receiving gain and the number of scans (NS) are 0.8 and 512, respectively. The recorded echo trains are inverted to the T2 spectra by the Butler–Reeds–Dawson (BRD) algorithm. According to the petrophysical theory, NMR basically detects the signals of the hydrogen nucleus of the fluids saturating the rock pores. Consequently, the NMR signal can be calibrated to the porosity when the rock is occupied with a single fluid (Elsayed et al., 2022). To obtain the porosity of the core samples, we first measured the NMR signals of standard samples with the given porosity and bulk volume to establish the relationship between the porosity and the normalized NMR signal. Therefore, we can predict the NMR porosity of the measured samples using this relationship under the same acquisition parameters.
The helium-filled porosity, brine-saturated porosity, and NMR measurements are performed for 51 plug samples simultaneously. The helium-filled porosity is measured using the AP-608 automated permeameter–porosimeter. The physical fundamental of this method is the Boyle–Marriote Gas Law. It is carried out at the room temperature. Details on the experimental flowchart and data manipulation methods are elaborated in the literature (Tiab and Donaldson, 2011). In addition, the brine-saturated porosity is calculated by the ratio of the pore volume and the total rock volume. It also called as the imbibition method. We first measured the weight of the dry sample, and then, the sample is immersed in an autosaturater container for 48 h under a confining pressure of 30 MPa. After that, the saturated sample is weighted. It is easy to obtain the imbibed fluid volume utilizing the density of the brine and, subsequently, the effective porosity. Details on the experiments are shown in many literature studies (Tiab and Donaldson, 2011; Ge et al., 2015; Pi et al., 2022). The basic parameters measured are listed in Table.1.
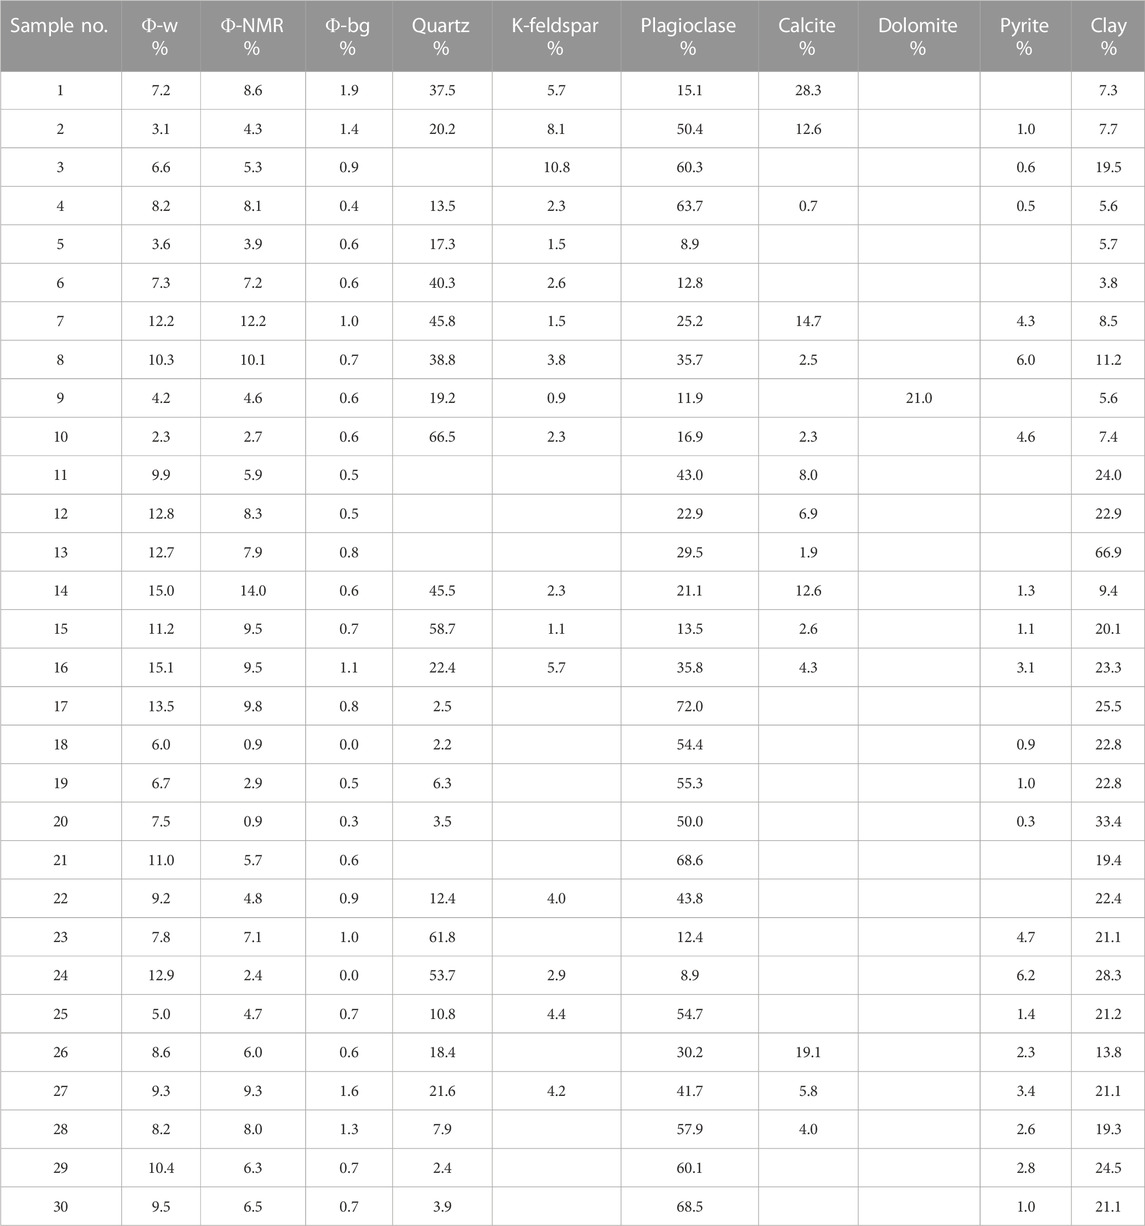
TABLE 1. Basic petrophysical parameters and mineral contents of the samples.
To quantify the difference between the NMR calibrated porosity and the brine-filled porosity, the relative porosity deviation is defined as
where
It is easy to establish the empirical equation to compensate the porosity reduction through multiple regressions. It is better to include the manganese content, magnesium content, and the T2 geometrical mean in the regression, which is expressed as
where
The geometrical mean of the transversal relaxation time is expressed as
where
However, if the quantitative elements data are not available, a simplified equation can be used to get the relative porosity deviation combined with
where
Therefore, the NMR calibrated porosity can be corrected by
3 Results and discussions
3.1 The porosity deviations
Figure 3 compares the porosity obtained by these methods. The helium-filled porosity agrees well with the brine-saturated porosity, indicating that nearly all pore spaces are occupied by the brine. However, the NMR calibrated porosity for many samples deviates from the brine-filled porosity heavily, indicating that the NMR calibrated porosity distorts from the truth due to some reasons. It is also noted that the NMR calibrated porosity for some samples is higher than the brine-saturated porosity, due to the influences of background relaxation signals. These background signals may come from the fluids residing in unconnected nanopores, and crystal water residing in laumontite, analcite, and zeolites. The relaxation signal of dry samples should be measured and be subtracted to get the effective porosity. After subtraction, the NMR calibrated porosity is lower than the brine-filled porosity, which is in accordance with the published results.
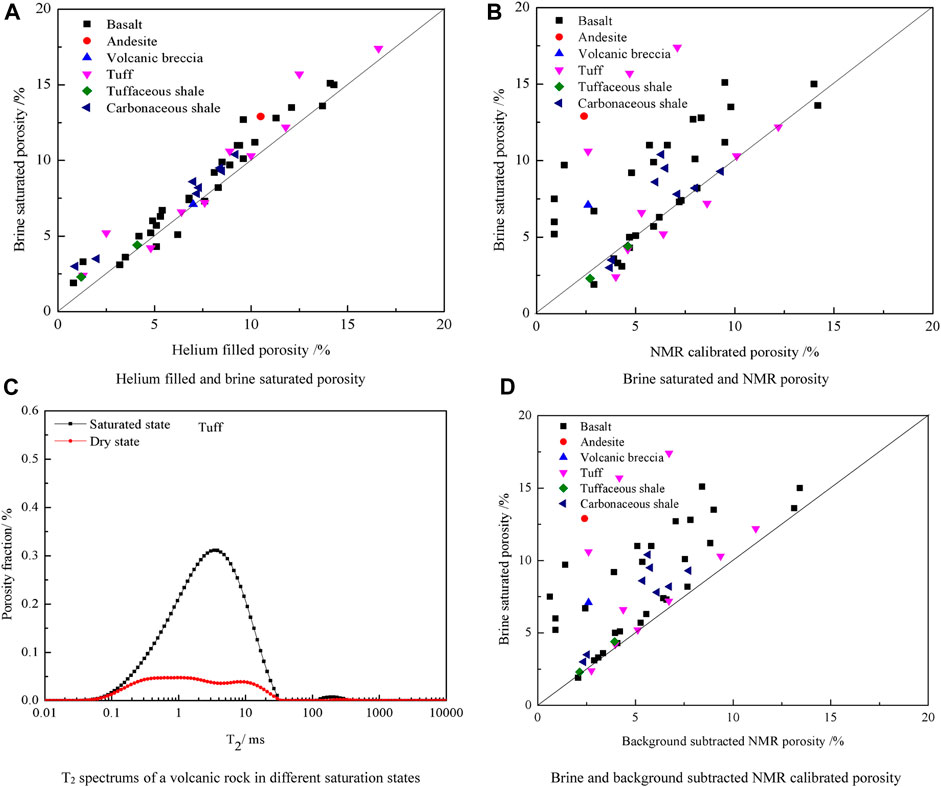
FIGURE 3. Comparisons of porosity under different measurements and different saturations (A–D).
3.2 Influences of relaxation time
Figure 4 shows the background-subtracted T2 spectra for volcanic rocks according to different relative porosity deviation extents. It is seen that most spectra are unimodal or irregular bimodal distributed, with the geometric mean ranges from 0.5 ms to 18 ms, indicating that the pore size is relatively small. However, there is no clear correlation between the T2 distribution and relative porosity deviation. Interestingly, the relative deviation seems to decay exponentially with the T2 geometric mean and the peak value, as shown in Figure 5. It is interpreted that larger pores with high T2 values tend to be less affected by the diffusion relaxation contributed by the internal field gradient, which is generally introduced by the magnetic susceptibility difference between the rock matrix and the pore fluid.
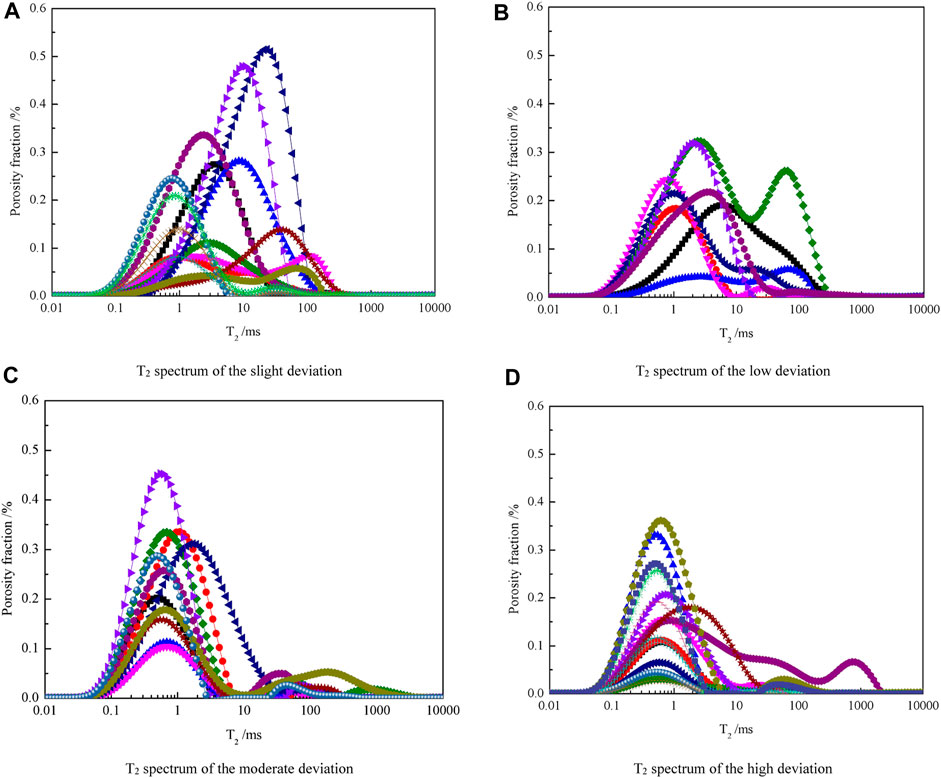
FIGURE 4. T2 spectra of volcanic core samples according to the porosity deviation degree (A–D).
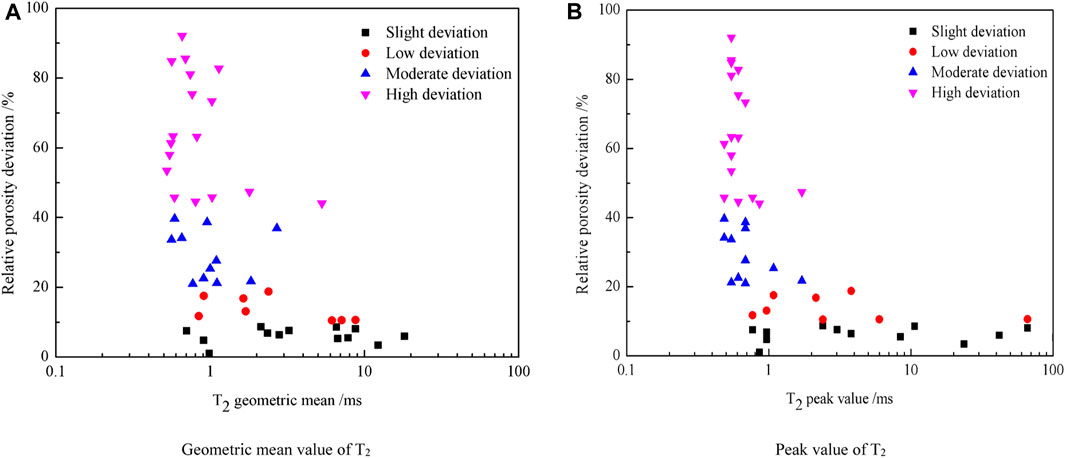
FIGURE 5. Relationships of the relative porosity deviation and the relaxation time (A,B).
3.3 Influences of minerals
Figure 6 shows the mineral constitutions and their average values from the XRD analysis. There are as many as 14 minerals, but the main minerals are plagioclase, quartz, and clay. Moreover, notorious paramagnetic materials such as pyrite and ferrodolomite also account for a certain percentage, bringing in great impacts on the NMR relaxation. Unitary analyses were carried out for four main minerals to investigate their contributions to the relative porosity deviation, as shown in Figure 7. It is observed that the quartz content and the plagioclase content are not correlated with the relative porosity deviation since they are nonmagnetic and hydrogen-free, contributing nearly zero relaxations at low field magnetic strengths. The relative porosity deviation is positively correlated with the clay content since it is associated with micropores occupied by the clay-bound water that the measurement may be insufficient to catch these fast relaxation components, resulting in porosity reduction. Furthermore, some clay minerals such as illite and chlorite where strong magnetic susceptibility can enhance the internal gradient, resulting in diffusion relaxation, cannot be ignored. Moreover, we found that there is also no clear correlation between the relative porosity deviation and the pyrite content, as shown in Figure 7D. It is controversial with many publications since pyrite is composed by iron, a well-known paramagnetic element with high magnetic susceptibility. The intrinsic mechanism and explanation are difficult to uncover.
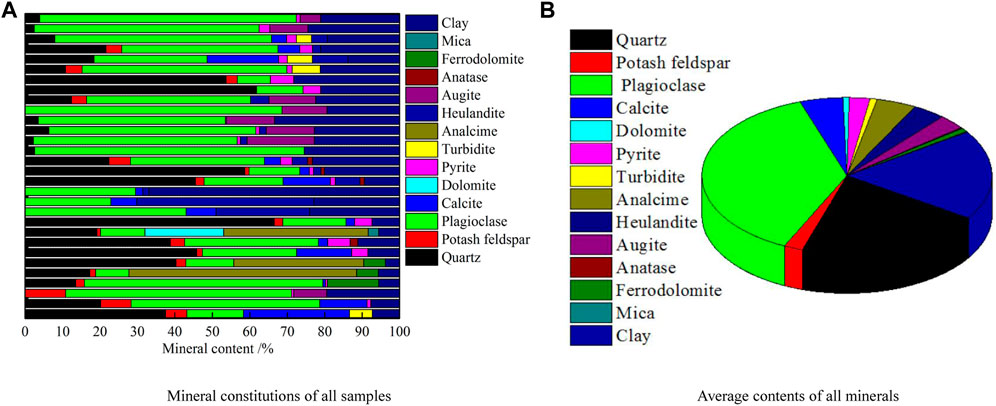
FIGURE 6. Mineral composition (A,B).
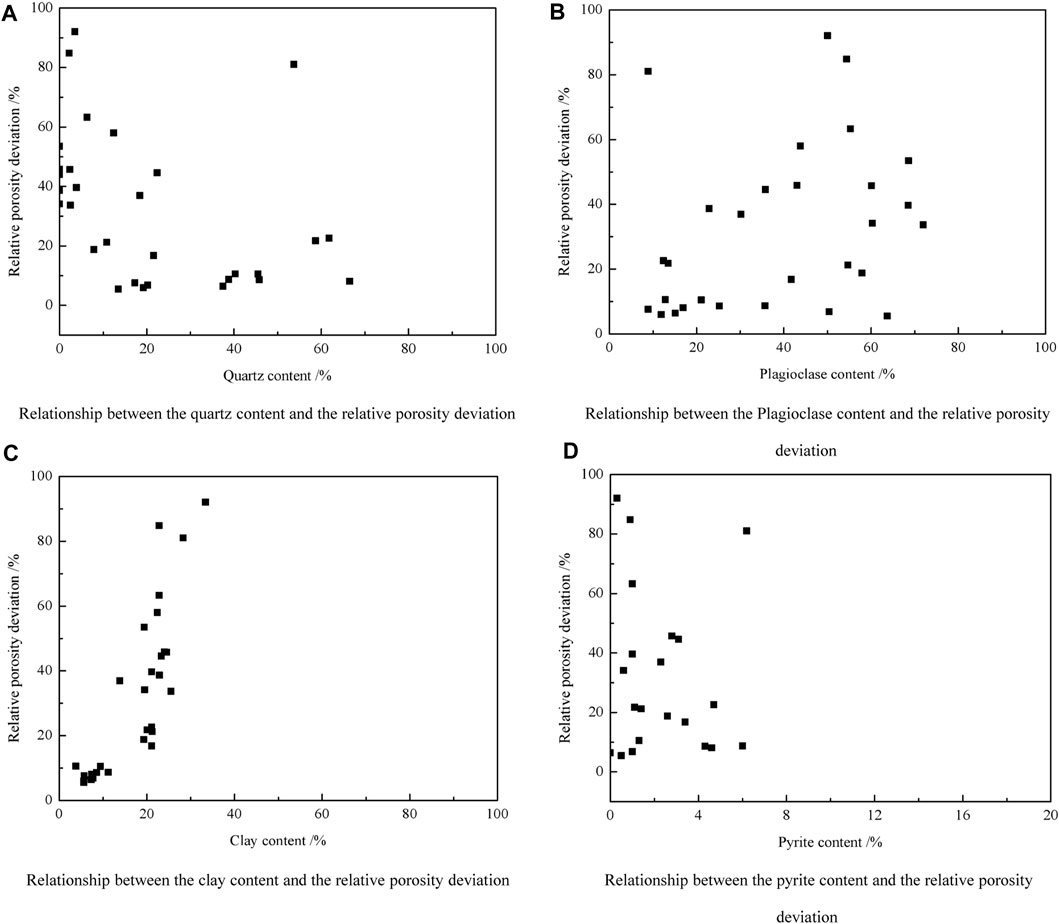
FIGURE 7. Mineral composition influences on the relative porosity deviation (A–D).
3.4 Influences of elements
XRF analyses are conducted since they provide quantitative element contents, and the types and contents of oxidizing materials. Figures 8 and 9 shows the constitution of oxidizing materials and the element contents for 16 volcanic samples. It is seen that the major oxidizing substances are silicon dioxide (SiO2), aluminum trioxide (Al2O3), calcium oxide (CaO), and iron oxides (including TFe2O3, Fe2O3, and FeO), which agrees well with the XRD analyses. We found that the relative porosity deviation is decreased with the increase in the silicon and phosphorus contents, whereas increased with the increase in the contents of iron, magnesium, calcium, and manganese. Moreover, the influence of manganese and magnesium is larger than that of other elements such as sodium, potassium, phosphorus, and calcium, which are considered as the controlling factors of the signal reduction of the NMR measurements. As is known, magnesium is diamagnetic and can develop weak magnetization in a direction opposite to the direction of the magnetizing field, reducing the macroscopic magnetic intensity.
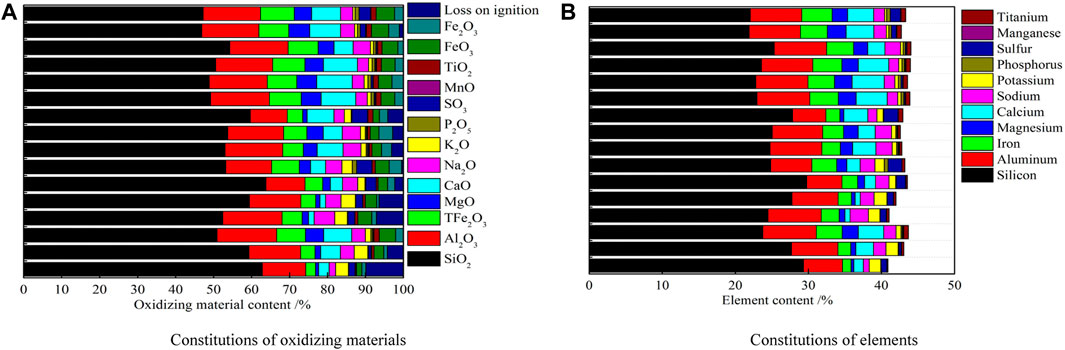
FIGURE 8. Element distributions (A,B).
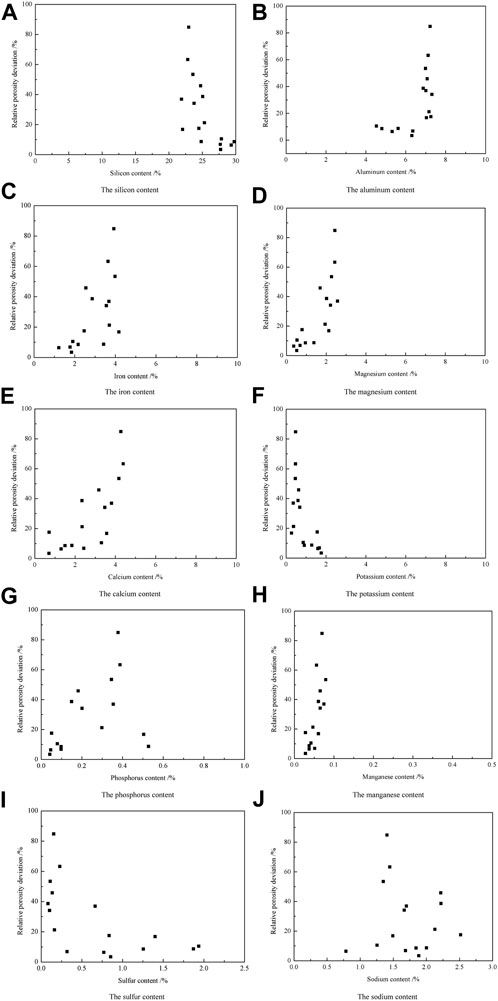
FIGURE 9. Element distributions’ influences on the relative porosity deviation (A–J).
3.5 Porosity correction methods
Based on the aforementioned analysis, it observed that it is meaningful to conduct the XRF test since it can provide quantitative element information, which is helpful for us to investigate the mechanism of the NMR response in volcanic rocks. Figure 10 shows the comparisons of the brine-saturated porosity, NMR calibrated porosity, and the NMR calibrated porosity after the correction. It is seen that the corrected NMR calibrated porosity is more consistent with the brine-saturated porosity. However, there is no obvious difference between the relative porosity deviation from Eqs 2–4, revealing that both methods are effective. Actually, the correction method through the clay content is easier and simpler than the correction method through elements.
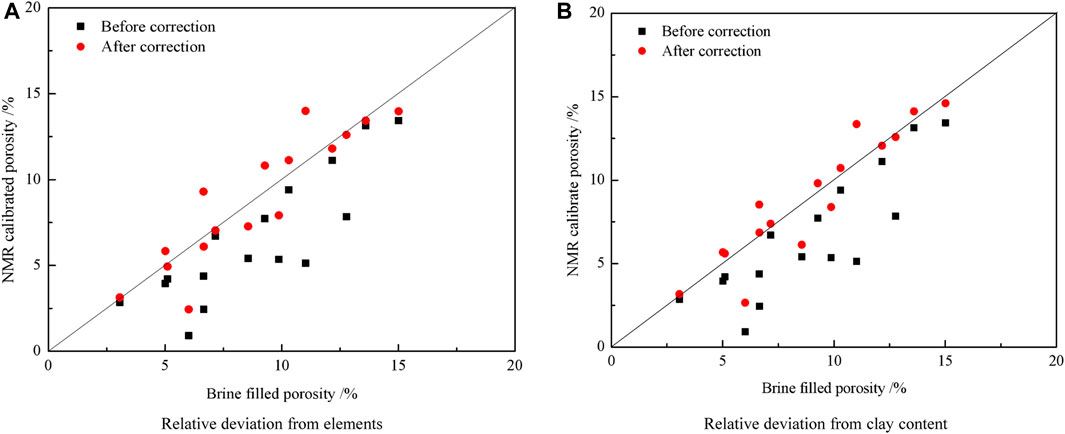
FIGURE 10. Comparison between the brine-filled and NMR calibrated porosity (A,B).
4 Conclusion
We conducted a comprehensive study on the NMR calibrated porosity deviation and put forward an empirical method to correct the porosity based on the mineralogical and petrophysical analyses. Influences such as the pore structure, mineral compositions, and the element constitutions are investigated to explore the controlling factors on the porosity deviation. Based on the findings, the main following conclusions can be drawn.
(1) The background relaxation signals should not be ignored for the tight volcanic rock since it will enhance the NMR calibrated porosity.
(2) The relative porosity deviation is negatively correlated with the transversal relaxation time, whereas positively correlated with the clay content. Strangely, pyrite seems to not bring much contribution to porosity reduction.
(3) Both the paramagnetic elements, such as manganese, and diamagnetic elements, such as magnesium, contribute to the NMR calibrated porosity reduction but in different ways. The paramagnetic element enhances the internal magnetic field and diffusion relaxation, whereas the diamagnetic element reduces the macroscopic magnetic intensity.
(4) The relative porosity deviation and NMR calibrated porosity can be compensated by multiple regressions with element contents, geometric T2 mean, and the clay content.
Data availability statement
The raw data supporting the conclusion of this article will be made available by the authors, without undue reservation.
Author contributions
YX, GX, CW, and JX: petrophysical study; HX and XG: data analysis; and CK: geological study. All authors contributed to the article and approved the submitted version.
Funding
This work was supported by the National Natural Science Foundation of China (42174142), the CNPC Innovation Fund (2021DQ02-0402), and the CNPC Major Scientific and Technological Projects (2017E-04-12).
Conflict of interest
Author CW was employed by China Petroleum Logging Co., Ltd.
Authors YX, GX, HX, JX, and CK were employed by PetroChina Research Institute of Petroleum Exploration & Development.
The remaining author declares that the research was conducted in the absence of any commercial or financial relationships that could be construed as a potential conflict of interest.
Publisher’s note
All claims expressed in this article are solely those of the authors and do not necessarily represent those of their affiliated organizations, or those of the publisher, the editors, and the reviewers. Any product that may be evaluated in this article, or claim that may be made by its manufacturer, is not guaranteed or endorsed by the publisher.
References
Abouzaid, A., Thern, H., Said, M., Elsaqqa, M., Elbastawesy, M., and Ghozlan, S. (2016). Nuclear magnetic resonance logging while drilling in complex lithology-solution for a glauconitic sandstone reservoir, in Proceedings of the SPE/AAPG Africa Energy and Technology Conference, December 2016, Nairobi City, Kenya, doi:10.2118/AFRC-2579089-MS
Anand, V., and Hirasaki, G, J. (2008). Paramagnetic relaxation in sandstones: distinguishing T1 and T2 dependence on surface relaxation, internal gradients and dependence on echo spacing. J. Magn. Reson. 190, 68–85. doi:10.1016/j.jmr.2007.09.019
Bauer, K., Kulenkampff, J., Henninges, J., and Spangenberg, E. (2015). Lithological control on gas hydrate saturation as revealed by signal classification of NMR logging data. J. Geophys. Res- Sol. Ea. 120 (9), 6001–6017. doi:10.1002/2015JB012150
Chen, S., Li, L., Zhang, G., and Chen, J. (2011). Magnetic resonance for downhole complex-lithology Earth formation evaluation. New. J. Phys. 13, 085015. doi:10.1088/1367-2630/13/8/085015
Coates, G. R., Xiao, L. Z., and Primmer, M. G. (2000). NMR logging principles and applications. Houston, Texas: Gulf Publishing Company.
Daigle, H., and Dugan, B. (2011). An improved technique for computing permeability from NMR measurements in mudstones. J. Geophys. Res- Sol. Ea. 116 (B8), B08101. doi:10.1029/2011JB008353
Djafarov, I. S., Khafizov, S. F., and Syngaevsky, P. E. (2004). NMR application in reservoirs with complex lithology: A case study. Petrophysics 45 (2), 119–129.
D., Tiab, and Erle, C. (2011). Donaldson. Petrophysics, Houston, Texas; Gulf Professional Publishing,
Dunn, K. J., Bergman, D. J., and Latorraca, G. A. (2002). Nuclear magnetic resonance petrophysical and logging application. Amsterdam, Netherlands: Elsevier Science Ltd.
Elsayed., Mahmoud, Isah., Abubakar, Moaz, Hiba., Hassan, A., Al-Garadi, K., Mahmoud, M., et al. (2022). A review on the applications of nuclear magnetic resonance (NMR) in the oil and gas industry: laboratory and field-scale measurements. J. Petroleum Explor. Prod. Technol. 12, 2747–2784. doi:10.1007/s13202-022-01476-3
Fleury, M., and Romero-Sarmiento, M. (2016). Characterization of shales using T1-T2 NMR maps. J. Pet. Sci. Eng. 137, 55–62. doi:10.1016/j.petrol.2015.11.006
Ge, X., Fan, Y., Li, J., and Aleem Zahid, M. (2015a). Pore structure characterization and classification using multifractal theory-An application in Santanghu basin of Western China. J. Pet. Sci. Eng. 127, 297–304. doi:10.1016/j.petrol.2015.01.004
Ge, X., Fan., Y., Zhu., X., Chen, Y., and Li, R. (2015b). Determination of nuclear magnetic resonance T2 cutoff value based on multifractal theory -An application in sandstone with complex pore structure. Geophysics 80 (1), D11–D21. doi:10.1190/geo2014-0140.1
Holthausen, R. S., and Raupach, M. (2019). A phenomenological approach on the influence of paramagnetic iron in cement stone on 2D T1-T2 relaxation in single-sided 1H nuclear magnetic resonance. Cem. Concr. Res. 120, 279–293. doi:10.1016/j.cemconres.2019.03.027
Kleinberg, R. L., Flaum, C., Straley, C., Brewer, P. G., Malby, G. E., Peltzer, E. T., et al. (2003). Seafloor nuclear magnetic resonance assay of methane hydrate in sediment and rock. J. Geophys. Res- Sol. Ea. 108 (B3), 2137. doi:10.1029/2001jb000919
Kock, F. V. C., Machado, M, P., Athayde, G. P. B., Colnago, L. A., and Barbosa, L. L. (2018). Quantification of paramagnetic ions in solution using time domain NMR. PROS and CONS to optical emission spectrometry method. Microchem. J. 137, 204–207. doi:10.1016/j.microc.2017.10.013
Li, J., Kaunda, R. B., Zhu, L., Zhou, K., and Gao, F. (2019). Experimental study of the pore structure deterioration of sandstones under freeze-thaw cycles and chemical erosion. Adv. Civ. Eng. 2019, 1–12. doi:10.1155/2019/9687843
Li, J., Liu, H., Ai, K., and Zhu, L. (2018). An NMR-based experimental study on the pore structure of the hydration process of mine filling slurry, Adv. Civ. Eng., 2018, 1. 12. doi:10.1155/2018/4720356
Li, X., Li, Q., Dong, L., Abulaiti, D., Ma, Z., Miao, N., et al. (2014). On impact of paramagnetic substances on nuclear magnetic porosity of intermediate to basic volcanic rocks. Well Logging Technol. 38 (5), 522–527. doi:10.3969/j.issn.1004-1338.2014.05.004
Liao, G-z., Xiao, L-z., Xie, R-h., and Fu, J-j. (2009). Influence of internal magnetic field gradient on nuclear magnetic resonance of volcanic rocks and its detection method. J. China Univ. Petroleum Ed. Nat. Sci. 33 (5), 56–60. doi:10.1002/9780470611807.ch2
Mehana, M., and El-monier, I. (2016). Shale characteristics impact on Nuclear Magnetic Resonance (NMR) fluid typing methods and correlations. Petroleum 2 (2), 138–147. doi:10.1016/j.petlm.2016.02.002
Osterman, G., Keating, K., Binley, A., and Slater, L. (2016). A laboratory study to estimate pore geometric parameters of sandstones using complex conductivity and nuclear magnetic resonance for permeability prediction. Water. Resour. Res. 52, 4321–4337. doi:10.1002/2015WR018472
Ren, X., Li, A., Fu, S., and Tian, W. (2019). Influence of micro-pore structure in tight sandstone reservoir on the seepage and water-drive producing mechanism-a case study from Chang 6 reservoir in Huaqing area of Ordos basin. Energy. Sci. Eng. 7 (3), ese3.302–753. doi:10.1002/ese3.302
Rezaee, R., Saeedi, A., and Clennell, B. (2012). Tight gas sands permeability estimation from mercury injection capillary pressure and nuclear magnetic resonance data. J. Pet. Sci. Eng. 88-89, 92–99. doi:10.1016/j.petrol.2011.12.014
Sun, J., Guo, H., Yang, Z., Jiang, P., and Yan, J. (2011). Experimental study of the NMR porosity of different lithologic volcanic rock core samples. J. Southwest Petroleum Univ. Sci. Technol. Ed. 33 (5), 27–34. doi:10.3863/j.issn.1674-5086.2011.05.005
Sun, J., Zhang, S., Wang, J., Guo, H., and Zhao, K. (2019). Comprehensive evaluation of NMR characteristics of complex volcanic reservoirs with different types of rock lithology, in Proceedings of the International Petroleum Technology Conference, March 2019, Beijing, China. doi:10.2523/19378-MS
Tan, M., Fan, L., Mao, K., Li, J., and Wu, C. (2019). Influential factors analysis and porosity correction method of nuclear magnetic resonance measurement in igneous rocks. J. Appl. Geophys. 161, 153–166. doi:10.1016/j.jappgeo.2018.12.023
Tan, M., Mao, K., Song, X., Yang, X., and Xu, J. (2015). NMR petrophysical interpretation method of gas shale based on core NMR experiment. J. Pet. Sci. Eng. 136, 100–111. doi:10.1016/j.petrol.2015.11.007
Testamanti, M. N., and Rezaee, R. (2019). Considerations for the acquisition and inversion of NMR T2 data in shales. J. Pet. Sci. Eng. 174, 177–188. doi:10.1016/j.petrol.2018.10.109
Wu, S., Zhu, R., Cui, J., Bai, B., Zhang, X., Jin, X., et al. (2015). Characteristics of lacustrine shale porosity evolution, triassic chang 7 member, ordos basin, NW China. Pet. explor. Dev. 42 (2), 185–195. doi:10.1016/S1876-3804(15)30005-7
Xiao, L., Liao, G., Deng, F., Liu, H., Song, G., and Li, M. (2015). Development of an NMR system for down-hole porous rocks. Micropor. Mesopor. Mat. 205, 16–20. doi:10.1016/j.micromeso.2014.09.024
Xie, R., Xiao, L., Dunn, K-J., and Fu, S. (2013). Determination of T2 distribution in the presence of significant internal field gradients. J. Geophys. Eng. 10, 054008. doi:10.1088/1742-2132/10/5/054008
Xu, J., Zhai, C., Qin, L., Wu, S., Sun, Y., and Dong, R. (2018). Characteristics of pores under the influence of cyclic cryogenic liquid carbon dioxide using low-field nuclear magnetic resonance. Geofluids 2018, 1–14. doi:10.1155/2018/1682125
Yu, G. (2013). Main controlling factors of volcanic reservoir in carboniferous Kalagang formation, Santanghu basin. Liaoning Chem. Ind. 43 (7), 836–838.
Yuan, Y., and Rezaee, R. (2019). Impact of paramagnetic minerals on NMR-converted pore size distributions in Permian Carynginia shales. Energy Fuel. 33, 2880–2887. doi:10.1021/acs.energyfuels.8b04003
Zhou, Y., Wei, G., and Guo, H. (2011). Impact factors analysis and decision tree correction of NMR porosity measurements. Well Logging Technol. 35 (3), 210–214. doi:10.1007/s12182-011-0118-0
Keywords: tight volcanic reservoir, paramagnetic and diamagnetic elements, nuclear magnetic resonance calibrated porosity, relative porosity deviation, mineral composition, transversal relaxation time geometric mean
Citation: Xiao Y, Ge X, Xiao G, Wang C, Xu H, Xiao J and Kang C (2023) An empirical method to compensate the NMR calibrated porosity of the tight volcanic rocks based on comprehensive laboratory studies. Front. Earth Sci. 11:1154767. doi: 10.3389/feart.2023.1154767
Received: 31 January 2023; Accepted: 10 July 2023;
Published: 09 August 2023.
Edited by:
Saulo Oliveira, Federal University of Paraná, BrazilReviewed by:
Junqian Li, China University of Petroleum, ChinaJianping Yan, Southwest Petroleum University, China
Copyright © 2023 Xiao, Ge, Xiao, Wang, Xu, Xiao and Kang. This is an open-access article distributed under the terms of the Creative Commons Attribution License (CC BY). The use, distribution or reproduction in other forums is permitted, provided the original author(s) and the copyright owner(s) are credited and that the original publication in this journal is cited, in accordance with accepted academic practice. No use, distribution or reproduction is permitted which does not comply with these terms.
*Correspondence: Gaojie Xiao, eGlhb2dhb2ppZSBAcGV0cm9jaGluYS5jb20uY24=