 Yujun Sun
 Hailong Li
 Taoyuan Fan
- SinoProbe Laboratory, Chinese Academy of Geological Sciences, Beijing, China
The Tibetan Plateau, induced by the India-Eurasian collision, has the highest average altitude in the world. During its uplift vertically, the Tibetan Plateau has been considered to expand laterally. However, there are several strong and almost non-deformable cratons on its periphery, such as the Tarim, North China craton, and South China block. The present landform features show that these cratons limit the expansion of the Tibetan Plateau. However, there is still much controversy over whether the deformation can be transmitted to periphery orogens or reactivate ancient orogens in the cratons. This study used numerical models to investigate the effect of rheological heterogeneities on the lithospheric deformation of the Tibetan Plateau and its neighbouring regions. The results show that the lateral heterogeneities of the lithosphere have an important influence on the deformation or strain partitioning. Generally, during the lateral expansion of the Tibetan Plateau, its peripheral cratons can transmit the deformation or high strain to neighbouring weak orogens. This case can be used to understand the Tian Shan orogen, which was reactivated by the India-Eurasian collision. However, when the orogens inside the cratons have high lithospheric strength, high strain is difficult to distribute on them and the expanding Tibetan Plateau is constrained by its peripheral cratons. These results can be used to explain the ancient orogens that are not strongly deformed, such as the Jiangnan orogen in the South China block. Because these orogens formed at the same time as the cratons and have relatively high lithospheric strength. In addition, the large lithospheric thickness difference and low crustal rheological contrast favor high strain rates localized on the lithosphere of the ancient orogen in the craton, such as the Trans-North China orogen in the North China craton.
1 Introduction
The Tibetan Plateau has been formed due to the continuous collision of the Indian and Eurasian plates since the Cenozoic (Molnar and Tapponnier, 1975). While the Tibetan Plateau is uplifted vertically, it is considered to expand horizontally. So far, the terranes of the Himalayas, Lhasa, Qiangtang, Songpan-Ganzi, Kunlun-Qaidam and Qilian Shan have been involved in the plateau (Tapponnier et al., 2001; Wang et al., 2014a; Yin and Harrison, 2000). The Tarim, North China craton, and South China block are the three main cratons in East Asia. However, these three cratons were not integrated into the plateau, on the contrary, they severely restricted the expansion of the Tibetan Plateau based on the landform features (Figure 1A). There are three main orogenic belts outside or within these cratons: the Tian Shan orogen outside the Tarim, the Jiangnan orogen within the South China block, and the Trans-North China orogen within the North China craton. Whether the deformation or strain caused by the India-Eurasian collision can be transferred by cratons to these orogens is still controversial (Molnar and Tapponnier, 1977; Sun and Liu, 2018; Yuan et al., 2013).
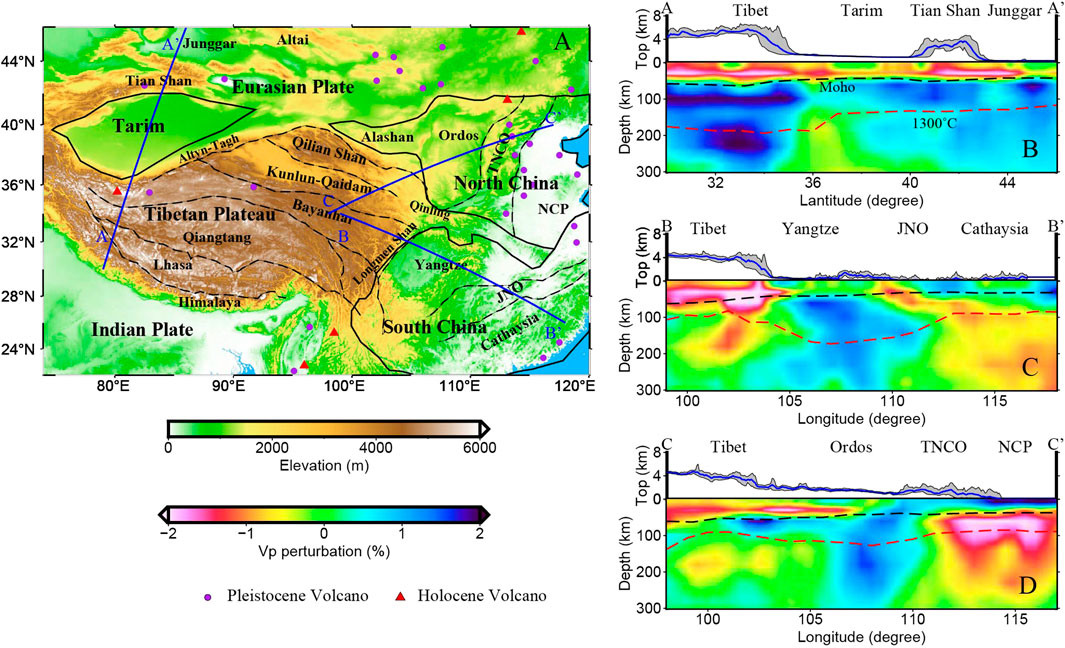
FIGURE 1. Tectonic background for the Tibetan Plateau and surrounding regions (A), and lithospheric structure across the Tarim (B), South China block (C), and North China craton (D) based on the P wave tomography (Wei et al., 2012). Red triangles and purple dots indicate the Holocene and Pleistocene volcanos, respectively (https://volcano.si.edu/volcanolist_pleistocene.cfm). Dashed lines in (A) indicate the block boundaries. Gray areas in (B–D) indicate the topographic change along the three profiles. The swath width of each profile is 40 km. Black dashed lines (B–D) indicate the Moho surface based on the Crust1.0 model (Data from https://igppweb.ucsd.edu/∼gabi/crust1.html). Red dashed lines (B–D) indicate the base of the thermal lithosphere (An and Shi, 2006). JNO: Jiangnan orogen; TNCO: Trans-North China orogen; NCP: North China plain.
Previous numerical studies have shown that during the lateral expansion of the Tibetan Plateau, if a stable craton is encountered, strain can be transferred to the weak orogen on the other side through the craton (England and Houseman, 1985; Neil and Houseman, 1997). For example, the Tibetan Plateau encountered the Tarim during the expansion of its northern margin. The strong Tarim, while undergoing little internal deformation, transfers strain to the Tian Shan orogen, producing significant crustal thickening (Figure 1B). The Tian Shan orogen belongs to the Central Asian orogenic belts, which were formed in the Paleozoic (Windley et al., 2007; Xiao et al., 2013). The expansion of the Tibetan Plateau or India-Eurasian collision reactivated the Tian Shan orogen (Jolivet et al., 2010; Li et al., 2022; Tapponnier and Molnar, 1979). Similar tectonics exist in the eastern and northeastern expansion of the Tibetan Plateau. Across the eastern margin of the Tibetan Plateau and the Sichuan basin, there is the Jiangnan orogen within the South China block (Figure 1C). It was formed in the Neoproterozoic due to the collision of the Yangtze craton and the Cathaysia block (Li et al., 1995). Across the northeastern margin of the Tibetan Plateau and the Ordos, the Trans-North China orogen is located within the North China craton (Figure 1D). It was formed in the Paleoproterozoic due to the collision of the west (Alashan and Ordos blocks) and east (North China plain) blocks of the North China craton (Zhao et al., 2000; Zhao et al., 2005). Although these two orogenic belts are located inside the cratons, their lithosphere has undergone a strong post-modification since the Cambrian. Especially, in the Mesozoic, the lithospheric thinning occurred in the east of North China craton and South China block (Zhu and Xu, 2019). Both for the South China block and the North China craton, there were significant differences in the thickness of the lithosphere between the east and west parts. In particular, the thickness of the mantle lithosphere in the eastern North China craton has decreased significantly, from ∼200 km to ∼80 km (Chen et al., 2009; Zhang et al., 2019; Zhu et al., 2011), and large-scale magmatic activities have occurred. However, the Ordos in the west of the North China craton and the Sichuan basin in the west of the South China block both maintained the stability of the craton without significant deformation. In general, older orogens have stronger or more stable lithospheres due to the cooling of the lithosphere (Hu et al., 2000). However, under the action of strong neotectonic stress, some intraplate rheological weak zones may be reactivated, such as the Sprigg’s orogen in southeastern Australia (Dyksterhuis and Müller, 2008) and the Laramide orogen in the United States (English and Johnston, 2004). Compared to the Tian Shan orogen, it is not clear whether the expansion of the Tibetan Plateau can affect these two ancient orogenic belts through the strong Sichuan basin and Ordos, respectively (Zhao and Zheng, 2007).
Previous studies have shown that the far-field effect of the India-Eurasian collision has extended to the Altai Shan and east China based on the active tectonics and topography (Molnar and Tapponnier, 1975; Molnar and Tapponnier, 1977). During this process, high topography and strain are mainly distributed along the preexisting faults, which implied the first-order importance of the weaknesses (Kong et al., 1997). However, these studies focused on crustal stress transmission (Dayem et al., 2009; England and Houseman, 1986; Kong et al., 1997). The dynamic effects of the India-Eurasian collision may have extended much deeper. On the one hand, recent study shows the subducting Indian mantle lithosphere beneath the western Tibetan Plateau collided with the Tarim lithosphere controls the uplift of the Tian Shan orogen (Huangfu et al., 2021). This implies the importance of the rheology of the mantle lithosphere. On the other hand, tomography studies have shown that continuous low-velocity asthenospheric mantle structure extends from the Tibetan Plateau to east China at the depth of 200–300 km (Huang et al., 2009; Liu et al., 2004). Numerical simulations suggest that significant lateral extrusion of the asthenospheric mantle driven by India-Eurasian collision is possible in the presence of a low-viscosity asthenosphere (Liu et al., 2004). Therefore, one possible explanation for the Cenozoic rifting and volcanism in east China is mantle flow driven by India-Eurasian collision. These studies show that the upper mantle dynamics should be considered in investigating the deformation distribution during the India-Eurasian collision.
In this study, a two-dimensional thermo-mechanical finite element model was used to consider the lithospheric strength heterogeneities of the Tibetan Plateau and neighbouring regions. We tried to explore how deformation or strain distribution when the expanding Tibetan Plateau collides with peripheral cratons. Especially, by considering the lithospheric deformation of the craton and asthenospheric flow, we try to investigate if the ancient orogenic belts in the craton, such as the Jiangnan orogen or the Trans-North China orogen, can be reactivated like the Tian Shan orogen. The results would help us to understand the far-field effects of the India-Eurasian collision and the interaction of different dynamic factors.
2 Methods
2.1 Governing equations
Two-dimensional thermo-mechanical finite element codes have been developed based on previous studies (Sun et al., 2019; Sun and Liu, 2018, 2023). For the mechanical deformation, the visco-plastic rheology was adopted in the numerical model, and viscosity depended on the temperature and strain rate. The Arbitrary Lagrange-Euler (Fullsack, 1995) and the marker-in-cell method (Gerya and Yuen, 2003) were used to solve the coupling equations.
The following equations are used in the two-dimensional thermal-mechanical coupled finite element model. The momentum conservation equation is
where
The mass conservation or incompressible continuity equation is
where
The constitutive equation is
where
The ductile behavior is driven from experimental uniaxial creep law:
Frictional–plastic deformation would occur if the stress state satisfied a yielding criterion. Here we ignore the effect of pressure and active volume, which are of minor importance for the upper mantle (Ranalli, 1997a). In this study, we used a pressure-depended Drucker-Prager yield criterion:
where
in the regions that satisfy the yield criterion. Here
The minimum value of the viscous or plastic viscosity defines the effective viscosity:
To quantify the intensity and state of deformation (extension or compression), we define the maximum shear strain rate
where
The energy conservation equation is given based on the extended Boussinesq approximation (EBA) (Christensen and Yuen, 1985; Hansen and Yuen, 2000)
where
2.2 Finite element mesh and boundary conditions
The constructed numerical model is 2,200 km in length and 400 km in depth (Figure 2). From left to right, the initial width of the Tibetan Plateau and craton in the numerical model are 1,050 km and 1,150 km, respectively. In the vertical direction, the model is divided into 5 layers: upper crust, middle crust, lower crust, mantle lithosphere, and asthenosphere. The upper, middle, and lower crustal thicknesses of the Tibetan Plateau were set as 15.8 km, 18 km, and 18 km, respectively. For the craton, the upper, middle, and lower crustal thicknesses were set as 10 km, 15 km, and 15 km, respectively. The initial topography of the Tibetan Plateau and craton are 1.8 km and 0, respectively. The initial crustal structure satisfies isostatic equilibrium. For the reference model (case R), the initial lithospheric thicknesses of the Tibetan Plateau and craton are 100 km and 130 km, respectively. The initial thicknesses of different layers change linearly from the Tibetan Plateau to the craton.
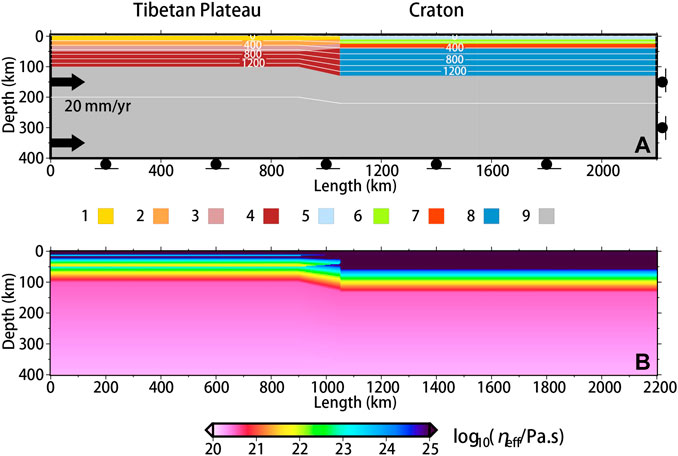
FIGURE 2. The two-dimensional finite element model and boundary conditions (A) and the initial effective viscosity of the reference model (case R) (B). Different colors in (A) indicate different materials. Units 1–4 are the upper crust, middle crust, lower crust, and mantle lithosphere of the Tibetan Plateau or a weak orogen in other cases, respectively; units 5–8 are the upper crust, middle crust, lower crust, and mantle lithosphere of the craton or a strong orogen in the craton, respectively (Table 1); unit 9 is the asthenosphere. White lines in (A) indicate the initial isotherm.
The mechanical boundary conditions of the reference model (case R) are imposed as follows. A 20 mm/yr constant velocity is imposed on the left side of the model. The bottom and left sides of the model are free-slip boundary conditions. The top side of the model is a full free boundary condition. In this case, the top surface may move vertically because of mass conservation (or incompressibility). We set the topography at the center of the craton as the reference point (0 km), then corrected the y-axis coordinates of all markers, which is relative to the elevation of the craton (Figure 2). For this reason, the topography shown in this study indicates a relative change, not an absolute elevation. The thermal boundary conditions are imposed as follows. The thermal boundary conditions are
2.3 Parameters
Cenozoic orogens, such as the Tibetan Plateau, generally have weak lithospheric strength, while the Precambrian orogens have high strength (Deng and Tesauro, 2016; Sun et al., 2013). The results are also supported by the S-wave velocity structure across the margins of the Tibetan Plateau and adjacent blocks (Tian et al., 2021). This is not only related to the cooling of the lithosphere but also to the composition of the continental lithosphere and the distribution of radioactive elements (Mareschal and Jaupart, 2013; Sun et al., 2022). In this study, for the reference model (case R), the initial lithospheric thickness of the craton does not change. The parameters of case R are given in Table 1. When we consider the effect of the lithospheric strength heterogeneities on the strain partitioning, a weak orogen is inserted in the craton. According to the nature of the orogens in the periphery of the craton or the interior of the craton, the lithospheric strength or thickness contrasts are considered. This difference is inherited from older periods, such as the huge difference in lithospheric thickness of the North China craton after the Mesozoic (Zhang et al., 2019). In addition, the effect of crustal strength contrast is considered. Rheological parameters adopted in these numerical models follow in Table 1.
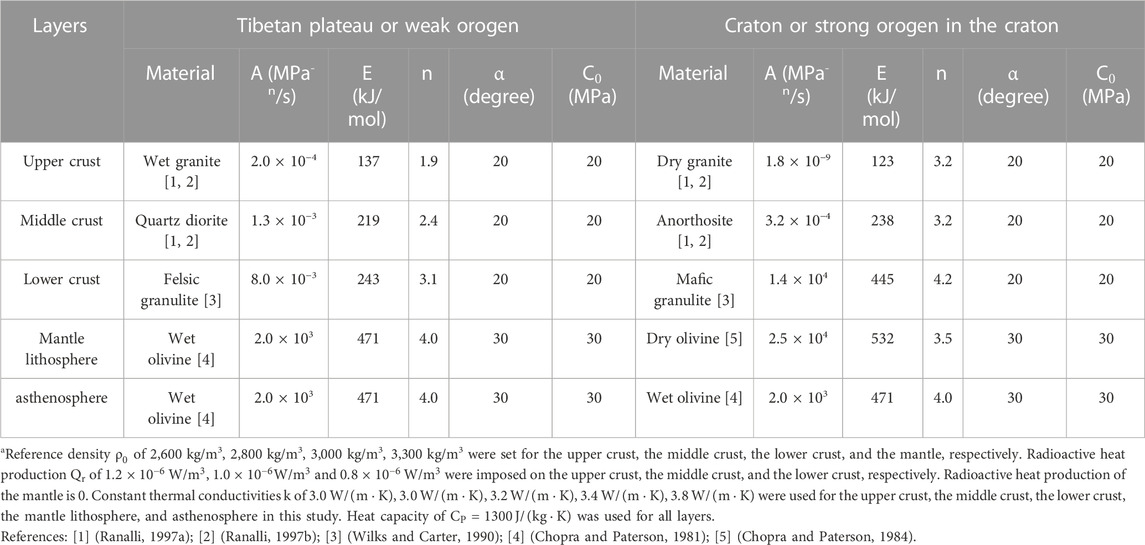
TABLE 1. Rheological parameters of the numerical modelsa.
3 Results
3.1 Reference model (case R)
For case R, the Tibetan Plateau and craton correspond to high and low lithospheric viscosity, respectively (Figure 2B). With continuous convergence (20 mm/yr on the left side of the model), the results show that the lithosphere of the Tibetan Plateau has undergone significant deformation, and a high strain rate is localized on it (Figures 3A–D). The mantle lithosphere of the Tibetan Plateau is delaminated or subducted after encountering the obstruction of the craton (Figures 3C,D). The craton does not deform significantly, which is indicated by a low strain rate or low convergence velocity (Figure 3E). The crustal thickening and high strain rate are mainly distributed on the side of the Tibetan Plateau near the boundary between the plateau and the craton. The free-slip boundary on the right side of the model means that the length of the craton could extend to infinity. Under this high rheological contrast (Figure 2B; Figure 3D), these results indicate that the expansion of the Tibetan Plateau is blocked by the craton. If the craton is uniform and infinite, the expanding plateau will not have a far-field effect under the India-Eurasian collision.
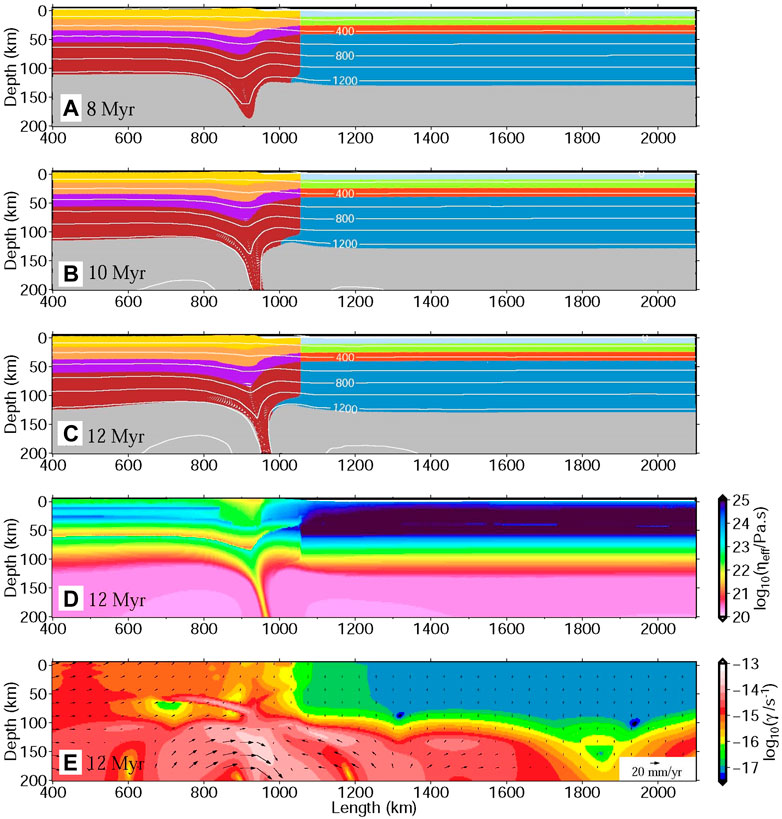
FIGURE 3. The evolution of lithospheric deformation (A–C), effective viscosity (D), and the maximum shear strain rate localization (E) for case R. White lines in (A–C) indicate the isotherm. Black arrows in (D) show velocity vectors.
3.2 Effect of rheological heterogeneity of the lithosphere (group A)
To further study the effect of lateral rheological heterogeneity on lithospheric deformation and strain partitioning. Three more models (cases A, A1, A2) were established (Figure 4) for comparison with case R. In these cases, a 150 km wide orogen is inserted in the craton. In case A, the weak orogen was imposed the same rheological parameters as the Tibetan Plateau (Table 1). The rheological parameters of case A1 are similar to case A, except that the orogen was given a lower plastic yield strength (10 MPa). For case A2, the mantle lithosphere of the Tibetan Plateau is given a higher strength (Dry olivine replaces wet olivine according to Table 1) than that in case A1. The results (Figure 4, Supplementary Figure S1) show that the lateral strength heterogeneities have a great influence on the deformation pattern and strain distribution of the lithosphere under the same shortening amount. When the expanding plateau encounters strong craton resistance, if the orogen outside the craton has weak lithosphere, the orogen would have high strain distribution and lithospheric thickening (case A in Figures 4A,B). Furthermore, if the lithospheric strength of the orogen is decreased, the deformation is more likely to be transmitted to the orogen outside the craton (case A1 in Figures 4C,D). In case A2, the strong mantle lithosphere of the Tibetan Plateau collides with that of the craton, which causes a high strain rate and delamination of the mantle lithosphere under the orogen (Figures 4E,F).
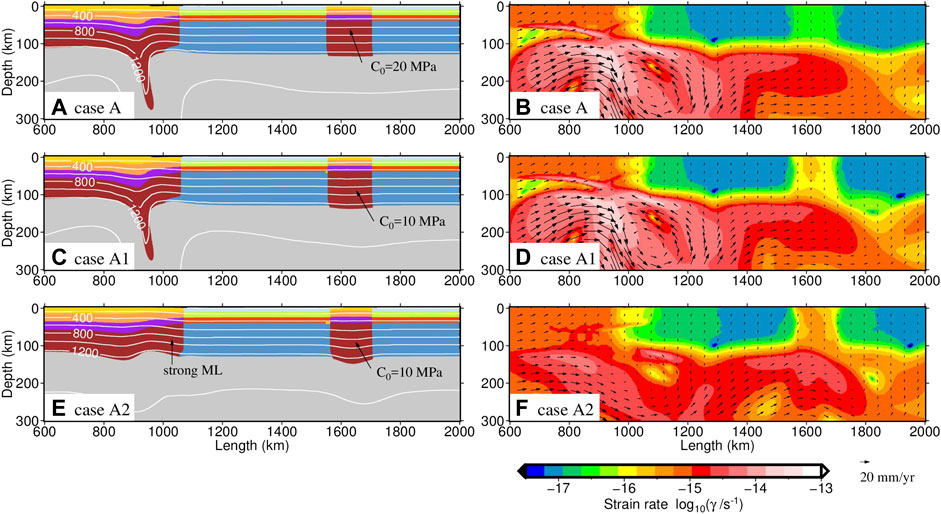
FIGURE 4. Comparisons of lithospheric deformation (A, C and E) and strain rate localization (B, D and F) for different cases (cases A, A1, and A2) after 10 Myr. Different colors in (A,C and E) indicates different materials, which are consistent with that in Figure 2A. White lines in (A,C and E) indicate the isotherm. Black arrows in (B,D and F) show velocity vectors.
According to the results of the viscous thin-shell model (England and Houseman, 1986), during the outward expansion of the Tibetan Plateau, strong deformation and high strain rates are localized on the weak Tibetan Plateau. For a homogeneous crust, high strain gradually decreases away from the collision boundary and is hard to transfer to the orogen outside the craton. However, the lateral strength heterogeneity of the lithosphere changes this feature, making it easier for the high strain to concentrate on the Tibetan Plateau or orogens with weak strength (England and Houseman, 1985). In our two-dimensional profile model, such conclusions also apply to the horizontal deformation characteristics and strain distribution of the lithosphere. In addition, the deformation of the lithosphere also affects the motion of the asthenosphere. For example, the deformation of the mantle lithosphere will cause small-scale mantle convection below the orogen (Figure 4F).
We compared the surface topography and strain rate of these three models (group A) with the observations across the northern margin of the Tibetan Plateau (AA’ profile in Figure 1B). The comparisons (Figure 5) show that the results of group A are generally consistent with the actual deformation feature. The west Kunlun Shan and Tian Shan with high landforms are located on the south and north sides of the Tarim basin, which is similar in the high topography features distributed over both sides of the craton obtained by the numerical models (Figure 5A). Especially for case A2, the steep topography feature is fits well with the observation profile. High values of the maximum shear strain rate (Figure 5B) and dilatation strain rate (Figure 5C) from the observations (Kreemer et al., 2014; Wang and Shen, 2020), show that Tian Shan are under strong compressive deformation. These are generally consistent with the results of numerical models. The features of observed topography and strain rate of the Than Shan are in better agreement with the results of case A1 or case A2. This implies that the lithospheric thickening may be taking place beneath the Tian Shan. However, the dilatation strain rate calculation shows that the Tibetan Plateau is under a compression state, which is not consistent with the observed extension state (Figure 5C). This may be related to the shallow crustal extension caused by gravity collapse for high topography (Liu and Yang, 2003), because the current observed strain rate is calculated from the GPS observation on the surface. It represents the three-dimensional deformation characteristics of the shallow crust.
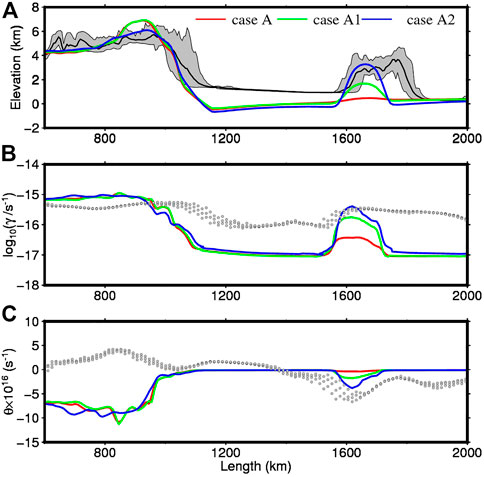
FIGURE 5. Comparisons of the results of numerical models (group A) with the observed surface topography (A), the maximum shear strain rate (B), and the dilatation strain rate (C) across the northern margin of the Tibetan Plateau (AA’ profile in Figure 1B). Gray areas in (A) indicate the observed topographic change. Gray dots in (B–C) indicate the observed strain rates (Kreemer et al., 2014; Wang and Shen, 2020).
3.3 Effect of lithospheric thickness on deformation (group B)
Given the same rheological parameters, the initial thickness of the lithosphere also affects the strength of the lithosphere because of the difference in thermal structure. For instance, the craton and its internal orogen have different strengths because of the varied initial thicknesses of the lithosphere. This is related to the evolution of craton or orogens. Therefore, it is necessary to discuss the influence of the initial structure of the lithosphere on the deformation and strain distribution.
Based on case R, we set up two comparable cases (case B1 and case B2) by changing the initial lithospheric thickness of the craton (Figure 6). For case B1, the initial lithospheric thickness of the craton is not constant. The initial lithospheric thickness in the left part of the craton is 130 km, which is thicker than that of the right part (100 km) (Figures 6C,D). For case B2, a much thinner initial lithospheric thickness (80 km) of the right part of the craton is imposed (Figures 6E,F). The results show that the difference in the initial thickness of the lithosphere, which affects the rheological strength (Supplementary Figure S2), also has an important influence on the deformation and strain partitioning. In case R, the craton with the same initial lithospheric thickness has higher lithospheric strength than the Tibetan Plateau. During the expansion of the Tibetan Plateau, the deformation and high strain are mainly concentrated in the Tibetan Plateau. With the initial lithospheric thickness of the right part of the craton decreasing, the effective viscosity also decreases (Supplementary Figure S2). The strain rate localized on the right part of the craton increases accordingly (Figures 6C–F). In case B2, if the initial lithospheric thickness of the right part of the craton is reduced by 50 km compared to case R, the strain rate localized on the right part of the craton is similar to that of the Tibetan Plateau (Figures 6E,F). The strain rate localized on the left part of the craton is similar to that of case R.
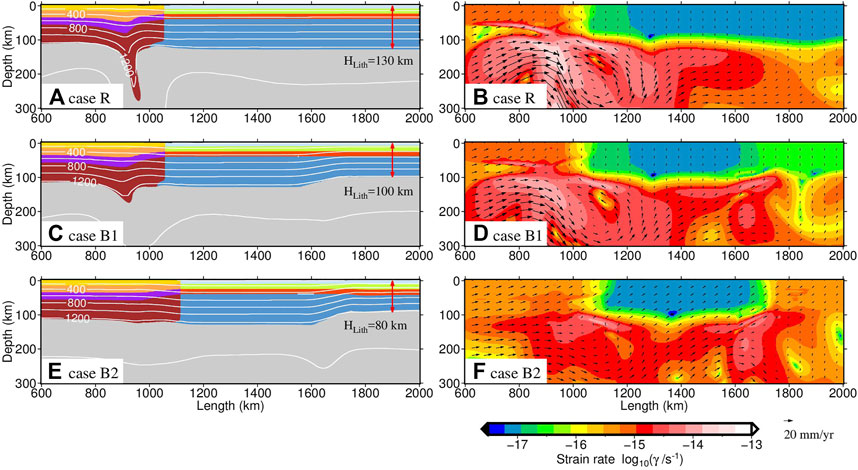
FIGURE 6. Comparisons of lithospheric deformation (A,C and E) and strain rate localization (B,D and F) for different cases (cases R, B1, and B2) after 10 Myr convergent. Different colors in (A,C and E) indicates different materials, which are consistent with that in Figure 2A. White lines in (A,C and E) indicate the isotherm. Black arrows in (B,D and F) show velocity vectors. Double-headed red arrows in (A,C and E) indicate that the initial lithospheric thicknesses of the right part of the craton. HLith presents the initial thickness of the lithosphere.
The surface topography and strain rate of these three cases (cases R, B1, and B2) are compared with the observations across the eastern margins of the Tibetan Plateau (BB’ profile in Figure 1C). The results of the reference model (case R) are consistent with the observations of this profile. Crossing the boundary between the plateau and the craton, the topography and strain rate changed abruptly (Figure 7). When the lithosphere thickness of the right part of the craton decreases (case B1, B2), the topography and strain rate of the right part of the craton will increase (Figures 7A,B). High topography and the maximum shear strain rate correspond to the low effective viscosity of the lithosphere (Supplementary Figure S2), which is determined by the initial lithosphere thickness. Our model shows that when the initial lithosphere thickness of the right part of the craton is 100 km (case B1), the calculated surface topography and the maximum strain rate agree with the observation results (Figures 7A,B). This is consistent with the thermal lithospheric thickness (Figure 1C). However, the comparison of dilatation strain rate shows the compressive state from the simulation is stronger than that of observation (Figure 7C).
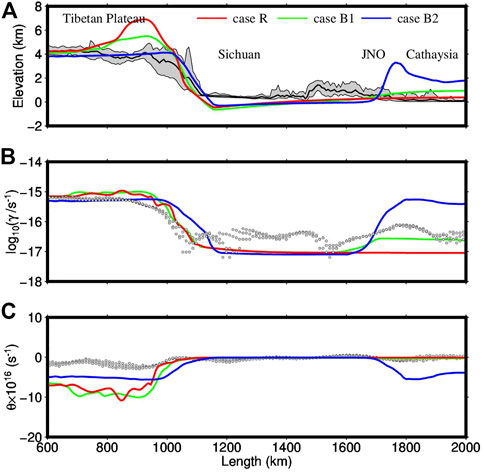
FIGURE 7. Comparisons of the numerical models (cases R, B1, B2) with the observed surface topography (A), the maximum shear strain rate (B), and the dilatation strain rate (C) across the eastern margins of the Tibetan Plateau (BB’ profile in Figure 1C), respectively. Gray areas in (A) indicate the observed topographic change. Gray dots in (B–C) indicate the observed strain rates. The data of topography are consistent with those shown in Figure 1. Strain rate data is from (Kreemer et al., 2014; Wang and Shen, 2020).
3.4 Effect of crustal rheological contrast (group C)
The above cases include the overall rheological contrast of the lithosphere, but the rheological contrast of the crust has not been considered in detail. In this group of cases, the effect of the crustal rheological contrast on the plateau expansion and far-field effect is considered. In case C (Figures 8A,B), we imposed a weak crust for the craton (Supplementary Figure S3), whose parameters are the same as those of the Tibetan Plateau. Other parameters are the same as in case B1. Compared to case B1, if the crustal viscosity of the craton is low (Supplementary Figure S3B), the high strain rate can be extended to the interior of the craton under the expansion of the Tibetan Plateau (Figure 8B). The strain rate results show that the deformation process is gradually extended from the plateau and craton boundary to the craton interior. As shown in group A, if there is a weak orogen in the craton (Figures 8C,D), the deformation of the orogenic belt is relatively intense and a high strain rate is localized on it (case C1). Furthermore, if a thin initial lithosphere is imposed for the right part of the craton (case C2), it is conducive to the high strain rate localized on it. In the upper mantle, edge-driven convection will be caused by the large lithospheric thickness of the craton (Figures 8E,F).
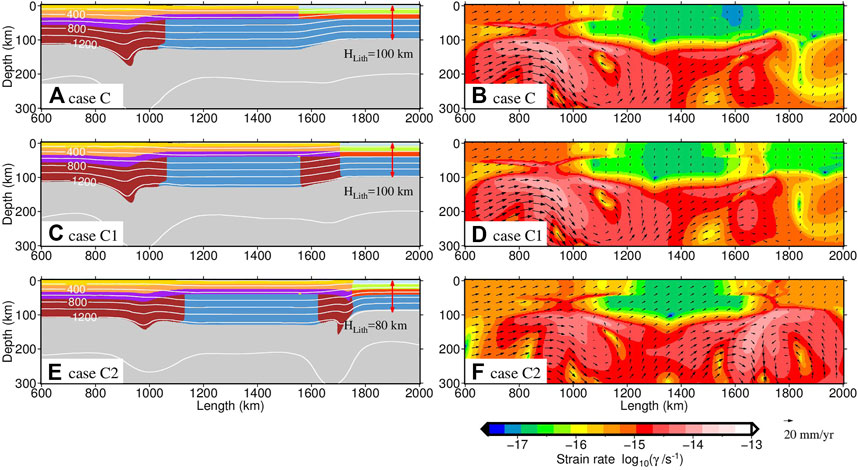
FIGURE 8. Comparisons of lithospheric deformation (A,C and E) and strain rate localization (B,D and F) for different cases (cases C, C1, and C2) after 10 Myr convergent. Different colors in (A,C and E) indicates different materials, which are consistent with that in Figure 2A. White lines in (A,C and E) indicate the isotherm. Black arrows in (B,D and F) show velocity vectors.
The surface topography and strain rate of these three cases (cases C, C1, and C2) are compared with the observations across the northeastern margins of the Tibetan Plateau (CC’ profile in Figure 1D). For the northeastern margin of the Tibetan Plateau, the smooth surface topography and the diffuse strain rate can be generally fitted only when a weak crustal strength of the craton is given (Figure 9). If the orogen within the craton is given low lithospheric strength, then the surface topography and strain rate are consistent with the characteristics of the Trans-North China orogen (case C1 in Figure 9). This is reasonable because the composition between the ancient orogenic belt and stable craton are still different. However, different compositions may also produce the same rheological strength (group B). In our current model, the factor affecting the results can be attributed to the rheological contrast (Supplementary Figure S3). In case C2, under the convergent of the Tibetan Plateau, low viscosity and large difference of lithospheric thickness leads to strong deformation of the orogen in the craton. High topography and sharp change of the strain rate crossing the orogen in the craton is not consistent with the observed strain rate (case C2 in Figure 9). Thus, we infer that the lithospheric deformation of the Trans-North China is not strong as that shown in case C2.
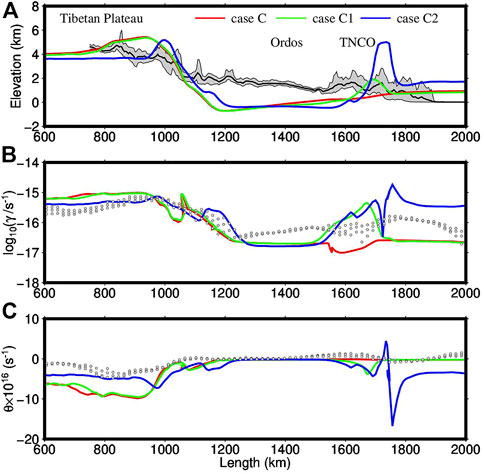
FIGURE 9. Comparisons of the numerical models (cases C, C1, C2) with the observed surface topography (A), the maximum shear strain rate (B), and the dilatation strain rate (C) across the northeastern margins of the Tibetan Plateau (CC’ profile in Figure 1D), respectively. Gray areas in (A) indicate the observed topographic change. Gray dots in (B–C) indicate the observed strain rates. The data of topography and strain rate are consistent with those shown in Figure 5.
4 Discussion
4.1 Implication for the far-field effect of the India-Eurasian collision
The Tibetan Plateau is blocked by cratons during its expansion, but whether it has far-field effects on orogens outside or within the cratons has been debated. Using numerical models in this study, we considered the effects of strength heterogeneity of the lithosphere and contrast in lithospheric thickness on the deformation characteristics and strain distribution during the expansion of the plateau. These results can help us understand the far-field effects of the India-Eurasian collision.
Across the northern margin of the Tibetan Plateau and the Tian Shan orogen (profile AA’ in Figure 1B), the lithospheric deformation can be understood by the lateral heterogeneity of lithospheric strength. Our numerical results show that lateral heterogeneity of lithospheric strength affects greatly lithospheric deformation patterns and strain partitioning (Figures 4, 5). When the expanding Tibetan Plateau is blocked by the Tarim, the hard Tarim can transmit the strain to Tian Shan orogen (Figure 4). These results are consistent with previous thin-shell model studies (England and Houseman, 1985; Neil and Houseman, 1997). The pre-existing weak Tian Shan orogen was remotely influenced by the India-Eurasian collision (Kong et al., 1997). Especially when the subducted Indian mantle lithosphere collided with the mantle lithosphere of the Tarim (Li et al., 2008; Zhao et al., 2010), the uplift of the Tian Shan orogen was more intense. For case A2, if the weak mantle of the Tibetan Plateau was replaced by the subducted Indian mantle lithosphere (Figures 4E,F), lithospheric thickening occurred strongly on the Tian Shan orogen. According to the observation of surface strain rate and geomorphological characteristics (Figure 5), our numerical results show that the lithospheric thickening beneath Tian Shan orogen is consistent with the characteristics observed in some geophysical observations (Chen et al., 1997; He and Santosh, 2018). Therefore, the late Cenozoic reactivation of the Tian Shan orogen was controlled by the India-Eurasian collision, especially the collision of the mantle lithosphere between India and Tarim since the late Cenozoic (Hendrix et al., 1994; Qin et al., 2022). But the low lithospheric strength of the Tian Shan orogen is the premise that it can be remotely affected by the India-Eurasian collision.
However, when the lithospheric strength of the orogenic belt in the craton is relatively high, the India-Eurasian collision is difficult to affect (Figures 6, 7). This result can be used to understand the convergence deformation between the Tibetan Plateau and South China block (profile BB’ in Figure 1C). Within the South China block, there is the Jiangnan orogen formed by the splicing of the Yangtze craton and the Cathaysian block in the Neoproterozoic (Li, 1999; Li et al., 1995). Since these orogens was formed during the collision of two blocks, its strength is similar to that of the Yangtze craton and the Cathaysian block. Furthermore, its strength is higher than the orogen formed in the Paleozoic, such as Tian Shan orogen (Allen et al., 1993). When such a high strength ancient orogenic belt exists in the craton, the strain caused by India-Eurasian collision cannot be transited to it (Figures 6B,C; Figures 7A,B). That means it is difficult for this ancient orogenic belt to be reactivated like the Tian Shan orogen. In particular, if the craton and its interior orogenic belt remain thick lithosphere, the Tibetan Plateau will be severely constrained, making it difficult to expand further (Figures 6A–D). Deformation and high strain rate are mainly localized on the Tibetan Plateau, and the mantle lithosphere of the extended Tibetan Plateau will undergo delamination, which is very similar to the deformation characteristics of the eastern margin of the Tibetan Plateau (Liu et al., 2014; Wang et al., 2014b). Our numerical model results suggest that the lithospheric thickness also affects strain distribution, although not as strong as the preexisting weak lithospheric strength (Figures 6C–F; Figures 7B,C). The current thickness of the mantle lithosphere in the Cathaysia block in the east of the South China block has decreased significantly (An and Shi, 2006; Gao et al., 2022; Li et al., 2013). Although thin lithospheric thickness contributes to high strain rate distribution, our results show that the high lithospheric strength of the craton will still restrict the expansion of the Tibetan Plateau and its far-field effect.
For the northeastern margin of the Tibetan Plateau (profile CC’ in Figure 1D), more complex lithospheric rheology is needed to fit the observed topography and strain rate. Crossing this profile, the smooth surface topography and the diffuse strain rate require low crustal rheological contrast between the Tibetan Plateau and the North China craton (Figures 8, 9). In addition, our results show that the formation of the smooth surface topography needs a weak mantle lithosphere of the west part of the North China craton (or the Ordos block). Although the Trans-North China orogen was formed by the splicing of the eastern and western blocks of the North China craton in the Paleoproterozoic (Zhao, 2001; Zhao et al., 2000; Zhao et al., 2005), its strength should be as high as that of the Jiangnan orogen. However, our numerical results show that the high topography of the Trans-North China orogen needs a weak lithospheric strength (Figures 9B,C). This may imply that the Trans-North China orogen had undergone significantly transformation during the Mesozoic (Zhu and Xu, 2019). For example, during the Mesozoic, the mantle lithosphere in the eastern North China craton was significantly thinned from about 120 km to the current 80 km (Chen et al., 2009; Zhang et al., 2014), and the strength of the Trans-North China orogen was reduced. In addition, differences in lithosphere thickness can cause the edge-driven convention beneath the North China craton (King and Anderson, 1998; King and Ritsema, 2000; Sun and Liu, 2023). The superposition of edge-driven convention and asthenosphere flow caused by the expansion of the Tibetan Plateau will further reduce the strength of the lithosphere beneath the Trans-North China orogen (Figures 8B,D,F). Thus, the lateral growth of the Tibetan Plateau is most likely to occur in the northeast margin and may affect the Trans-North China orogen.
4.2 Uncertainties of the model
In this study, the push boundary condition on the left side of the model presents the convergence of the Indian and Eurasia plates. However, the convergence of the Eurasia-Pacific plates is also an important driving force that cannot be ignored (Northrup et al., 1995). The subduction of the Paleo-Pacific (Izanagi) plate is regarded as the dominant factor that induced lithospheric thinning of the North China craton in the Mesozoic (Liu et al., 2021a; Zhu and Xu, 2019). The subsequent subduction and roll-back of the Pacific plate lasted to the present and trigged back-arc extension in east China (Liu et al., 2017a). Especially, the Cenozoic big mantle wedge caused by the stagnation of the subducting Pacific slab has contributed to the intraplate volcanism and rifting in East Asia (Liu et al., 2017b; Zhao et al., 2007). The spatial patterns of the fast polarization directions of vertically traveling shear waves also indicate complex upper mantle deformation in east China (Zhao and Xue, 2010). Strain rates of group C models in this study show the deformation of the right part of the craton is under compression, which is not consistent with the observed extensive strain rates in the east part of the North China craton (Figures 8G,H). This may be related to the fact that the pulling force caused by the roll-back of the Pacific plate is not considered in our model (Liu et al., 2021b; Yang et al., 2018). If a tensile force is provided at the right boundary in the numerical model, the lithosphere of the surrounding block will be under extension state according to recent study (Sun and Liu, 2023).
At the same time, there are large differences in the lithosphere thickness between the east and west of the North China craton after being reconstructed. Deep geophysical results indicate that crossing the Ordos, there are low-velocity anomalies and low electrical resistivity under the Trans-North China orogen (Guo et al., 2016; Lei, 2012; Li et al., 2018; Yin et al., 2017), indicating upwelling and downwelling of the asthenosphere beneath the North China craton. Although the existence of the Philippine plate blocks the impact of the westward subduction of the Pacific plate on the South China block (Liu et al., 2021b), similar tomography results are also observed in the upper mantle beneath the South China block (Gao et al., 2022; Ward et al., 2021; Wei et al., 2012). This may imply the existence of small-scale convection in the upper mantle of east China because of the difference in lithospheric structure (King and Anderson, 1995, 1998). These studies show that the complicated lithospheric and upper mantle deformation of east China may be the interaction of the subduction of the Pacific plate, the India-Eurasian collision and small-scale convection (Sun and Liu, 2023).
Furthermore, the two-dimensional model here cannot consider the lateral deformation or mantle flow caused by the India-Eurasian collision. On the northeastern margin of the Tibetan Plateau, the extended plateau not only converges with the western margin of the North China craton but also experienced significant strike-slip and developed a series of pull-apart basins (Zheng et al., 2013). In the east of the Tibetan Plateau, current GPS and geophysical observations show that the plateau material is extruded along the southeastern margin of the plateau and the Qingling orogen (Guo and Chen, 2017; Wang and Shen, 2020). The velocity boundary conditions (20 mm/yr) we impose on all models are the same. Actually, for the region of the eastern and northern margins of the Tibetan Plateau, only the velocity perpendicular to the block boundary should be considered in the two-dimensional model. In this way, the convergence velocity is lower than the current given velocity boundary conditions. Thus, the strain localized on the orogens in the craton may be smaller than present. These lateral deformations may reduce the far-field effects of the India-Eurasian collision because it does not need to overcome great resistance in the case of the pre-existing weak zone (Chen et al., 2020; Kong et al., 1997). Therefore, the Trans-North China orogen and Jiangnan orogen would be more stable in that case. The results of this study will not be changed.
Finally, to test the model in the future, systematic comparisons between the model results and observations should be strengthened. Besides topography and strain rate, other surface geology and geophysical data from multiple disciplines, such as the crustal–lithospheric structure and thermal structure, should be used as much as possible. However, there are still two problems in the comparison of lithosphere structure. On the one hand, the lithosphere structure obtained by varied methods is quite different, such as the lithosphere thickness obtained by temperature and seismology can vary greatly [An and Shi., 2006; Pasyanos et al., 2014]. On the other hand, the lithosphere structure obtained by simulation is highly dependent on the initial structure, which will cause great uncertainty in comparison.
5 Conclusion
By constructing two-dimensional thermal-mechanical numerical models, this study investigated the effects of the rheological heterogeneities and thicknesses of the lithosphere on the deformation of the Tibetan Plateau and neighbouring regions. These results help us understand the far-field effects of the India-Eurasian collision. The main conclusions are as follows.
(1) The lateral rheological heterogeneities of the lithosphere have an important influence on the deformation and strain partitioning during the lateral expansion of the Tibetan Plateau. When the expanding Tibetan Plateau is blocked by a strong peripheral craton, if there is a weak orogen outside the craton, the craton will transmit the strain to the peripheral orogen and reactivate it, such as the Tian Shan orogen. The collision of the subducted Indian mantle lithosphere with the Tarim mantle lithosphere would make the uplift of the Tian Shan orogen more intense.
(2) If there is an ancient orogenic belt in the peripheral craton, the deformation is mainly concentrated in the weak-strength Tibetan Plateau, and the lateral expansion of the plateau is limited by the craton. For example, the Jiangnan Orogen within the South China block is hard to be reactivated by the collision between the Indian and Eurasia plates.
(3) The huge difference in the lithospheric thickness of the craton around the Tibetan Plateau also affects the far-field effect of the India-Eurasian collision. A thinning lithosphere of the craton would reduce the lithospheric strength of ancient orogenic belts within the cratons, thereby favoring the distribution of high strain rates. If upper mantle convection reduces the lithospheric strength of the North China craton, future lateral growth of the Tibetan Plateau would occur in the northeast margin and may affect the Trans-North China orogen.
Data availability statement
The original contributions presented in the study are included in the article/Supplementary Material, further inquiries can be directed to the corresponding author.
Author contributions
YS designed and performed the numerical experiments, interpreted results, and wrote the manuscript. HL contributed to the model interpretation and discussed the results. YS and TF developed the method and code. BL collected the data.
Funding
This study is supported by the National Natural Science Foundation of China (Grant NO. 42022029, 41874114, 41872223).
Acknowledgments
Some figures are plotted by the Generic Mapping Tools (Wessel and Smith, 1998). We thank the reviewers for their constructive suggestions.
Conflict of interest
The authors declare that the research was conducted in the absence of any commercial or financial relationships that could be construed as a potential conflict of interest.
Publisher’s note
All claims expressed in this article are solely those of the authors and do not necessarily represent those of their affiliated organizations, or those of the publisher, the editors and the reviewers. Any product that may be evaluated in this article, or claim that may be made by its manufacturer, is not guaranteed or endorsed by the publisher.
Supplementary material
The Supplementary Material for this article can be found online at: https://www.frontiersin.org/articles/10.3389/feart.2023.1153744/full#supplementary-material
References
Allen, M. B., Windley, B. F., and Zhang, C. (1993). Palaeozoic collisional tectonics and magmatism of the Chinese Tien Shan, central Asia. Tectonophysics 220 (1), 89–115. doi:10.1016/0040-1951(93)90225-9
An, M., and Shi, Y. (2006). Lithospheric thickness of the Chinese continent. Phys. Earth Planet. Interiors 159 (3-4), 257–266. doi:10.1016/j.pepi.2006.08.002
Chen, L., Cheng, C., and Wei, Z. (2009). Seismic evidence for significant lateral variations in lithospheric thickness beneath the central and Western North China Craton. Earth Planet. Sci. Lett. 286 (1), 171–183. doi:10.1016/j.epsl.2009.06.022
Chen, L., Liu, L., Capitanio, F. A., Gerya, T. V., and Li, Y. (2020). The role of pre-existing weak zones in the formation of the himalaya and Tibetan plateau: 3-D thermomechanical modelling. Geophys. J. Int. 221 (3), 1971–1983. doi:10.1093/gji/ggaa125
Chen, Y. H., Roecker, S. W., and Kosarev, G. L. (1997). Elevation of the 410 km discontinuity beneath the central Tien Shan: Evidence for a detached lithospheric root. Geophys. Res. Lett. 24 (12), 1531–1534. doi:10.1029/97GL01434
Chopra, P. N., and Paterson, M. S. (1981). The experimental deformation of dunite. Tectonophysics 78 (1), 453–473. doi:10.1016/0040-1951(81)90024-X
Chopra, P. N., and Paterson, M. S. (1984). The role of water in the deformation of dunite. J. Geophys. Res. Solid Earth 89 (9), 7861–7876. doi:10.1029/JB089iB09p07861
Christensen, U. R., and Yuen, D. A. (1985). Layered convection induced by phase transitions. J. Geophys. Res. Solid Earth 90 (12), 10291–10300. doi:10.1029/JB090iB12p10291
Dayem, K. E., Molnar, P., Clark, M. K., and Houseman, G. A. (2009). Far-field lithospheric deformation in Tibet during continental collision. Tectonics 28 (6). doi:10.1029/2008TC002344
Deng, Y., and Tesauro, M. (2016). Lithospheric strength variations in Mainland China: Tectonic implications. Tectonics 35 (10), 2313–2333. doi:10.1002/2016TC004272
Dyksterhuis, S., and Müller, R. D. (2008). Cause and evolution of intraplate orogeny in Australia. Geology 36 (6), 495–498. doi:10.1130/g24536a.1
England, P., and Houseman, G. (1986). Finite strain calculations of continental deformation 2. Comparison with the India-Asia collision zone. J. Geophys. Res. 91 (3), 3664–3676. doi:10.1029/JB091iB03p03664
England, P., and Houseman, G. (1985). Role of lithospheric strength heterogeneities in the tectonics of Tibet and neighbouring regions. Nature 315 (6017), 297–301. doi:10.1038/315297a0
English, J. M., and Johnston, S. T. (2004). The Laramide orogeny: What were the driving forces? Int. Geol. Rev. 46 (9), 833–838. doi:10.2747/0020-6814.46.9.833
Fullsack, P. (1995). An arbitrary Lagrangian-Eulerian formulation for creeping flows and its application in tectonic models. Geophys. J. Int. 120, 1–23. doi:10.1111/j.1365-246x.1995.tb05908.x
Gao, L., Zhang, H., Gao, L., He, C., Xin, H., and Shen, W. (2022). High-resolution vs tomography of South China by joint inversion of body wave and surface wave data. Tectonophysics 824, 229228. doi:10.1016/j.tecto.2022.229228
Gerya, T. V., and Yuen, D. A. (2003). Characteristics-based marker-in-cell method with conservative finite-differences schemes for modeling geological flows with strongly variable transport properties. Phys. Earth Planet. Interiors 140, 293–318. doi:10.1016/j.pepi.2003.09.006
Guo, Z., Afonso, J. C., Qashqai, M. T., Yang, Y., and Chen, Y. J. (2016). Thermochemical structure of the North China Craton from multi-observable probabilistic inversion: Extent and causes of cratonic lithosphere modification. Gondwana Res. 37, 252–265. doi:10.1016/j.gr.2016.07.002
Guo, Z., and Chen, Y. J. (2017). Mountain building at northeastern boundary of Tibetan Plateau and craton reworking at Ordos block from joint inversion of ambient noise tomography and receiver functions. Earth Planet. Sci. Lett. 463, 232–242. doi:10.1016/j.epsl.2017.01.026
Hansen, U., and Yuen, D. A. (2000). Extended-Boussinesq thermal–chemical convection with moving heat sources and variable viscosity. Earth Planet. Sci. Lett. 176 (3), 401–411. doi:10.1016/S0012-821X(00)00009-1
He, C., and Santosh, M. (2018). Role of mantle dynamics in rebuilding the tianshan orogenic belt in NW China: A seismic tomographic investigation. J. Geodyn. 116, 37–46. doi:10.1016/j.jog.2018.02.006
Hendrix, M. S., Dumitru, T. A., and Graham, S. A. (1994). Late Oligocene-early Miocene unroofing in the Chinese Tian Shan: An early effect of the India-Asia collision. Geology 22 (6), 487–490. doi:10.1130/0091-7613(1994)022<0487:Loemui>2.3.Co;2
Hu, S., He, L., and Wang, J. (2000). Heat flow in the continental area of China: A new data set. Earth Planet. Sci. Lett. 179, 407–419. doi:10.1016/s0012-821x(00)00126-6
Huang, Z., Li, H., Zheng, Y., and Peng, Y. (2009). The lithosphere of North China Craton from surface wave tomography. Earth Planet. Sci. Lett. 288 (1), 164–173. doi:10.1016/j.epsl.2009.09.019
Huangfu, P., Li, Z.-H., Zhang, K.-J., Fan, W., Zhao, J., and Shi, Y. (2021). India-tarim lithospheric mantle collision beneath western tibet controls the cenozoic building of tian Shan. Geophys. Res. Lett. 48 (14), e2021GL094561. doi:10.1029/2021GL094561
Jolivet, M., Dominguez, S., Charreau, J., Chen, Y., Li, Y., and Wang, Q. (2010). Mesozoic and Cenozoic tectonic history of the central Chinese Tian Shan: Reactivated tectonic structures and active deformation. Tectonics 29 (6). doi:10.1029/2010TC002712
King, S. D., and Anderson, D. L. (1995). An alternative mechanism of flood basalt formation. Earth Planet. Sci. Lett. 136 (3), 269–279. doi:10.1016/0012-821X(95)00205-Q
King, S. D., and Anderson, D. L. (1998). Edge-driven convection. Earth Planet. Sci. Lett. 160 (3), 289–296. doi:10.1016/S0012-821X(98)00089-2
King, S. D., and Ritsema, J. (2000). African hot spot volcanism: Small-scale convection in the upper mantle beneath cratons. Science 290 (5494), 1137–1140. doi:10.1126/science.290.5494.1137
Kong, X., Yin, A., and Harrison, T. M. (1997). Evaluating the role of preexisting weaknesses and topographic distributions in the Indo-Asian collision by use of a thin-shell numerical model. Geology 25 (6), 527–530. doi:10.1130/0091-7613(1997)025<0527:etropw>2.3.co;2
Kreemer, C., Blewitt, G., and Klein, E. C. (2014). A geodetic plate motion and global strain rate model. Geochem. Geophys. Geosystems 15 (10), 3849–3889. doi:10.1002/2014gc005407
Lei, J. (2012). Upper-mantle tomography and dynamics beneath the North China craton. J. Geophys. Res. Solid Earth 117 (6). doi:10.1029/2012jb009212
Li, C., van der Hilst, R. D., Meltzer, A. S., and Engdahl, E. R. (2008). Subduction of the Indian lithosphere beneath the Tibetan Plateau and Burma. Earth Planet. Sci. Lett. 274 (1), 157–168. doi:10.1016/j.epsl.2008.07.016
Li, S., Guo, Z., Chen, Y. J., Yang, Y., and Huang, Q. (2018). Lithospheric structure of the northern Ordos from ambient noise and teleseismic surface wave tomography. J. Geophys. Res. Solid Earth 123 (8), 6940–6957. doi:10.1029/2017jb015256
Li, W., Chen, Y., Yuan, X., Xiao, W., and Windley, B. F. (2022). Intracontinental deformation of the Tianshan Orogen in response to India-Asia collision. Nat. Commun. 13 (1), 3738. doi:10.1038/s41467-022-30795-6
Li, X. H. (1999). U–Pb zircon ages of granites from the southern margin of the Yangtze block: Timing of neoproterozoic jinning: Orogeny in SE China and implications for rodinia assembly. Precambrian Res. 97 (1), 43–57. doi:10.1016/S0301-9268(99)00020-0
Li, Y., Wu, Q., Pan, J., Zhang, F., and Yu, D. (2013). An upper-mantle S-wave velocity model for East Asia from Rayleigh wave tomography. Earth Planet. Sci. Lett. 377-378, 367–377. doi:10.1016/j.epsl.2013.06.033
Li, Z.-X., Zhang, L., and Powell, C. M. (1995). South China in rodinia: Part of the missing link between Australia–east Antarctica and laurentia? Geology 23 (5), 407–410. doi:10.1130/0091-7613(1995)023<0407:Scirpo>2.3.Co;2
Liu, L., Peng, D., Liu, L., Chen, L., Li, S., Wang, Y., et al. (2021a). East Asian lithospheric evolution dictated by multistage Mesozoic flat-slab subduction. Earth-Science Rev. 217, 103621. doi:10.1016/j.earscirev.2021.103621
Liu, M., Cui, X., and Liu, F. (2004). Cenozoic rifting and volcanism in eastern China: A mantle dynamic link to the indo–asian collision? Tectonophysics 393 (1), 29–42. doi:10.1016/j.tecto.2004.07.029
Liu, M., and Yang, Y. (2003). Extensional collapse of the Tibetan Plateau: Results of three-dimensional finite element modeling. J. Geophys. Res. 108 (B8), 2361. doi:10.1029/2002JB002248
Liu, Q. Y., van der Hilst, R. D., Li, Y., Yao, H. J., Chen, J. H., Guo, B., et al. (2014). Eastward expansion of the Tibetan Plateau by crustal flow and strain partitioning across faults. Nat. Geosci. 7 (5), 361–365. doi:10.1038/ngeo2130
Liu, S., Gurnis, M., Ma, P., and Zhang, B. (2017a). Reconstruction of northeast Asian deformation integrated with Western Pacific plate subduction since 200Ma. Earth-Science Rev. 175, 114–142. doi:10.1016/j.earscirev.2017.10.012
Liu, S., Ma, P., Zhang, B., and Gurnis, M. (2021b). The horizontal slab beneath East Asia and its subdued surface dynamic response. J. Geophys. Res. Solid Earth 126 (3), e2020JB021156. doi:10.1029/2020JB021156
Liu, X., Zhao, D., Li, S., and Wei, W. (2017b). Age of the subducting Pacific slab beneath East Asia and its geodynamic implications. Earth Planet. Sci. Lett. 464, 166–174. doi:10.1016/j.epsl.2017.02.024
Mareschal, J.-C., and Jaupart, C. (2013). Radiogenic heat production, thermal regime and evolution of continental crust. Tectonophysics 609, 524–534. doi:10.1016/j.tecto.2012.12.001
Molnar, P., and Tapponnier, P. (1975). Cenozoic Tectonics of Asia: Effects of a Continental Collision: Features of recent continental tectonics in Asia can be interpreted as results of the India-Eurasia collision. Science 189 (4201), 419–426. doi:10.1126/science.189.4201.419
Molnar, P., and Tapponnier, P. (1977). Relation of the tectonics of eastern China to the India-Eurasia collision: Application of slip-line field theory to large-scale continental tectonics. Geology 5 (4), 212–216. doi:10.1130/0091-7613(1977)5<212:rottoe>2.0.co;2
Neil, E. A., and Houseman, G. A. (1997). Geodynamics of the Tarim basin and the tian Shan in central Asia. Tectonics 16 (4), 571–584. doi:10.1029/97tc01413
Northrup, C., Royden, L., and Burchfiel, B. (1995). Motion of the Pacific plate relative to Eurasia and its potential relation to cenozoic extension along the eastern margin of Eurasia. Geology 23 (8), 719–722. doi:10.1130/0091-7613(1995)023<0719:MOTPPR>2.3.CO;2
Pasyanos, M. E., Masters, T. G., Laske, G., and Ma, Z. (2014). LITHO1.0: An updated crust and lithospheric model of the Earth. J. Geophys. Res. Solid Earth 119 (3), 2153–2173. doi:10.1002/2013jb010626
Qin, X., Chen, X., Shao, Z., Zhang, Y., Wang, Y., and Li, B. (2022). Cenozoic multi-phase intracontinental deformation of the Tianshan Range (NW China): Constraints from detrital zircon provenance and syn-tectonic sedimentation of the Kuqa Depression. J. Asian Earth Sci. 232, 105183. doi:10.1016/j.jseaes.2022.105183
Ranalli, G. (1997b). Rheology of the lithosphere in space and time. London: The Geological Society, 19–37.
Sun, Y., Dong, S., Fan, T., Zhang, H., and Shi, Y. (2013). 3D rheological structure of the continental lithosphere beneath China and adjacent regions. Chin. J. Geophys. (in Chinese) 56 (5), 546–558. doi:10.1002/cjg2.20052
Sun, Y., Dong, S., Wang, X., Liu, M., Zhang, H., and Shi, Y. (2022). Three-dimensional thermal structure of east asian continental lithosphere. Journal of Geophysical Research Solid Earth 127 (5), e2021JB023432. doi:10.1029/2021JB023432
Sun, Y., Li, H., and Fan, T. (2019). A numerical study of lithospheric deformation and strain partitioning across the longmen Shan orogenic belt, eastern Tibetan plateau. Tectonics 38, 3108–3123. doi:10.1029/2019tc005512
Sun, Y., and Liu, M. (2023). Edge-driven asthenospheric convection beneath the North China craton: A numerical study. Tectonophysics 849, 229726. doi:10.1016/j.tecto.2023.229726
Sun, Y., and Liu, M. (2018). Rheological control of lateral growth of the Tibetan plateau: Numerical results. Journal of Geophysical Research Solid Earth 123, 10124–10141. doi:10.1029/2018jb016601
Tapponnier, P., and Molnar, P. (1979). Active faulting and cenozoic tectonics of the tien Shan, Mongolia, and baykal regions. Journal of Geophysical Research 84 (7), 3425–3459. doi:10.1029/jb084ib07p03425
Tapponnier, P., Xu, Z., Roger, F., Meyer, B., Arnaud, N., Wittlinger, G., et al. (2001). Oblique stepwise rise and growth of the tibet plateau. Science 294, 1671–1677. doi:10.1126/science.105978
Tian, X., Bai, Z., Klemperer, S. L., Liang, X., Liu, Z., Wang, X., et al. (2021). Crustal-scale wedge tectonics at the narrow boundary between the Tibetan Plateau and Ordos block. Earth and Planetary Science Letters 554, 116700. doi:10.1016/j.epsl.2020.116700
Wang, C., Dai, J., Zhao, X., Li, Y., Graham, S. A., He, D., et al. (2014a). Outward-growth of the Tibetan plateau during the cenozoic: A review. Tectonophysics 621, 1–43. doi:10.1016/j.tecto.2014.01.036
Wang, M., and Shen, Z.-K. (2020). Present-day crustal deformation of continental China derived from GPS and its tectonic implications. Journal of Geophysical Research Solid Earth 125 (2), e2019JB018774. doi:10.1029/2019jb018774
Wang, X., Zhang, G., Fang, H., Luo, W., Zhang, W., Zhong, Q., et al. (2014b). Crust and upper mantle resistivity structure at middle section of Longmenshan, eastern Tibetan plateau. Tectonophysics 619–620, 143–148. doi:10.1016/j.tecto.2013.09.011
Ward, J. F., Rosenbaum, G., Ubide, T., Wu, J., Caulfield, J. T., Sandiford, M., et al. (2021). Geophysical and geochemical constraints on the origin of Holocene intraplate volcanism in East Asia. Earth-Science Reviews 218, 103624. doi:10.1016/j.earscirev.2021.103624
Wei, W., Xu, J., Zhao, D., and Shi, Y. (2012). East Asia mantle tomography: New insight into plate subduction and intraplate volcanism. Journal of Asian Earth Sciences 60, 88–103. doi:10.1016/j.jseaes.2012.08.001
Wessel, P., and Smith, W. H. F. (1998). New, improved version of generic mapping tools released. Eos, Transactions American Geophysical Union 79 (47), 579. doi:10.1029/98EO00426
Wilks, K. R., and Carter, N. L. (1990). Rheology of some continental lower crustal rocks. Tectonophysics 182, 57–77. doi:10.1016/0040-1951(90)90342-6
Windley, B. F., Alexeiev, D., Xiao, W., Kröner, A., and Badarch, G. (2007). Tectonic models for accretion of the central asian orogenic belt. Journal of the Geological Society 164 (1), 31–47. doi:10.1144/0016-76492006-022
Xiao, W., Windley, B. F., Allen, M. B., and Han, C. (2013). Paleozoic multiple accretionary and collisional tectonics of the Chinese Tianshan orogenic collage. Gondwana Research 23 (4), 1316–1341. doi:10.1016/j.gr.2012.01.012
Yang, T., Moresi, L., Zhao, D., Sandiford, D., and Whittaker, J. (2018). Cenozoic lithospheric deformation in northeast Asia and the rapidly-aging Pacific plate. Earth and Planetary Science Letters 492, 1–11. doi:10.1016/j.epsl.2018.03.057
Yin, A., and Harrison, T. M. (2000). Geologic evolution of the Himalayan-Tibetan orogen. Annu. Rev. Earth Planet. Sci. 28, 211–280. doi:10.1146/annurev.earth.28.1.211
Yin, Y., Jin, S., Wei, W., Ye, G., Jing, J. e., Zhang, L., et al. (2017). Lithospheric rheological heterogeneity across an intraplate rift basin (Linfen Basin, North China) constrained from magnetotelluric data: Implications for seismicity and rift evolution. Tectonophysics 717, 1–15. doi:10.1016/j.tecto.2017.07.014
Yuan, D.-Y., Ge, W., Chen, Z., Li, C., Wang, Z., Zhang, H., et al. (2013). The growth of northeastern tibet and its relevance to large-scale continental geodynamics: A review of recent studies. Tectonics 32 (5), 1358–1370. doi:10.1002/tect.20081
Zhang, Y., Chen, L., Ai, Y., and Jiang, M. (2019). Lithospheric structure beneath the central and Western North China Craton and adjacent regions from S-receiver function imaging. Geophysical Journal International 219 (1), 619–632. doi:10.1093/gji/ggz322
Zhang, Z., Teng, J., Romanelli, F., Braitenberg, C., Ding, Z., Zhang, X., et al. (2014). Geophysical constraints on the link between cratonization and orogeny: Evidence from the Tibetan Plateau and the North China craton. Earth-Science Reviews 130, 1–48. doi:10.1016/j.earscirev.2013.12.005
Zhao, D., Maruyama, S., and Omori, S. (2007). Mantle dynamics of western pacific and east Asia: Insight from seismic tomography and mineral physics. Gondwana Research 11 (1), 120–131. doi:10.1016/j.gr.2006.06.006
Zhao, G., Cawood, P. A., Wilde, S. A., Sun, M., and Lu, L. (2000). Metamorphism of basement rocks in the central zone of the North China craton: Implications for paleoproterozoic tectonic evolution. Precambrian Research 103 (1), 55–88. doi:10.1016/S0301-9268(00)00076-0
Zhao, G. (2001). Palaeoproterozoic assembly of the North China craton. Geological Magazine 138 (1), 87–91. doi:10.1017/s0016756801005040
Zhao, G., Sun, M., Wilde, S. A., and Sanzhong, L. (2005). Late archean to paleoproterozoic evolution of the North China craton: Key issues revisited. Precambrian Research 136 (2), 177–202. doi:10.1016/j.precamres.2004.10.002
Zhao, J., Yuan, X., Liu, H., Kumar, P., Pei, S., Kind, R., et al. (2010). The boundary between the Indian and Asian tectonic plates below Tibet. Proceedings of the National Academy of Sciences 107 (25), 11229–11233. doi:10.1073/pnas.1001921107
Zhao, L., and Xue, M. (2010). Mantle flow pattern and geodynamic cause of the North China Craton reactivation: Evidence from seismic anisotropy. Geochemistry, Geophysics, Geosystems 11 (7). doi:10.1029/2010gc003068
Zhao, L., and Zheng, T. (2007). Complex upper-mantle deformation beneath the North China craton: Implications for lithospheric thinning. Geophysical Journal International 170 (3), 1095–1099. doi:10.1111/j.1365-246X.2007.03512.x
Zheng, W.-j., Zhang, P.-z., He, W.-g., Yuan, D.-y., Shao, Y.-x., Zheng, D.-w., et al. (2013). Transformation of displacement between strike-slip and crustal shortening in the northern margin of the Tibetan Plateau: Evidence from decadal GPS measurements and late Quaternary slip rates on faults. Tectonophysics 584, 267–280. doi:10.1016/j.tecto.2012.01.006
Zhu, R., Chen, L., Wu, F., and Liu, J. (2011). Timing, scale and mechanism of the destruction of the North China Craton. Science China Earth Sciences 54 (6), 789–797. doi:10.1007/s11430-011-4203-4
Keywords: Tibetan Plateau, lithospheric deformation, craton, rheological heterogeneity, numerical model
Citation: Sun Y, Li H, Fan T and Li B (2023) Effect of rheological heterogeneities on the lithospheric deformation of the Tibetan Plateau and neighbouring regions. Front. Earth Sci. 11:1153744. doi: 10.3389/feart.2023.1153744
Received: 30 January 2023; Accepted: 09 March 2023;
Published: 21 March 2023.
Edited by:
Jie Liao, Sun Yat-sen University, ChinaReviewed by:
Yujiang Li, Ministry of Emergency Management, ChinaPengpeng Huangfu, University of Chinese Academy of Sciences, China
Copyright © 2023 Sun, Li, Fan and Li. This is an open-access article distributed under the terms of the Creative Commons Attribution License (CC BY). The use, distribution or reproduction in other forums is permitted, provided the original author(s) and the copyright owner(s) are credited and that the original publication in this journal is cited, in accordance with accepted academic practice. No use, distribution or reproduction is permitted which does not comply with these terms.
*Correspondence: Yujun Sun, c3VueXVqdW5hYmNAMTYzLmNvbQ==