
95% of researchers rate our articles as excellent or good
Learn more about the work of our research integrity team to safeguard the quality of each article we publish.
Find out more
ORIGINAL RESEARCH article
Front. Earth Sci. , 12 July 2023
Sec. Structural Geology and Tectonics
Volume 11 - 2023 | https://doi.org/10.3389/feart.2023.1149678
This article is part of the Research Topic Advanced Methods for Interpreting Geological and Geophysical Data View all 36 articles
 QiQi Ma*
 Taizhong Duan
Ultra-deep carbonate fault-controlled reservoirs are characterized by large burial depths, low dissolution degrees, strong heterogeneity, and limited effective well data. Accurate 3D characterization based on seismic data is essential for efficient development of this type of reservoir. However, traditional seismic prediction methods are insufficient to accurately characterize different reservoir levels in the exploration and development of fault-controlled ultra-deep reservoirs. We propose a set of improved multi-level characterization methods for fault-controlled reservoirs. The improved methods could recover seismic information obscured by strong reflections and reduce the uncertainty of seismic interpretation. This study combined seismic strong reflection suppression and sedimentary strata seismic reflection interference elimination, proposed improved inversion methods, and advanced attribute calculation methods to improve the identification accuracy of reservoirs. In particular, we proposed the karst cave carving method based on improved inversion method and karst cave enhancement algorithm, the dissolved pore zone identification method based on optimization energy envelope algorithm, and the fault-fracture zone characterization method based on optimized atomic decomposition texture contrast. These methods were thoroughly validated by theoretical 3D models and field data. The proposed multi-level characterization methods can effectively improve the identification accuracy of fault-controlled karst reservoirs, provide a benchmark for predicting similar strong heterogeneous carbonate reservoirs, and provide reliable support for further facies modeling.
Carbonate fault-controlled reservoirs are a type of reservoir formed by multi-stage tectonic evolution and fluid dissolution, characterized by caverns, dissolution pores, and fractures of different stages and levels (McDonnell et al., 2007; Jhosnella et al., 2012; Li et al., 2016). Although carbonate karst reservoirs are rare worldwide, they hold a significant amount of oil and gas resources (Soudet et al., 1994; Dembicki and Machel, 1996; Loucks et al., 2004; Chen et al., 2005; Janson et al., 2010; Ning et al., 2022). For example, in the Tarim Basin in western China, Ordovician paleokarst oil and gas resources account for 72.84% of the total basin resources (Yang et al., 2007). In addition, numerous carbonate karst oilfields such as Tahe, Lunnan, and Tazhong have been discovered in the Tarim Basin (Liang, 2008; Zhai and Yun, 2008). Many significant oil and gas discoveries in the Tarim Basin in recent years have been fault-controlled karst reservoirs, emphasizing the need to explore ultra-deep fault-controlled karst reservoirs. Due to continuous exploration and research in geology, geophysics, drilling, logging, testing and other relevant theories and technologies, remarkable exploration progress has been made in the deep and ultra-deep (7,200–8,000 m buried depth) Ordovician carbonate system in the Tarim Basin and similar other geological provinces (Khan et al., 2020a; Khan et al., 2020b). Ordovician oil and gas resources in the Shunbei field are estimated to have a total of 1.7 billion tons (Ma et al., 2022).
Well data in the target zone of fault-controlled karst reservoirs are limited due to technical factors such as drilling fluid leakage or drilling tool loss, and drilling depth is often limited to the surface layer. Nevertheless, these reservoirs usually exhibit significant vertical extent and diversity (Smosna et al., 2005; Qi and Yun, 2010; Deng et al., 2018; Li et al., 2019). Therefore, characterization methods based on 3D seismic data are crucial for understanding fault-controlled karst reservoirs. In the exploration and development of fault-controlled karst reservoirs, emphasis is now placed on accurately characterizing the spatial location and quantitatively describing the different reservoir types, which is a challenging task. Several studies have been conducted to investigate the techniques for characterizing these reservoirs, including the use of seismic properties such as amplitude variation rate, peak frequency amplitude, P-impedance, waveform classification, coherent volume, and curvature, among others (Hardage t al., 1996; McMechan et al., 2002; Han et al., 2006; Zhao et al., 2010; Wang et al., 2014; Burberry et al., 2016). However, in locations with significant epigenic dissolution, such as the Tahe field, these strategies are most effective. Recent studies have also investigated the characterization of ultra-deep fault-controlled karst reservoirs in the Shunbei field, describing large caves with facies-controlled P-impedance or instantaneous energy, describing dissolution pores with amplitude variance and discontinuous properties (such as coherence and semblance), and identifying fault and fracture zones with gradient structure tensor or fault-likelihood (Li et al., 2020; Liu et al., 2020; Wen et al., 2020; Liu et al., 2021).
3D seismic characterization methods for ultra-deep karst reservoirs in Shunbei are now showing potential. However, current approaches still have drawbacks. The reservoirs are often buried very deeply and the accuracy of seismic reflection imaging of the target layer is limited. Additionally, due to weak epigenic karstification, the seismic reflection of the reservoir is susceptible to interference from strong seismic reflection and the sedimentary stratigraphic reflection, resulting in a high degree of multi-solution. In order to solve the above problems, our research has innovated the methods of identifying the ultra-deep fault-controlled reservoirs, which includes the following points: We have constructed a new inversion objective function based on an optimized low-frequency model, which improves the accuracy of P-impedance inversion and provides a high-quality database for subsequent large cave identification; In order to further improve the accuracy of cave identification, we created a three-dimensional sedimentary strata parameter calculation method as well as a nonlinear expression, which led to another very significant improvement in the accuracy of cave identification; Based on the energy envelope algorithm, phase transformation processing and sedimentary strata suppression algorithm, we constructed an expression to find the dissolved pore and fracture zones, which effectively reduces the interference effect of sedimentary strata on the identification of the dissolved pore and fracture zone and makes the calculation results describe the real location of the target; Through the study, we proposed to use the matching pursuit algorithm in the wave decomposition process, which can effectively suppress the interference of strong seismic reflections, and combined with the improved texture attributes and PCA optimization processing method to effectively improve the identification of the fracture zone. The efficiency of the proposed methods has been demonstrated through forward modeling studies and field applications in the Shunbei area.
The Shunbei area is located in the hinterland of the Tarim Basin to the northwest of the Shuntuogole Low Uplift (Qi, 2020) (Figure 1A). The Shunbei field is a typical ultra-deep oil and gas reservoir. The main target formation is located at a depth of more than 7,800 m. The Tarim Basin is located on the northwest side of China’s Qinghai-Tibet Plateau, south of the Junggar Basin. It is a large kratonic basin in western China. The overall topography of the Tarim Basin is high in the west and low in the east, with an area of 56 × 104 km2, making it the largest inland basin in China. The Shunbei field is bounded to the east and west by the Manjiar and Awati depressions. It is bounded to the south and north by the Tazhong and the Tabei uplifts. Apart from the absence of Jurassic deposits, the stratigraphy of the area is well developed. The Cambrian-Middle Ordovician has stable shallow-water carbonate platforms that provide the basis for the formation of fault-controlled reservoirs. In the Shunbei field, the oil and gas exploration and development targets are the Yijianfang and Yingshan formations of the Ordovician strata. The Ordovician strata are divided from bottom to top into the Penglaiba (dolomite), Yingshan (sandy dolomite), Yijianfang (sandy dolomite), Qiaerbake (sandy dolomite), LiangliTahe (sandy dolomite), Santamu (sandstone) and Kepingtage (mudstone) formations (Figures 1B, D).
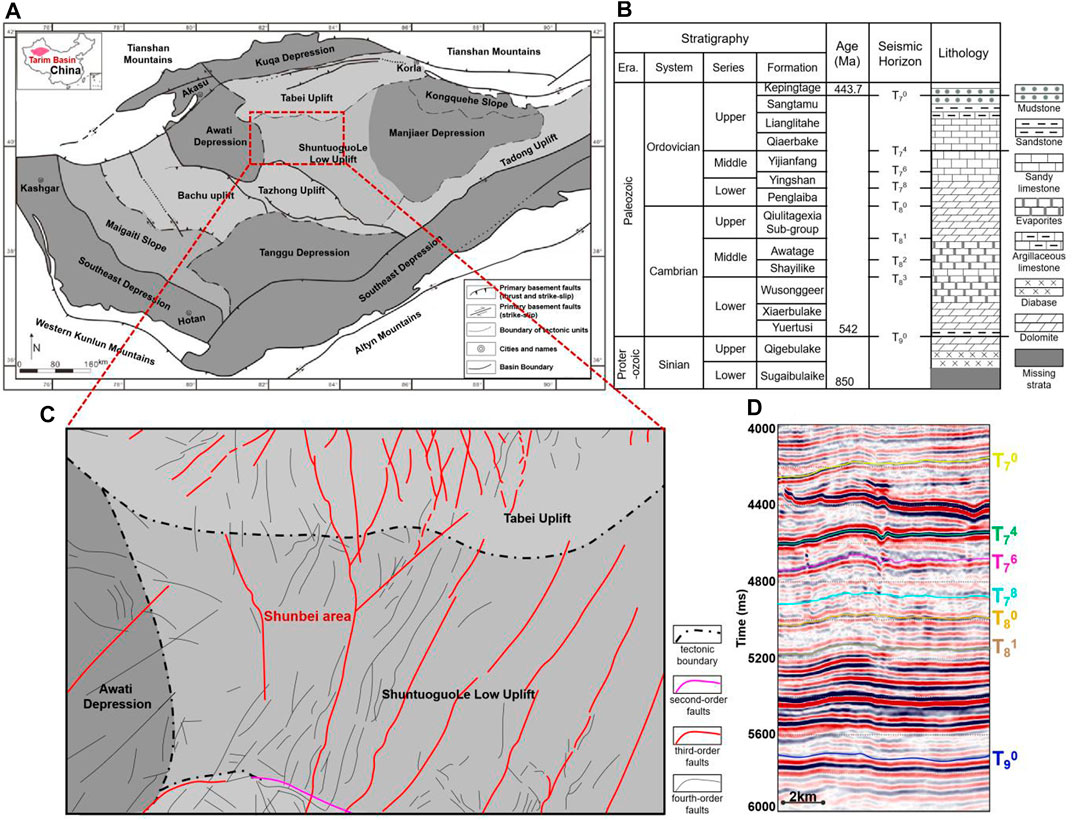
FIGURE 1. Geological and tectonic background. (A) Main tectonic units in the Tarim Basin (modified from Deng et al., 2019); (B) Stratigraphic succession, seismic horizon and lithology of the Shunbei Oilfield; (C) Location and structural setting of the Shunbei area; (D) Typical seismic profile and seismic horizon.
The Shunbei field has undergone multi-stage tectonic evolution and karstification stages (Figure 1C). At the end of the Middle Ordovician, the Tabei and Tazhong uplifts began to rise, the stable carbonate platform in the Tarim Basin began to diverge, and the ShuntuoguoLe Low Uplift began to form; At the end of the Late Ordovician, the Tabei and Tazhong uplifts were again strongly uplifted, and the ShuntogoLe Low uplift was again strongly subsided and finally formed. Small to medium scale strike-slip faults of different levels and orientations are developed in the ShuntuoguoLe Low Uplift. Subsequently, the ShuntuoguoLe Low Uplift has long been located in a stable tectonic part of the Tarim Basin hinterland, maintaining long-term stable overall subsidence. Pre-existing strike-slip faults have undergone multiple phases of inherited strike-slip resurgence, but the overall tectonics has not changed. As a result, the reservoir characteristics and reservoir types in the Shunbei field are extremely diverse. In contrast to the Tabei uplift, the structural position of the Shunbei field has long been relatively low. Both the degree of regional unconformity and epigenetic karst are both relatively underdeveloped. Large-scale strike-slip faults significantly control the distribution of oil and gas reservoirs. The reservoir space consists primarily of a fracture-cave system formed by structural faults (including large caves, structural fractures and structural breccia fractures). There are also secondary reservoirs such as dissolution cavities and pores developed along faults and fractures. Most of the reservoirs are distributed along the main strike-slip fault zone (Qi, 2020; Yun, 2021; Ma et al., 2022).
During the formation of strike-slip faults, the stress field and fluid dissolution are mainly responsible for the formation of the reservoir space of the Shunbei target layers. The most severe rock damage occurs in the core of the main fault under the influence of stress. As the fault expands from its center to its sides, the breccia zone eventually changes into the fracture fragmentation zone, followed by the tight surrounding rock. Under the effects of stress and fluid dissolution, the breccia and fracture spaces can further expand to form additional reservoir spaces, including large caves, fault cavities, and fracture cavities.
Based on typical outcrops (Figure 2A), well data, and seismic characteristics (Figure 2B), reservoirs in the study area can be divided into three categories: large cave zone (red area in Figure 2C), dissolved pore and fracture zone (yellow area in Figure 2C), and fault-fracture zone consisting of inter-gravel fracture, intra-gravel fracture, and tectonic fractures (pink area in Figure 2C) (Li et al., 2019). According to drilling and geological studies, high-quality fault-controlled reservoirs are typically developed along main faults. Different reservoir types are combined and superimposed. Due to engineering reasons, it is often difficult to obtain logging curves of fault-controlled reservoirs. Consequently, drilling fluid leakage and the tool loss are often used as important indicators of reservoir quality. The large cave zone is characterized by a large decrease in P-wave velocity, a significant change in the drilling time curve, and a predominance of “beaded reflection” or “cluttered weak reflection” in the seismic reflection. The dissolved pore and fracture zone is characterized by a modest drop in P-wave velocity, an anomalous drilling time, and a predominance of “chaotic reflection” in the seismic reflection. As for the fault-fracture zone, it is typically characterized by an anomalous discrepancy in resistivity values between deep and shallow curves, minor changes in drilling time curves, and a more chaotic seismic reflection with a wider spatial spread. The goal of this research is to develop effective and reliable new methods for fault-controlled karst reservoir identification that will increase precision and reduce uncertainty. The faults in Figure 2 are calculated using deep learning and are not the focus of the methods addressed in this research.
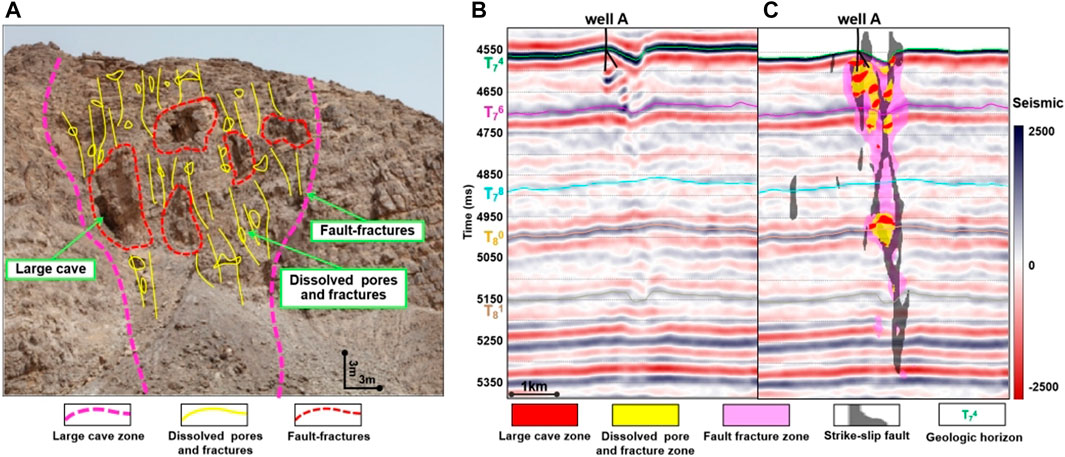
FIGURE 2. Outcrops and geological model cross-section of the fault-controlled karst reservoir in the Shunbei field. (A) Outcrops; (B) Seismic data; (C) Different reservoir zones in the Shunbei field.
This research investigates the identification of ultra-deep fault-controlled karst reservoirs by integrating outcrop, logging, drilling, and seismic data. The 1 Zone and 5 Zone in Shunbei are selected for case study. The Ordovician Yijianfang Formation and Yingshan Formation are the target strata, with burial depths exceeding 7,800 m. By utilizing the obtained high-precision 3D seismic data and guided by well data and geological knowledge, this study establishes combined well-seismic methods for the identification of multi-level fault-controlled karst reservoirs.
In the Shunbei 1 and 5 zones of the study area, the Yijianfang Formation and the Yingshan Formation have 3 wells with conventional logging curves, such as density, P-wave velocity, gamma and resistivity curves, which can be used to analyze reservoir properties. Moreover, 31 wells provide information on the location of drilling fluid leakage or lost drilling tool, a critical factor for effective reservoir identification (Duan et al., 2020).
The observed seismic data in the study area has a bin size of 25 m × 25 m, a sample interval of 1 ms, and a dominant seismic frequency of 19 Hz. The seismic frequency is mainly distributed between 7 and 40 Hz. In order to more accurately depict the distribution of the reservoirs, this study applied a deep learning algorithm to interpret the faults. The main geological horizons are T74, T76, T78, T80, and T81 (Figures 1B, D). In order to effectively identify the Shunbei fault-controlled karst reservoirs, a variety of reservoir identification methods have been improved and applied with satisfying results. In this section, the optimization methods are elaborated.
Generally, large caves form at the end of the dissolution process, as a result of the dissolution of tight limestone by surface water or deep hydrothermal fluids along faults. The longer the period of dissolution, the greater the potential for the formation of large caves. During tectonic evolution, some of these cavern reservoirs may be subsequently filled. Depending on the amount of filling, caverns can be further categorized as either unfilled or filled. Unfilled caves provide a high-quality reservoir space. When drilling this type of reservoir, drilling fluid leakage and drilling tools loss are possible. Under the influence of flowing water and gravity, certain caverns frequently fill with sediments, typically a complex mixture of sand and mud. The intergranular pore is the primary reservoir of the cave.
There are generally two types of seismic identification methods for large karst caves. The first is an attribute calculation-based identification method (Cheng et al., 2020), which directly extracts attributes from observed seismic data. This method is simple and convenient, and it fully respects the seismic reflection. However, it is also prone to errors in the location, number, and volume of identified caves due to the influence of the wavelet. The second method is an inversion of geological parameters, which can eliminate the wavelet effect to restore the cave position and achieve a more accurate cave volume (Hamid, et al., 2018; Li et al., 2020; Liu et al., 2020). However, for the Shunbei karst reservoirs with low dissolution degree, the conventional inversion of the karst cave reflection is easily confused with the strong stratigraphic reflection, resulting in low imaging accuracy (Figure 3). The inverted P-impedance in Figure 3B is obtained from the seismic data in Figure 3A. In Figure 3B, the bright yellow color indicates low impedance. Because karst caves are more porous than the surrounding rocks, their velocity and density are lower, resulting in a drop in P-impedance. The arrows in Figure 3B show that the caves are submerged due to the low impedance interference from the stratigraphic reflection, making it difficult to distinguish their shapes.
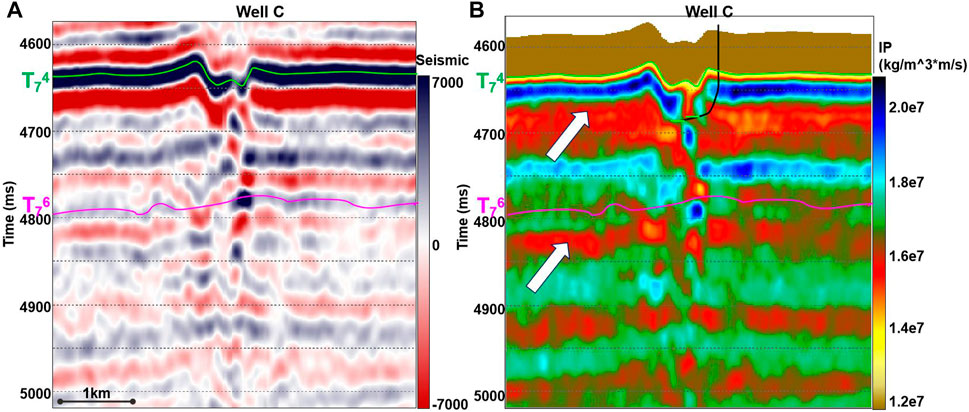
FIGURE 3. Conventional P-impedance inversion result profile. (A) Seismic reflection amplitude; (B) Inverted P-impedance obtained by conventional inversion.
To solve the problem that conventional inversion methods are difficult to accurately characterize large caves, a new cave identification method is proposed in this study. The improvements cover three aspects. First, a low-pass filter term is constructed using the Hanning window function and Fourier transform. The new term can optimize the objective function of the inversion, thus improving the accuracy of the inversion results. Second, based on the joint constraint of well logging and seismic attributes, an improved low-frequency model is constructed to ensure accuracy and characterize the lateral heterogeneity features. This provides an optimization constraint for the improved inversion method. Third, a background interference reflection suppression calculation method is established to realize the extraction of background interference reflection based on the dynamic window, on which the nonlinear transformation equation is constructed to obtain high accuracy identification results of large caves.
Impedance inversion methods can be classified into two categories: stochastic statistical inversion and deterministic inversion. The accuracy of the former is highly dependent on the quantity and quality of logging data. However, there are few P-impedance curves in fault-controlled reservoir target layers. Stochastic statistical inversion tends to generate high-frequency deviations, making it difficult to achieve ideal results. In this study, the deterministic inversion method was chosen for P-impedance inversion, and the traditional inversion objective function is as follows:
In Eq. 1,
In Eq. 3,
The heterogeneity of the reservoirs can be highlighted by the new P-impedance inversion method. However, there are still low-impedance anomalous disturbances from sedimentary strata near the reflections from karst caves. The use of a single threshold value in cave detection can lead to an illusion. To further improve the accuracy of karst cave detection, a background interference reflection suppression calculation is proposed to eliminate the interference.
First, mathematical methods are employed to obtain the background trend of a 3D data volume. The karst cave reflection can be obtained by separating the P-impedance background trend from the inverted P-impedance. The calculation of background trend analysis has been applied to coal seam contours mapping, surface chemical exploration, and structural horizon trend calculation, etc. These situations all focus on processing 2d horizons. Typically, 2D trend horizons are fitted using polynomials. However, the 2d trend horizon fitting polynomials cannot be directly used to obtain the 3D background trend. To address this issue, this paper proposes a 3D background trend calculation method. The specific methodologies of calculation are as follows:
Under the constraints of the stratigraphic framework, point
Using the above method, the background trend data (
In Eq. 4,
Around caves and faults, it can be seen from the outcrop that there are associated dissolved pore and fracture zones. These zones are formed primarily by the dissolution and widening of small-to medium-sized fractures on either side of strike-slip faults. This type of reservoir consists of dissolved pore and fracture networks. Its distribution is controlled by strike-slip faults, which serve as both reservoir space and communication channel (Cheng et al., 2020). Therefore, for a comprehensive analysis of fault-controlled reservoirs, it is crucial to correctly identify this reservoir type. This section focuses on the identification of this type of reservoir and proposes a modified method to improve the accuracy of the identification.
Due to the influence of pores and fractures, the seismic reflection of dissolved pore and fracture zones typically displays anomalies. These anomalous responses can be amplified by the energy envelope (
In Eq. 5,
Due to the strong influence of the sedimentary strata and the unconformity surface, it is impossible to precisely define the boundary of the dissolved pore and fracture zones. This can lead to interference responses, which may result in overestimation of the volume of this type of reservoir. In order to diminish the interference caused by the sedimentary strata and the unconformity surface, the background trend suppression method proposed in Section 4.2 is still utilized to optimize the seismic data and eliminate the interference. The phase shift transformation is then applied to restore the exact location of the characteristic reservoir. Based on Eq. 5, the energy envelope (
In Eq. 6,
During the formation of strike-slip faults, tectonic stress and fluid dissolution result in the formation of fault-fracture zones consisting of micro-fractures. These percolation-capable zones form primarily around the main faults. The fault-fracture zones serve as vital flow channels for reservoirs. Their distribution characteristics have a significant impact on the extent of karst reservoirs. The seismic events of the fault-fracture zones are often chaotic and irregular (Figure 2). By precisely characterizing the fault-fracture zone, one can not only determine the extent of the fault-controlled reservoir, but also effectively constrain its interior description and reservoir modeling.
Interior fault characteristics of fault-controlled reservoirs are typically described using conventional fault attributes (e.g., coherence, curvature, etc.). For instance, the eigenvalue coherent is sensitive to discontinuous seismic events, and its recognition results are often linearly distributed, which is insufficient to accurately describe the distribution of fault-fracture zones. The structural tensor algorithm is extensively used to address the problem of fault-fracture zone identification in the Shunbei field (Li et al., 2020; Liu et al., 2020). In the case of high degree of dissolution, the detection performance of the gradient structure tensor is better. However, the region of the Shunbei field with low degree of dissolution is strongly influenced by strong seismic reflection events. The structural tensor data can only partially describe large karst caves with low dissolution, as demonstrated by the practical application. To address the problem of fault-fracture zone identification, this study proposes a method that improves the detection accuracy of fault-fracture zones and is applicable to fault-fracture bodies with different degrees of dissolution.
Figure 2 clearly demonstrates that the seismic reflection of the fault-fracture zone is disorganized. Texture is a measure that reflects the uniformity or smoothness of the target. Texture roughness can characterize disorganized features in terms of texture feature analysis. The coarser the texture, the more developed the fracture zone. In characterizing the spatial relationship and amplitude pattern of seismic data, the gray level co-occurrence matrix algorithm (Gao, 2011) can extract texture features from seismic data. In this research, this algorithm has been applied to the detection of fault-fracture zones.
The gray level co-occurrence matrix texture feature algorithm considers the seismic amplitude as the gray level of the image, and various amplitude values correspond to pixels of different gray levels (Gao, 2003). If the amplitude of seismic data with a given window range is divided into
Based on the grayscale texture matrix
When the difference between
In order to further optimize the ability of gray-level co-occurrence matrix to characterize heterogeneity, a grayscale texture contrast algorithm is presented in this research. On the basis of the calculated gray level co-occurrence matrix
In above equations,
There are still issues, although the fact that the grayscale texture contrast method can effectively characterize the distribution of fault-fracture zones. The interference is caused by the strong seismic reflection shielding effect of the T74 unconformity surface. Typically, the observed seismic reflection events consist of a group of compound harmonics. The effective reflection in the lower part of the reservoir is obscured by the strong seismic reflection of the unconformity interface. Consequently, it is challenging to identify the fault-fracture zone. In order to extract effective data from seismic data and suppress the shielding effect, we explored a set of methods for optimizing the observed seismic. Wavelet decomposition is a seismic attribute analysis technique based on waveform characteristics. It can transform seismic data into the frequency domain and decompose the original seismic data into a series of wavelets with varying shapes and dominant frequencies (Zhu et al., 2016). These series of wavelets can be considered as atoms of seismic data. Their equations are as follows:
In Eq. 11,
Atoms can be extracted using Morlet wavelet, Gaussian function, Hamming window function, Hanning window function, etc. This paper employs the matching pursuit method (Sinha, et al., 2005; Yang et al., 2021). The matching pursuit method not only improves the resolution in the frequency domain, but also in the time domain. It is able to perform the atomic decomposition of seismic waves and extract the effective information from them, thereby reducing the shielding effect of strong reflection events. Texture contrast attribute for fault-fracture zone identification can be calculated based on strong seismic reflection suppression. However, due to a certain amount of noise interference after the strong seismic reflection suppression, the subsequent predictions still contain anomalous responses. The reason is that these interference noises are confused with fractures when calculating the fault-fracture zone, which leads to errors. To solve this problem, the interference noise was reduced using the Principal Component Analysis (PCA) algorithm after strong seismic reflection suppression. The fault-fracture zone was then calculated using the data that after strong seismic reflection suppression, PCA denoising and texture contract calculation.
In order to verify the effectiveness and applicability of the new method developed in this study, it was tested and applied based on the forward numerical model as well as the field observation data of the Shunbei area. This section is divided into four parts, the first to third subsections include the comparison of the results obtained by our proposed new method for the identification of large cave zones, dissolved pore and fracture zones, and fault-fracture zones with those calculated by conventional methods. The last subsection shows the effect of applying the new method of comprehensive use of multi-scale identification to the field data in Shunbei area. In each of these sections, the application effect of each method is discussed in detail.
To evaluate the effectiveness of the P-impedance inversion method proposed in Section 4.2.1, data from a research area in the Shunbei 1 Zone were selected (Figure 4A). Figures 4B, C compare P-impedance inversion results before and after improvement. The well point in Figure 4 is the measured P-impedance curve. In comparison, the conventional inversion results show obvious low-frequency banding effects (black circles in Figure 4B). However, for fault-controlled reservoirs with strong heterogeneity and few well data, this method reduces the ability to characterize reservoir heterogeneity and easily obscures details of lateral changes. If the reservoirs are identified based on these inversion results, there will be a significant error in reserve estimation. In contrast, the new method can more accurately reflect the characteristics of caves (Figure 4C). The new inversion results are more consistent with geological understanding. To quantify the new inversion method, a cross plot analysis of the measured P-impedance (y-axis data in Figures 4D, E) and the inverted P-impedance (x-axis data in Figures 4D, E) was performed. The measured data in Figures 4D, E are the logging data after filtering and resampling to the seismic frequency range. The inverted P-impedance is extracted from the pseudo wells. It can be seen that the distribution of the two is basically in the range of the 45° slope in Figure 4E. The correlation coefficient between measured and inverted data based on the new method is 0.86971 (Figure 4E), while the correlation coefficient based on the conventional method is 0.582894 (Figure 4D). The new inversion method provides reliable data for subsequent characterization of karst caves.
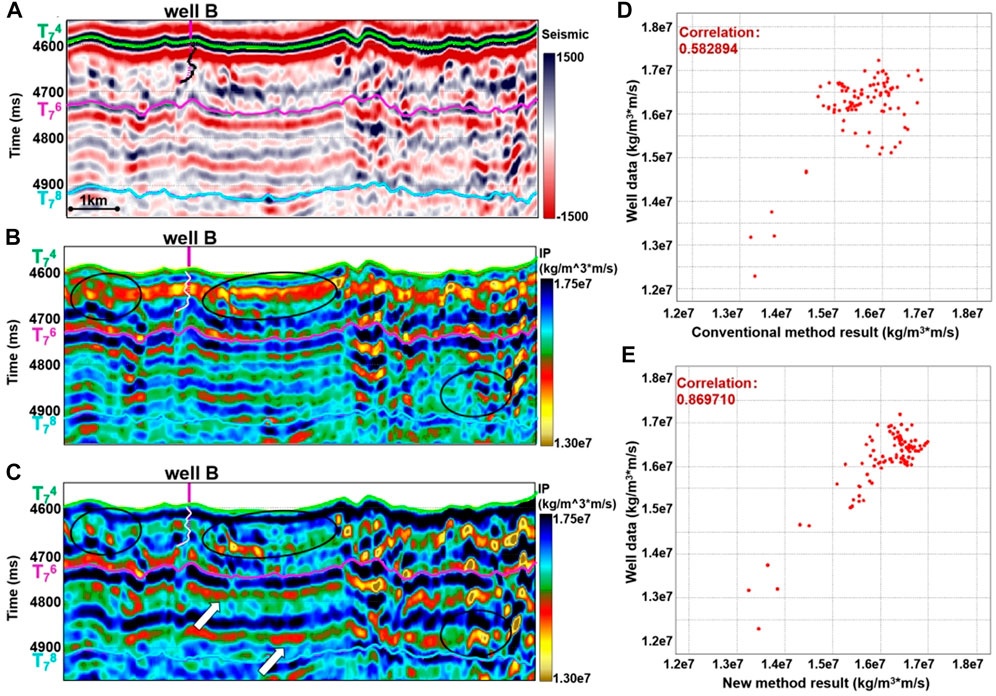
FIGURE 4. Comparison of P-impedance inversion results before and after improvement. (A) Seismic; (B) Inverted P-impedance by conventional inversion; (C) Inverted P-impedance by the improved method; (D) Crossplot of the measured logging data and the conventional P-impedance inversion results; (E) Crossplot of the measured logging data and the improved P-impedance inversion results.
To verify the effectiveness of the proposed cave identification method, we constructed a 3D karst cave model based on the observed data from the Shunbei field (Figure 5A). The model includes feathers of karst caves and sedimentary strata. The arrows in Figure 5A indicate the locations of the karst caves. To create the synthetic seismic records, the reflection coefficient was calculated using this geological model and convolved with a wavelet with a dominant frequency of 25 Hz (Figure 5B). According to the synthetic records, caves developing at the top of the target layer are easily obscured by sedimentary strata (inside the black ellipse). Figure 5C illustrates the inverted P-impedance derived from the seismic in Figure 5B. The inverted results improve the resolution of the caves compared to the seismic reflection, but are still affected by the low impedance of the sedimentary strata. For instance, as shown in Figure 5C, the shallow low impedance stripe response interferes with the reflection of the caves within the red ellipse, making it difficult to discern the contour of the caves. When carving the cave with the threshold value, the response of the cave inside the yellow ellipse is more susceptible to removal than that of the shallow low-impedance strip. This problem may cause the following cave identification to be incorrect. Figure 5D presents the
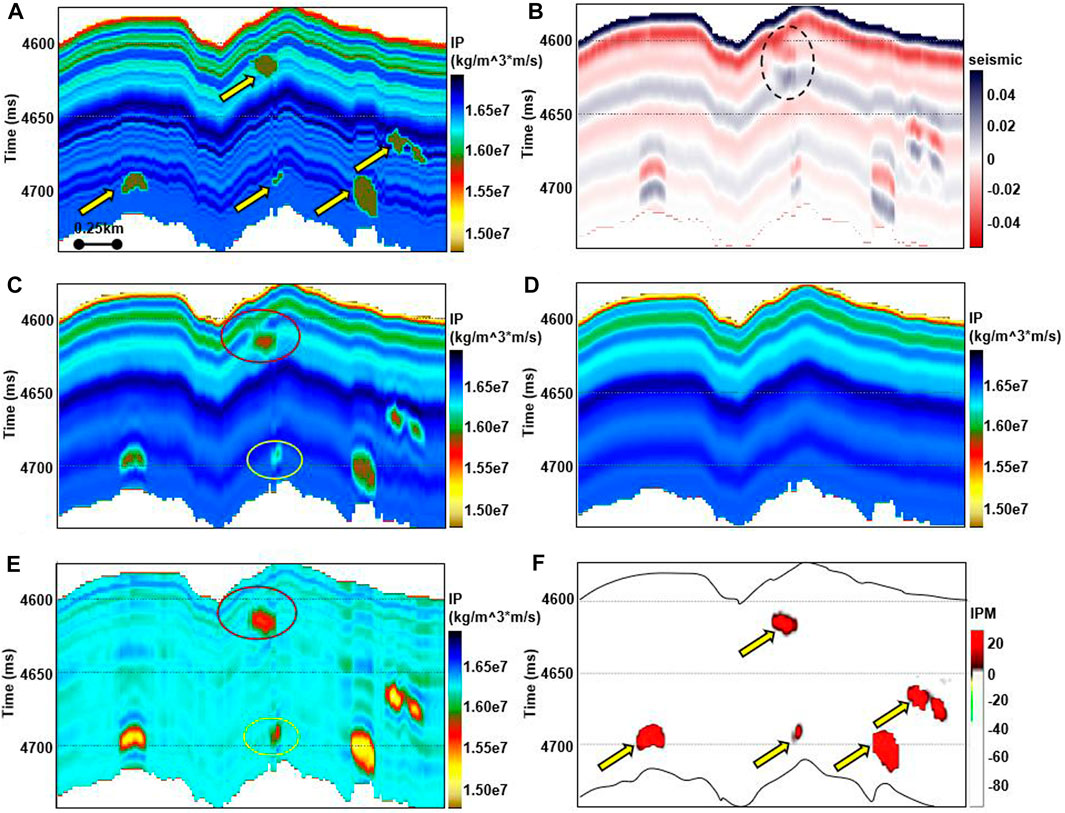
FIGURE 5. 3D model cross-section of karst caves. (A) Geological model; (B) Synthetic seismic data; (C) Inverted P-impedance; (D) P-impedance background trend; (E) P-impedance with background interference suppression; (F) Predicated karst caves.
To further verify the applicability of the proposed method, an application area in the Shunbei field was selected. The Shunbei field has a lower degree of dissolution than the Tahe field, and its fault-controlled reservoirs are more developed. In addition, the cave reflection in the Shunbei field is weaker than that in the Tahe field, making it more susceptible to being confused with the reflection of sedimentary strata. Figure 6 shows a cross section of the Shunbei 5 Zone through a well. In the figure, the black curve represents the well trajectory. The green markers indicate the location of drilling fluid leakage, indicating the presence of reservoirs. Figure 6A shows the seismic reflection amplitude data. Figure 3B shows the conventional inverted results. Figure 6B shows the P-impedance obtained with the new inversion method. Comparing Figure 6B to Figure 3B, the new method provides more information and can more accurately represent horizontal heterogeneity. The bright red color in Figure 6B indicates a low-impedance value, revealing that the response of the caves is obscured by the low-impedance of the sedimentary strata (as indicated by the arrows in Figure 6B). And the exterior contours of the caves are difficult to identify. Figure 6C shows the cave results predicted by the new identification method. The results are in excellent agreement with the reservoir position revealed by the drilling data. In addition, the caves are concentrated around the main faults, and their size gradually decreases from the shallow to the deep target layer, which is consistent with geological theory.
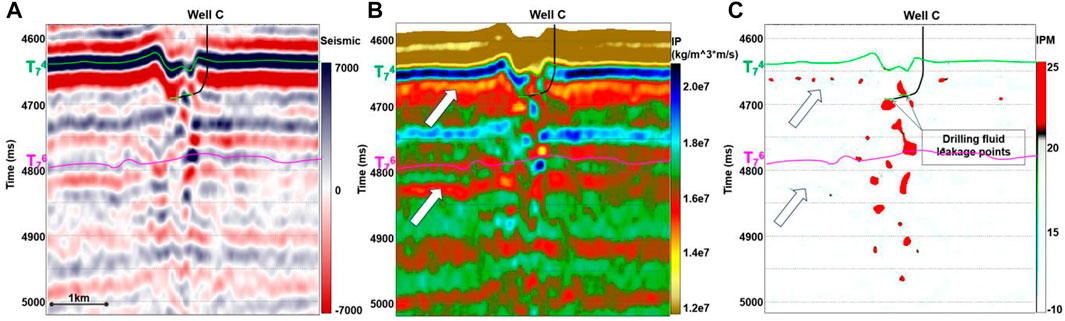
FIGURE 6. Comparison of the application effect of karst caves identification method in field data. (A) Seismic amplitude reflection; (B) Inverted P-impedance obtained by the improved method; (C) Predicated caves by new method.
The theoretical model test and the field case demonstrate that the novel method effectively suppresses background interference and more accurately describes the boundaries of caves. The characteristics of the cave distribution are consistent with geological knowledge, thus validating the feasibility and effectiveness of the proposed method.
A 3D dissolved pore and fracture equivalent model was added to the model in Figure 5A with reference to the measured data (Figure 7A). The red dashed line indicates the extent of the dissolved pore and fracture zone. Figure 7B shows the synthetic seismic. A comparison of Figure 7B and Figure 5B shows that when the dissolved pore and fracture zones are added, the seismic events become more chaotic and the amplitude energy varies to different degrees. Figure 7C shows the energy envelope derived from the seismic data in Figure 7B. Figure 7C shows that although the non-optimized energy envelope can identify the spatial location of the dissolved pore and fracture zones to some extent, there are still errors in the identification results (white arrows in Figure 7). For instance, the reservoir near 4,600 ms is affected by the upper lithologic interface and its boundary cannot be accurately characterized. In addition, the response of the reservoir near 4,650 ms is obscured by the interference of the sedimentary strata. In addition, the reservoir response near 4,700 ms is comparable to the energy level of the sedimentary strata near 4,650 ms. If a single threshold is used, these errors would lead to an inaccurate description of the distribution of dissolved pore and fracture zones in subsequent modeling. Figure 7D shows the results of the improved energy envelope. The range of dissolved pore and fracture zones derived by the new method is consistent with the theoretical model in Figure 7A, effectively reducing the interference of the lithologic interface and sedimentary strata. Thus, it is possible to characterize the spatial distribution range of 3D dissolved pore and fracture zones using a single threshold.
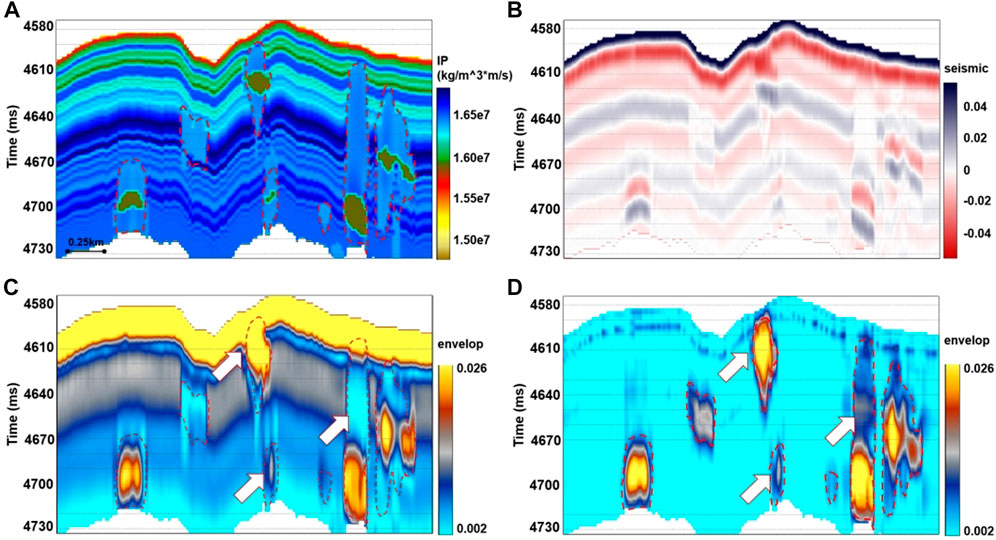
FIGURE 7. Comparison of the dissolved pore and fracture zone identification results based on theoretical models. (A) Theoretical model; (B) Synthetic seismic; (C) Non-modified Energy envelope; (D) Modified energy envelope.
Figure 8A shows the seismic data of the Shunbei field, and the black part of the figure is the strike-slip fault identified based on the deep learning algorithm. Figure 8B shows the non-improved energy envelope derived from the seismic data shown in Figure 8A. Figure 8C shows the improved energy envelope. As shown in Figures 8B, C, it is obvious that the improved method can more accurately identify the distribution of cavity belts. In addition, the upper part of the reservoir has a higher degree of dissolution than the lower part. The longitudinal zonal distribution indicates that faults control the distribution of dissolved pore and fracture zones. Two leakage points are marked on the trajectory of Well C in Figure 8 (green lines), which is consistent with the predication results. The comparison shows that there is a good match between the dissolved pore and fracture zones and the location of the strike-slip fault in the study area, which is consistent with geological knowledge and validates the applicability of the proposed identification method.
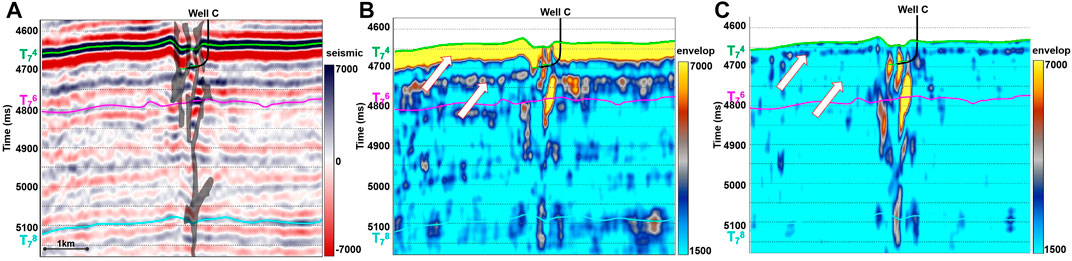
FIGURE 8. Comparison of the application effect of the dissolved pore and fracture zone identification method in field data. (A) Seismic data and deep fault. (B) Non-modified Energy envelope; (C) Modified energy envelope.
Figure 9A shows the seismic amplitude reflection, while Figure 9B shows the identification results of the fault-fracture zone based on Eq. 7. Comparing the two figures, it can be seen that the proposed method can accurately delineate the fracture-damaged zone around the main faults. In the figure, the bright red color indicates areas where fractures are developed, while the blue color indicates areas where the fractures are not developed. Figure 9 demonstrates that the fracture-damaged zone has a typical funnel shape and that the intensity of the fractures progressively decreases from the main fault to the sides. However, there is till a problem, as shown in Figure 9B, interference is caused by the strong seismic reflection shielding effect of the unconformity surface (inside the black dashed circle in Figure 9B).
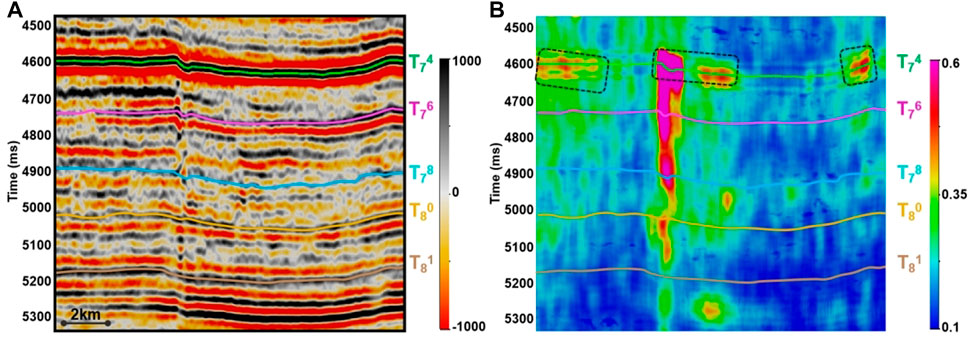
FIGURE 9. Grayscale texture contrast results. (A) Seismic amplitude; (B) Texture contrast.
Based on the matched pursuit algorithm, we implemented a wave decomposition optimization process for seismic data, which is used to eliminate the interference of the strong seismic reflection. Figure 10 compares seismic data before and after processing to suppress the strong seismic reflection. An enlarge view of the unconformity interface is shown at the bottom of the figure. The comparison shows that the strong seismic reflection at the unconformity interface has been effectively suppressed and the precision of the target reservoir details has been effectively improved (at the yellow arrows in Figure 10).
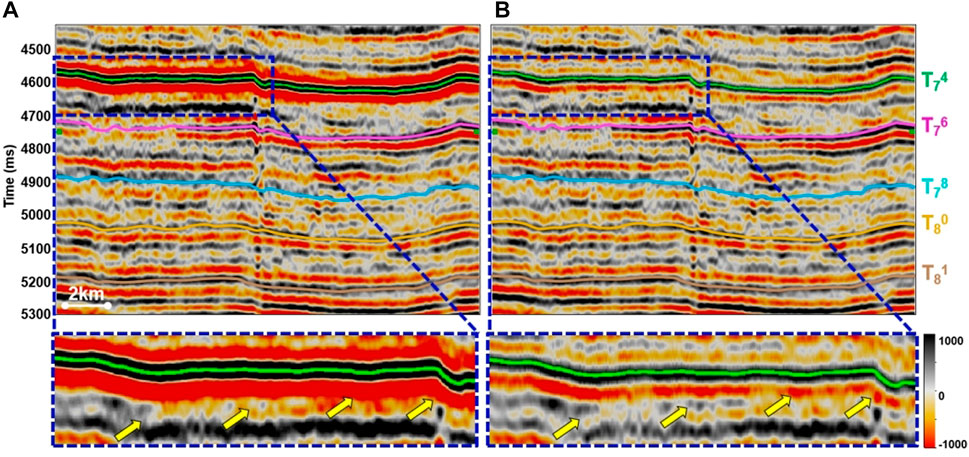
FIGURE 10. Comparison of suppression effect of strong seismic reflection. (A) Original seismic data; (B) Seismic reflection with suppression processing.
The anomalous information resulting from the strong seismic reflection can be effectively suppressed (Figure 11A). However, the subsequent predictions still contain anomalous responses due to some interference noise after the strong seismic reflection suppression (indicated by yellow arrows in Figure 11B). The reason is that these interference noises are confused with fractures in the calculation of the fault-fracture zone, which leads to errors. To address this issue, the interference noise was reduced using the Principal Component Analysis (PCA) algorithm after strong seismic reflection suppression (Figure 11C). The fault-fracture zone (Figure 11D) was then calculated using the data that after strong seismic reflection suppression, PCA denoising and texture contract calculation.
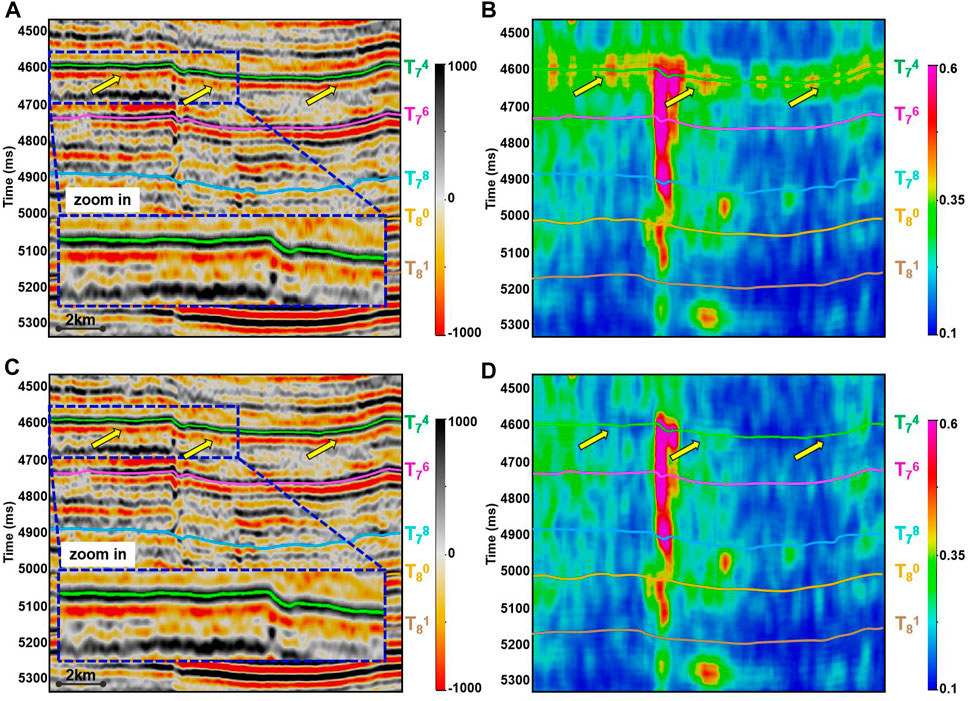
FIGURE 11. Texture contrast results. (A) Seismic data with strong reflection suppression; (B) Calculated texture contrast based the seismic data with strong reflection suppression; (C) Seismic data with strong reflection suppression and PCA optimization; (D) Calculated texture contrast based on the final optimization seismic from figure (C).
Comparing Figures 11A, C, it is clear that PCA processing has successfully suppressed the noise. Similarly, Figures 11B, D show that the artifacts have been significantly reduced after PCA optimization (as indicated by the yellow arrows in the figures). In addition, a comparison of Figures 9B, 11D reveals that the method proposed in this study not only effectively weakens the shielding effect of strong seismic reflections, thereby improving the accuracy of the target characterization, but also preserves the true response of the fault-fracture zone.
To further verify the effectiveness of the fault-fracture zone identification method, a new model was created by adding the fault-fracture zone information (Figure 12A) to the model in Figure 7A, as shown in Figure 12B. Figure 12C shows the synthetic seismic. Comparing Figures 7B, 12C, it can be seen that the addition of fracture information makes the seismic events appear more chaotic. Figure 12D is a superimposed profile of the faults, predicted caves and fault-fracture zone. The seismic data in Figure 12C are used to predict fault-fracture zone. Figure 12E shows the synthetic seismic with optimization of the strong reflection suppression and PCA processing. By comparing Figures 12C, E, it can be seen that the optimized seismic effectively suppresses the effect of the strong reflection, thereby improving the accuracy of reservoir characterization (as indicated by the arrows in Figures 12C, E). Figure 12F is an overlay profile of the faults, identified caves and fault-fracture zone. The predicted fault-fracture zone is derived from the optimized seismic data of Figure 12E. The light purple color indicates the developed part of the fault-fracture zone, while the blue color indicates the undeveloped part. Comparative analysis reveals that the optimized method eliminates the influence of the interface (in the red dashed boxes in Figure 12). The detection results show a strong correlation with faults and karst caves, demonstrating that the new method accurately describes the extent of fault-fracture zones.

FIGURE 12. Comparison of the effect of the fault-fracture zone recognition method. (A) Added fault and fracture. (B) Theoretical model. (C) The synthetic seismic data. (D) The calculated fracture zone based on the synthetic seismic. (E) Optimized seismic data. (F) Calculated fracture zone based on the optimized seismic.
To further support the applicability of the fault-fracture zone identification method presented in this study, we select another field data set for testing. Figure 13 illustrates the results in a cross section that extends over 6 wells in a northeast to southwest orientation. Figure 13A shows the original seismic data. Figure 13B shows the predicted fault-fracture zone based on the modified method. The results can accurately capture the spatial distribution range of fault-fracture zones. The predicted fracture body is consistent with the geological comprehension and reservoirs indicated by the drilling data.
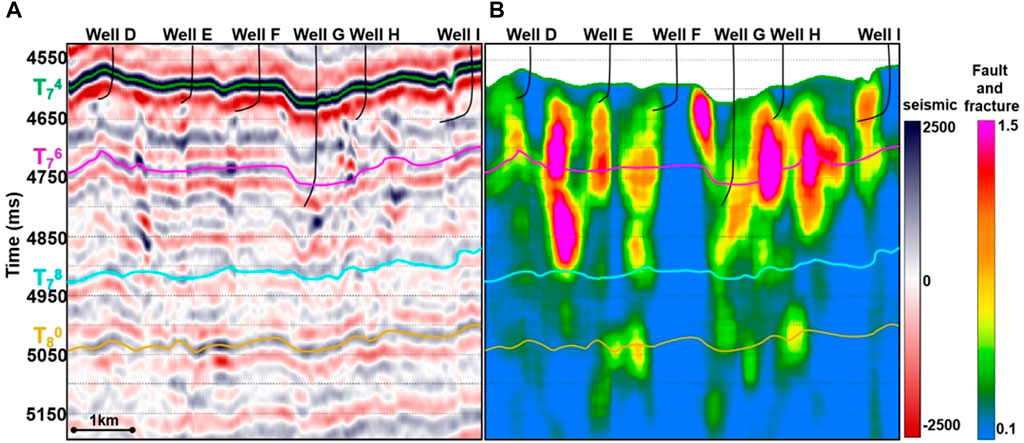
FIGURE 13. Recognition effect of fault-fracture zone based on the ShunBei field data. (A) Original seismic; (B) Recognition of fault-fracture zone based proposed method.
The fine identification of multi-level fracture-controlled karst reservoirs can be facilitated by the proposed integrated methods. Using multi-level characterization methods, the spatial distribution of the fracture-controlled karst reservoirs in the Shunbei field can be effectively analyzed in three dimensions. A series of optimization processing, inversion and interpretation techniques are applied to the seismic data (Figure 14A) to identify different levels of fault-controlled karst reservoir zones, such as large cave zones, dissolved pore and fracture zones, and fault-fracture zones (Figure 14B). As shown in the profile of the characterization results (Figure 14B), the reservoirs are mainly developed around the main fault zones (Figure 14C), which are significantly controlled by strike-slip faults. The shallow parts of the reservoirs are more developed in terms of faults and fractures.
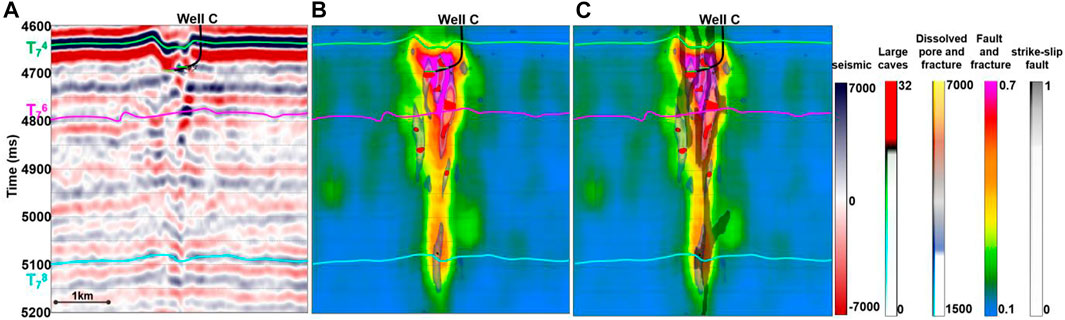
FIGURE 14. Comparison between seismic data and the results of multi-level integrated identification of reservoirs. (A) Seismic data; (B) Results of multi-level integrated identification of fault-controlled karst reservoirs; (C) Identified multi-level fault-controlled karst reservoirs overlaid the faults interpretation results.
It is clear from the map diagram (Figure 15) that the karst caves have a relatively limited extent and were formed mainly around the main faults. The dissolution pore and fracture zones are mainly present in the area surrounding karst caves and extent in the direction of the faults. The fault-fracture zones are the most developed, allowing the main faults and their associated fractures to be clearly characterized, as well as the extent of the reservoirs.
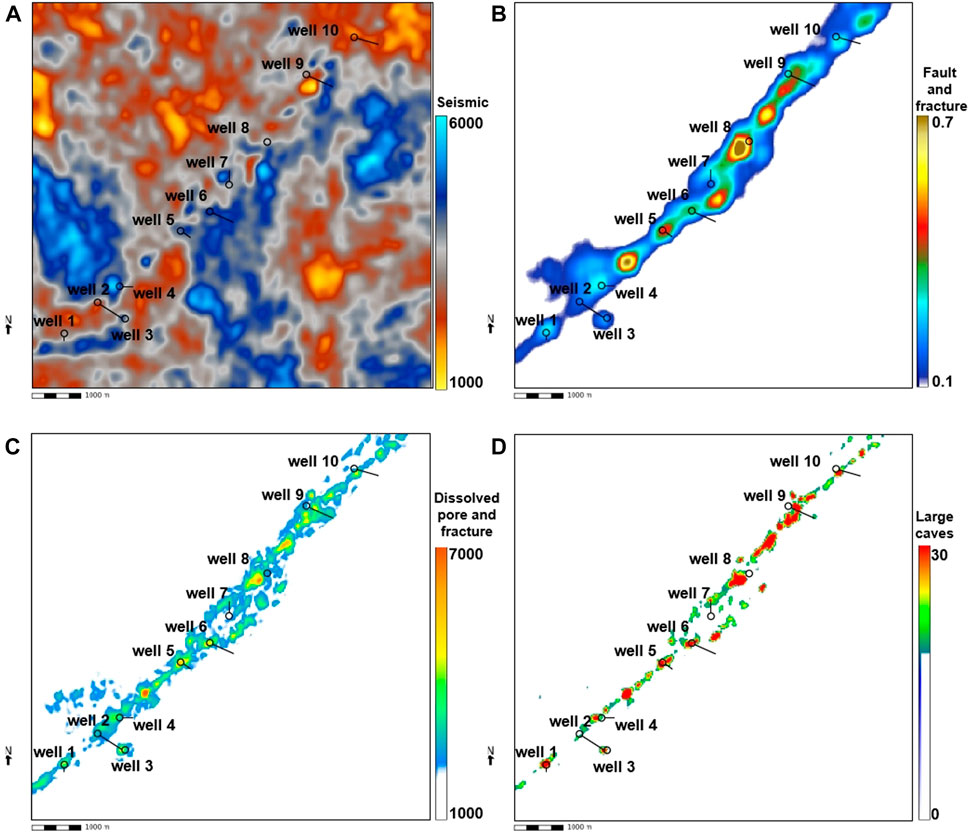
FIGURE 15. Comparison of the seismic data map and the maps of multi-level integrated identification of reservoirs. (A) Seismic data; (B) Predicted fault and fracture zones; (C) Predicted dissolved pore and fracture zones; (D) Predicted large cave zones.
Ultra-deep fault-controlled carbonate reservoir, as a special type of reservoir, have attracted in-depth research by many scholars. The formation of fault-controlled karst reservoirs is controlled by various factors such as sedimentation, tectonics and dissolution. For reservoirs, such as the Shunbei oilfield, which have strong heterogeneity characteristics and little effective well information. Accurate identification of effective reservoir information in 3D seismic data and comprehensive characterization of different reservoir types are essential for efficient field development. The resolution and signal-to-noise ratio of the seismic data for the target reservoir are low. At the same time, the influence of the unconformity surface and sedimentary strata reflections makes high-precision reservoir identification challenging. To analyze the heterogeneity of the target reservoir, we first resolved the different reservoir types and their characteristics by combining outcrop, logging and a priori geological understanding. The different reservoir types in fault-controlled karst reservoirs are both independent and interrelated. Their independence is reflected in the fact that strike-slip faults and their associated fracture zones are structural reservoirs, while dissolved pores and caves are dissolution reformation reservoirs. The main controlling factors of different reservoir types are different. Their interrelationship is reflected in the fact that the formation of dissolution pores requires fractures and fractures to provide fluid transport channels and reaction space. The areas with high degree of dissolution are mostly the areas where faults and fractures are more developed.
Large cave zones tend to have high porosity and low P-impedance characteristics. The conventional method for identifying large caves consists of two steps: first, inversion is performed to obtain the P-impedance, and then the threshold value is selected to predict the cave location based on the inversion results. However, the influence of low-impedance interference reflection limits the accuracy of the conventional identification method. Therefore, to improve the accuracy of cave identification, each step of the conventional method is improved in this study, and a cave enhancement algorithm is proposed. The impedance inversion method is improved, specifically, the construction method of the low-frequency model and the objective function of the inversion are improved, and the inversion accuracy of the P-impedance and the ability to characterize heterogeneity are improved. The improved inversion method can be applied to the P-impedance calculation of any type of reservoir, which can effectively improve the accuracy of inversion, not only for fault-controlled carbonate reservoirs. Eq. 4 is the cave enhancement algorithm, based on which the difference between different values can be further increased, making the selection of the threshold value more accurate and thus improving the accuracy of cave identification. The method can effectively highlight the range of targets identified. The equation can be adapted by scaling factors to identify other high or low impedance targets, such as high impedance volcanic rock or low impedance fluid in sand. The equation can also be extended to calculate other sensitive elastic parameters, i.e., the impedance in the equation can be replaced by other elastic parameters. In the application, the scaling factor can be based on the calibration results of the log interpretation.
The seismic reflection of the dissolved pore and fracture zone is more chaotic and its response is easily disturbed by the sedimentary strata reflection. Therefore, a sedimentary strata suppression method is proposed in this study. Based on this method, the phase transformation and energy envelope calculation can realize the accurate identification of the dissolved pore and fracture zone. In the sedimentary strata reflection interference suppression method, the time window step is at least twice larger than the identification target when the sedimentary strata reflection is sought. The sedimentary strata interference suppression method can effectively enhance the heterogeneity of the identification target, and the method can be extended to the identification of channel deposits.
The method of identifying the fracture zones is a new set of calculations different from the conventional methods. The method combines strong seismic reflection suppression and a texture optimization algorithm. The strong seismic reflection suppression method can well suppress the strong seismic reflection events and present the effective reflection information masked by the strong reflection interference. This method can be used not only in fault-controlled reservoirs, but also in thin sand identification. The texture optimization algorithm can be extended to the calculation of fractures in other lithologies, and we have applied the method to the prediction of fractures in tight-sandstone with promising results. Fracture density can also be calculated based on the fracture data obtained from this calculation to provide more references for reservoir description.
This research proposes a multi-level optimal identification method, which makes it more credible to investigate the complex characterization of ultra-deep fault-controlled karst reservoirs and achieve a detailed description of the reservoirs. However, there are still some issues that require additional focus, especially in the following aspects:
How to further improve the resolution of seismic characterization. Accurate identification of fault-controlled karst reservoirs is difficult due to the complex geology, deep burial depth, low resolution of seismic data, lack of well information, and insufficient geological knowledge. This poses a significant challenge to the efficient development of oil and gas reservoirs. A set of 3D identification methods has been developed to address these challenges. These methods have been successfully implemented in the Shunbei Oilfield and have significantly improved the accuracy of reservoir identification. However, due to the resolution limitations of seismic data, accurate identification of karst reservoirs remains difficult. Further research is required to improve the resolution, as the scale of the currently identified reservoir zones is basically an average of a group of reservoir zones of the same type.
It is necessary to further dissect the fillings of large caves in order to understand them. However, most of the current physical property inversion methods are qualitative, which makes it challenging to achieve a quantitative identification. Therefore, investigating a variety of quantitative physical parameter inversion methods can provide a pathway for later analysis of karst cave fillings and improve the precision of reservoir description. Due to the lack of logging data, there are limited means to validate the accuracy of the predicted dissolved pore-fracture zone, and fracture zone. Future advances in drilling and logging technology are expected to provide more accurate data for evaluating reservoir predictions.
The ultra-deep fault-controlled reservoirs in the Shunbei field are easily covered by strong seismic and sedimentary strata reflections, making accurate reservoir characterization a challenge. To achieve accurate reservoir prediction, seismic data must be characterized at multiple levels. Different reservoir characteristics should be constrained together, effectively reducing the likelihood of multiple interpretation solutions. The strong reflection interface of the fault-controlled karst reservoir has a strong shielding effect on the internal details of the reservoir. Therefore, effective strong reflection suppression processing is required to reveal the reservoir details obscured by strong interference. Sedimentary strata can significantly interfere with the volume prediction of fault-controlled reservoirs, potentially leading to significant errors in the subsequent reserve calculations. To ensure the accuracy of reservoir interpretation and analysis, it is essential to highlight strong heterogeneous zones.
Seismic data is a comprehensive response consisting of numerous categories of information. The method proposed in this study can effectively extract target information, classify attributes, analyze level-by-level, and characterize fault-controlled reservoirs at multiple levels. This is an effective way to reduce the likelihood of multiple solutions in predicating fault-controlled reservoirs and improve the accuracy of reservoir identification, providing a new approach for the exploration and development of similar reservoirs.
The raw data supporting the conclusion of this article will be made available by the authors, without undue reservation.
QM is responsible for the idea and writing of this article, and TD is responsible for the data analysis part. All authors contributed to the article and approved the submitted version.
The authors declare that the research was conducted in the absence of any commercial or financial relationships that could be construed as a potential conflict of interest.
All claims expressed in this article are solely those of the authors and do not necessarily represent those of their affiliated organizations, or those of the publisher, the editors and the reviewers. Any product that may be evaluated in this article, or claim that may be made by its manufacturer, is not guaranteed or endorsed by the publisher.
Burberry, C. M., Jackson, C. A. L., and Chandler, S. R. (2016). Seismic reflection imaging of karst in the Persian Gulf: Implications for the characterization of carbonate reservoirs. AAPG Bull. 100 (10), 1561–1584. doi:10.1306/04151615115
Chen, G., Pan, W., Sa, L., Han, J., and Guan, W. (2005). Application of prediction techniques in carbonate karst reservoir in tarim basin. Appl. Geophys. 2 (2), 111–118. doi:10.1007/s11770-005-0042-4
Cheng, H., Zhang, J., and Zhang, W. B. (2020). Discussion on identification, prediction and development pattern of faulted-karst carbonate reservoirs:A case study of TH10421 fracture-cavity unit in block 10 of Tahe oilfield, Tarim Basin. Oil Gas Geol. 41 (5), 996–1003. doi:10.11743/ogg20200510
Dembicki, E. A., and Machel, H. G. (1996). Recognition and delineation of paleokarst zones by the use of wireline logs in the bitumen-saturated Upper Devonian Grosmont Formation of northeastern Alberta, Canada. AAPG Bull. 80 (5), 695–712. doi:10.1306/64ed8886-1724-11d7-8645000102c1865d
Deng, S., Li, H. L., Zhang, Z. P., Wu, X., and Zhang, J. B. (2018). Characteristics of differential activities in major strike-slip fault zones and their control on hydrocarbon enrichment in Shunbei area and its surroundings, Tarim Basin. Oil Gas Geol. 39 (5), 878–888. doi:10.11743/ogg20180503
Deng, S., Li, H. L., Zhang, Z. P., Zhang, J. B., and Yang, X. (2019). Structural characterization of intracratonic strike-slip faults in the central Tarim Basin. Am. Assoc. Pet. Geol. Bull. 103 (1), 109–137. doi:10.1306/06071817354
Duan, T. D., Zhang, W. B., Lu, X. B., Li, M., Zhao, H. W., and Shang, X. (2020). Architectural characterization of Ordovician fault-controlled paleokarst carbonate reservoirs, Tahe oilfield, China. Interpretation 8 (4), 953–965. doi:10.1190/INT-2019-0012.1
Gao, D. L. (2011). Latest developments in seismic texture analysis for subsurface structure, facies, and reservoir characterization: A review. Geophysics 76 (2), W1–W13. doi:10.1190/1.3553479
Gao, D. L. (2003). Volume texture extraction for 3d seismic visualization and interpretation. Geophysics 68 (4), 1294–1302. doi:10.1190/1.1598122
Hamid, H., Pidlisecky, A., and Lines, L. (2018). Prestack structurally constrained impedance inversion. Geophysics 83 (2), 89–103. doi:10.1190/geo2016-0703.1
Han, G. H., Qi, L. X., Li, Z. J., and Fan, Z. J. (2006). Prediction of the Ordovician fractured-vuggy carbonate reservoirs in Tahe oilfield. Oil Gas Geol. 27 (6), 860–870. doi:10.11743/ogg20060617
Hardage, B. A., Carr, D. L., Lancaster, D. E., Simmons, J. L., Elphick, R. Y., Pendleton, V. M., et al. (1996). 3-D seismic evidence of the effects of carbonate karst collapse on overlying clastic stratigraphy and reservoir compartmentalization. Geophysics 61 (5), 1336–1350. doi:10.1190/1.1444057
Janson, X., Zeng, H. L., Loucks, B., Wang, Q. Z., Wang, C. Y., Li, S. X., et al. (2010). An ultra-deep paleokarst system in the Ordovician, North-Central Tarim Basin, China: Outcrop analog and synthetic seismic models. Basin, China: SEG Technical Program Expanded Abstracts, 1531–1534. doi:10.1190/1.3513132
Jhosnella, S., Matteo, D. L., Maria, M., Axum, C., Andrea, S., Kjetil, B., et al. (2012). Characterization of a deeply buried paleokarst terrain in the Loppa High using core data and multiattribute seismic facies classification. AAPG Bull. 96 (10), 1843–1866. doi:10.1306/02271211137
Khan, M., Liu, Y. K., and Din, S. Z. U. D. (2020a). Presenting meso-cenozoic seismic sequential stratigraphy of the offshore indus basin Pakistan. Phys. Earth Planet. Interiors 300, 106431. doi:10.1016/j.pepi.2020.106431
Khan, M., Liu, Y. K., Farid, A., and Ahmed, H. (2020b). Indications of uplift from seismic stratigraphy and backstripping of the well data in Western Indus offshore Pakistan. Geol. J. 55 (1), 553–570. doi:10.1002/gj.3425
Li, Y., Hou, J. G., and Li, Y. Q. (2016). Features and classified hierarchical modeling of carbonate fracture-cavity reservoirs. Petroleum Explor. Dev. 43 (4), 655–662. doi:10.1016/s1876-3804(16)30076-3
Li, Y. T., Qi, L. X., Zhang, S. N., Yun, L., Cao, Z. C., Han, J., et al. (2019). Characteristics and development mode of the Middle and lower ordovician fault-karst reservoir in Shunbei area,Tarim Basin. Acta Pet. Sin. 40 (12), 1470–1484. doi:10.7623/syxb201912006
Li, Z. J., Yang, Z. C., Li, H. Y., Liu, J., Gong, W., Ma, X. J., et al. (2020). 3D seismic exploration method for ultra-deep fault-related dissolution reservoirs in the Shunbei desert area. Geophys. Prospect. Petroleum 59 (2), 283–294. doi:10.3969/j.issn.1000-1441.2020.02.015
Liang, D. (2008). Review and expectation on the discovery of ordovician lunnan-tahe oilfield, tarim basin. Acta Pet. Sin. 29 (1), 153–158. doi:10.7623/syxb200801034
Liu, B. Z., Qi, L. X., Li, Z. J., Liu, J., Huang, C., Yang, L., et al. (2020). Spatial characterization and quantitative description technology for ultra-deep fault-karst reservoirs in the Shunbei area. Acta Pet. Sin. 41 (4), 412–420. doi:10.7623/syxb202004004
Liu, J., Li, W., Ging, W., and Huang, C. (2021). New additions to the Chinese agraeciini redtenbacher, 1891 (orthoptera, tettigoniidae: Conocephalinae) with report the complete mitochondrial genome of palaeoagraecia brunnea ingrisch, 1998. Xinjiang Pet. Geol. 42 (2), 238–254. doi:10.11646/zootaxa.5072.3.2
Loucks, R. G., Mescher, P. K., and Mcmechan, G. A. (2004). Three-dimensional architecture of a coalesced, collapsed-paleocave system in the Lower Ordovician Ellenburger Group, central Texas. AAPG Bull. 88 (5), 545–564. doi:10.1306/12220303072
Ma, Q. Q., and Sun, Z. D. (2018). Elastic modulus extraction based on generalized pre-stack PP–PS joint linear inversion. Appl. Geophys. 15 (3), 466–480. doi:10.1007/s11770-018-0701-x
Ma, Y. S., Cai, X. Y., Yun, L., Li, Z. J., Li, H. L., Deng, S., et al. (2022). Practice and theoretical and technical progress in exploration and development of Shunbei ultra-deep carbonate oil and gas field, Tarim Basin, NW China. Petroleum Explor. Dev. 49 (1), 1–20. doi:10.1016/s1876-3804(22)60001-6
McDonnell, A., Loucks, R. G., and Dooley, T. (2007). Quantifying the origin and geometry of circular sag structures in northern Fort Worth Basin, Texas: Paleocave collapse, pull-apart fault systems, or hydrothermal alteration? AAPG Bull. 91 (9), 1295–1318. doi:10.1306/05170706086
McMechan, G. A., Loucks, R. G., Mescher, P., and Zeng, X. (2002). Characterization of a coalesced, collapsed paleocave reservoir analog using GPR and well-core data. Geophysics 67 (4), 1148–1158. doi:10.1190/1.1500376
Ning, F., Lin, H., Zhou, C., Yun, J., Li, P., and Song, H. (2022). Characteristics of strike-slip fault-related reservoirs and the significance for hydrocarbon accumulation in the central Tarim Basin: Insights from the modern karst model. Front. Earth Sci. 10, 987020. doi:10.3389/feart.2022.987020
Qi, L. X. (2020). Characteristics and inspiration of ultra-deep fault-karst reservoir in the Shunbei area of the Tarim Basin. China Pet. Explor. 25 (1), 102–111. doi:10.3969/j.issn.1672-7703.2020.01.010
Qi, L. X., and Yun, L. (2010). Development characteristics and main controlling factors of the Ordovician carbonate karst in Tahe oilfield. Oil Gas Geol. 31 (1), 1–12. doi:10.11743/ogg20100101
Sinha, S., Routh, P. S., Anno, P. D., and Castagna, J. P. (2005). Spectral decomposition of seismic data with continuous-wavelet transform. Geophysics 70 (6), 19–25. doi:10.1190/1.2127113
Smosna, R., Bruner, K. R., and Riley, R. A. (2005). Paleokarst and reservoir porosity in the ordovician beekmantown dolomite of the central appalachian basin. Carbonates Evaporites 20 (1), 50–63. doi:10.1007/bf03175448
Soudet, H. J., Sorriaux, P., and Rolando, J. P. (1994). Relationship between fractures and karstification-the oil-bearing paleokarst of rospo mare (Italy). Bull. Des. Centres De. Rech. Exploration-Production Elf Aquitaine 18 (1), 257–297.
Wang, Y. J., Zheng, D., Li, X. Y., Cui, Y. F., Sun, S. H., Wan, X. G., et al. (2014). The fracture-cavern system prediction method and its application in carbonate fractured-vuggy reservoirs. Geophys. Prospect. Petroleum 53 (6), 727–736. doi:10.3969/j.issn.1000-1441.2014.06.014
Wen, S. S., Li, H. Y., and Hong, C. J. (2020). Technology of seis⁃ mic response characteristics and description of fault⁃ karst reservoir in Shunbei oilfield. Fault⁃ Block Oil Gas Field 27 (1), 45–49. doi:10.6056/dkyqt202001009
Yang, P., Liu, Y. L., Jia, H. Q., Lu, D., and Li, H. Y. (2007). Carbonate-reservoirs prediction strategy and technologies in Tarim Basin of China. Basin, China: SEG Technical Program Expanded Abstracts, 2738–2742. doi:10.1190/1.2793035
Yang, Z. P., Song, W. Q., Liu, J., Chen, J. A., Liu, Q., and Wu, D. (2021). A method of combining multi-channel signals to suppress the strong reflection through matching pursuit. Oil Geophys. Prospect. 56 (1), 77–85. doi:10.13810/j.cnki.issn.1000-7210.2021.01.009
Yun, L. (2021). Controlling effect of NE strike-slip fault system on reservoir development and hydrocarbon accumulation in the eastern Shunbei area and its geological significance, Tarim Basin. China Pet. Explor. 26 (3), 41–52. doi:10.3969/j.issn.1672-7703.2021.03.004
Zhai, X. Y., and Yun, L. (2008). Geology of giant tahe oilfield and a review of exploration thinking in the tarim basin. Oil Gas Geol. 29 (5), 565–573. doi:10.11743/ogg20080504
Zhao, Y. H., Hu, J. Z., Lu, X. B., and Song, Y. (2010). Study on carbonate reservoir prediction in the upper ordovician areal coverage of tahe oilfield. J. Oil Gas Technol. 32 (01), 62–67. doi:10.3969/j.issn.1000-9752.2010.01.013
Keywords: fault-controlled karst, ultra-deep carbonate reservoirs, multi-level identification methods, Shunbei field, strike-slip fault
Citation: Ma Q and Duan T (2023) Multi-level ultra-deep fault-controlled karst reservoirs characterization methods for the Shunbei field. Front. Earth Sci. 11:1149678. doi: 10.3389/feart.2023.1149678
Received: 22 January 2023; Accepted: 27 June 2023;
Published: 12 July 2023.
Edited by:
Ahmed Henaish, Zagazig University, EgyptReviewed by:
Majid Khan, University of Science and Technology Beijing, ChinaCopyright © 2023 Ma and Duan. This is an open-access article distributed under the terms of the Creative Commons Attribution License (CC BY). The use, distribution or reproduction in other forums is permitted, provided the original author(s) and the copyright owner(s) are credited and that the original publication in this journal is cited, in accordance with accepted academic practice. No use, distribution or reproduction is permitted which does not comply with these terms.
*Correspondence: QiQi Ma, bWFxaXFpLnN5a3lAc2lub3BlYy5jb20=
Disclaimer: All claims expressed in this article are solely those of the authors and do not necessarily represent those of their affiliated organizations, or those of the publisher, the editors and the reviewers. Any product that may be evaluated in this article or claim that may be made by its manufacturer is not guaranteed or endorsed by the publisher.
Research integrity at Frontiers
Learn more about the work of our research integrity team to safeguard the quality of each article we publish.