
94% of researchers rate our articles as excellent or good
Learn more about the work of our research integrity team to safeguard the quality of each article we publish.
Find out more
ORIGINAL RESEARCH article
Front. Earth Sci. , 15 March 2023
Sec. Interdisciplinary Climate Studies
Volume 11 - 2023 | https://doi.org/10.3389/feart.2023.1147582
This article is part of the Research Topic Impact of Solar Activities on Weather and Climate View all 11 articles
Previous studies indicated that the North Tropical Atlantic (NTA) SST can serve as a precursor for the El Niño–Southern Oscillation (ENSO) predictability and the connection of NTA-ENSO is modulated by the mid-high latitude atmospheric variability. Despite significant solar footprints being found in the North Atlantic and tropical Pacific separately, their role in the two basins’ connection is still missing. In this study, we systematically examined this point by using observational/reanalysis datasets and outputs of a pair of sensitivity experiments with and without solar forcings (SOL and NOSOL). In observations, DJF-mean NAO-like SLP anomalies have a linear covariation with the subsequent JJA-mean El Niño Modoki-like SST anomalies in the tropical Pacific in the following 1 year. This observed SLP-SST covariation shows up in the high solar activity (HS) subset and disappears in the low solar activity (LS) subset. In the HS years, positive NAO-like SLP anomalies are produced by the stronger solar-UV radiation through a “top-down” mechanism. These atmospheric anomalies can enhance the influence of the NTA on the tropical Pacific SST by triggering significant and more persistent subtropical teleconnections. Here we proposed an indirect possible mechanism that the solar-UV forcing can modulate the tropical Pacific SST variability via its impacts on the atmospheric anomalies over the North Atlantic region. However, based on the same analysis method, we found a different coupled mode of the SLP and SST anomalies in the modeling outputs. The SLP anomalies in the North Atlantic, with a triple pattern (negative SLP anomalies in the Pole and the NTA, positive SLP anomalies in the mid-latitude), have “lead-lag” covariations with the Eastern Pacific El Niño-like SST anomalies in both the SOL and NOSOL. Although the impact of the solar activity is found in the North Atlantic and the tropical Pacific respectively in the SOL, no solar effect is involved in the simulated SLP-SST coupled mode.
The tropical Pacific sea surface temperature (SST) anomaly has a dramatic impact on the global weather and climate, its interannual variability as well as global teleconnections are dominated by an El Niño–Southern Oscillation (ENSO). An ENSO-like SST pattern is also found on the decadal timescale (Chen and Wallace, 2015). Although the interannual and decadal variability of the tropical Pacific SST can be internally generated without any change to external forcings (Kirtman et al., 2013), its response to external forcings may modulate the internal variability (Huo and Xiao, 2017; Hua et al., 2018; Liguori and Di Lorenzo, 2018; Li et al., 2020). The solar radiative forcings, as the major energy source out of the climate system, has a significant quasi-decadal variability (e.g., 11-year solar cycle). Changes in solar radiation have significant footprints in the tropical Pacific climate system, showing a lagged warming in the tropical Pacific (Meehl and Arblaster, 2009; Misios et al., 2016; Huo and Xiao, 2017; Huo et al., 2021) and a slowdown Pacific Walker circulation (Xiao et al., 2016; Misios et al., 2019). The warm response first appears in the central equatorial Pacific (Kodera et al., 2016; Huo and Xiao, 2017) and then extends into the eastern Pacific through air-sea interactions (Misios et al., 2019; Huo et al., 2021). This warm response is suggested to confine in the ocean layers above the main thermocline (White et al., 1997; Wang et al., 2018; Huo et al., 2021) and can impact the Pacific Walker circulation through a bottom thermal control effect (Xiao et al., 2016; Misios et al., 2019; Huo et al., 2023).
Besides, the north tropical Atlantic (NTA) SST anomaly is suggested can drive the tropical Pacific SST interannual variability and modulate the ENSO variability through anomalous Walker circulation (McGregor et al., 2014; Meehl et al., 2021; Ren et al., 2021), crossing continent wind (Xie et al., 2008; Wang et al., 2009; Karnauskas, 2014), and subtropical teleconnections (Wang et al., 2009; Ham et al., 2013a; Li et al., 2016). The spring NTA cooling (warming) could trigger an El Niño (La Niña) event the following winter (Ham et al., 2013a; b; Ham and Kug, 2015; He and Ma, 2021; Jiang and Li, 2021) and therefore could serve as a potential precursor for ENSO (Martín-Rey et al., 2015). This observed NTA-ENSO connection shows a multidecadal variation, which has been attributed to the Atlantic multidecadal oscillation (Wang et al., 2017), Atlantic warming trends (Chen and Wu, 2017; Park et al., 2019), and the multidecadal variations of the North Atlantic Oscillation (NAO) (Ding et al., 2023). However, the simulated NTA-ENSO connection shows a large diversity among either ensemble members of a single climate model (Chen et al., 2022) or among multiple models (Zheng et al., 2021). This could be due to the internal variability in the North Pacific (Chen et al., 2022) and the model’s ability in reproducing spring Arctic Oscillation (AO)-associated atmospheric anomalies over the subtropical North Pacific (Zheng et al., 2021). So, these previous studies imply that the atmospheric variations over the mid-high latitude (AO/NAO-like) appear to modulate the NTA-ENSO connection (Chen et al., 2017; Chen et al., 2018; Ding et al., 2023). In particular, the NAO-like atmospheric anomalies tend to depict an atmosphere-to-ocean forcing to the central tropical Pacific SST anomalies through the NTA SST anomalies (Wu, 2010; Karnauskas, 2014; Ding et al., 2017; Ding et al., 2023). As NAO-like footprints of the 11-year solar cycle are found in previous studies (Thiéblemont et al., 2015; Drews et al., 2022; Kuroda et al., 2022), we assume that the basin connection between NTA and tropical Pacific may provide a possible indirect route for the 11-year solar cycle impact on the tropical Pacific SST.
For the possible mechanisms of the 11-year solar cycle impacts on the tropical Pacific SST, one is the so-called “bottom-up” route, first proposed by Van Loon et al. (2007) and Meehl et al. (2009), is related to the changes in the total solar irradiance (TSI). More solar radiation in solar-maximum years coming in the subtropical “cloud-free” regions, can increase the local latent heat flux and evaporation. As a result, more moisture is carried to the convergence zones by the anomalous trade winds and enhances the precipitation in the climatology maximum regimes. This intensified precipitation could trigger a set of coupled feedbacks including strengthened trade winds, large-scale circulations (both the north-south Hadley circulation and east-west Walker cell), and an intensified subsidence in the subtropics to further reduce the cloud cover there and let more solar radiation incoming. These coupled processes can amplify the initial solar signal and lead to a La Niña-like SST anomaly in the boreal winter (DJF mean) of the solar-maximum years (Van Loon et al., 2007; Meehl et al., 2009). Further, the La Niña-like SST anomaly in the solar-maximum years produces wind-forced ocean Rossby waves in the equator, which reflect off the western boundary and produce equatorial Kelvin waves to lead to a lagged warm response in the years after the solar-maximum (Meehl and Arblaster, 2009). Please notice, the La Niña-like SST anomalies in the winter seasons of the solar-maximum years are aliased by La Niña events in the observation, which only can be ruled out when the analyzed database is large enough (Haam and Tung, 2012; Roy and Haigh, 2012). But the lagged warm response does not depend on the “cold response” in the solar-maximum years and sustains for 3 years after the solar maximum (White and Liu, 2008; Huo et al., 2021). This lagged warm response shows a phase-locked covariation with the 11-year solar cycle and can be explained by the accumulative solar radiation (Huo et al., 2023) or a delayed oscillator in the tropical Pacific (White and Liu, 2008).
In addition to the “bottom-up” mechanism, a “top-down” mechanism related to variations of the solar UV radiation was widely used to explain the observed NAO-like response in the boreal winter. The enhanced solar-UV radiation in the solar-maximum years increases the air temperature in the tropical upper stratosphere by directly radiative heating and increasing ozone production (Gray et al., 2009; Gray et al., 2010). This can increase the meridional temperature gradient and change the mean flow. The solar signal could propagate downward through interactions between the mean flow and upward planetary waves (Kodera and Kuroda, 2002; Matthes et al., 2006). Once the solar signal propagates down to the surface, the AO is more active and stronger (Huth et al., 2007). Meanwhile, the spatial structure of the NAO shows a hemispherical structure extending into the stratosphere in the solar-maximum years, whereas it is confined in the Atlantic sector during the solar-minimum years (Kodera, 2002; Kodera, 2003; Kodera and Kuroda, 2005; Tourpali, et al., 2005). The response of the NAO to the 11-year solar cycle can be amplified by the positive feedback from the ocean with a few years lagged (Gray et al., 2013; Scaife et al., 2013; Gray et al., 2016; Yukimoto et al., 2017). But the lagged NAO response is absent in some climate simulations, which may be due to insufficient ocean feedback in the climate models (Andrews et al., 2015; Drews et al., 2022). This solar UV-forced “top-down” mechanism may exert an indirect effect on the tropical Pacific SST and modulate the NTA-ENSO connection. Therefore, in this study, we will explore this possibility based on observation/reanalysis datasets and a pair of sensitivity experiments. Details of the data and methods used in this study are described in Section 2. Section 3 presents the results and Section 4 includes conclusions and discussions.
The solar radio flux at a wavelength of 10.7 cm (F10.7) is used as an index of the solar activity, which can be obtained from the SOLARIS-HEPPA CMIP6 solar forcing dataset (Matthes et al., 2017) on their website (https://solarisheppa.geomar.de/cmip6). The NOAA Extended Reconstructed SST dataset version 5 (ERSST v5, Huang et al., 2017) is used to investigate the SST response to solar activity, which is provided by the NOAA/OAR/ESRL PSL, Boulder, Colorado, United States from their website at https://psl.noaa.gov/data/gridded/data.noaa.ersst.v5.html. The HadSLP2r (Allan and Ansell, 2006) provided by Met Office Hadley Center (https://www.metoffice.gov.uk/hadobs/hadslp2/data/download.html) is used to investigate the solar signals in SLP anomalies. In addition, surface winds and precipitation rates from the National Centers for Atmospheric Prediction (NCEP) and the National Center for Atmospheric Research (NCAR) Reanalysis 1 dataset are used in this paper, covering the period 1948–present (https://www.esrl.noaa.gov/psd/data/gridded/data.ncep.reanalysis.html). The NAO index from 1950 to the present is provided by the NOAA Climate Prediction Center (CPC) on their website: https://www.cpc.ncep.noaa.gov/products/precip/CWlink/pna/nao.shtml. The CPC NAO index is derived by applying the Rotated Principal Component Analysis to monthly standardized 500-mb height anomalies in a region of 20°N–90°N. More details about the methodology used by CPC to calculate the NAO index can be found on their website: https://www.cpc.ncep.noaa.gov/products/precip/CWlink/daily_ao_index/history/method.shtml. Besides, monthly 3-D zonal wind and air temperature covering 1979–2016 from ERA-Interim reanalysis dataset (Dee et al., 2011) are used to investigate the “top-down” solar signals. This dataset is available on the European Centre for Medium-Range Weather Forecasts (ECWMF) website: https://apps.ecmwf.int/datasets/data/interim-full-daily/levtype=sfc/.
The Community Earth System Model (CESM 1.0) developed by NCAR is a fully coupled chemistry-climate model, which includes an interactive ocean (POP), land (CLM), sea ice (CICE), and an atmospheric component with interactive chemistry (WACCM 3.5) (Marsh et al., 2013). The POP ocean component has 60 depth levels and a tripolar horizontal grid of 1° × 1°. The WACCM 3.5 has 66 vertical levels and a “high-top” (from the Earth’s surface up to approx. 145 km). Its horizontal resolution is 1.9°× 2.5° (latitude ×longitude). Spectrally daily resolved solar variability from the NRLSSI1 data set (Wang et al., 2005) is included in WACCM 3.5. The modeled tropical zonal winds from 86 to 4-mb (22°S–22°N) are relaxed to observations to present the time-varying Quasi-Biennial Oscillation (QBO) (more details can be found in Matthes et al. (2010)).
Two sensitivity experiments based on the CESM-WACCM, covering 145 years from 1955 to 2099, were used in this study. One includes the complete solar variability, which was forced by observed daily solar irradiance from 1955 to 2009 and by twice repeating the four solar cycles of 1965–2008 from 2010 to 2099 (SOL). The other one was forced by a fixed solar forcing of averaged value between 1965 and 2008 (NOSOL). To exclude the anthropogenic impact, both experiments fixed greenhouse gases and ozone-depleting substances at 1960s levels. The same observed volcanic forcing over 1955–2000 was applied to the two experiments, including three large volcanic eruptions—namely, Mt Agung (1963), El Chichón (1982), and Pinatubo (1991).
All the observational/reanalysis variables and indexes from 1950 to 2018 are used in this study. For both the observations and modeling outputs, the seasonal mean is calculated from monthly data and the SST is detrended by the least-squares quadratic at every grid point. The seasonal anomaly is calculated by removing the climatological seasonal means of the whole analyzed period. All the indexes were standardized before being used in regression analysis.
Singular value decomposition (SVD) (Bretherton et al., 1992) is used to analyze the covariance structure of a temporal covariance matrix between two geophysical fields. The linear combinations of variables extracted by SVD tend to have the maximum covariance. In this study, we applied the SVD analysis on the winter (DJF-mean) SLP anomalies over the North America and Atlantic region [110°W–0, 20°N–80°N] and the following summer (JJA-mean) SST anomalies in the tropical Pacific [110°E–80°W, 20°S–30°N] to isolate the most coherent pairs of spatial patterns and their associated time series. Please notice, we took December of the last year as the first month of the winter season of the current year in this study, i.e., DJF-mean indicates the average value of December of the last year and January and February of the current year. To investigate the modulation of the solar activity on the connection between the North Atlantic SLP and the tropical Pacific SST anomalies, we separate the observational/reanalysis data as well as the modeling outputs into two subsets according to the strength of the solar activity, i.e., high solar activity (HS) and low solar activity (LS). Considering the lagged response in the tropical Pacific SST anomalies, we defined the HS as four years around the maximum of DJF-mean F10.7 for each solar cycle (e.g., 1 year ahead of the maximum and 2 years following the maximum). The LS is the same as the HS but includes four years around the DJF-mean F10.7 minima. The years included in each subset are listed in Table 1. Significance levels of the correlation coefficients and regression coefficients are assessed by the two-tailed Student’s t-test. The effective degrees of freedom of the time series in the correlation and regression analysis are calculated following the method used by Huo et al. (2023). A composite mean difference method based on the solar cycle (Camp and Tung, 2007; Zhou and Tung, 2012) is used to assess the responses in the simulation and observation. The 90% statistical significance of the composite results was estimated by a 1000-fold bootstrapping test with replacement (Diaconis and Efron, 1983).

TABLE 1. All the years included in the high solar activity (HS) and low solar activity (LS) subsets for both the observation and simulation.
Figure 1 presents the lagged correlation maps of the DJF-mean F10.7 index with the DJF-mean SLP and SST anomalies for the period 1950–2018. At a lag of 0 years, statistically significant positive correlation coefficients between the F10.7 and SST anomalies only appear in some small regions of the northeastern subtropical Pacific and the central tropical Pacific (color shading contours in Figure 1A). For the relationship of F10.7 with the SLP anomalies, negative correlation coefficients are found in the north of 60°N in the North Atlantic and positive correlation in the tropical Atlantic at a lag of 0 years (contours in Figure 1A). Both the SLP and SST anomalies have high correlation coefficients with the F10.7 at the lag of 1–2 years (Figures 1B, C). The SST pattern resembles the central Pacific El Niño (or refer as El Niño Modoki) and the SLP pattern resembles the surface fingerprints of the Walker cell, these results are consistent with previous works (Huo and Xiao, 2017; Misios et al., 2019; Huo et al., 2021). These lagged responses of SLP and SST anomalies to the solar cycle forcing may modulate the connections between the tropical Pacific and the NTA. To explore this point, we first extracted the possible “coupled” mode of DJF-mean SLP anomalies over the North Atlantic and the following JJA-mean SST anomalies in the tropical Pacific by the SVD analysis. The heterogeneous correlation maps of the leading SVD mode are shown in Figure 2.
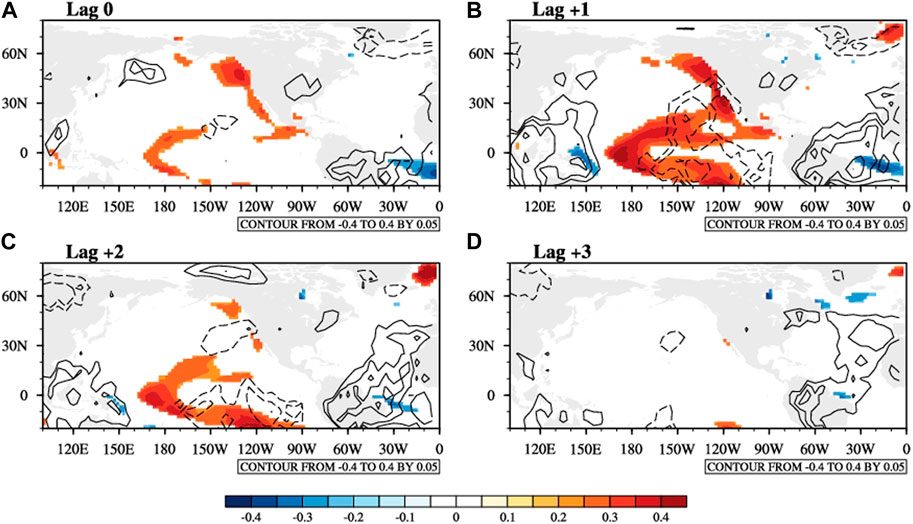
FIGURE 1. (A–D) Lagged correlation maps of observed DJF-mean F10.7 index with the observed DJF-mean SLP (contours) and JJA-mean SST (color shading contours) anomalies (1950–2018) at a lag of 0–3 years. The contour interval is 0.05 and only the values above the 90% confidence level are shown.
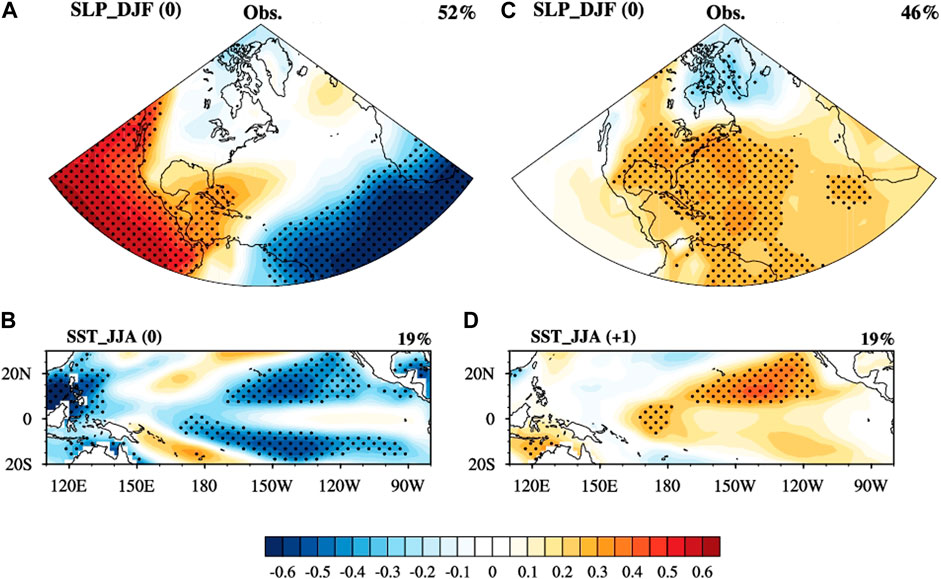
FIGURE 2. Heterogeneous correlation maps of the leading SVD mode of the DJF-mean SLP anomalies in North America and the North Atlantic [110°W–0, 20°N–90°N] and the following JJA-mean SST anomalies in the tropical Pacific [170°E–60°W, 10°S–30°N] in the same year (A,B) and lagged 1 year (C,D). Stippled regions indicate above the 90% significance level based on the Student’s t-test.
The SLP anomalies with a zonal dipole pattern in the tropics have linear covariations with the tropical Pacific cooling in the following summer (Figures 2A, B). A meridional dipole pattern of the DJF-mean SLP anomalies over the North Atlantic and North America (Figure 2C), resembling the positive NAO, has maximum covariations with the positive JJA-mean SST anomalies at a lag of 1 year (Figure 2D). The spatial pattern of the 1-year lagged SST anomalies resembles the decadal component of the El Niño Modoki events (Sullivan et al., 2016).
The time series of the expansion coefficients for the SLP (blue lines) and SST anomalies (black lines) from the leading SVD mode are shown in Figure 3A. Please notice, we named the time series achieved by SVD analysis as SLP-svd time series and SST-svd time series hereafter. Both the SLP-svd and the SST-svd time series show a clear decadal variability after smoothed by a 3-year running mean (thick blue and black lines). Except for the period of 1964–1978 (covering solar cycle 20), the decadal variation of the SLP-svd and SST-svd time series are in-phase with the solar cycle (indicated by F10.7, red line in Figure 3A). The correlation coefficient between the SLP-svd time series (thick blue line) and the F10.7 is 0.43, above the 95% significance level. The correlation coefficient between the DJF-mean NAO index and the SLP-svd time series is 0.73 (Figure 3B), which suggests the variation of the winter SLP anomalies achieved by the SVD in this study (Figure 2C) is dominated by the NAO. The SST-svd time series has a significant positive correlation with the El Niño Modoki index (Figure 3C), the latter is defined following the method of Ashok et al. (2007). These statistical results suggest that the DJF-mean SLP anomalies over North America and the North Atlantic are strongly coupled with the tropical Pacific SST anomaly 1 year later. Both of them have a significant positive correlation with the local climate variability modes (e.g., NAO and El Niño Modoki) and show an in-phase decadal covariation with the 11-year solar cycle.
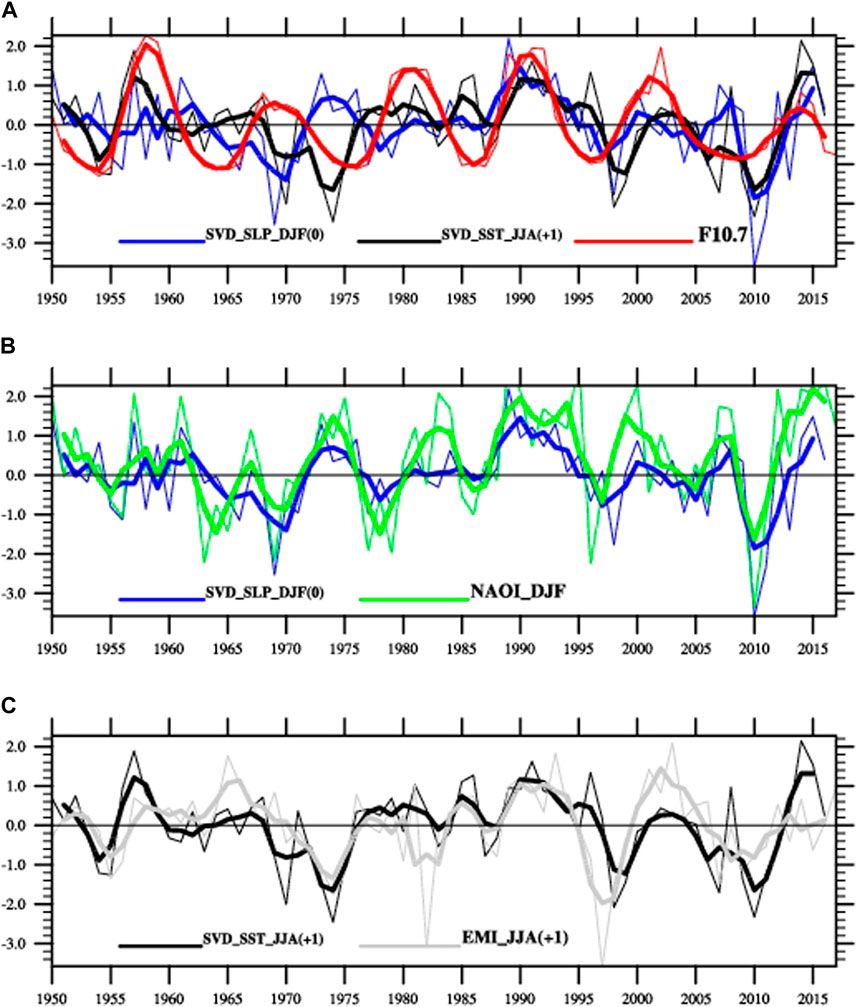
FIGURE 3. (A) Standardized expansion coefficients of the leading SVD mode of the observed DJF-mean SLP anomalies (thin blue line) and the 1-year lagged JJA-mean SST anomalies (thin black line) (Their corresponding heterogeneous correlation maps are shown in Figures 2C,D). The thin red line in (A) is the observed standardized DJF-mean F10.7 index. All the bold lines are smoothed by a 3-year running mean. (B) The blue lines are the same as in (A). The thin (bold) green line is the DJF-mean NAO index (smoothed with the 3-year running mean). The black lines in (C) are the same as in (A). The thin grey line in (C) is the El Niño Modoki index, defined following the method of Ashok et al. (2007) and its 3-year running mean (bold grey line).
To further investigate the possible modulation of the solar activity on the relationship between tropical Pacific SST and the atmosphere anomalies at mid-high latitude, we performed the same SVD analysis on two subsets, which were grouped according to the strength of the solar activity (i.e., the HS and LS, details can be found in the method section). Figure 4 shows the leading SVD mode of the DJF-mean SLP and the 1-year lagged JJA-mean SST anomalies in the HS and LS subsets. The heterogeneous patterns of the SLP and SST anomalies in the HS subset (Figures 4A, B) are similar to the patterns when all years are included (Figures 2C, D). The DJF-mean SLP anomalies in HS (Figure 4A) also present a meridional dipole pattern over North America and the North Atlantic, but with higher correlation coefficients and larger regions above the 95% significance level than the whole dataset. The JJA-mean SST anomalies in the following 1 year show an El Niño Modoki-like pattern (Figure 4B). The leading SVD mode of SLP anomaly in the HS subset with an NAO-like pattern explains a larger fraction of the total squared covariance than the whole dataset (approximately 62% vs. 46%) and the LS subset (approximately 62% vs. 35%). This implies a stronger positive NAO in the high solar activity years, which is consistent with the previous work (Kodera, 2002; Kodera, 2003; Huth et al., 2007; Drews et al., 2022; Kuroda et al., 2022). No such anomalous SLP-SST coupled mode was found in the LS subset (Figures 4C, D). Negative SLP anomalies in the Pole and North America may have a connection with the 1-year lagged tropical Pacific cooling in the LS years, but very few grids passed the significance test (Figures 4C, D). Our results suggest that the high solar activity favors a NAO-like SLP anomaly in the winter season, which may lead to an El Niño Modoki-like SST anomaly in the following 1 year.
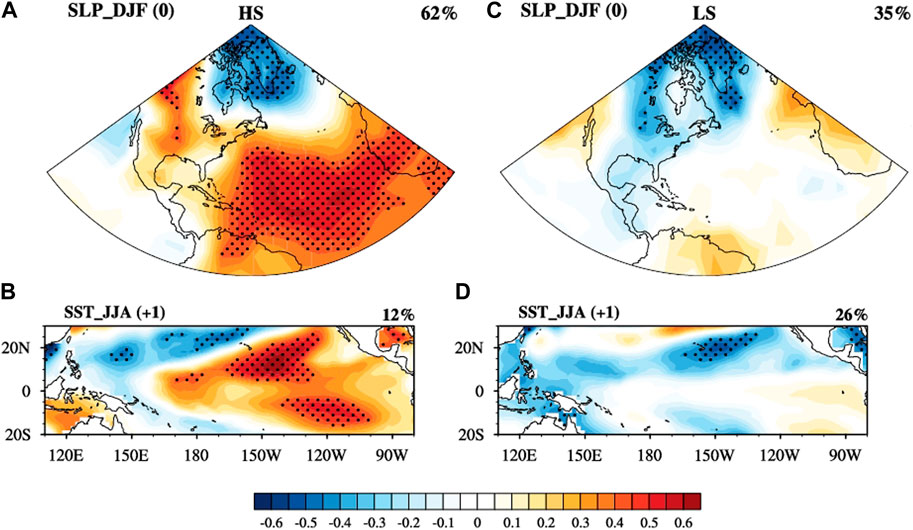
FIGURE 4. (A–D) Are the same as Figures 2C,D, but for the observed DJF-mean SLP and 1-year lagged JJA-mean SST anomalies in subsets of the high solar activity (HS, left column) and the low solar activity (LS, right column).
To investigate the possible physical processes responsible for this NAO- El Niño Modoki connection in the HS years, we performed a lagged regression of the DJF-mean SLP-svd time series on the SST, surface wind and precipitation rate anomalies in the subsequent seasons of the same year and the following 2 years. The NAO-associated circulation anomalies and SST anomalies in the HS subset sustain in both winter and spring. In addition, the lagged subtropical teleconnections exist in both the summer and the autumn (figures are not shown here). So, here we calculated 6-month averaged surface variables to better show the results. As shown in Figure 5A (color shading contours), in Dec–May (0) of the HS, a triple pattern of SST anomalies appears in the North Atlantic with negative SST anomalies in the north tropical Atlantic and the Labrador See, and a warm anomaly in the middle West Atlantic. This cold-warm-cold tripolar SST pattern is tightly related to the NAO-like SLP anomalies (Visbeck et al., 2001). Previous studies have revealed that solar signals can propagate down to the troposphere through a “polar route” (i.e., “top-down” mechanism) and lead to an AO/NAO-positive phase with westerly (easterly) wind anomalies centered at 60°N (30°N) in the solar-maximum years (Kuroda and Kodera, 1999; Kuroda and Kodera, 2004; Drews et al., 2022). These surface wind responses are confirmed in Figure 5A (vectors). An anomalous cyclone over the North Atlantic (north of 30°N) and an anticyclone anomaly over the northern tropical Atlantic (south of 30°N) can maintain the cold-warm-cold tripolar pattern of SST anomalies in winter and spring through a positive wind-evaporation-SST (WES) feedback (stippled regions in Figure 5A) (Xie and Philander, 1994). Negative SST anomalies in the NTA, together with the negative precipitation anomalies (stippled green in Figures 5A, B), induce suppressed convection in situ and a low-level anticyclonic flow to its west as a Gill-type Rossby wave response (around subtropical eastern Pacific and the west coast of North America and Mexico (70°W–120°W, 0–30°N)) in the subsequent seasons (vectors in Figures 5A–C). These anomalous flows maintain in the following 1 year (Figures 5C, D) and trigger an anomalous cyclone over the western tropical Pacific (west of the dateline; Figures 5C, D). In Jun–Nov (+1), the anomalous westerly winds over the western equatorial pacific (vectors in Figure 5D) reduce the local wind speed and surface-wind-induced evaporation, leading to positive SST anomalies in the central and eastern tropical Pacific (color shading contours in Figure 5D). The positive SST anomalies are maintained in the following year due to the WES feedback (Dec–May (+2) and Jun–Nov (+2) in Figures 5E, F).
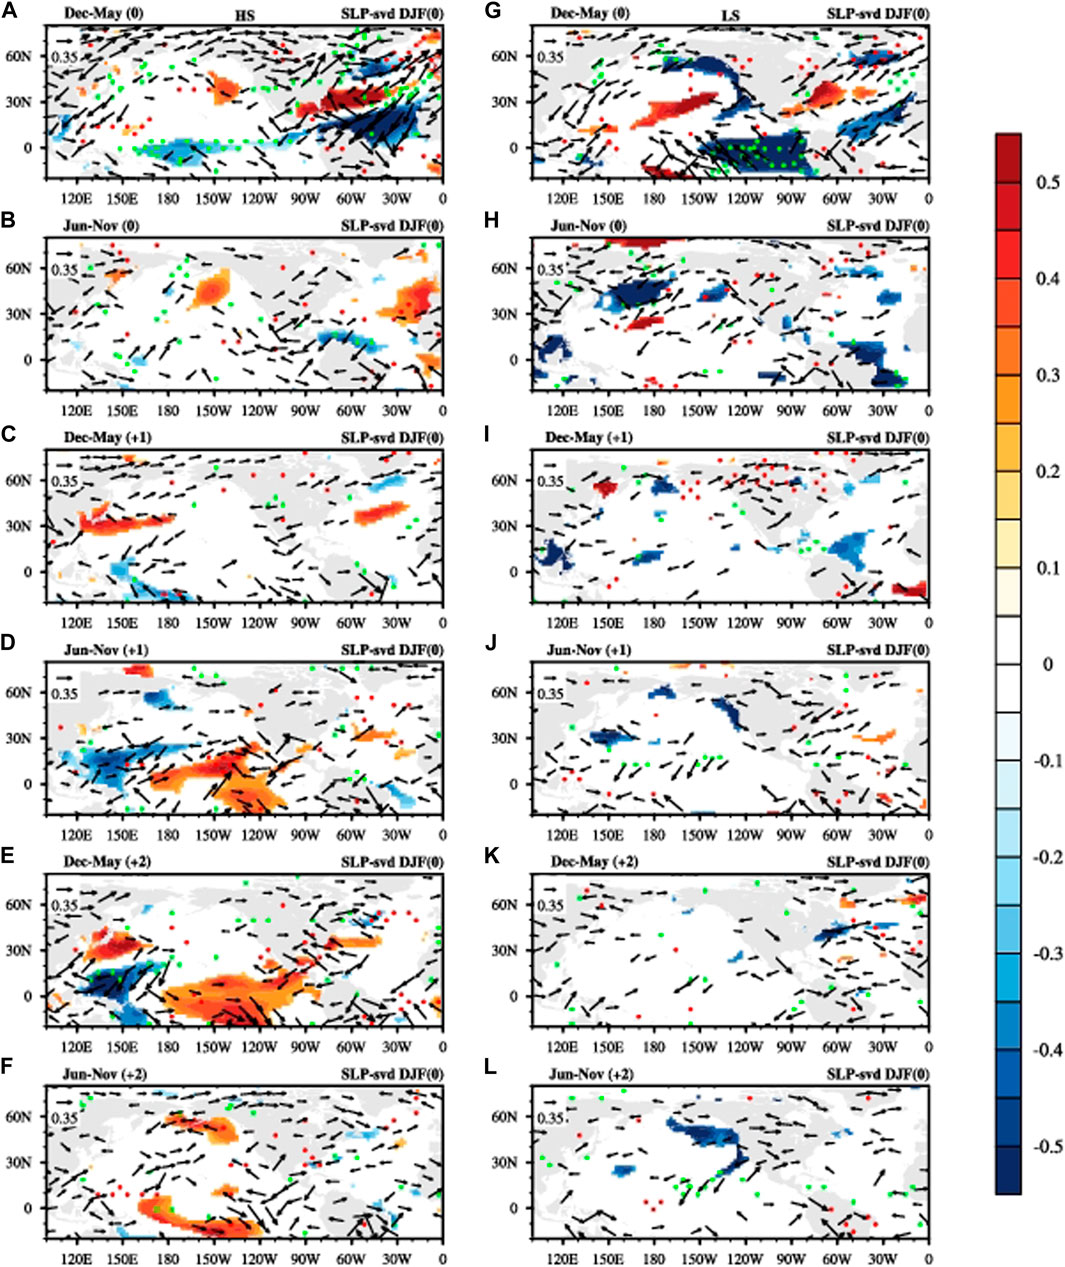
FIGURE 5. Left column: Lagged regression of the standardized SLP-svd time series onto the observed 6-month mean (December–May mean and June–November mean) SST anomalies (shading), surface wind anomalies (vectors), and precipitation rate anomalies (stippled red (positive) and green (negative)) in the same year (A,B), lagged 1 year (C,D) and lagged 2 years (E,F) in the HS subset. Right column: (G–L) is the same as (A–F), but for the LS subset. For all the variables, only the values above the 90% significance level are shown. Please notice, here we took December of last year as the beginning of the winter season of the current year.
For comparison, we performed the same regression analysis with the LS subset. In the Dec–May (0) of the solar-minimum years, the cyclone over the high latitude and the anticyclone over the subtropics are confined in the North Atlantic, these atmospheric anomalies are accompanied by relatively weaker SST anomalies in the North Atlantic (color shading contours in Figure 5G). Negative SST anomalies appear in the eastern equatorial Pacific, and the anomalous southeasterly winds across the equator provide positive feedback to the negative SST anomalies by more cold water upwelling and less local precipitation (Figure 5G). This eastern equatorial Pacific cooling disappears in the following 2 years and no El Niño Modoki-like warming shows up (Figures 5H–L). The above analysis suggests that the stronger wintertime NAO-like SLP anomalies over North America and the North Atlantic can trigger an El Niño Modoki-like warming in the tropical Pacific in the subsequent seasons under the HS condition. As the SLP-svd time series has a high positive correlation coefficient with the NAO index (r=0.73), it is not surprising that similar SST evolution maps can be achieved by regressions with the DJF-mean NAO index (as shown in Supplementary Figure S1). Therefore, the El Niño Modoki-like warming in the tropical Pacific response to the solar cycle forcing (Figure 1) could be partly due to the “atmosphere-to-ocean” forcing processes of the North Atlantic.
To further examine the role of the solar forcings in the above SLP-SST SVD mode, we performed the same SVD analysis on the DJF-mean SLP and the following JJA-mean SST anomalies for both the SOL and NOSOL experiments. As shown in Figure 6 (SOL) and Supplementary Figure S2 (NOSOL), the spatial patterns of the leading SVD modes of the SLP and SST anomalies in the SOL and NOSOL are quite similar, suggesting the simulated SLP-SST SVD mode is independent of the solar forcings. The simulated high-pressure zones of the SLP SVD modes locate further north in the North Atlantic (Figure 6C) than the observation (Figure 2C). The SST SVD modes resemble the EP El Niño for both the SOL and NOSOL experiments (Figure 6D; Supplementary Figure S2D). We separated the outputs of the SOL experiment into HS and LS two groups (as listed in Table 1) and performed the same SVD analysis as we did with the observation. Supplementary Figure S3A–D show the DJF-mean NAO-like SLP anomalies have a coupled covariance with the JJA-mean EP El Niño-like SST anomalies in the lagged 1 year for both the HS and LS. Therefore, the solar activity does not provide any superiority to the simulated SLP-SST SVD mode in the SOL experiment.
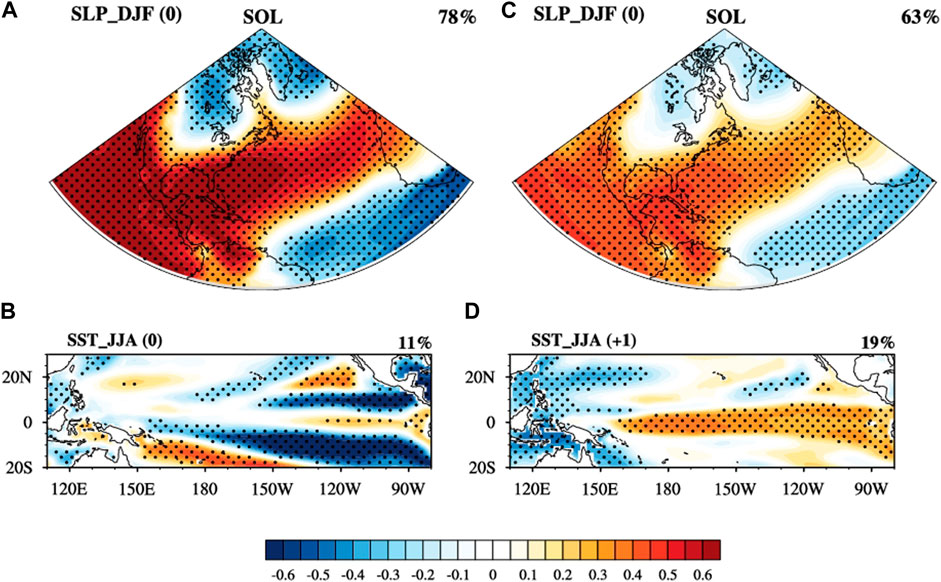
FIGURE 6. (A–D) are same as Figures 2A–D, but produced by using the simulated DJF-mean SLP and JJA-mean SST anomalies in the SOL experiment.
However, previous studies revealed a synchronization of the solar cycle and the quasi-decadal NAO variability (Thiéblemont et al., 2015) and a lagged warming response in the tropical Pacific by using the same experiments (Huo et al., 2023). As shown in Figure 7, the lagged correlation maps between the DJF-mean F10.7 index and the DJF-mean SLP anomalies of the SOL show an NAO-like pattern at the lag of 1 and 2 years (contours in Figure 7), which is absent in the NOSOL (contours in Supplementary Figure S4). A lagged warming response appears in the central equatorial Pacific at the lag of 3 and 4 years (color shading contours in Figure 7) and disappears in the NOSOL experiment (Supplementary Figure S4). Different from the observations, the above analysis based on the SOL experiment suggests that solar forcings have footprints in the North Atlantic and the tropical Pacific basins separately. Although the solar cycle can modulate the NAO temporal variability at quasi-decadal timescales via the solar-UV forced “top-down” mechanism in the SOL experiment (Thiéblemont et al., 2015), it cannot enhance the observed NAO-forced “atmosphere-to-ocean” processes to the tropical Pacific SST variability.
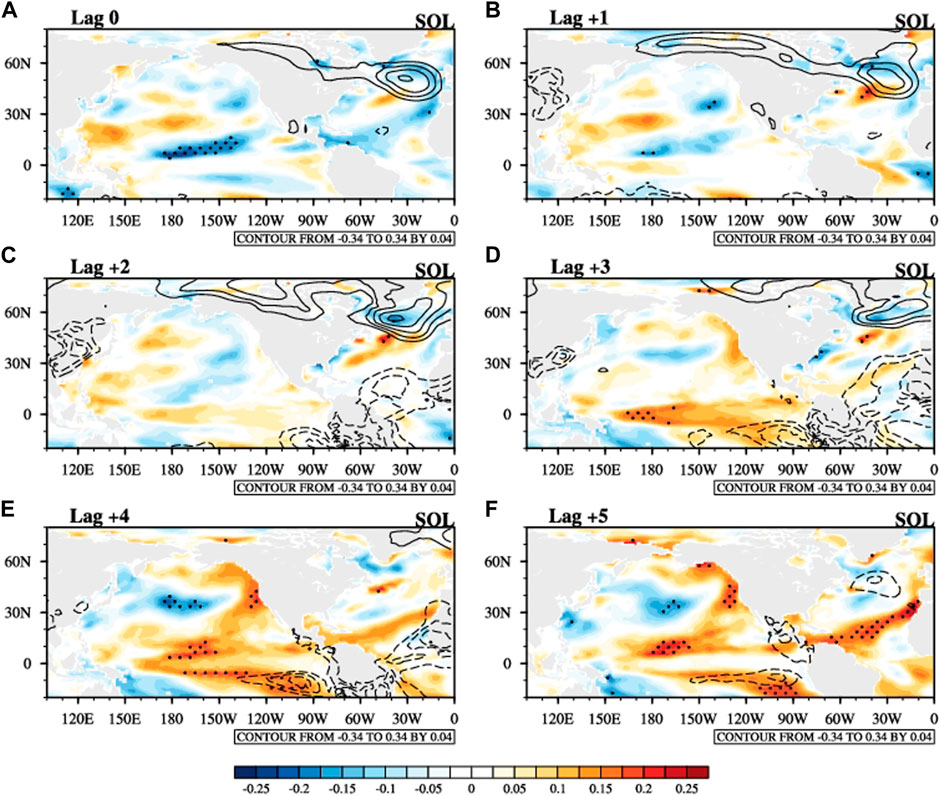
FIGURE 7. (A–F) Lagged correlation maps between the DJF-mean F10.7 index and the simulated DJF-mean SLP (contours) and JJA-mean SST (color shading contours) anomalies in the SOL experiment at the lag of 0–5 years. The black dotted regions of the color shading contours indicate above the 90% significance level. The contour interval for the SLP anomaly is 0.04 and only the values above the 90% confidence level are shown.
To discuss the possible reasons for this inconsistency between the observation and the SOL experiment, we regressed the F10.7 index and the SLP-svd time series to the SLP anomalies for the HS subset, as shown in Figure 8. For the observation (Figures 8A, B), the solar-forced footprints of SLP anomalies show a similar spatial pattern as the SVD leading mode in the HS years, which resemble the positive phase of AO. However, the positive SLP anomalies in the NTA only can be found in the F10.7 regression map in the SOL (Figure 8C), which does not show up in the leading SVD mode (Figure 8D). Besides, the regression maps based on the observational data suggest the enhanced solar forcings (high solar activity) can increase the negative SLP anomaly at the North Pole (Figures 8A, B), which shifts to the high latitude in the SOL experiment (Figure 8C). Therefore, the absence of solar effects on the simulated SLP-SST SVD mode might be due to the different locations of the active centers of the solar-related NAO-like pattern in the SOL. To further check this difference, we calculated the composite mean difference between solar maximum and minimum for the zonal mean air temperature and zonal mean zonal wind, as shown in Supplementary Figures S5, S6. Consistent with previous studies (Kodera and Kuroda, 2002; Matthes et al., 2006; Gray et al., 2009; Gray et al., 2010; Thiéblemont et al., 2015; Drews et al., 2022; Kuroda et al., 2022), both the SOL experiment and the ERA-Interim reanalysis (1979-2016) show significant warm responses in the upper stratosphere (above 7 hPa) and the lower tropical stratosphere (Supplementary Figures S5A, S6A). The warming responses in the tropical region could increase the meridional temperature gradient and lead to an anomalous westerly wind (Supplementary Figures S5B, S6B). Although the westerly wind anomalies in the stratosphere are much weaker in the experiment (Supplementary Figure S6B) than in the EAR-Interim (Supplementary Figure S5B), the westerly wind anomalies in the troposphere of the experiment are quite comparable to the ERA-Interim. However, compared to the observation, the anomalous easterly (westerly) winds in the north subtropics (mid-high latitude) shift a bit equatorward in the experiment (Supplementary Figures S5B, S6B). This difference in the solar-forced zonal wind anomalies is responsible for the different locations of the active centers of the solar-forced SLP anomalies (Figures 8A, C).
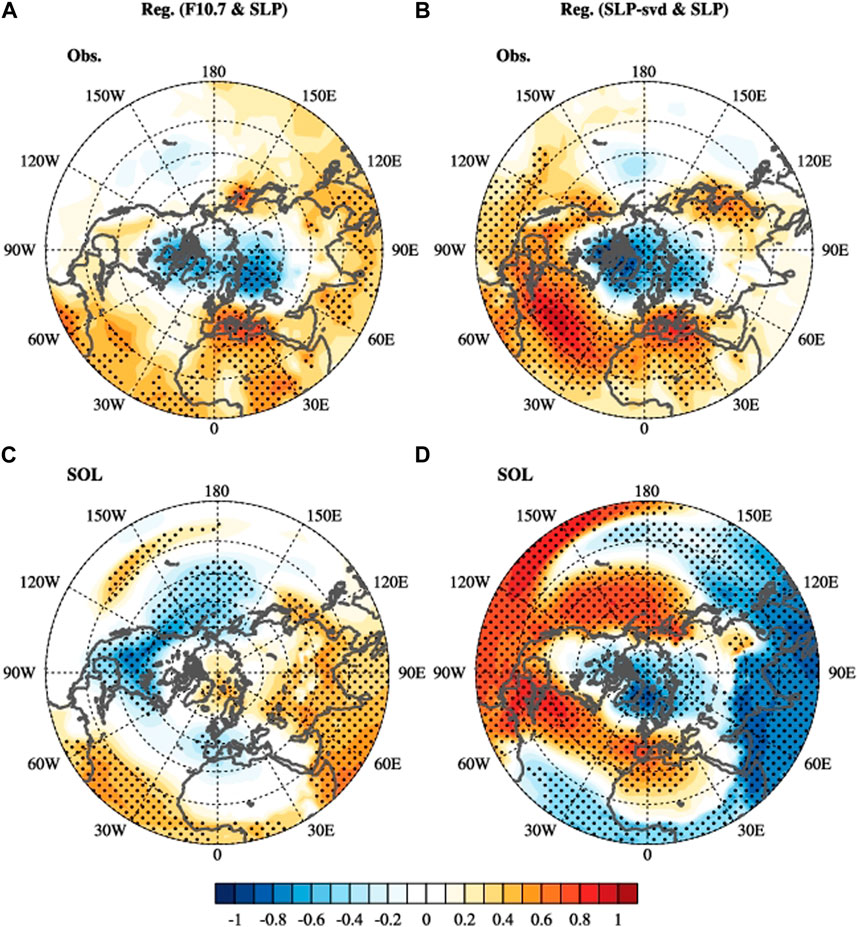
FIGURE 8. (A) Regression map of the DJF-mean F10.7 index onto the observed DJF-mean SLP anomalies in the HS subset. (B) Same as (A), but regressed by the standardized SLP-svd time series. (C,D) Are the same as the (A,B), but produced by using the DJF-mean F10.7 index and the simulated DJF-mean SLP anomalies in the SOL experiment. Stippled regions indicate statistical significance above the 90% level.
In this study, using the observational/reanalysis datasets and outputs of a pair of sensitivity experiments with and without solar cycle forcings, we investigate a possible linear co-variability between the NH wintertime SLP anomalies over North Atlantic and the following summer SST anomalies in the tropical Pacific by an SVD analysis. We found the DJF-mean NAO-like SLP anomalies have a “lead-lag” covariation with the El Niño Modoki-like SST anomalies in the tropical Pacific in the following 1 year in the observations. This NAO- El Niño Modoki connection only shows up in the HS years when the NAO and the related teleconnections are stronger and more persistent due to the stronger solar radiation. The high solar activity could enhance the “atmosphere-to-ocean” forcing processes from the North Atlantic atmosphere anomalies to the SST anomalies in the NTA and the tropical Pacific. Here we propose a possible indirect mechanism that the solar-UV forcing can modulate the tropical Pacific SST variability via its impacts on the mid-high latitude atmosphere anomalies. As summarized in Figure 9, the enhanced solar UV radiation in the solar-maximum years (Lag 0 years) increases the ozone production and tropical stratosphere temperature in boreal winter. This increases the poleward temperature gradient and leads to an anomalous westerly wind in the polar vortex region. These solar signals propagate down to the surface and lead to positive NAO-like SLP anomalies. This NAO-like SLP pattern sustaining in the winter and spring [DJFMAM (0)], is companied by an anomalous “cold-warm-cold” triple SST pattern. The negative SST anomalies and the less precipitation in the NTA lead to an anomalous anticyclone over the northeastern tropical Pacific in the subsequent seasons [JJASON (0)]. Anomalous cyclones appear over the eastern equatorial Pacific and the western tropical Pacific in the following 1 year as a Gill-type Rossby wave response (i.e., DJFMAM (+1) and JJASON (+1)). These anomalous flows reduce the trade winds in their south flanks and lead to positive SST anomalies in the tropical central Pacific [JJASON (+1)]. The positive SST anomalies sustain in the following year [i.e., DJFMAM (+2) and JJASON (+2)] due to the WES feedback.
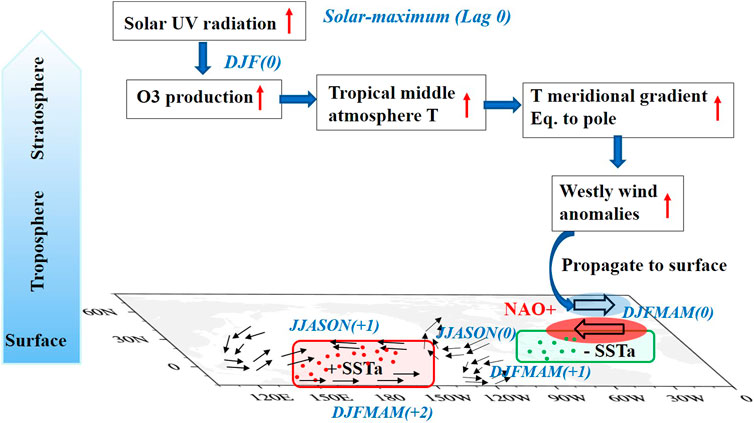
FIGURE 9. Schematic diagram representing the possible mechanism of the solar cycle modulation on the connection between DJF-mean NAO-like SLP anomalies and the followed El Niño Modoki-like SST anomalies.
However, when we performed the same SVD analysis on the CESM-WACCM modeling outputs of two sensitivity experiments with and without solar forcings (SOL and NOSOL), a similar SVD mode of the DJF-mean SLP and JJA-mean SST anomalies is found in these two experiments, but are different from the observations. The SLP SVD modes show a triple pattern in the North Atlantic with negative SLP anomalies in the Pole and the NTA, and positive SLP anomalies in the mid-latitude in both the SOL and NOSOL. They could have “lead-lag” covariations with the EP El Niño-like SST anomalies no matter whether the solar forcings are included or not. Although the impacts of the 11-year solar cycle are found in the North Atlantic and the tropical Pacific in the SOL, the responses seem to happen separately in these two basins. No solar effect can be found in the simulated SLP-SST SVD mode in the HS subset of the SOL experiment. This may be due to the relative equatorward shifting of the solar-forced SLP anomalies in the SOL experiment compared to the observation. The locations of the active centers of the SLP anomalies response to the solar cycle highly relate to the “top-down” solar signals propagation. Therefore, although all the solar forcings are included in the SOL, compared to observations, the CESM-WACCM still underestimated the impact of the solar forcings on the tropical Pacific climate variability due to the absence of the possible “atmosphere-to-ocean” forcings and less ocean feedback in the North Atlantic (Thiéblemont et al., 2015; Drews et al., 2022). Here, we have to notice that the observation, as well as the SOL experiment, includes only 1-member, possible aliasing of the internal variability and the solar signals cannot totally rule out. Further analysis based on large ensemble simulations will be done in near future.
The raw data supporting the conclusion of this article will be made available by the authors, without undue reservation.
WH did the analysis, produced all the figures, and wrote the manuscript. ZX and LZ assisted with the interpretation of the results and review of the manuscript.
This study is supported by a project from the Natural Science Foundation of China (42075040).
We would like to thank Katja Matthes and Rémi Thiéblemon who performed the two model simulations based on CESM-WACCM and thank all the contributors to the development of the CESM and WACCM. We thank Katja Matthes and the reviewers for the very helpful suggestions.
The authors declare that the research was conducted in the absence of any commercial or financial relationships that could be construed as a potential conflict of interest.
All claims expressed in this article are solely those of the authors and do not necessarily represent those of their affiliated organizations, or those of the publisher, the editors and the reviewers. Any product that may be evaluated in this article, or claim that may be made by its manufacturer, is not guaranteed or endorsed by the publisher.
The Supplementary Material for this article can be found online at: https://www.frontiersin.org/articles/10.3389/feart.2023.1147582/full#supplementary-material
SUPPLEMENTARY FIGURE S1 | Same as Figure 5, but regressed by the standardized time series of the DJF-mean NAO index.
SUPPLEMENTARY FIGURE S2 | Same as Figure 6, but for the NOSOL experiment.
SUPPLEMENTARY FIGURE S3 | Same as Figure 4, but using the data from the SOL experiment.
SUPPLEMENTARY FIGURE S4 | Same as Figure 7, but for the NOSOL experiment.
SUPPLEMENTARY FIGURE S5 | Solar cycle response in zonal mean temperatures (left) and zonal mean zonal wind (right) in Dec-Jan-Feb mean based on ERA-Interim (1979-2016). Latitude-height cross sections from 30°S to 90°N and 1000 hPa to 1 hPa of solar-cycle-based composite differences (in K) at lag 0. Significance levels are indicated by black dots (90%) based on a 1000-fold bootstrapping test.
SUPPLEMENTARY FIGURE S6 | Same as Supplementary Figure S5, but for the composite difference between the SOL and NOSOL experiments.
Allan, R., and Ansell, T. (2006). A new globally complete monthly historical gridded mean sea level pressure dataset (HadSLP2): 1850–2004. J. Clim. 19, 5816–5842. doi:10.1175/JCLI3937.1
Andrews, M. B., Knight, J. R., and Gray, L. J. (2015). A simulated lagged response of the North Atlantic Oscillation to the solar cycle over the period 1960–2009. Environ. Res. Lett. 10, 054022. doi:10.1088/1748-9326/10/5/054022
Ashok, K., Behera, S. K., Bao, S. A., Weng, H., and Yamagata, T. (2007). El Niño Modoki and its possible teleconnection. J. Geophys. Res. Oceans. 112, C11007. doi:10.1029/2006JC003798
Bretherton, C. S., Smith, C., and Wallace, J. M. (1992). An intercomparison of methods for finding coupled patterns in climate data. J. Clim. 5, 541–560. doi:10.1175/1520-0442(1992)005<0541:AIOMFF>2.0.CO;2
Camp, C. D., and Tung, K.-K. (2007). Surface warming by the solar cycle as revealed by the composite mean difference projection. Geophys. Res. Lett. 34, L14703. doi:10.1029/2007GL030207
Chen, S., Chen, W., Yu, B., and Li, Z. (2022). Impact of internal climate variability on the relationship between spring northern tropical atlantic SST anomalies and succedent winter ENSO: The role of the North pacific oscillation. J. Clim. 35, 537–559. doi:10.1175/JCLI-D-21-0505.1
Chen, S., Chen, W., and Yu, B. (2018). Modulation of the relationship between spring AO and the subsequent winter ENSO by the preceding November AO. Sci. Rep. 8, 6943. doi:10.1038/s41598-018-25303-0
Chen, S., Chen, W., and Yu, B. (2017). The influence of boreal spring Arctic Oscillation on the subsequent winter ENSO in CMIP5 models. Clim. Dyn. 48, 2949–2965. doi:10.1007/s00382-016-3243-z
Chen, S. F., and Wu, R. G. (2017). An enhanced influence of sea surface temperature in the tropical northern Atlantic on the following winter ENSO since the early 1980s. Atmos. Ocean. Sci. Lett. 10, 175–182. doi:10.1080/16742834.2016.1259542
Chen, X., and Wallace, J. M. (2015). ENSO-like variability: 1900–2013. J. Clim. 28, 9623–9641. doi:10.1175/JCLI-D-15-0322.1
Dee, D. P., Uppala, S. M., Simmons, A. J., Berrisford, P., Poli, P., Kobayashi, S., et al. (2011). The ERA-interim reanalysis: Configuration and performance of the data assimilation system. Q.J.R. Meteorol. Soc. 137, 553–597. doi:10.1002/qj.828
Diaconis, P., and Efron, B. (1983). Computer intensive methods in statistics. Sci. Amer. 248, 116–130. doi:10.1038/scientificamerican0583-116
Ding, R., Li, J., Tseng, Y., Sun, C., and Zheng, F. (2017). Linking a sea level pressure anomaly dipole over North America to the central Pacific El Niño. Clim. Dyn. 49, 1321–1339. doi:10.1007/s00382-016-3389-8
Ding, R., Nnamchi, H. C., Yu, J. Y., Li, T., Sun, C., Li, J., et al. (2023). North Atlantic oscillation controls multidecadal changes in the North Tropical Atlantic−Pacific connection. Nat. Commun. 14, 862. doi:10.1038/s41467-023-36564-3
Drews, A., Huo, W., Matthes, K., Kodera, K., and Kruschke, T. (2022). The Sun's role in decadal climate predictability in the North Atlantic. Atmos. Chem. Phys. 22, 7893–7904. doi:10.5194/acp-22-7893-2022
Gray, L. J., Beer, J., Geller, M., Haigh, J. D., Lockwood, M., Matthes, K., et al. (2010). Solar influences on climate. Rev. Geophys. 48, RG4001. doi:10.1029/2009RG000282
Gray, L. J., Rumbold, S. T., and Shine, K. P. (2009). Stratospheric temperature and radiative forcing response to 11-year solar cycle changes in irradiance and ozone. J. Atmos. Sci. 66, 2402–2417. doi:10.1175/2009JAS2866.1
Gray, L. J., Scaife, A. A., Mitchell, D. M., Osprey, S., Ineson, S., Hardiman, S., et al. (2013). A lagged response to the 11-year solar cycle in observed winter Atlantic/European weather patterns. J. Geophys. Res. 118 (13), 13405–13420. doi:10.1002/2013JD020062
Gray, L. J., Wollings, T. J., Andrews, M., and Knight, J. (2016). Eleven-year solar cycle signal in the NAO and Atlantic/European blocking. Quart. J. Roy. Meteor. Soc. 142, 1890–1903. doi:10.1002/qj.2782
Haam, E., and Tung, K. K. (2012). Statistics of solar cycle–La Niña connection: Correlation of two autocorrelated time series. J. Atmos. Sci. 69 (10), 2934–2939. doi:10.1175/jas-d-12-0101.1
Ham, Y. G., Kug, J. S., Park, J. Y., and Jin, F. F. (2013b). Sea surface temperature in the north tropical Atlantic as a trigger for El Niño/Southern Oscillation events. Nat. Geosci. 6, 112–116. doi:10.1038/ngeo1686
Ham, Y. G., Kug, J. S., and Park, J. Y. (2013a). Two distinct roles of atlantic SSTs in ENSO variability: North tropical atlantic SST and atlantic Niño. Geophys. Res. Lett. 40, 4012–4017. doi:10.1002/grl.50729
Ham, Y. G., and Kug, J. S. (2015). Role of north tropical atlantic SST on the ENSO simulated using CMIP3 and CMIP5 models. Clim. Dyn. 45, 3103–3117. doi:10.1007/s00382-015-2527-z
He, W.-B., and Ma, J. (2021). Interaction between the tropical atlantic and pacific oceans on an interannual time scale. Atmos.-Ocean. 59 (4–5), 285–298. doi:10.1080/07055900.2021.2014300
Hua, W., Dai, A., and Qin, M. (2018). Contributions of internal variability and external forcing to the recent pacific decadal variations. Geophys. Res. Lett. 45, 7084–7092. doi:10.1029/2018GL079033
Huang, B., Thorne, P. W., Banzon, V. F., Boyer, T., Chepurin, G., Lawrimore, J. H., et al. (2017). Extended reconstructed sea surface temperature, version 5 (ERSSTv5): Upgrades, validations, and intercomparisons. J. Clim. 30, 8179–8205. doi:10.1175/JCLI-D-16-0836.1
Huo, W. J., and Xiao, Z. N. (2017). Modulations of solar activity on El Niño Modoki and possible mechanisms. J. Atmos. Sol.-Terr. Phys. 160, 34–47. doi:10.1016/j.jastp.2017.05.008
Huo, W. J., Xiao, Z. N., and Zhao, L. (2021). Lagged responses of the tropical pacific to the 11-yr solar cycle forcing and possible mechanisms. J. Meteor. Res. 35 (3), 444–459. doi:10.1007/s13351-021-0137-8
Huo, W. J., Xiao, Z. N., and Zhao, L. (2023). Phase-locked impact of the 11-year solar cycle on tropical pacific decadal variability. J. Clim. 36 (2), 421–439. doi:10.1175/JCLI-D-21-0595.1
Huth, R., Bochníček, J., and Hejda, P. (2007). The 11-year solar cycle affects the intensity and annularity of the Arctic Oscillation. J. Atmos. Sol.-Terr. Phys. 69, 1095–1109. doi:10.1016/j.jastp.2007.03.006
Jiang, L., and Li, T. (2021). Impacts of tropical North Atlantic and equatorial atlantic SST anomalies on ENSO. J. Clim. 34, 1–58. doi:10.1175/JCLI-D-20-0835.1
Karnauskas, K. B. (2014). Arctic forcing of decadal variability in the tropical Pacific Ocean in a high-resolution global coupled GCM. Clim. Dyn. 42, 3375–3388. doi:10.1007/s00382-013-1836-3
Kirtman, B., Power, S. B., Adedoyin, J. A., Boer, G. J., Bojariu, R., Camilloni, I., et al. (2013). “Near-term climate change: Projections and predictability,” in Climate change 2013: The physical science basis. Contribution of working group I to the fifth assessment report of the intergovernmental panel on climate change. Editors T. F. Stocker, D. Qin, G.-K. Plattner, M. Tignor, S. K. Allen, J. Boschunget al. (Cambridge, United Kingdom and New York, NY, USA: Cambridge University Press), 953–1028.
Kodera, K., and Kuroda, Y. (2005). A possible mechanism of solar modulation of the spatial structure of the North Atlantic Oscillation. J. Geophys. Res. 110, D02111. doi:10.1029/2004JD005258
Kodera, K., and Kuroda, Y. (2002). Dynamical response to the solar cycle: Winter stratopause and lower stratosphere. J. Geophys. Res. 107 (24), 4749. doi:10.1029/2002JD002224
Kodera, K. (2002). Solar cycle modulation of the North atlantic oscillation: Implication in the spatial structure of the NAO. Geophys. Res. Lett. 29 (8), 59. doi:10.1029/2001GL014557
Kodera, K. (2003). Solar influence on the spatial structure of the NAO during the winter 1900-1999. Geophys. Res. Lett. 30 (4), 2002GL016584. doi:10.1029/2002GL016584
Kodera, K., Thieblemont, R., Yukimoto, S., and Matthes, K. (2016). How can we understand the global distribution of the solar cycle signal on the Earth’s surface? Atmos. Chem. Phys. 16, 12925–12944. doi:10.5194/acp-16-12925-2016
Kuroda, Y., and Kodera, K. (1999). Role of planetary waves in the stratosphere-troposphere coupled variability in the northern hemisphere winter. Geophys. Res. Lett. 26, 2375–2378. doi:10.1029/1999GL900507
Kuroda, Y., and Kodera, K. (2004). Role of the polar-night jet oscillation on the formation of the arctic oscillation in the northern hemisphere winter. J. Geophys. Res. 109, D11112. doi:10.1029/2003JD004123
Kuroda, Y., Kodera, K., Yoshida, K., Yukimoto, S., and Gray, L. (2022). Influence of the solar cycle on the North atlantic oscillation. J. Geophys. Res. Atmos. 127, e2021JD035519. doi:10.1029/2021JD035519
Li, S., Wu, L., Yang, Y., Geng, T., CaiGan, W. B., et al. (2020). The Pacific Decadal Oscillation less predictable under greenhouse warming. Nat. Clim. Chang. 10, 30–34. doi:10.1038/s41558-019-0663-x
Li, X., Xie, S. P., Gille, S. T., and Yoo, C. (2016). Atlantic-induced pan-tropical climate change over the past three decades. Nat. Clim. Change 6, 275–279. doi:10.1038/nclimate2840
Liguori, G., and Di Lorenzo, E. (2018). Meridional modes and increasing pacific decadal variability under anthropogenic forcing. Geophys. Res. Lett. 45, 983–991. doi:10.1002/2017GL076548
Marsh, D. R., Mills, M. J., Kinnison, D. E., Lamarque, J., Calvo, N., and Polvani, L. M. (2013). Climate change from 1850 to 2005 simulated in CESM1 (WACCM). J. Clim. 26, 7372–7391. doi:10.1175/JCLI-D-12-00558.1
Martín-Rey, M., Rodríguez-Fonseca, B., and Polo, I. (2015). Atlantic opportunities for ENSO prediction. Geophys. Res. Lett. 42, 6802–6810. doi:10.1002/2015GL065062
Matthes, K., Funke, B., Andersson, M. E., Barnard, L., Beer, J., Charbonneau, P., et al. (2017). Solar forcing for CMIP6 (v3.2). Geosci. Model Dev. 10, 2247–2302. doi:10.5194/gmd-10-2247-2017
Matthes, K., Kuroda, Y., Kodera, K., and Langematz, U. (2006). Transfer of the solar signal from the stratosphere to the troposphere: Northern winter. J. Geophys. Res. 111, D06108. doi:10.1029/2005JD006283
Matthes, K., Marsh, D. R., Garcia, R. R., Kinnison, D. E., Sassi, F., and Walters, S. (2010). Role of the QBO in modulating the influence of the 11-year solar cycle on the atmosphere using constant forcings. J. Geophys. Res. 115, D18110. doi:10.1029/2009JD013020
McGregor, S., Timmermann, A., Stuecker, M., England, M., MerrifieldJin, M. F.-F., et al. (2014). Recent Walker circulation strengthening and Pacific cooling amplified by Atlantic warming. Nat. Clim. Change 4, 888–892. doi:10.1038/nclimate2330
Meehl, G. A., and Arblaster, J. M. (2009). A lagged warm event-like response to peaks in solar forcing in the Pacific region. J. Clim. 22 (13), 3647–3660. doi:10.1175/2009JCLI2619.1
Meehl, G. A., Arblaster, J. M., Matthes, K., Sassi, F., and van Loon, H. (2009). Amplifying the Pacific climate system response to a small 11-year solar cycle forcing. Sci 325, 1114–1118. doi:10.1126/science.1172872
Meehl, G. A., Hu, A., Castruccio, F., England, M., Bates, S., Danabasoglu, G., et al. (2021). Atlantic and Pacific tropics connected by mutually interactive decadal-timescale processes. Nat. Geosci. 14, 36–42. doi:10.1038/s41561-020-00669-x
Misios, S., Gray, L. J., Knudsen, M. F., Karoff, C., Schmidt, H., and Haigh, J. D. (2019). Slowdown of the Walker circulation at solar cycle maximum. Proc. Natl. Acad. Sci. 116, 7186–7191. doi:10.1073/pnas.1815060116
Misios, S., Mitchell, D. M., Gray, L. J., Tourpali, K., Matthes, K., Hood, L., et al. (2016). Solar signals in CMIP-5 simulations: Effects of atmosphere-ocean coupling. Q. J. R. Meteorol. Soc. 142, 928–941. doi:10.1002/qj.2695
Park, J. H., Li, T., Yeh, S. W., and Kim, H. (2019). Effect of recent Atlantic warming in strengthening Atlantic–Pacific teleconnection on interannual timescale via enhanced connection with the Pacific meridional mode. Clim. Dyn. 53, 371–387. doi:10.1007/s00382-018-4591-7
Ren, S.-M., Zhang, S.-Q., Lu, L., Jiang, Y-J., and Ma, Y.-W. (2021). Impact of tropical Atlantic warming on the Pacific Walker circulation with numerical experiments of CGCM. Adv. Clim. Chang. Res. 12 (6), 757–771. doi:10.1016/j.accre.2021.09.012
Roy, I., and Haigh, J. D. (2012). Solar cycle signals in the pacific and the issue of timings. J. Atmos. Sci. 69 (4), 1446–1451. doi:10.1175/jas-d-11-0277.1
Scaife, A. A., Ineson, S., Knight, J. R., Gray, L., Kodera, K., and Smith, D. M. (2013). A mechanism for lagged North Atlantic climate response to solar variability. Geophys. Res. Lett. 40 (2), 434–439. doi:10.1002/grl.50099
Sullivan, A., Luo, J., Hirst, A. C., Bi, D., Cai, W., and He, J. (2016). Robust contribution of decadal anomalies to the frequency of central-Pacific El Niño. Sci. Rep. 6, 38540. doi:10.1038/srep38540
Thiéblemont, R., Matthes, K., Omrani, N.-E., Kodera, K., and Hansen, F. (2015). Solar forcing synchronizes decadal North Atlantic climate variability. Nat. Commun. 6, 8268. doi:10.1038/ncomms9268
Tourpali, K., Schuurmans, C. J. E., van Dorland, R., Steil, B., Brühl, C., and Manzini, E. (2005). Solar cycle modulation of the Arctic Oscillation in a chemistry-climate model. Geophys. Res. Lett. 32, L17803. doi:10.1029/2005GL023509
Van Loon, H., Meehl, G. A., and Shea, D. J. (2007). Coupled air-sea response to solar forcing in the Pacific region during northern winter. J. Geophys. Res. 112, D02108. doi:10.1029/2006JD007378
Visbeck, M. H., Hurrell, J. W., Polvani, L., and Cullen, H. M. (2001). The North atlantic oscillation: Past, present, and future. Proc. Natl. Acad. Sci. 98 (23), 12876–12877. doi:10.1073/pnas.231391598
Wang, C., Kucharski, F., Barimalala, R., and Bracco, A. (2009). Teleconnections of the tropical atlantic to the tropical Indian and pacific oceans: A review of recent findings. Meteorol. Z. 18 (4), 445–454. doi:10.1127/0941-2948/2009/0394
Wang, L., Yu, J. Y., and Paek, H. (2017). Enhanced biennial variability in the Pacific due to Atlantic capacitor effect. Nat. Commun. 8, 14887. doi:10.1038/ncomms14887
Wang, W., Matthes, K., Tian, W., Park, W., Shang, M., and Ding, A. (2018). Solar impacts on decadal variability of tropopause temperature and lower stratospheric (LS) water vapour: A mechanism through ocean-atmosphere coupling. Clim. Dyn. 52 (9), 5585–5604. doi:10.1007/s00382-018-4464-0
Wang, Y.-M., Lean, J. L., and Sheeley, N. R. (2005). Modeling the Sun’s magnetic field and irradiance since 1713. Astrophys. J. 625, 522–538. doi:10.1086/429689
White, W. B., and Liu, Z. Y. (2008). Resonant excitation of the quasi-decadal oscillation by the 11-year signal in the Sun’s irradiance. J. Geophys. Res. 113, C01002. doi:10.1029/2006JC004057
White, W., Lean, J., Cayan, D., and Dettinger, M. (1997). Response of global upper ocean temperature to changing solar irradiance. J. Geophys. Res. 102, 3255–3266. doi:10.1029/96JC03549
Wu, Q. (2010). Forcing of tropical SST anomalies by wintertime AO-like variability. J. Clim. 23 (10), 2465–2472. doi:10.1175/2009JCLI2749.1
Xiao, Z., Liao, Y., and Li, C. (2016). Possible impact of solar activity on the convection dipole over the tropical Pacific Ocean. J. Atmos. Sol.-Terr. Phys. 140, 94–107. doi:10.1016/j.jastp.2016.02.008
Xie, S., Okumura, Y., Miyama, T., and Timmermann, A. (2008). Influences of Atlantic climate change on the tropical Pacific via the central American isthmus. J. Clim. 21 (15), 3914–3928. doi:10.1175/2008JCLI2231.1
Xie, S. P., and Philander, S. G. H. (1994). A coupled ocean-atmosphere model of relevance to the ITCZ in the eastern Pacific. Tellus, Ser. A 46, 340–350. doi:10.1034/j.1600-0870.1994.t01-1-00001.x
Yukimoto, S., Kodera, K., and Thiéblemont, R. (2017). Delayed North Atlantic response to solar forcing of the stratospheric polar vortex. SOLA 13, 53–58. doi:10.2151/sola.2017-010
Zheng, Y., Chen, S., Chen, W., and Yu, B. (2021). Diverse influences of spring arctic oscillation on the following winter El niño–southern oscillation in CMIP5 models. Clim. Dyn. 56, 275–297. doi:10.1007/s00382-020-05483-0
Keywords: solar activity, North Atlantic Oscillation, tropical Pacific, El Niño Modoki, decadal variability
Citation: Huo W, Xiao Z and Zhao L (2023) Modulation of the solar activity on the connection between the NAO and the tropical pacific SST variability. Front. Earth Sci. 11:1147582. doi: 10.3389/feart.2023.1147582
Received: 18 January 2023; Accepted: 07 March 2023;
Published: 15 March 2023.
Edited by:
Shangfeng Chen, Institute of Atmospheric Physics (CAS), ChinaReviewed by:
Gang Zeng, Nanjing University of Information Science and Technology, ChinaCopyright © 2023 Huo, Xiao and Zhao. This is an open-access article distributed under the terms of the Creative Commons Attribution License (CC BY). The use, distribution or reproduction in other forums is permitted, provided the original author(s) and the copyright owner(s) are credited and that the original publication in this journal is cited, in accordance with accepted academic practice. No use, distribution or reproduction is permitted which does not comply with these terms.
*Correspondence: Wenjuan Huo, d2h1b0BnZW9tYXIuZGU=
Disclaimer: All claims expressed in this article are solely those of the authors and do not necessarily represent those of their affiliated organizations, or those of the publisher, the editors and the reviewers. Any product that may be evaluated in this article or claim that may be made by its manufacturer is not guaranteed or endorsed by the publisher.
Research integrity at Frontiers

Learn more about the work of our research integrity team to safeguard the quality of each article we publish.